Article

S-Equol Protects Chondrocytes against Sodium Nitroprusside-Caused Matrix Loss and Apoptosis through Activating PI3K/Akt Pathway

1
Department of Medical Laboratory Science and Biotechnology, College of Health Sciences, Kaohsiung Medical University, Kaohsiung 80708, Taiwan
2
Department of Biochemistry, School of Medicine, College of Medicine, Kaohsiung Medical University, Kaohsiung 80708, Taiwan
3
Graduate Institute of Medicine, College of Medicine, Kaohsiung Medical University, Kaohsiung 80708, Taiwan
4
Department of Pharmacy, Kaohsiung Municipal Min-Sheng Hospital, Kaohsiung 80708, Taiwan
*
Author to whom correspondence should be addressed.
Int. J. Mol. Sci. 2021, 22(13), 7054; https://0-doi-org.brum.beds.ac.uk/10.3390/ijms22137054
Submission received: 26 May 2021 / Revised: 26 June 2021 / Accepted: 26 June 2021 / Published: 30 June 2021
(This article belongs to the Special Issue Flavonoids and Other Polyphenols in Health and Disease)

Abstract

:
Osteoarthritis (OA) is a common chronic disease with increasing prevalence in societies with more aging populations, therefore, it is causing more concern. S-Equol, a kind of isoflavones, was reported to be bioavailable and beneficial to humans in many aspects, such as improving menopausal symptoms, osteoporosis and prevention of cardiovascular disease. This study investigated the effects of S-Equol on OA progress in which rat primary chondrocytes were treated with sodium nitroprusside (SNP) to mimic OA progress with or without the co-addition of S-Equol for the evaluation of S-Equol’s efficacy on OA. Results showed treatment of 0.8 mM SNP caused cell death, and increased oxidative stress (NO and H2O2), apoptosis, and proteoglycan loss. Furthermore, the expressions of MMPs of MMP-2, MMP-3, MMP-9, and MMP-13 and p53 were increased. The addition of 30 μM S-Equol could lessen those caused by SNP. Moreover, S-Equol activates the PI3K/Akt pathway, which is an upstream regulation of p53 and NO production and is associated with apoptosis and matrix degradation. As a pretreatment of phosphoinositide 3-kinases (PI3K) inhibitor, all S-Equol protective functions against SNP decrease or disappear. In conclusion, through PI3K/Akt activation, S-Equol can protect chondrocytes against SNP-induced matrix degradation and apoptosis, which are commonly found in OA, suggesting S-Equol is a potential for OA prevention.

1. Introduction

Osteoarthritis (OA), is a highly prevalent rheumatic musculoskeletal disorder that affected 303 million people globally in 2017 [1]. Women over the age of 50 or those going through the menopause usually have inflammation, aging, or even dead chondrocytes due to estrogen deficiency resulting in OA and usually causing disability of the aged [2,3,4]. Chondrocytes are the most important cells of joints, even if they only account for about 5% of the total volume of cartilage tissue. They play the role of maintaining collagen and aggrecan synthesis of articular cartilage [5]. When chondrocytes become hypertrophic, they will age and trigger apoptosis and a series of cartilage extracellular matrix degradation and osteoarthritis [6]. Apoptotic chondrocytes are frequently found in cartilage lesions and recognized as a signal of OA [7].
To release or attenuate the OA-related symptoms become a big issue, and our recent studies have focused on how to attenuate OA progress by nutrient supplementation or by dietary food and concluded that some supplements and food may reduce OA-related unconformable symptoms [8,9,10]. Accumulating studies have exhibited that oxidative stress increases with estrogen deficiency [11], which is related to the pathophysiology of postmenopausal osteoarthritis [12]. In addition, nitric oxide (NO) and reactive oxygen species (ROS) have long been known to be key factors to mediate chondrocyte apoptosis [13]. Excessive NO and ROS may lead to irreversible mitochondrial membrane damage with low potential (ΔΨM), resulting in DNA damage and ultimately cell death [14]. However, current treatments for OA act only on symptoms, not on prevention or cure. The report showed that prevention or reduction in chondrocytes’ apoptosis would be a valid target for modulating cartilage degeneration [6].
The soy isoflavone-derived molecule Equol [7-hydroxy-3-(4′-hydroxyphenyl)-chroman] is a daidzein metabolite produced by intestinal microflora. Synthetic Equol exists as two enantiomers, (S)-(−)-Equol and (R)-(+)-Equol, both of which have selective affinity for estrogen receptors (ER) and modulate androgen action, but only S-Equol occurs naturally [15]. S-Equol is well known to have the strongest estrogen receptor binding capacity and has antioxidative activities among all soy isoflavones, such as Genistein, Daidzein, and Biochanin A. Furthermore, its binding capacity is almost equal to 17β-Estradiol [16,17,18]. Rationally, we propose that S-Equol has the potential to mend the symptoms or diseases caused by the deficiency of estrogen. Up to now, it is still unclear whether S-Equol may decrease OA progress or release its related symptoms. Therefore, this study was designed to test the possibility of S-Equol to serve as a protective agent against OA.
Sodium nitroprusside (SNP) is widely used as a donor for NO production in cell culture including articular chondrocytes [6,19,20]; moreover, SNP-treated chondrocytes are used as an in vitro model of OA [21,22,23]. We used the SNP-treated chondrocytes culture to investigate the effects of S-Equol on OA progress and the underline mechanisms.

2. Results

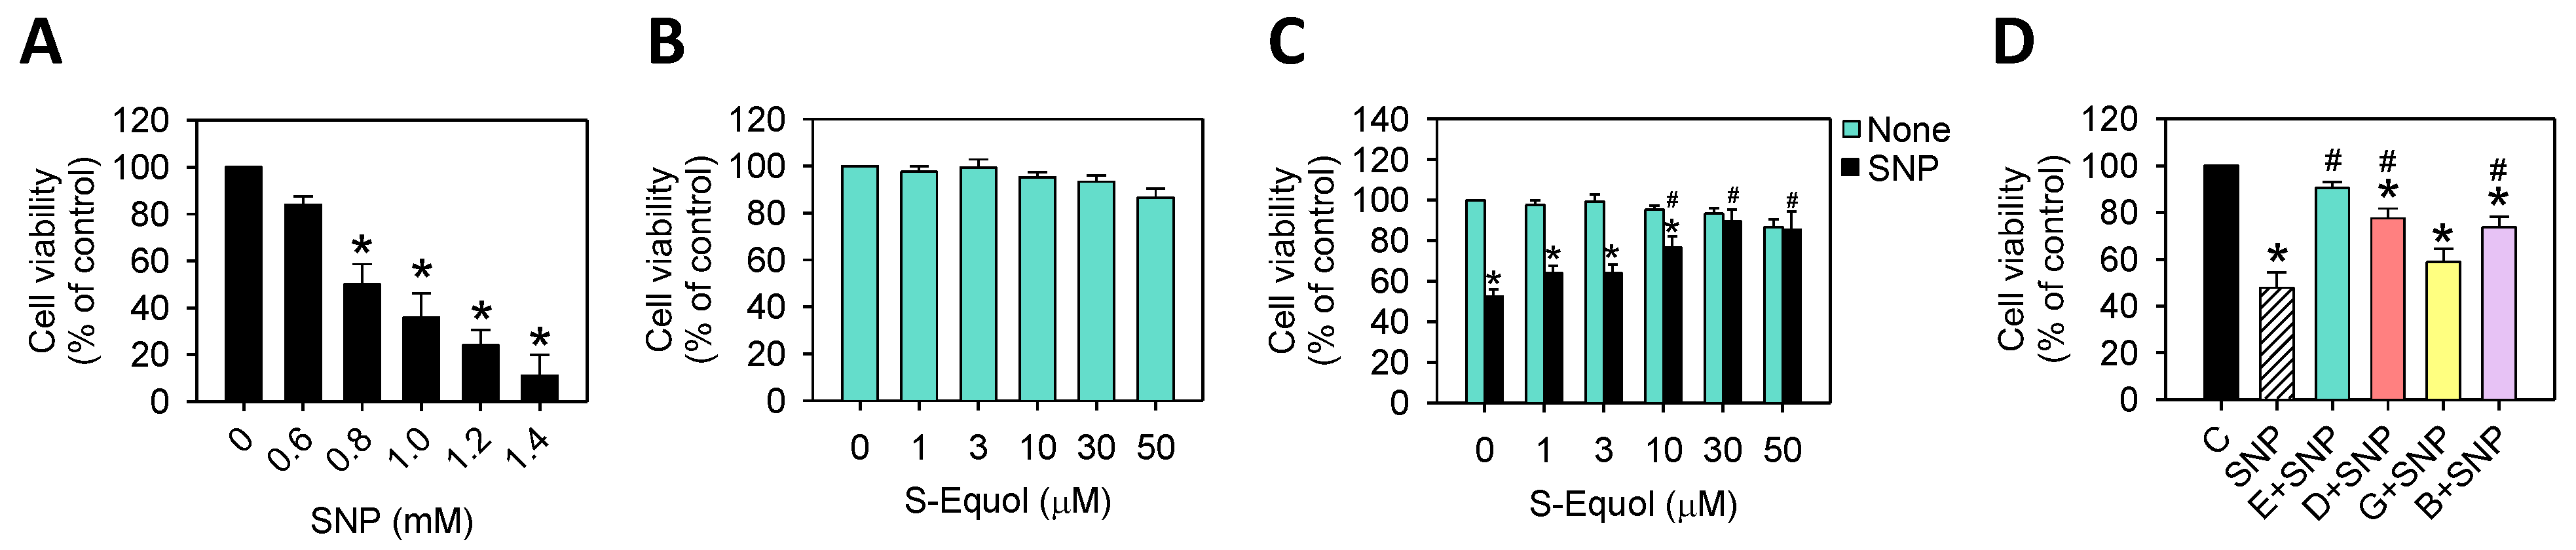
2.1. S-Equol Reduces SNP-Induced Cell Death

Firstly, we tested the cytotoxicity of SNP or S-Equol to rat primary chondrocytes. Cells were incubated for 24 h alone or in the presence of 0.6–1.4 mM SNP or 1–50 μM S-Equol and then the cell viability was determined. As Figure 1A shows, SNP induced cell death in a dose-dependent manner at the concentrations of 0.8–1.4 mM, whereas S-Equol showed almost no cytotoxicity (Figure 1B). We chose 0.8 mM SNP to mimic OA conditions for the following experiments because it caused 50% cell viability. As cotreatment with SNP and S-Equol, we observed that S-Equol could reduce SNP-caused cell death and 30 μM S-Equol reached the maximal effect (Figure 1C), thus, the concentration of 30 μM S-Equol was chosen for the following experiments. In addition, we compared the protective effects of S-Equol with other soy isoflavones of Daidzein, Genistein, and Biochanin A on SNP cytotoxicity. Figure 1D showed, at the same concentration of 30 μM isoflavones, S-Equol had the best protective effect among them all.

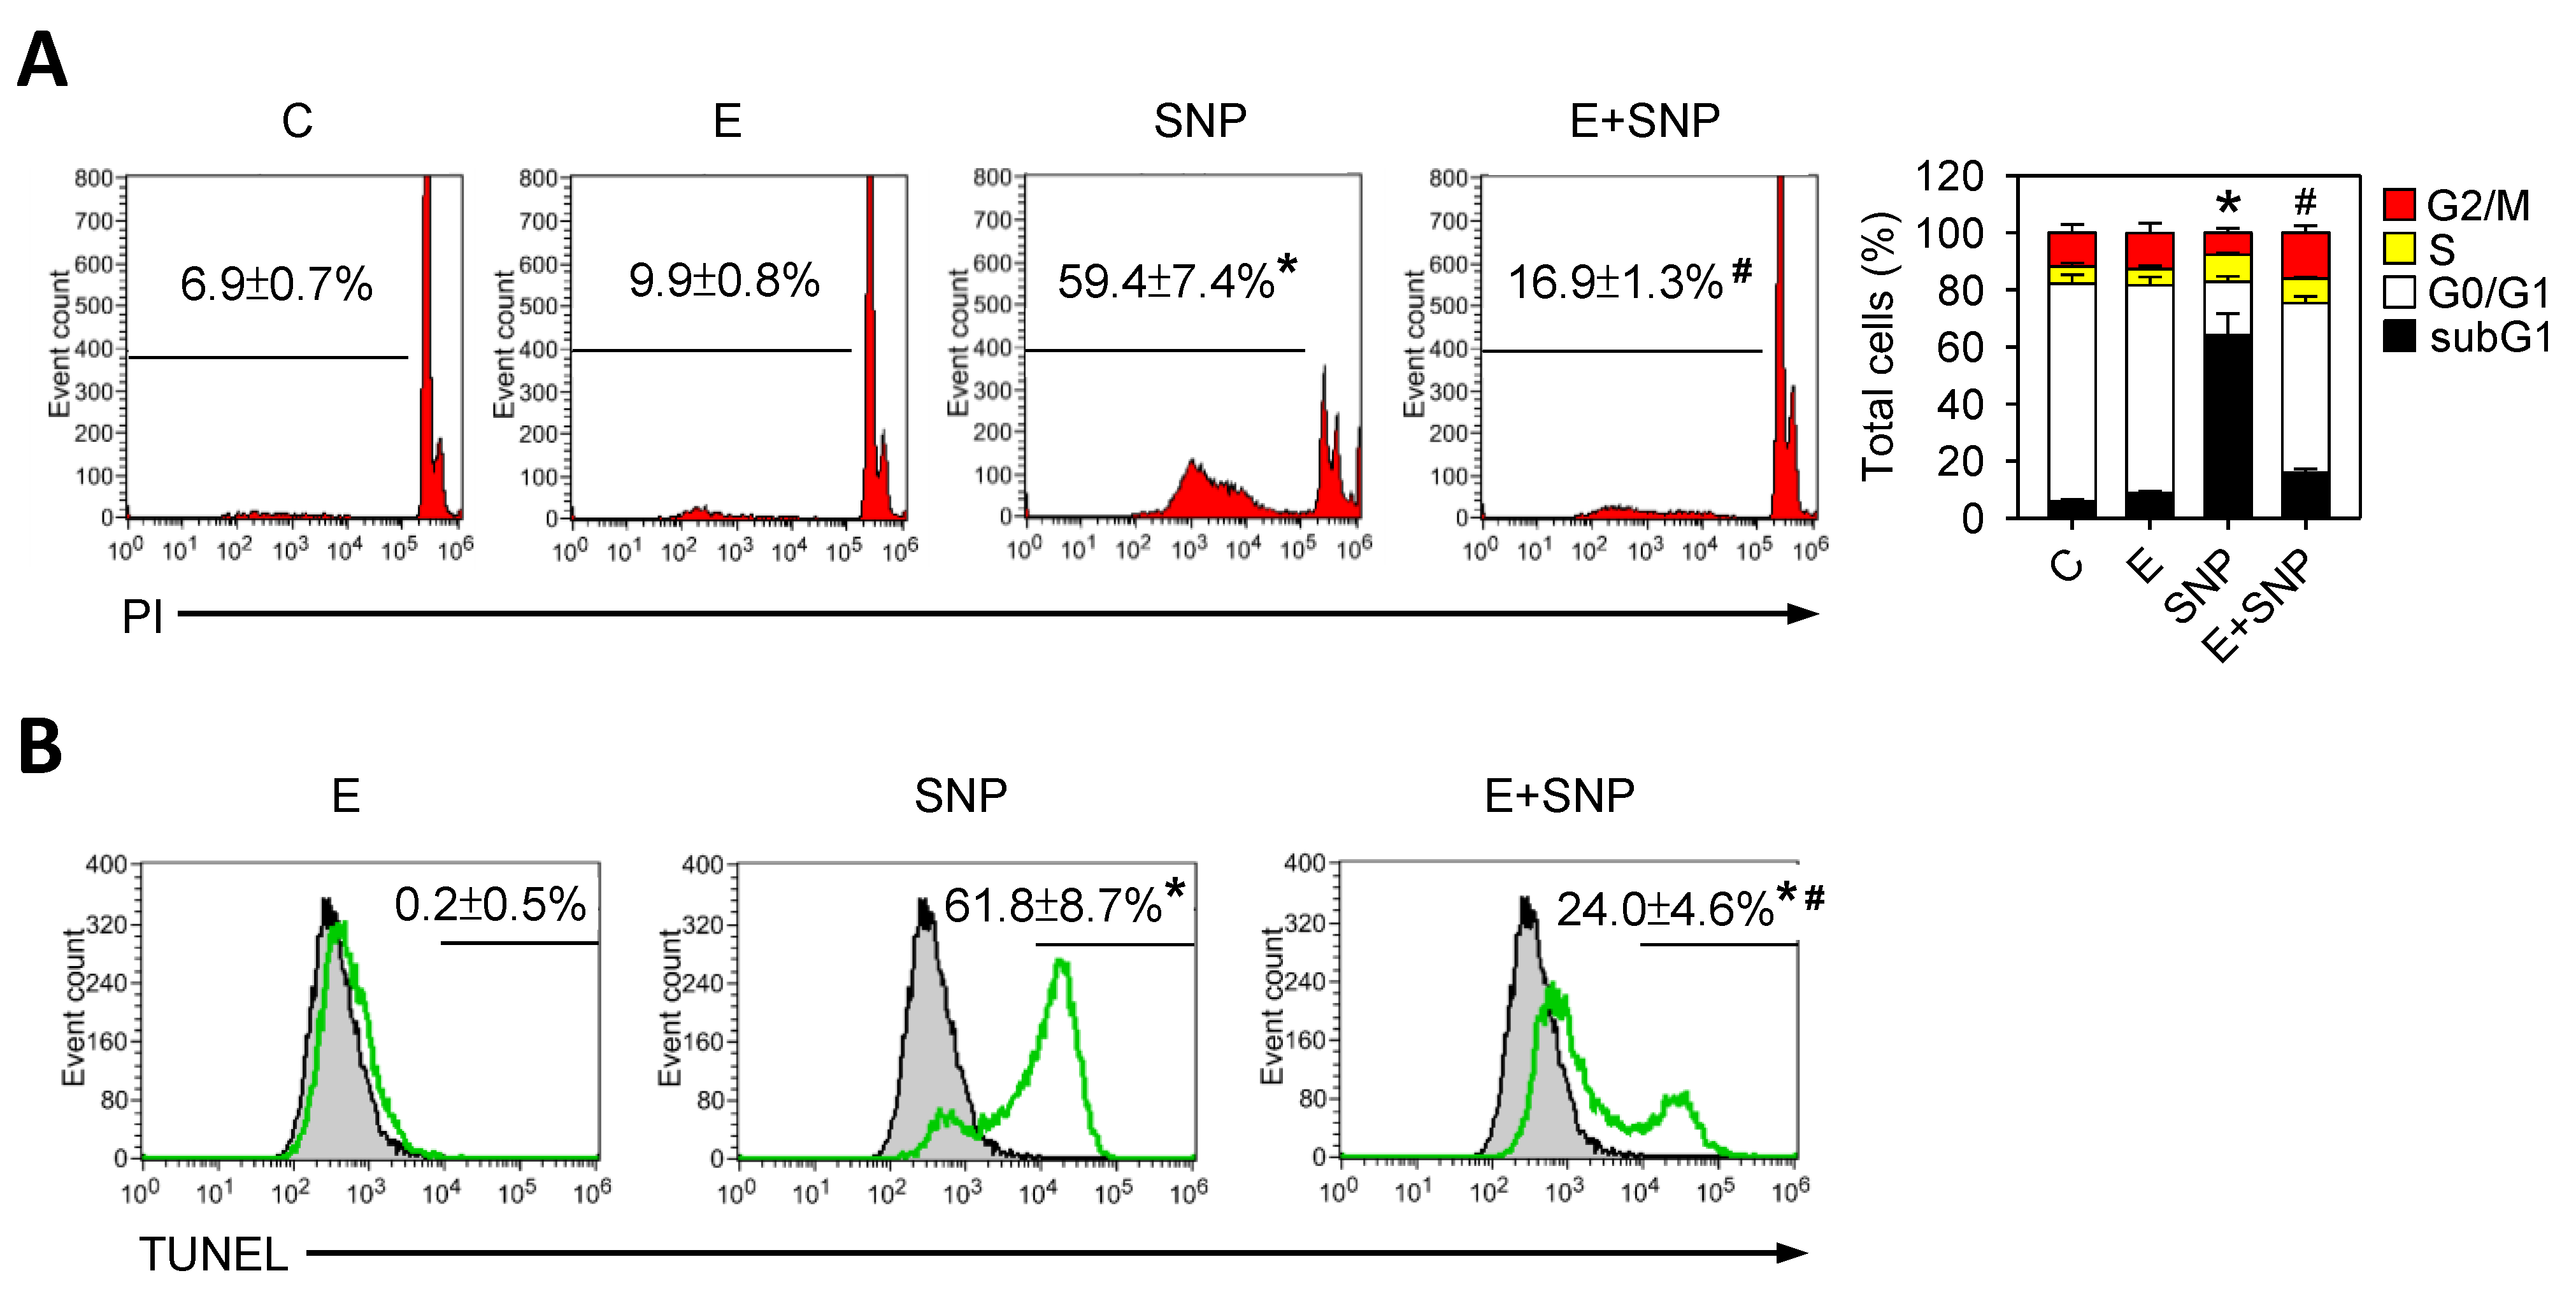
2.2. S-Equol Decreases SNP-Induced Apoptosis

After treatment with 0.8 mM SNP for 24 h in the presence or absence of 30 μM S-Equol, we found that the cell cycle distribution percentage was significantly changed by SNP, whereas the addition of S-Equol could inhibit this change (Figure 2A). Apparently, the subG1 phase distribution, recognized as apoptotic cells, was increased by SNP and that was significantly decreased as S-Equol presented (Figure 2A), indicating that S-Equol could attenuate the SNP-induced apoptosis. Similar results were found in the TUNEL staining apoptotic experiment (Figure 2B).

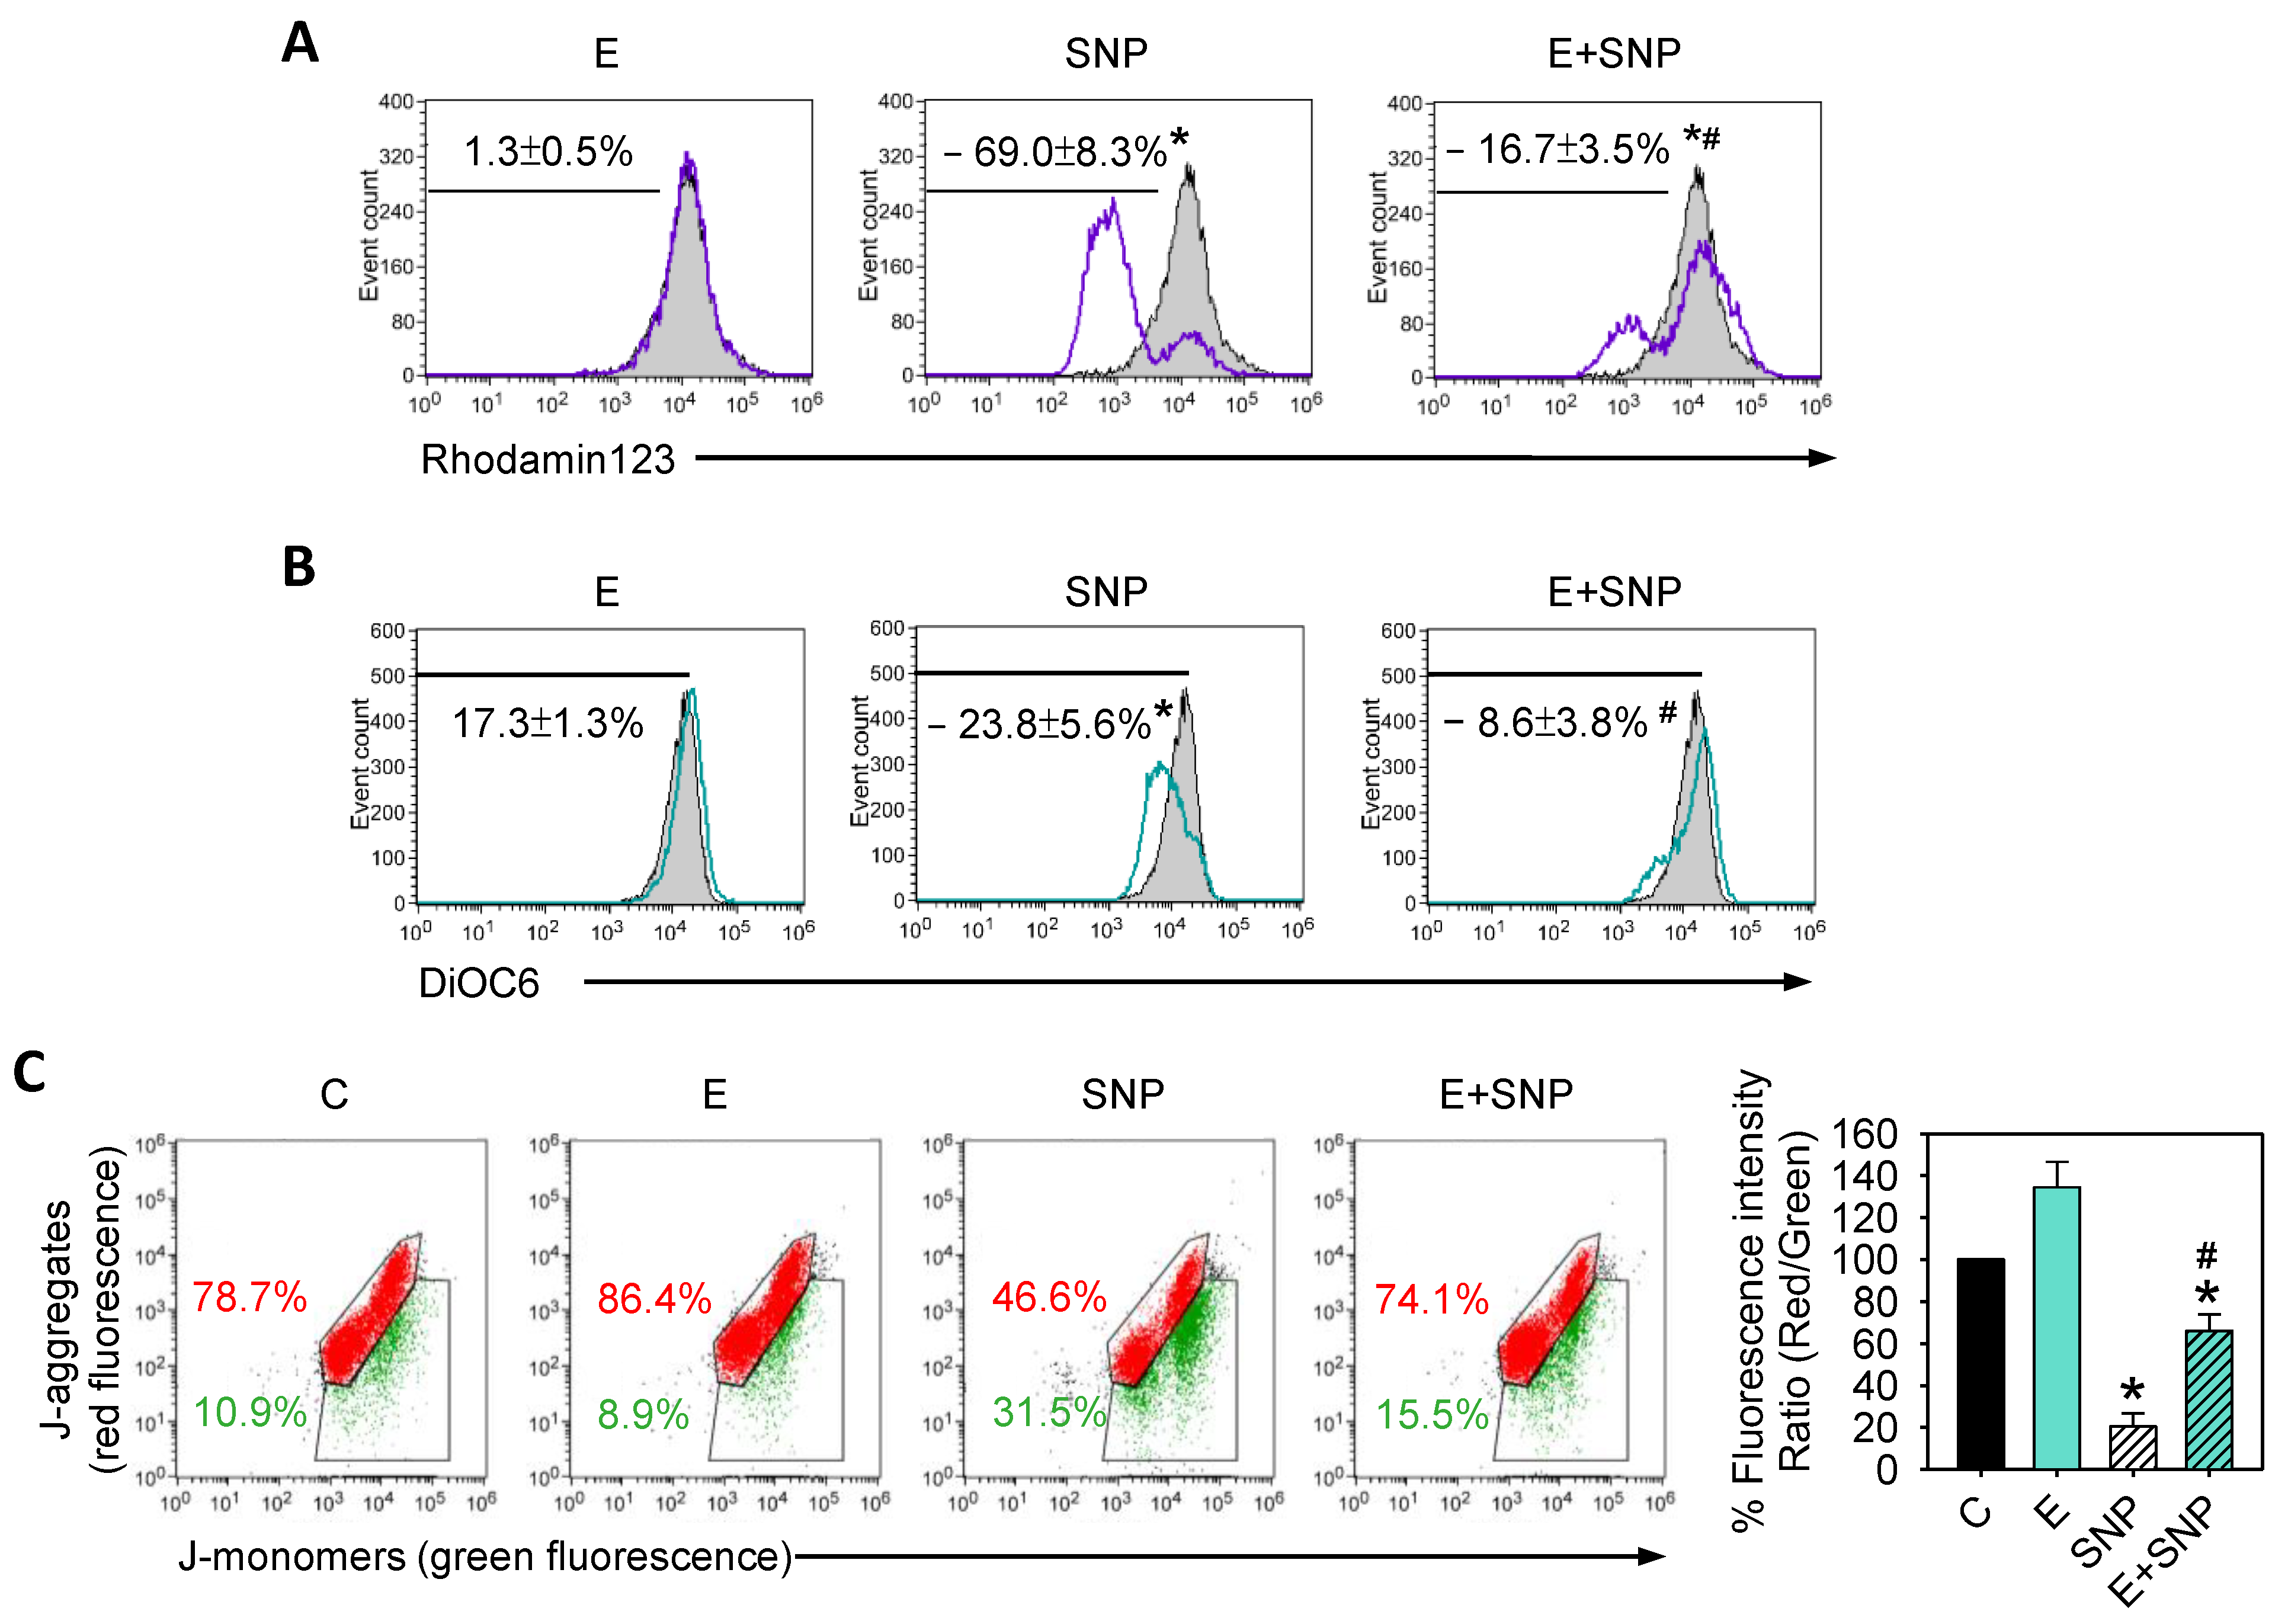
2.3. S-Equol Diminishes the SNP-Caused Decrease of Mitochondrial Membrane Potential (ΔΨM)

To determine whether SNP and/or S-Equol affected ΔΨM or not, primary chondrocytes were treated with 0.8 mM SNP and/or 30 μM S-Equol for 24 h, and then ΔΨM was measured. These three methods of ΔΨM measurement showed SNP would cause ΔΨM to decrease and S-Equol addition might diminish the decrease (Figure 3A–C). This suggests that S-Equol can lessen SNP-caused mitochondrial membrane damage.

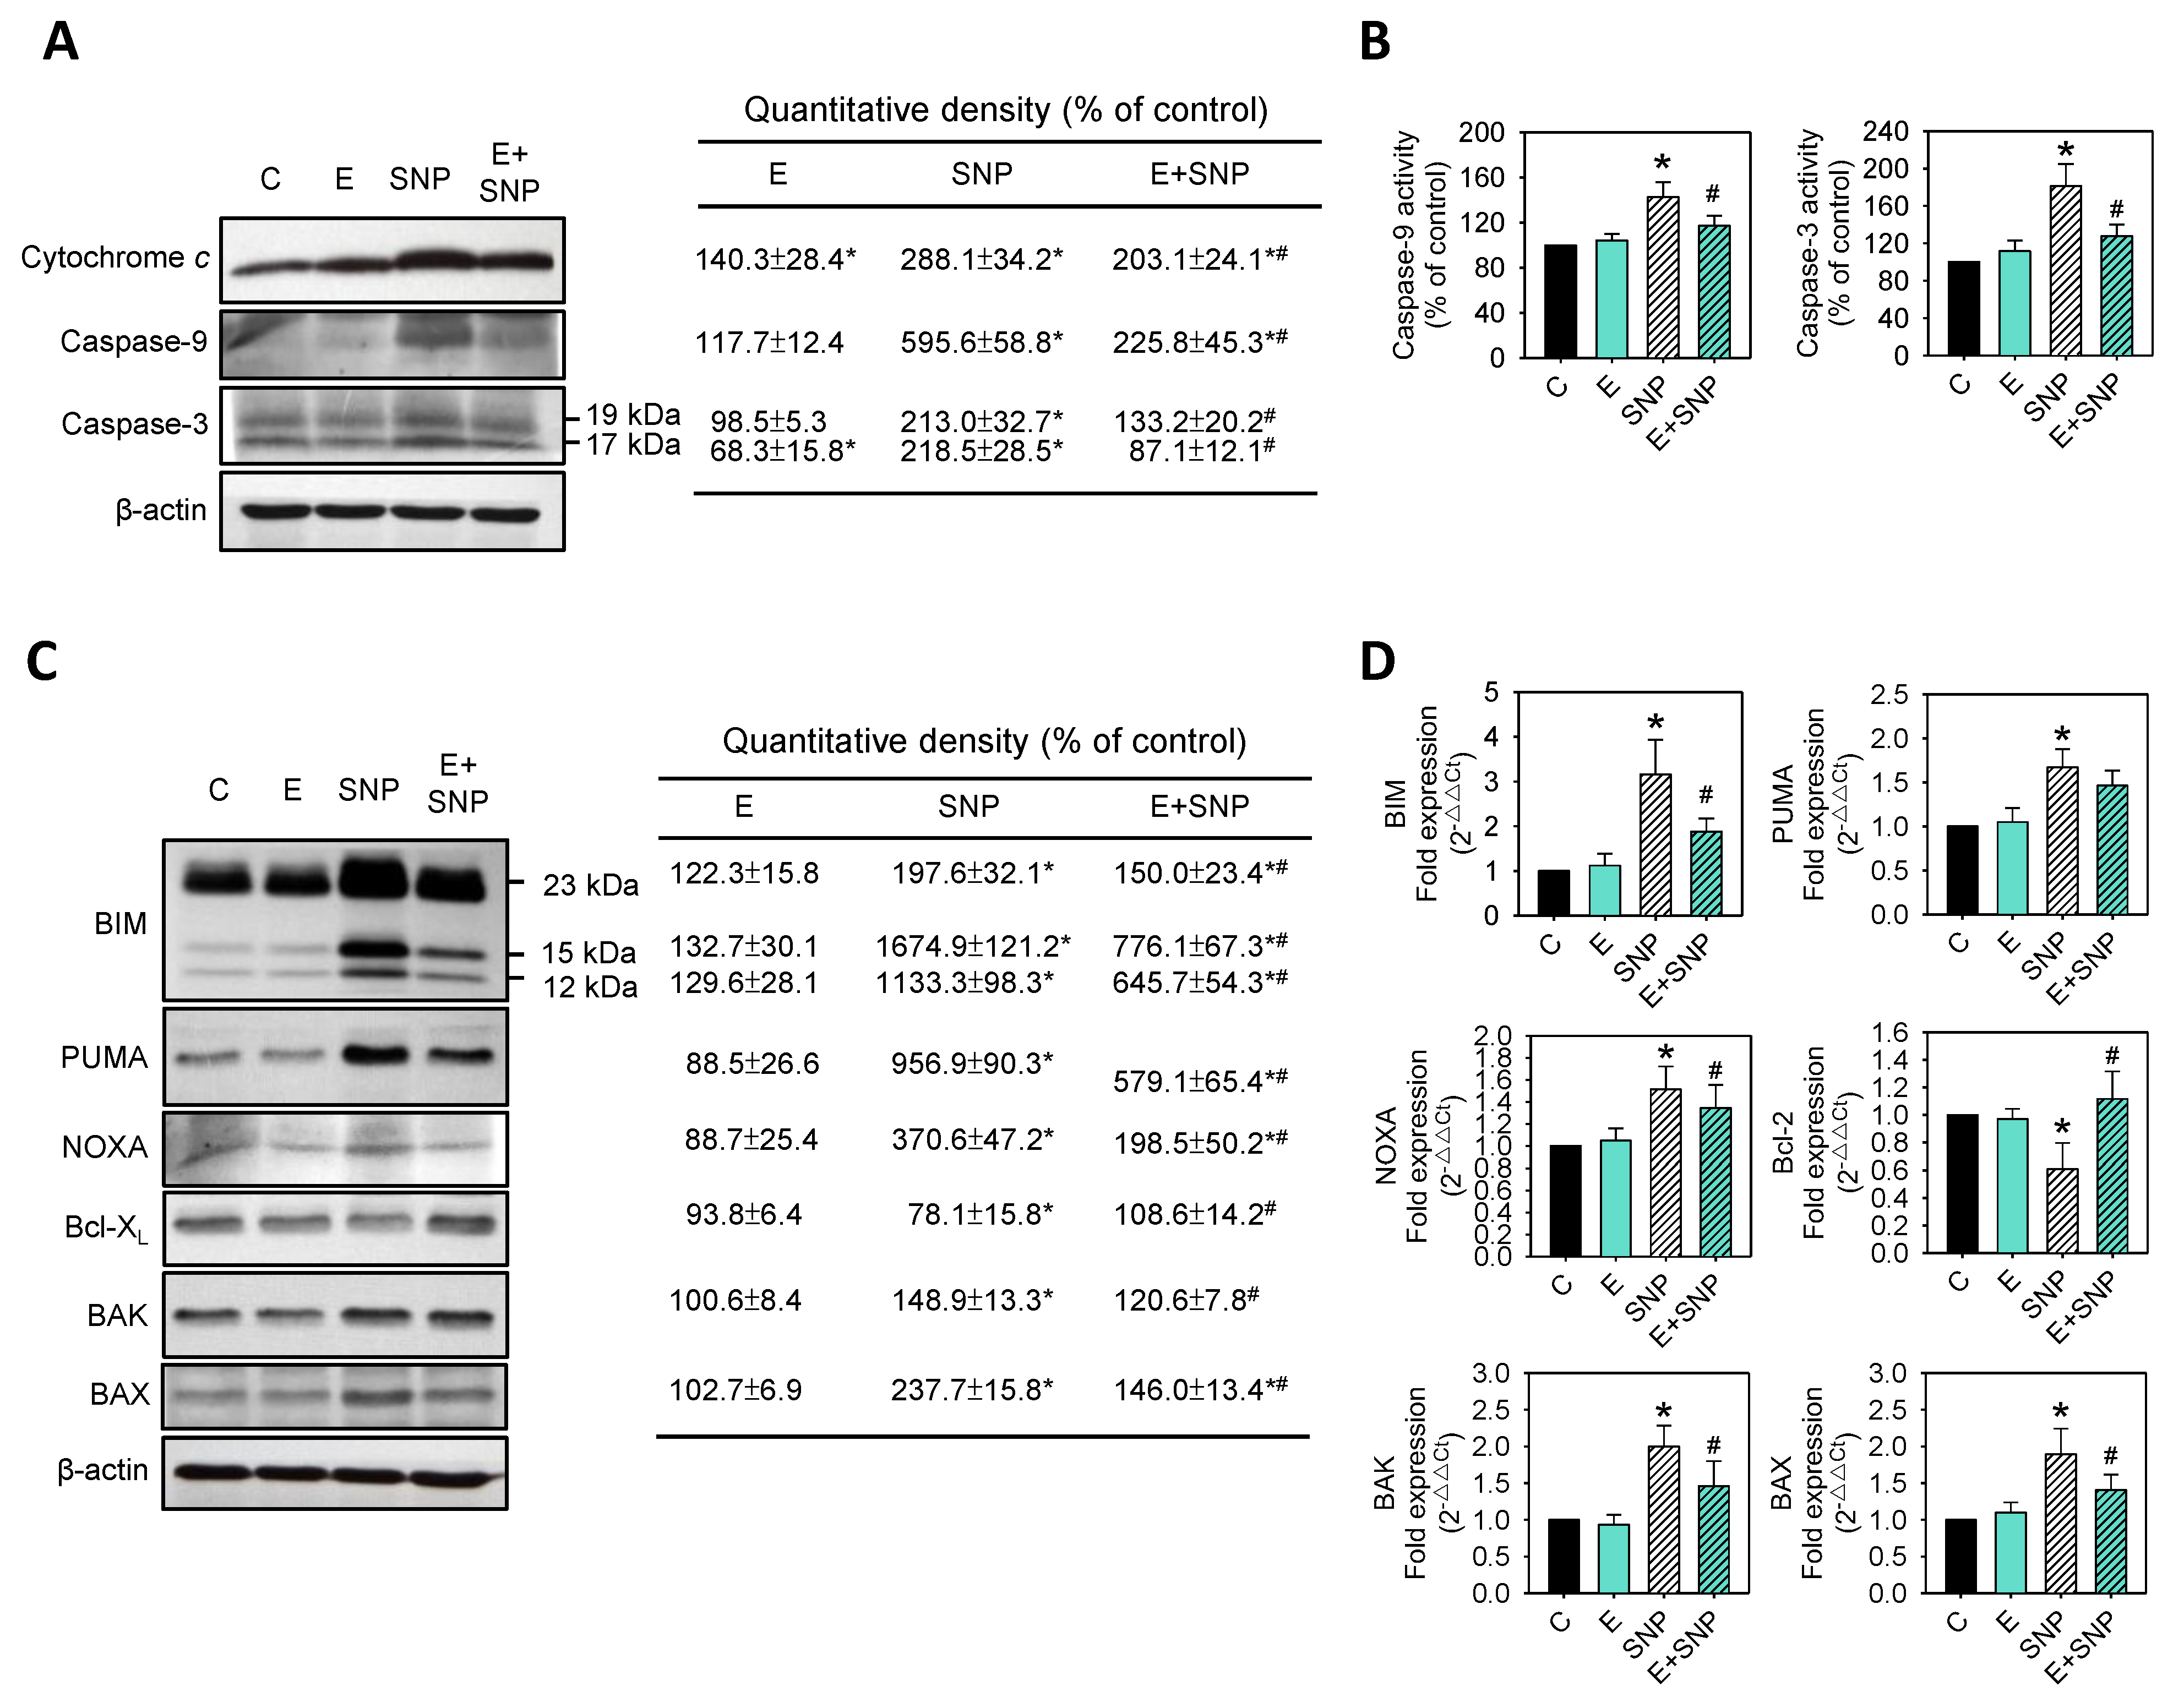
2.4. Effect of SNP/S-Equol on Apoptosis-Related Proteins Expressions

Reports showed a reduction in ΔΨM accompanied intrinsic apoptosis [24] in which the functional consequence of pro-apoptotic signaling is mitochondrial membrane perturbation and release of cytochrome c to the cytoplasm, where it forms a complex or apoptosome with apoptotic protease activating factor 1 (APAF1) and the inactive form of caspase-9. This complex hydrolyzes adenosine triphosphate to cleave and activate caspase-9. The initiator caspase-9 then cleaves and activates the executioner caspases-3. Caspase-3 promotes the typical apoptosis features, including DNA fragmentation and cell death [25]. Bcl-2 family proteins regulate the release of apoptogenic cytochrome c [26]. There is a wealth of experimental evidence that pro-apoptotic BH3-only members of the Bcl-2 protein family (BIM, PUMA, and NOXA) facilitate the apoptotic response by competitively binding to the anti-apoptotic Bcl-2 family members (Bcl-2 and Bcl-XL) and displacing them from the pro-apoptotic members, BAX and BAK [27]. BAX and BAK oligomerize to cause mitochondrial outer membrane permeabilization (MOMP), triggering release of cytochrome c, and the consequent activation of effector caspases.
The above pro-apoptotic and anti-apoptotic members were analyzed after SNP and/or S-Equol treatment for 24 h. Clearly, cytochrome c levels, and caspase-9 or caspase-3 levels and activities were increased by SNP and these increases were weakened by S-Equol addition (Figure 4A,B). Those were consistent with apoptosis (Figure 2) and mitochondrial membrane potential (Figure 3) results. Furthermore, SNP increased the gene and protein expression of pro-apoptotic BIM, PUMA, NOXA, BAX, BAK, and decreased anti-apoptotic proteins expressions of Bcl-XL and Bcl-2 (Figure 4C,D). Similar to the above findings, S-Equol addition could lessen all the SNP-caused effects.

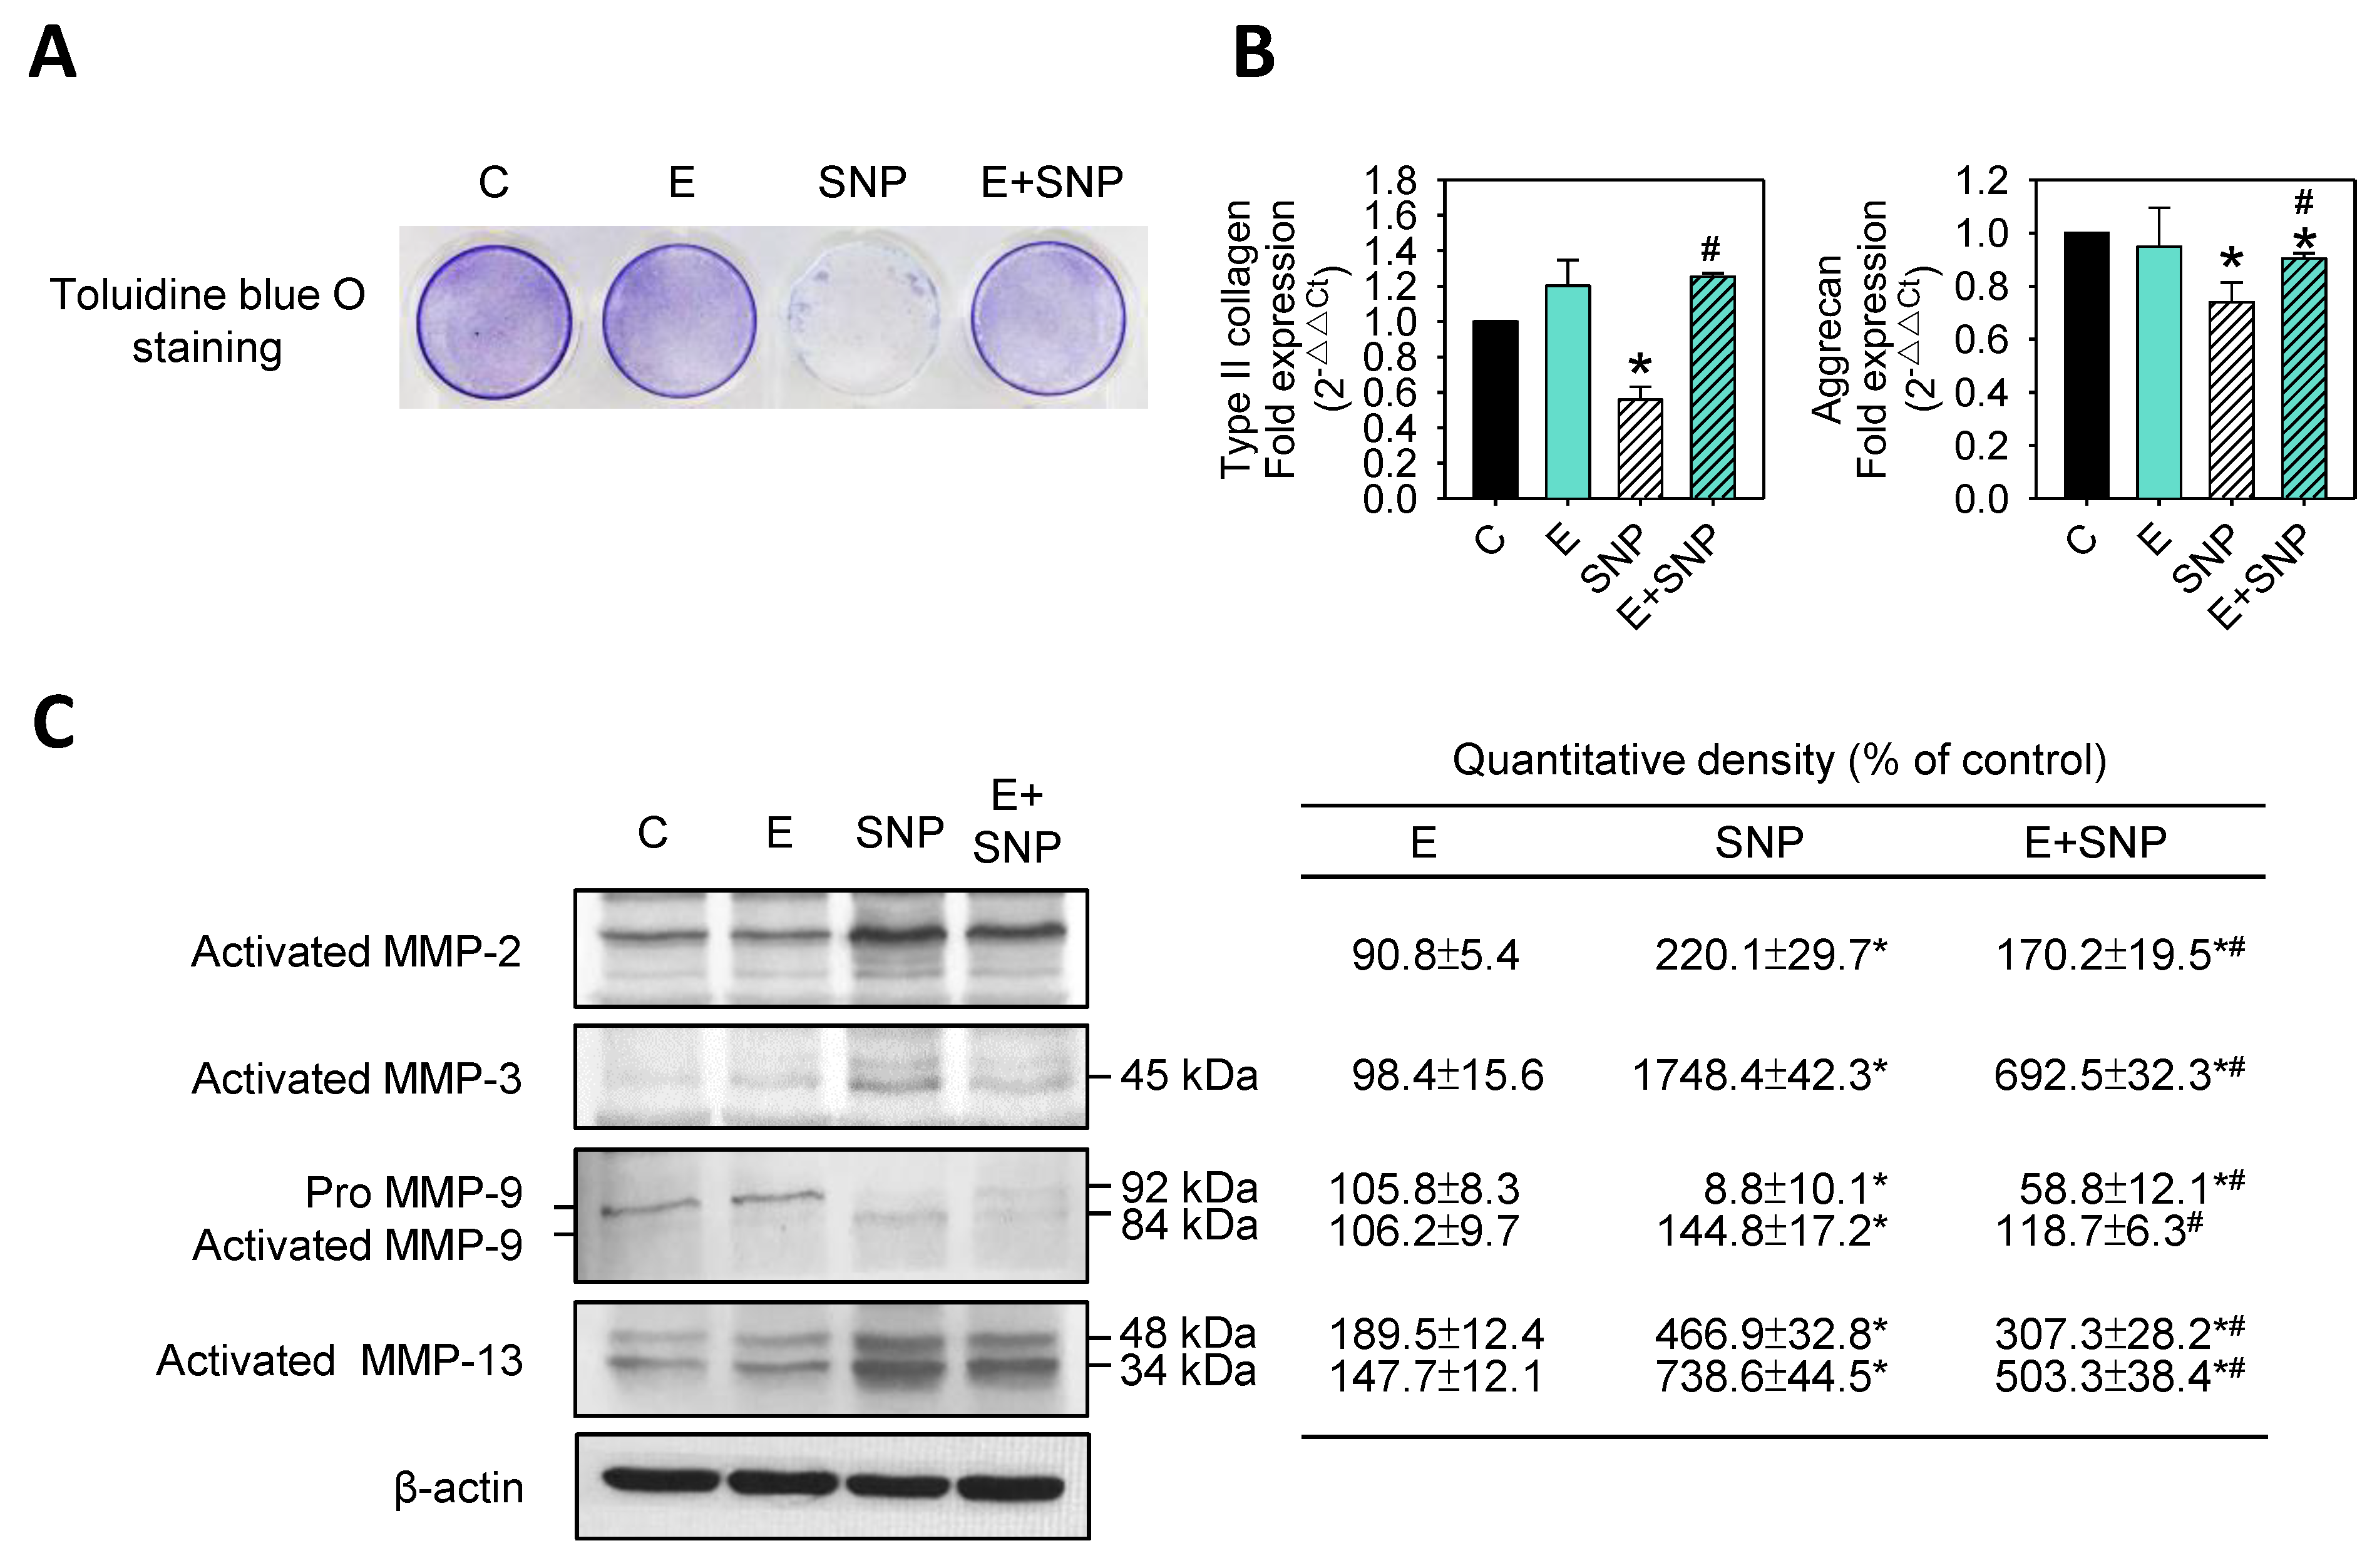
2.5. S-Equol Inhibits SNP-Induced Matrix Degradation

Type II collagen and aggrecan are the main extracellular matrix (ECM) proteins in cartilage [28]. MMP-13 is a product of chondrocytes that reside in cartilage. In addition to degrading collagen, MMP-13 also degrades the proteoglycan molecule aggrecan, thus playing a dual role in matrix destruction. In addition, the expression of other MMPs, such as MMP-2, MMP-3, and MMP-9, is elevated in arthritis, and these enzymes degrade non-collagen matrix components of joints [29].
To determine whether matrix synthesis and degradation was affected by SNP and/or S-Equol, primary chondrocytes were treated with 0.8 mM SNP and/or 30 μM S-Equol for 24 h, then polysaccharides contents were examined by toluidine blue O staining, type II collagen, and aggrecan gene expression were analyzed by real-time PCR, and MMP-2, MMP-3, MMP-9, and MMP-13 protein expressions were analyzed by Western blotting. Results showed SNP significantly decreased acidic polysaccharides levels (Figure 5A), and gene expressions of type II collagen and aggrecan (Figure 5B), whereas the addition of S-Equol could significantly lessen the decrease of matrix synthesis. Figure 5C showed that SNP could dramatically increase the activation of MMP-2, MMP-3, MMP-9, and MMP-13, and the addition of S-Equol could lessen this trend. This suggests that S-Equol may decrease the SNP-caused matrix loss.

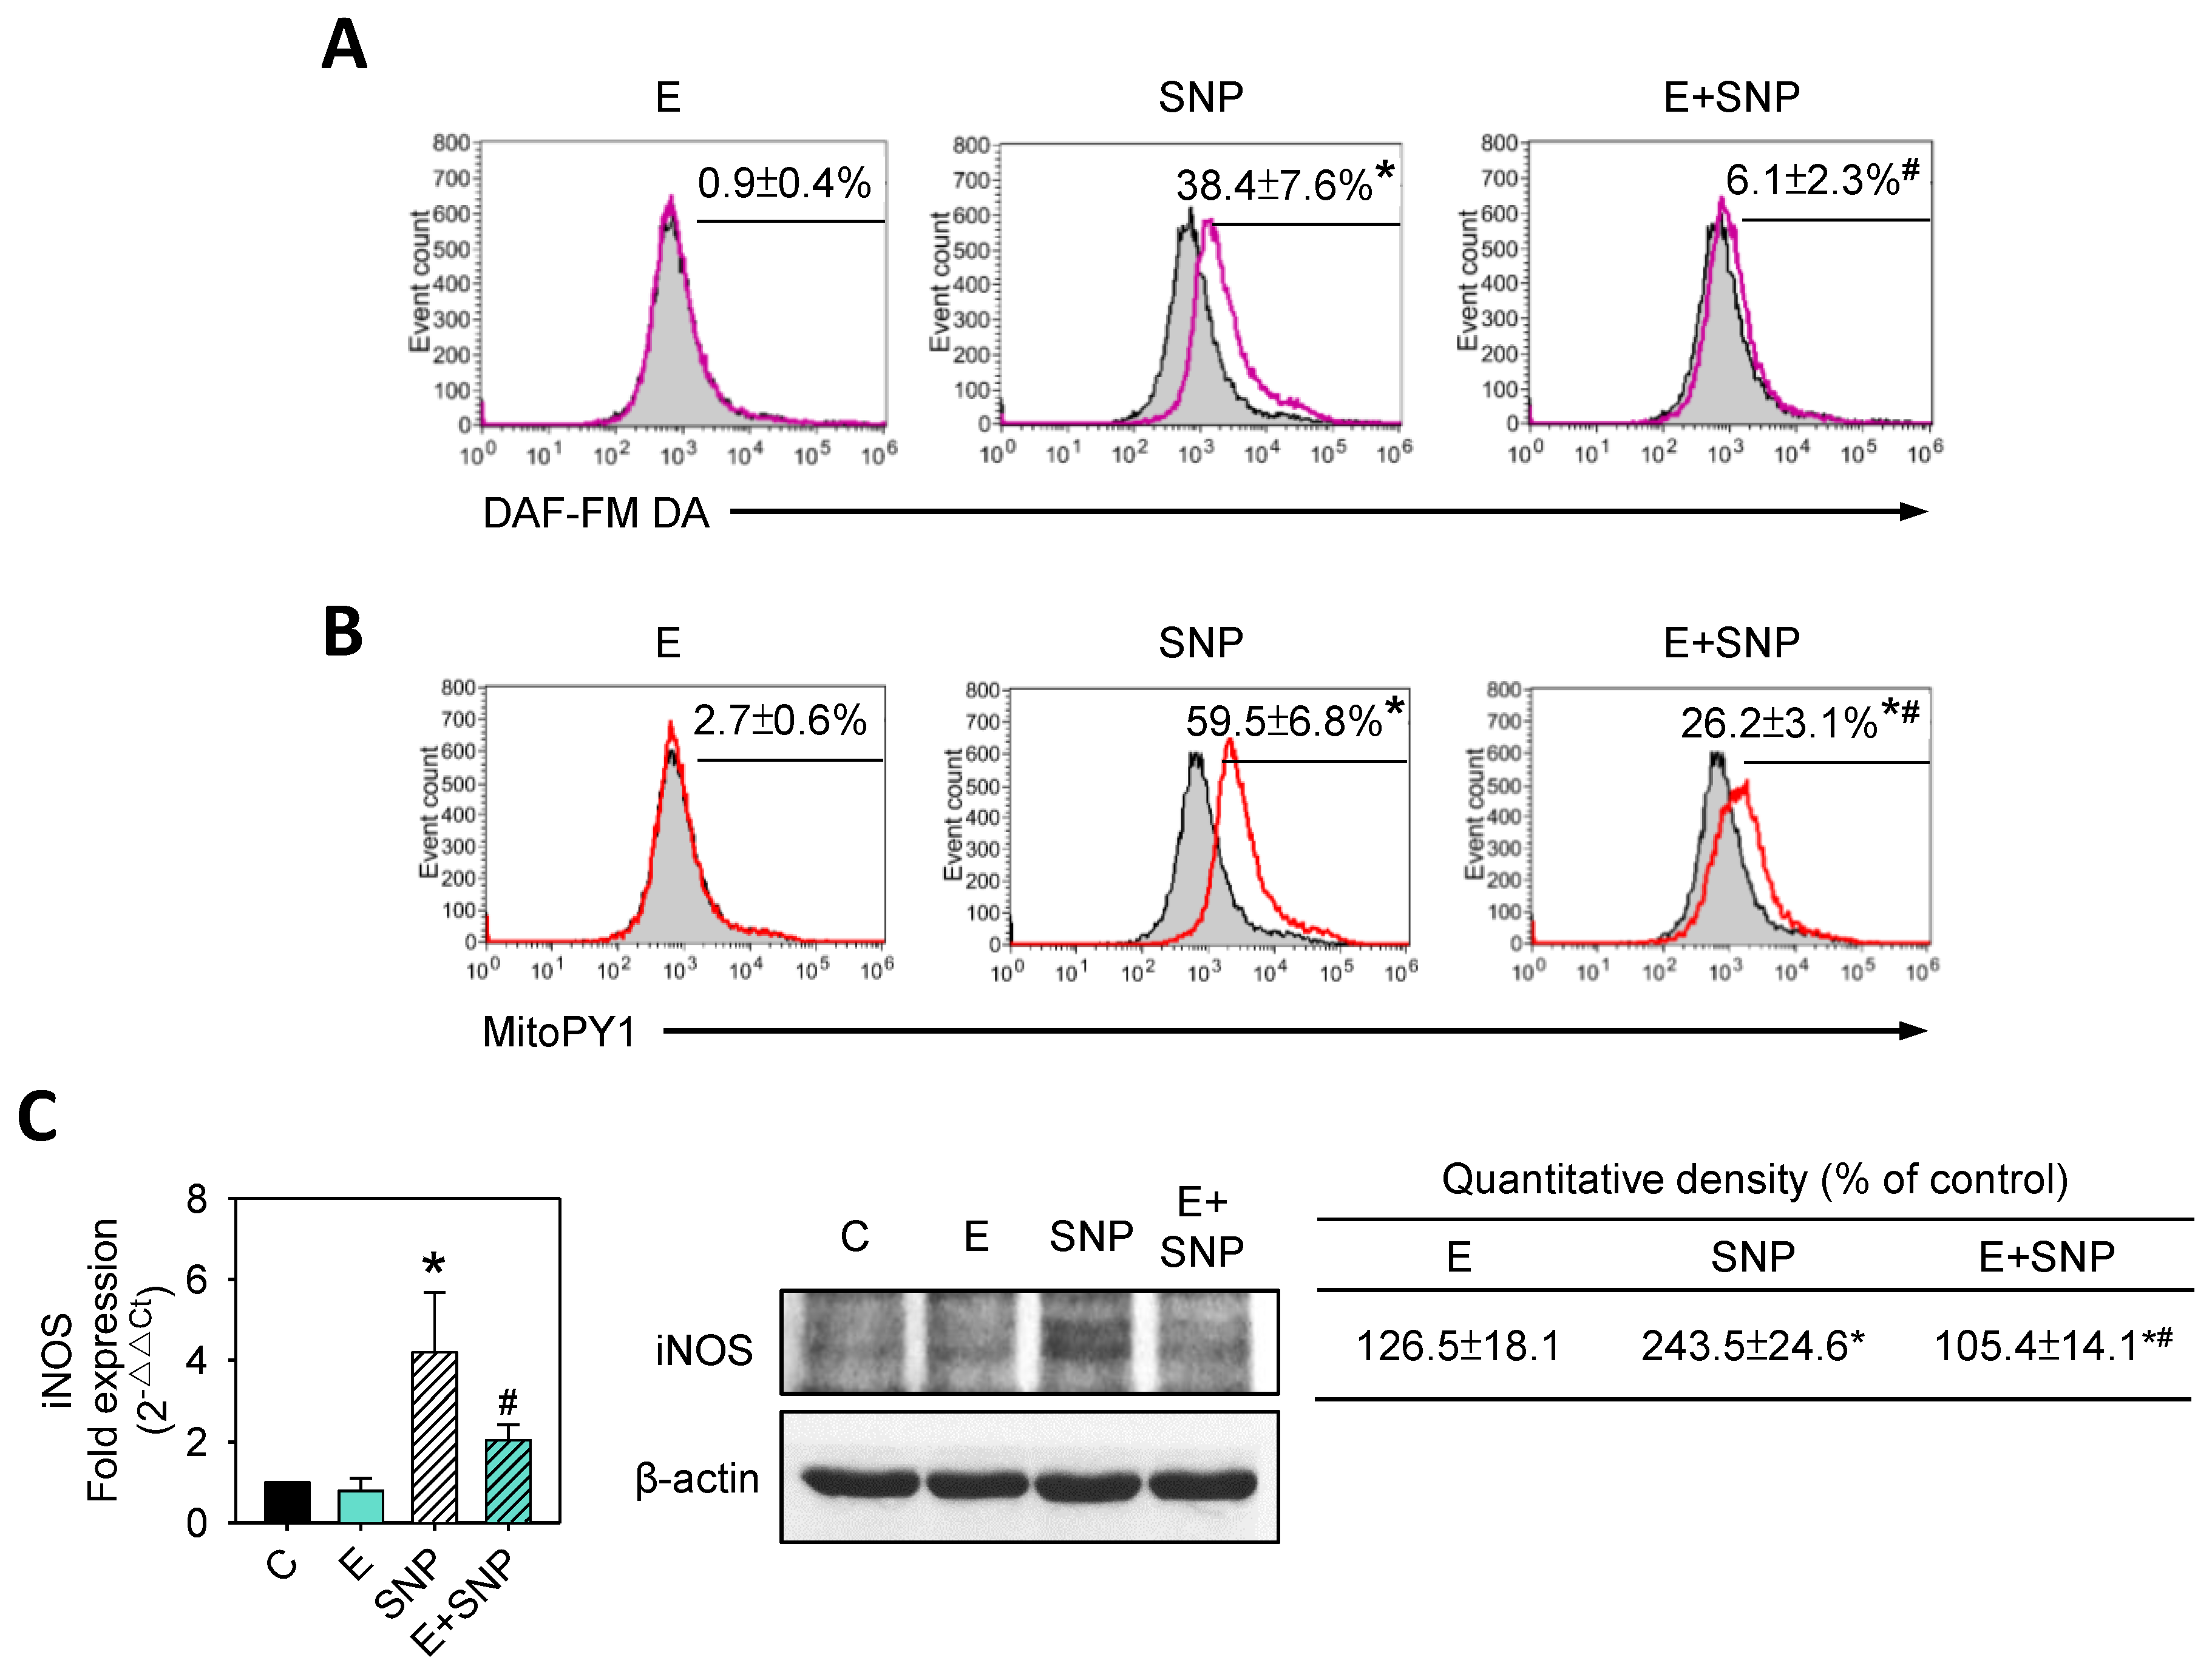
2.6. S-Equol Reduces SNP-Induced NO and H2O2 Production

Some studies indicated that the productions of nitric oxide (NO) and hydrogen peroxide (H2O2) could explain the cytotoxicity of SNP [20,30] and enhancement of inducible nitric oxide synthase (iNOS) related to NO production [31]. To determine whether NO, H2O2, and iNOS were involved in the effects of SNP on primary chondrocytes, cells were treated with 0.8 mM SNP and/or 30 μM S-Equol for 24 h, and then intracellular NO generation, mitochondrial H2O2 production and iNOS expression were measured. Figure 6A,B showed that the NO and H2O2 levels were significantly increased by SNP treatment, whereas both increases were lowered as S-Equol was added. Both mRNA and protein expressions of iNOS were increased by SNP treatment, while the addition of S-Equol might significantly inhibit the increase of iNOS or even the protein levels, which were lower than in the control group (Figure 6C).

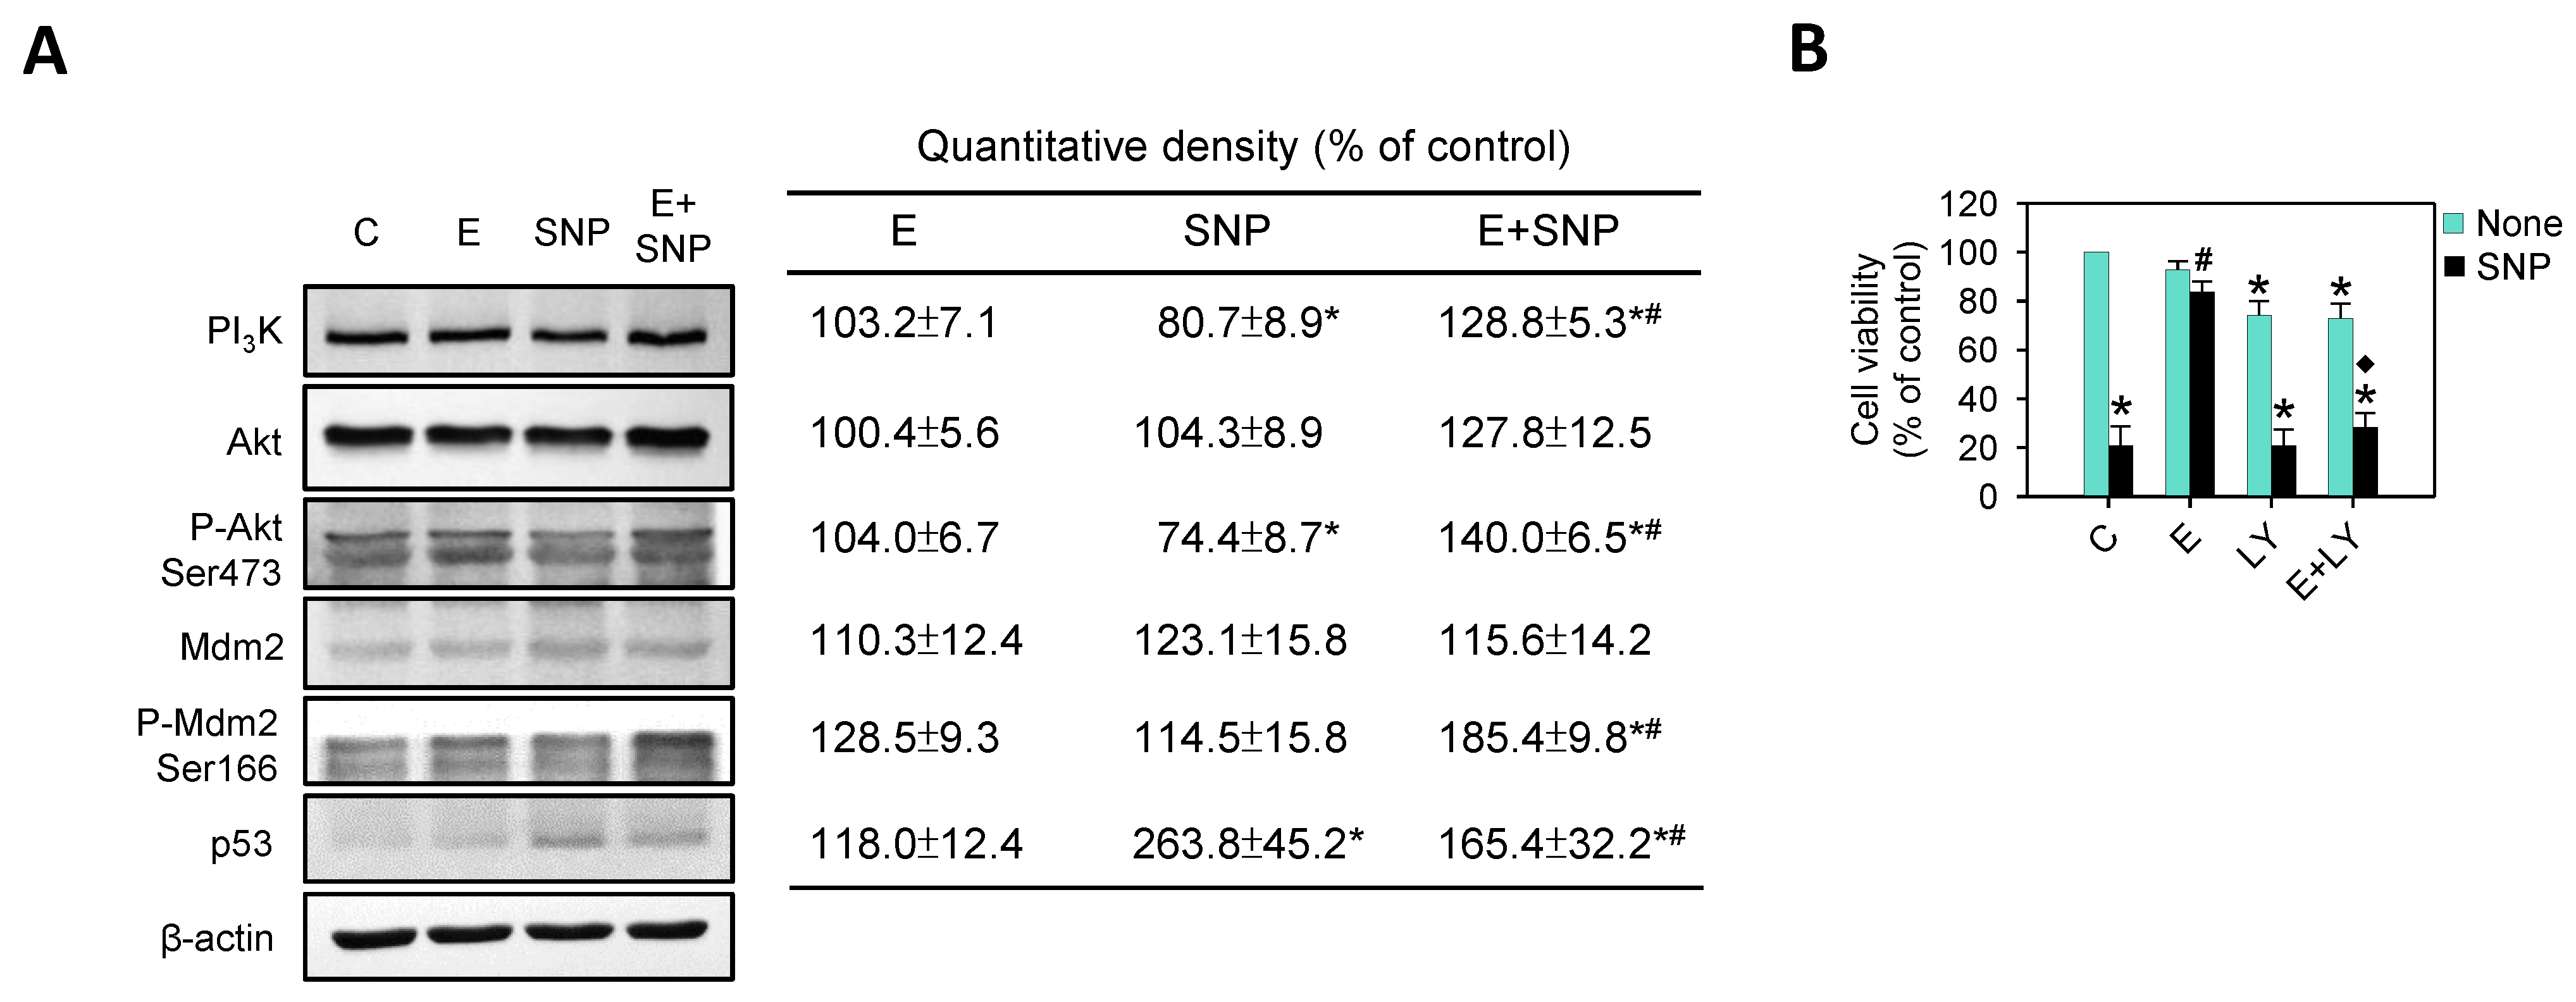
2.7. The Effect of SNP/S-Equol on PI3K-Akt Pathway

It is known that p53 induces apoptosis of cells mainly by direct or indirect transcriptional activation of the pro-apoptotic proteins BIM, PUMA, NOXA, BAK, and BAX [27,32]. The p53 response is through regulation of the PI3K-Akt pathway. When PI3K is activated, it will activate the phosphorylation of serine 473 (Ser473) of Akt, which can regulate the phosphorylation of serine 166 (Ser166) of Mdm2 [33]. The phosphorylated Mdm2 can enter the nucleus and bind with p53 to inhibit its transcriptional activity, or the activity of E3 ubiquitin ligase sends p53 to the protesome for ubiquitin-dependent degradation, thereby reducing the expression of p53 in cells to avoid the occurrence of p53-dependent cell apoptosis and maintaining cell survival [34]. Accordingly, we analyzed the PI3K-Akt pathway-related parameters.
Figure 7A shows that SNP significantly increased p53 expression, while S-Equol addition could lessen this increase, but was still higher than the control group. In contrast, SNP significantly decreased PI3K and P-Akt. Simultaneously, S-Equol addition could increase not only PI3K and P-Akt but also P-Mdm2 levels. That indicates the PI3K-Akt pathway could be activated by S-Equol addition. In order to further clarify the role of PI3K-Akt activation by S-Equol addition, primary chondrocytes were pre-treated with a PI3K inhibitor, LY294002, for 1 h and then treated with 0.8 mM SNP and/or 30 μM S-Equol for 24 h, then viable cells were analyzed. As Figure 7B shows, the cell viability was different in SNP with or without S-Equol addition, but this difference disappeared as pre-treatment with PI3K inhibitor. This suggests that the protective effect of S-Equol addition against SNP-caused cell death is related to PI3K -Akt activation.

3. Discussion

The present study showed that, in rat primary chondrocyte, treatment of 0.8 mM SNP causes cell death and an increase in oxidative stress (NO and H2O2), apoptosis, and proteoglycan loss. Furthermore, the expressions of MMPs of MMP-2, MMP-3, MMP-9, and MMP-13 and p53 are increased. The addition of 30 μM S-Equol can lessen those caused by SNP. Moreover, we found that S-Equol can activate phosphorylation of Akt and Mdm2; in other words, S-Equol activates the PI3K/Akt pathway which is an upstream regulation of p53 and NO production, and associated with the occurring of apoptosis and matrix degradation (Figure 8). As pre-treatment of phosphoinositide 3-kinases (PI3K) inhibitor, all the S-Equol protection against SNP reduced or disappeared. These results suggest that S-Equol could protect chondrocytes from SNP-induced matrix degradation and apoptosis through activation of PI3K/Akt pathway.
It has been reported that SNP can be used as an exogenous NO donor to evoke intracellular apoptosis and MMPs expressions [35]. Owing to the fact that these characteristics are similar to the conditions of OA progress, it has been widely used as an agent to treat chondrocytes to mimic the progress of OA [36]. Consistent with the report, this study showed, after treatment of SNP, chondrocytes not only had higher NO levels, but also high H2O2, levels resulting in high oxidative stress. Additionally, when more MMPs expressions were found, the apparent circumstances of matrix degradation and apoptosis of chondrocyte found in OA occurred. Although this study could not clarify whether the matrix degradation and apoptosis are directly or indirectly related to NO and/or H2O2, there was a report that indicated that NO was not only involved in SNP-induced chondrocyte apoptosis but also related to MMPs activities [20]. However, it is well known that increased intracellular oxidative stress leads to apoptosis induction [37]. Herein, we found the decreased mitochondrial membrane potential (ΔΨM) and anti-apoptotic proteins expression and the increased pro-apoptotic proteins, caspase, and cytochrome c release after SNP treatment.
The soy isoflavone-derived molecule Equol [7-hydroxy-3-(4′-hydroxyphenyl)-chroman], a daidzein metabolite produced by intestinal microflora, is well known to have the strongest estrogen receptor binding capacity and antioxidative activities among all soy isoflavones; moreover, its binding capacity is almost equal to 17β-Estradiol [16,17,18]. It is already known 17β-Estradiol can promote cell survival and antioxidant activity of chondrocytes via the phosphatidylinositol 3-kinase-Akt (PI3K/Akt) pathway [38,39]. The report indicates that S-Equol can activate the Nrf2/ARE signaling pathway mediated by PI3K/Akt to against oxidative stress of endothelial cells [40]. When phosphorylation of Akt at Ser473 becomes active and enhances cell survival, phosphorylation occurs at an Akt consensus site (Ser166) within the Mdm2 protein, a key regulator of p53 function, it subsequently interacts with the tumor suppressor protein p53 to negatively regulate its function. This occurs through two main mechanisms. First, the direct binding of Mdm2 to the N-terminal end of p53 inhibits the transcriptional activation function of p53. Second, Mdm2 possesses E3 ubiquitin ligase activity that targets p53 for modification and subsequent degradation through the 26S proteasome [41,42]. It is known that p53 induces apoptosis of normal cells mainly by directly upregulating the pro-apoptotic genes NOXA, PUMA, and indirectly BIM, and it has been shown to inhibit the expression of Bcl-2 directly [32]. p53 has been reported to migrate to the mitochondria and interact with members of the Bcl-2 family by displacing anti-apoptotic members from pro-apoptotic Bcl-2 proteins, or by directly activating BAX or BAK to induce mitochondrial outer membrane permeabilization (MOMP) [32].
Our results show that addition of S-Equol to SNP-treated primary chondrocytes can lessen all lethal effects caused by SNP and activate PI3K/Akt pathway accompanied by increased phosphorylation at Ser473 of Akt and Ser166 of Mdm2, and decreased p53, which is the same as that reported of 17β-Estradiol [38,39]. Accordingly, we propose that S-Equol is a good alternative to 17β-Estradiol. In the experiment of pre-treatment of LY294002, a strong inhibitor of phosphoinositide 3-kinases, we found the protective effect of S-Equol against SNP disappeared or decreased. This suggests that S-Equol protects chondrocytes from SNP-caused damage through PI3K/Akt pathway.
In summary, the present study demonstrates that S-Equol can effectively protect chondrocytes against SNP-induced matrix degradation and apoptosis, which are the common findings of OA progress. That suggests that S-Equol has the potential to be an agent for OA treatment.

4. Materials and Methods

4.1. Reagents and Antibodies

SNP and all other chemicals of analytical grade were purchased from Sigma-Aldrich Co., LLC. (St. Louis, MO, USA). S-Equol was purchased from Cayman Chemical Company (Ann Arbor, MI, USA). Protein assay reagents were obtained from Bio-Rad Laboratories (Hercules, CA, USA). The following primary antibodies were used in the Western blot analysis. MMP-2, MMP-9, iNOS (NOS2), cytochrome c, caspase-9, caspase-3, PUMA, Bcl-XL, BAX, p53, MMP-3, and β-actin were purchased from Santa Cruz Biotechnology, Inc. (Dallas, TX, USA). MMP-13, NOXA, and Mdm2 were purchased from Novus Biologicals (Littleton, CO, USA). P-Mdm2 Ser166 was purchased from Abcam plc. (Abcam, Cambridge, UK). BIM, BAK, PI3K, Akt, and P-Akt Ser473 were purchased from Cell Signaling Technology (Danvers, MA, USA). Horseradish peroxidase-conjugated anti-mouse, goat, or rabbit IgG antibodies were purchased from Santa Cruz Biotechnology, Inc. (Dallas, TX, USA).

4.2. Isolation and Expansion of Rat Primary Chondrocytes

Male and female Sprague Dawley (SD) rats at 8 weeks of age were purchased from BioLASCO Taiwan Co., Ltd. (Charles River Technology, Taipei, Taiwan). Male SD rats at 9 weeks of age (301–325 g) and female SD rats at 9 weeks of age (201–225 g) were used. The present study was performed following the Guide for the Care and Use of Laboratory Animals of the United States National Institutes of Health. The protocol for animal use was reviewed and approved by the Institutional Animal Care and Use Committee (IACUC) of Kaohsiung Medical University (Approval No. 107214; Approval date: 7 May 2019). The extraction of chondrocytes from cartilage was performed as reported previously [43]. Briefly, one litter of 1–2-day-old newborn rats under general anesthesia were used. After disinfecting all animals with 70% ethanol, the skin and soft tissues were removed from the hind legs using sterile scissors and pincer. Then, the femurs were dislocated and the soft tissues discarded. Cartilage sections of femoral heads, femoral condyles, and tibial plateau were immediately harvested using a scalpel and incubated overnight in a thermal incubator under 5% CO2, in a petri dish with collagenase D (Roche Diagnostics GmbH, Mannheim, Germany) solution at 0.5 mg/mL in Dulbecco’s modified Eagle’s medium (DMEM). After dispersing the cell aggregates, a suspension of isolated cells yields was carried out. The cell suspension was filtered through a sterile 48 μM cell strainer to obtain chondrocytes. Chondrocytes were seeded on a culture dish in an incubator at 37 °C with 5% CO2, and the culture medium was changed every two days. After the cells reached 80–90% confluence, the cultures were trypsinized and the cells were frozen at −80 °C overnight. The cells were stored in liquid nitrogen for long periods. Passage 2 (P2) chondrocytes were analyzed for each experiment.

4.3. Cell Culture

The rat primary chondrocytes were cultured at 37 °C with low glucose Dulbecco’s modified Eagle medium (DMEM) containing 100 units/mL of penicillin, 100 μg/mL streptomycin (Gibco BRL, Grand Island, NY, USA), and 10% fetal bovine serum (FBS) (Gibco BRL, Grand Island, NY, USA) in a 5% CO2 incubator. The cells were seeded at 5 × 10⁵ onto dishes in DMEM for 16 h to enable attachment and subsequently treated with S-Equol in the presence or absence of SNP for a further indicated period, followed by the analysis of the influences.

4.4. Cell Viability Assay

The primary rat chondrocytes (5 × 10⁴/well) were seeded in 24-well plates and incubated with 0–1.4 mM SNP or 0–50 μM S-Equol for 24 h. The cells were harvested, and the viable cells were counted using a dye exclusion technique with 0.4% trypan blue (Gibco BRL, Grand Island, NY, USA) in a hemocytometer. All counts were performed in triplicate.

4.5. Effects PI3K Inhibitors on Cell Viability

The primary rat chondrocytes (5 × 10⁴/well) were seeded in 24-well plates and pretreated with 10 μM LY294002 (LY) (BioVision, Inc., Mountain View, CA, USA), a PI3K inhibitor, for 1 h. Afterward, cells were treated with 30 μM S-Equol for 24 h. Then cells were treated with 0.8 mM SNP for another 24 h, the cell viability was assayed. All counts were performed in triplicate.

4.6. Toluidine Blue O Staining

The primary rat chondrocytes (5 × 10⁴/well) were seeded in 24-well plates and treated with S-Equol for 24 h in the presence or absence of SNP for another 24 h. Then, the medium was removed from each well and the cells were washed with PBS. The cells were fixed with 4% paraformaldehyde (PFA) in PBS for 10 min at room temperature and then rinsed with PBS. The fixed cells were incubated with 0.5% toluidine blue O staining solution for 30 min at room temperature. After PBS washes, the image was captured using a digital camera.

4.7. Measurement of NO and H2O2 Levels

The primary rat chondrocytes (5 × 10⁵) were seeded in 6 cm culture dishes and treated with S-Equol for 24 h in the presence or absence of SNP for another 24 h, and then intracellular nitric oxide (NO) and mitochondrial hydrogen peroxide (H2O2) levels were detected to represent oxidative stress by using fluorescent probes of 4-amino-5-methylamino-2′,7′-difluorofluorescein diacetate (DAF-FM DA) (Cayman Chemical Company, Ann Arbor, MI, USA) [44] and mitochondria peroxy yellow 1 (MitoPY1) (Tocris Bioscience, Bristol, UK) [45], respectively. The detection was performed as described in the manufacturer’s instruction using an Attune NxT, Acoustic Focusing Cytometer (Model AFC2, Thermo Fisher Scientific, Waltham, MA, USA). The data were analyzed using FCSalyzer version 0.9.22 (Sven Mostböck, Vienna, Austria). Each experiment was carried out in triplicate.

4.8. Western Blot Analysis

The primary rat chondrocytes (5 × 10⁵) were seeded in 6 cm culture dishes and treated with S-Equol for 24 h in the presence or absence of SNP for another 24 h, and then the cell extracts preparation for Western blot analyses were described previously [45]. Briefly, proteins were separated by 10% SDS-PAGE and then transferred to nitrocellulose membrane (Amersham, GE Healthcare life sciences/Cytiva, Marlborough, MA, USA). After blocking in 2% nonfat milk or 2% bovine serum albumin (BSA) (Sigma-Aldrich Co., LLC., St. Louis, MO, USA), the membranes were incubated with primary antibodies as indicated. The proteins were visualized using chemiluminescence detection (PerkinElmer, Inc., Waltham, MA, USA). β-actin was used as the internal control, and each targeted band was calibrated by the respective β-actin. Afterwards, the data of the study group were quantitatively analyzed relative to the control group. Each experiment was carried out in triplicate.

4.9. Quantitative Real-Time PCR Analysis (qPCR)

The primary rat chondrocytes (5 × 10⁵) were seeded in 6 cm culture dishes and treated with S-Equol for 24 h in the presence or absence of SNP for another 24 h, and then the total RNA was isolated by Direct-zol RNA Miniprep Kits (Zymo Research, Irvine, CA, USA) according to the manufacturer’s instructions. Each experiment was carried out in triplicate. The complementary DNA (cDNA) was synthesized from random primed reverse transcription from 2 μg of total RNA using M-MLV reverse transcriptase (Promega Corporation, Madison, WI, USA) according to the manufacturer’s instructions. Real-time PCR was performed on a StepOnePlus Real-Time PCR System (Applied Biosystems, Thermo Fisher Scientific, Waltham, MA, USA) using Fast SYBR Green Master Mix (Applied Biosystems, Thermo Fisher Scientific, Waltham, MA, USA). The mRNAs encoding type II collagen, aggrecan, iNOS, BIM, PUMA, NOXA, Bcl-2, BAK, and BAX were measured using real-time PCR, with β-actin mRNA as the housekeeping gene. The primers and amplified products of each gene used in the present study are shown in Table 1. The cycle threshold (Ct) value of the target gene was normalized to β-actin. The data were calculated and expressed as 2−ΔΔCt [46] using StepOne software version 2.3 (Thermo Fisher Scientific, Waltham, MA, USA).

4.10. TUNEL Assay

Apoptosis was determined by the terminal deoxynucleotide transferase-mediated dUTP nick-end labeling (TUNEL) assay. TUNEL was performed using an APO-BrdU™ TUNEL Assay Kit (Thermo Fisher Scientific, Waltham, MA, USA) according to the manufacturer’s protocol and followed by flow cytometric analysis using an Attune NxT, Acoustic Focusing Cytometer (Model AFC2, Thermo Fisher Scientific, Waltham, MA, USA) to quantify apoptosis. The data were analyzed using FCSalyzer version 0.9.22. A minimum of 1 × 10⁴ cells per sample was evaluated in each case [47].

4.11. Cell Cycle Progression Analysis

The percentages of cells in the different stages of the cell cycle were estimated by flow cytometric DNA analysis as described previously [48]. A minimum of 1 × 10⁴ cells per sample were evaluated on an Attune NxT, Acoustic Focusing Cytometer (Model AFC2, Thermo Fisher Scientific, Waltham, MA, USA), and the percentages of cells in each cell cycle phase (subG1, G0/G1, S, or G2/M) were determined using FCSalyzer version 0.9.22 (Sven Mostböck, Vienna, Austria). Each experiment carried out in triplicate.

4.12. Detection of Mitochondrial Membrane Potential (ΔΨM)

Fluorescent dyes, rhodamin123, 3, 3’-dihexyloxacarbocyanine iodide (DiOC6), and 5, 5’, 6, 6’-tetrachloro-1, 1’, 3, 3’-tetraethylbenzimidazolylcarbocyanine iodide (JC-1), were applied to detect the ΔΨM. The staining procedure was performed according to the manufacture’s protocol. The primary rat chondrocytes (5 × 10⁵) were seeded in 6 cm culture dishes and treated with S-Equol for 24 h in the presence or absence of SNP for another 24 h, and then cells were subsequently stained with 10 μg/mL rhodamin123 (Sigma-Aldrich Co., LLC., St. Louis, MO, USA) for 15 min, 20 nM DiOC6 (Sigma-Aldrich Co., LLC., St. Louis, MO, USA) for 10 min, or 2 μM JC-1 (Thermo Fisher Scientific, Waltham, MA, USA) for 20 min, at 37 °C. A minimum of 1 × 10⁴ cells per sample was then collected, washed in PBS, and evaluated on an Attune NxT, Acoustic Focusing Cytometer (Model AFC2, Thermo Fisher Scientific, Waltham, MA, USA), and analyzed using FCSalyzer version 0.9.22 (Sven Mostböck, Vienna, Austria). Low levels of rhodamin123 or DiOC6 uptake corresponded to a loss of ΔΨM. JC-1 aggregates (red fluorescence) favor high ΔΨM intact cells and, in response to the loss of ΔΨM, JC-1 monomers are formed showing green fluorescence. Cells with collapsed ΔΨM exhibited a decrease in the percentage of red fluorescence and the fluorescence intensity of the red/green ratio. Each experiment was carried out in triplicate.

4.13. Measurement of Caspase-9 and Caspase-3 Activities

The primary rat chondrocytes (5 × 10⁵) were seeded in 6 cm culture dishes and treated with S-Equol for 24 h in the presence or absence of SNP for another 24 h, and then the cell pellet was resuspended in lysis buffer and sonicated at 20 s intervals for 2 min on ice. Next, the cell lysate was centrifuged at 12,000× g for 10 min at 4 °C, and the supernatant was collected and analyzed immediately for caspase-9 and caspase-3 activity using Caspase-9 Colorimetric Assay Kit (BioVision, Inc., Mountain View, CA, USA) and Caspase-3/CPP32 Colorimetric Protease Assay Kit (Invitrogen, Grand Island, NY, USA), respectively, according to the manufacturer’s instructions.

4.14. Statistical Analysis

All data are presented as the means ± standard deviation (S.D.). The differences between control and treated groups were analyzed using ANOVA, followed by Fisher’s Exact Test. All statistical analyses were performed using SAS version 6.011 software (SAS Institute, Inc., Cary, NC, USA). A p-value < 0.05 was considered statistically significant.

Author Contributions

All authors made significant contributions to this study and manuscript. L.-W.H. and K.-L.C. conceived and designed this study as well as interpreted data, additionally, L.-W.H. drafted the manuscript and K.-L.C. revised it. L.-W.H., T.-C.H., Y.-C.H., B.-S.H., H.-L.C. and P.-R.C. performed the experiments. T.-C.H. analyzed the data. All authors have read and agreed to the published version of the manuscript.

Funding

This work was partially supported by a grant from the Ministry of Science and Technology, Taipei City, Taiwan (108-2320-B-037-030-MY3), and by a grant from the Ministry of Science and Technology, Taipei City, Taiwan (109-2811-B-037-518).

Conflicts of Interest

The authors declare no conflict of interest.

References

  1. Spencer, L.J.; Christopher, J.L.M. GBD 2017 Disease and Injury Incidence and Prevalence Collaborators, Global, regional, and national incidence, prevalence, and years lived with disability for 354 diseases and injuries for 195 countries and territories, 1990–2017: A systematic analysis for the Global Burden of Disease Study 2017. Lancet 2018, 392, 1789–1858. [Google Scholar]
  2. Prieto-Alhambra, D.; Judge, A.; Javaid, M.K.; Cooper, C.; Diez-Perez, A.; Arden, N.K. Incidence and risk factors for clinically diagnosed knee, hip and hand osteoarthritis: Influences of age, gender and osteoarthritis affecting other joints. Ann. Rheum. Dis. 2014, 73, 1659–1664. [Google Scholar] [CrossRef] [Green Version]
  3. Brooks, P.M. The burden of musculoskeletal disease—A global perspective. Clin. Rheumatol. 2006, 25, 778–781. [Google Scholar] [CrossRef]
  4. Stevens-Lapsley, J.E.; Kohrt, W.M. Osteoarthritis in women: Effects of estrogen, obesity and physical activity. Womens Health 2010, 6, 601–615. [Google Scholar] [CrossRef]
  5. Kalson, N.S.; Gikas, P.D.; Briggs, T.W. Current strategies for knee cartilage repair. Int. J. Clin. Pract. 2010, 64, 1444–1452. [Google Scholar] [CrossRef] [PubMed] [Green Version]
  6. Hwang, H.S.; Kim, H.A. Chondrocyte Apoptosis in the Pathogenesis of Osteoarthritis. Int. J. Mol. Sci. 2015, 16, 26035–26054. [Google Scholar] [CrossRef] [PubMed]
  7. Park, D.R.; Kim, J.; Kim, G.M.; Lee, H.; Kim, M.; Hwang, D.; Lee, H.; Kim, H.S.; Kim, W.; Park, M.C.; et al. Osteoclast-associated receptor blockade prevents articular cartilage destruction via chondrocyte apoptosis regulation. Nat. Commun. 2020, 11, 4343. [Google Scholar] [CrossRef]
  8. Chiu, P.R.; Hu, Y.C.; Huang, T.C.; Hsieh, B.S.; Yeh, J.P.; Cheng, H.L.; Huang, L.W.; Chang, K.L. Vitamin C Protects Chondrocytes against Monosodium Iodoacetate-Induced Osteoarthritis by Multiple Pathways. Int. J. Mol. Sci. 2016, 18, 38. [Google Scholar] [CrossRef] [Green Version]
  9. Huang, T.C.; Chang, W.T.; Hu, Y.C.; Hsieh, B.S.; Cheng, H.L.; Yen, J.H.; Chiu, P.R.; Chang, K.L. Zinc Protects Articular Chondrocytes through Changes in Nrf2-Mediated Antioxidants, Cytokines and Matrix Metalloproteinases. Nutrients 2018, 10, 471. [Google Scholar] [CrossRef] [Green Version]
  10. Huang, L.W.; Huang, T.C.; Hu, Y.C.; Hsieh, B.S.; Chiu, P.R.; Cheng, H.L.; Chang, K.L. Zinc protects chondrocytes from monosodium iodoacetate-induced damage by enhancing ATP and mitophagy. Biochem. Biophys Res. Commun. 2020, 521, 50–56. [Google Scholar] [CrossRef] [PubMed]
  11. Bourgonje, A.R.; Abdulle, A.E.; Al-Rawas, A.M.; Al-Maqbali, M.; Al-Saleh, M.; Enriquez, M.B.; Al-Siyabi, S.; Al-Hashmi, K.; Al-Lawati, I.; Bulthuis, M.L.C.; et al. Systemic Oxidative Stress Is Increased in Postmenopausal Women and Independently Associates with Homocysteine Levels. Int. J. Mol. Sci. 2020, 21, 314. [Google Scholar] [CrossRef] [Green Version]
  12. Lepetsos, P.; Papavassiliou, A.G. ROS/oxidative stress signaling in osteoarthritis. Biochim. Biophys Acta 2016, 1862, 576–591. [Google Scholar] [CrossRef]
  13. Zahan, O.M.; Serban, O.; Gherman, C.; Fodor, D. The evaluation of oxidative stress in osteoarthritis. Med. Pharm. Rep. 2020, 93, 12–22. [Google Scholar] [CrossRef] [PubMed]
  14. Bolduc, J.A.; Collins, J.A.; Loeser, R.F. Reactive oxygen species, aging and articular cartilage homeostasis. Free Radic Biol. Med. 2019, 132, 73–82. [Google Scholar] [CrossRef] [PubMed]
  15. Setchell, K.D.; Clerici, C. Equol: Pharmacokinetics and biological actions. J. Nutr. 2010, 140, 1363S–1368S. [Google Scholar] [CrossRef] [PubMed] [Green Version]
  16. Kostelac, D.; Rechkemmer, G.; Briviba, K. Phytoestrogens modulate binding response of estrogen receptors alpha and beta to the estrogen response element. J. Agric. Food Chem. 2003, 51, 7632–7635. [Google Scholar] [CrossRef] [PubMed]
  17. Yokoyama, S.; Suzuki, T. Isolation and characterization of a novel equol-producing bacterium from human feces. Biosci. Biotechnol. Biochem. 2008, 72, 2660–2666. [Google Scholar] [CrossRef] [Green Version]
  18. Rafii, F. The role of colonic bacteria in the metabolism of the natural isoflavone daidzin to equol. Metabolites 2015, 5, 56–73. [Google Scholar] [CrossRef] [Green Version]
  19. Charlier, E.; Relic, B.; Deroyer, C.; Malaise, O.; Neuville, S.; Collee, J.; Malaise, M.G.; De Seny, D. Insights on Molecular Mechanisms of Chondrocytes Death in Osteoarthritis. Int. J. Mol. Sci. 2016, 17, 2146. [Google Scholar] [CrossRef] [Green Version]
  20. Quan, Y.Y.; Qin, G.Q.; Huang, H.; Liu, Y.H.; Wang, X.P.; Chen, T.S. Dominant roles of Fenton reaction in sodium nitroprusside-induced chondrocyte apoptosis. Free Radic Biol. Med. 2016, 94, 135–144. [Google Scholar] [CrossRef]
  21. Lin, J.; Wu, G.; Chen, J.; Fu, C.; Hong, X.; Li, L.; Liu, X.; Wu, M. Electroacupuncture inhibits sodium nitroprussidemediated chondrocyte apoptosis through the mitochondrial pathway. Mol. Med. Rep. 2018, 18, 4922–4930. [Google Scholar]
  22. Maneiro, E.; Lopez-Armada, M.J.; de Andres, M.C.; Carames, B.; Martin, M.A.; Bonilla, A.; Del Hoyo, P.; Galdo, F.; Arenas, J.; Blanco, F.J. Effect of nitric oxide on mitochondrial respiratory activity of human articular chondrocytes. Ann. Rheum Dis. 2005, 64, 388–395. [Google Scholar] [CrossRef] [PubMed]
  23. He, B.; Wu, F.; Li, X.; Liu, Y.; Fan, L.; Li, H. Mitochondrial dependent pathway is involved in the protective effects of carboxymethylated chitosan on nitric oxide-induced apoptosis in chondrocytes. BMC Complement. Med. Ther. 2020, 20, 23. [Google Scholar] [CrossRef]
  24. Zorova, L.D.; Popkov, V.A.; Plotnikov, E.Y.; Silachev, D.N.; Pevzner, I.B.; Jankauskas, S.S.; Babenko, V.A.; Zorov, S.D.; Balakireva, A.V.; Juhaszova, M.; et al. Mitochondrial membrane potential. Anal. Biochem. 2018, 552, 50–59. [Google Scholar] [CrossRef]
  25. Roufayel, R. Regulation of stressed-induced cell death by the Bcl-2 family of apoptotic proteins. Mol. Membr. Biol. 2016, 33, 89–99. [Google Scholar] [CrossRef] [PubMed] [Green Version]
  26. Leibowitz, B.; Yu, J. Mitochondrial signaling in cell death via the Bcl-2 family. Cancer Biol. Ther. 2010, 9, 417–422. [Google Scholar] [CrossRef] [Green Version]
  27. Aubrey, B.J.; Kelly, G.L.; Janic, A.; Herold, M.J.; Strasser, A. How does p53 induce apoptosis and how does this relate to p53-mediated tumour suppression? Cell Death Differ. 2018, 25, 104–113. [Google Scholar] [CrossRef] [PubMed] [Green Version]
  28. Luo, Y.; Sinkeviciute, D.; He, Y.; Karsdal, M.; Henrotin, Y.; Mobasheri, A.; Onnerfjord, P.; Bay-Jensen, A. The minor collagens in articular cartilage. Protein Cell 2017, 8, 560–572. [Google Scholar] [CrossRef] [Green Version]
  29. Mehana, E.E.; Khafaga, A.F.; El-Blehi, S.S. The role of matrix metalloproteinases in osteoarthritis pathogenesis: An updated review. Life Sci. 2019, 234, 116786. [Google Scholar] [CrossRef]
  30. Liang, Q.; Wang, X.P.; Chen, T.S. Resveratrol protects rabbit articular chondrocyte against sodium nitroprusside-induced apoptosis via scavenging ROS. Apoptosis 2014, 19, 1354–1363. [Google Scholar] [CrossRef]
  31. Wink, D.A.; Hines, H.B.; Cheng, R.Y.; Switzer, C.H.; Flores-Santana, W.; Vitek, M.P.; Ridnour, L.A.; Colton, C.A. Nitric oxide and redox mechanisms in the immune response. J. Leukoc Biol. 2011, 89, 873–891. [Google Scholar] [CrossRef] [PubMed] [Green Version]
  32. Ho, T.; Tan, B.X.; Lane, D. How the Other Half Lives: What p53 Does When It Is Not Being a Transcription Factor. Int. J. Mol. Sci. 2019, 21, 13. [Google Scholar] [CrossRef] [PubMed] [Green Version]
  33. Meek, D.W.; Knippschild, U. Posttranslational modification of MDM2. Mol. Cancer Res. 2003, 1, 1017–1026. [Google Scholar]
  34. Shi, D.; Gu, W. Dual Roles of MDM2 in the Regulation of p53: Ubiquitination Dependent and Ubiquitination Independent Mechanisms of MDM2 Repression of p53 Activity. Genes Cancer 2012, 3, 240–248. [Google Scholar] [CrossRef] [Green Version]
  35. Yu, S.M.; Kim, S.J. Simvastatin prevents articular chondrocyte dedifferentiation induced by nitric oxide by inhibiting the expression of matrix metalloproteinases 1 and 13. Exp. Biol. Med. 2018, 243, 1165–1172. [Google Scholar] [CrossRef] [Green Version]
  36. Forstermann, U.; Sessa, W.C. Nitric oxide synthases: Regulation and function. Eur. Heart J. 2012, 33, 829–837. [Google Scholar] [CrossRef] [PubMed] [Green Version]
  37. Redza-Dutordoir, M.; Averill-Bates, D.A. Activation of apoptosis signalling pathways by reactive oxygen species. Biochim. Biophys. Acta 2016, 1863, 2977–2992. [Google Scholar] [CrossRef] [PubMed]
  38. Fan, D.X.; Yang, X.H.; Li, Y.N.; Guo, L. 17beta-Estradiol on the Expression of G-Protein Coupled Estrogen Receptor (GPER/GPR30) Mitophagy, and the PI3K/Akt Signaling Pathway in ATDC5 Chondrocytes In Vitro. Med. Sci. Monit. 2018, 24, 1936–1947. [Google Scholar] [CrossRef]
  39. Huang, J.G.; Xia, C.; Zheng, X.P.; Yi, T.T.; Wang, X.Y.; Song, G.; Zhang, B. 17beta-Estradiol promotes cell proliferation in rat osteoarthritis model chondrocytes via PI3K/Akt pathway. Cell Mol. Biol. Lett. 2011, 16, 564–575. [Google Scholar] [CrossRef]
  40. Zhang, T.; Liang, X.; Shi, L.; Wang, L.; Chen, J.; Kang, C.; Zhu, J.; Mi, M. Estrogen receptor and PI3K/Akt signaling pathway involvement in S-(-)equol-induced activation of Nrf2/ARE in endothelial cells. PLoS ONE 2013, 8, e79075. [Google Scholar] [CrossRef]
  41. Manfredi, J.J. The Mdm2-p53 relationship evolves: Mdm2 swings both ways as an oncogene and a tumor suppressor. Genes Dev. 2010, 24, 1580–1589. [Google Scholar] [CrossRef] [PubMed] [Green Version]
  42. Gottlieb, T.M.; Leal, J.F.; Seger, R.; Taya, Y.; Oren, M. Cross-talk between Akt, p53 and Mdm2: Possible implications for the regulation of apoptosis. Oncogene 2002, 21, 1299–1303. [Google Scholar] [CrossRef]
  43. Gosset, M.; Berenbaum, F.; Thirion, S.; Jacques, C. Primary culture and phenotyping of murine chondrocytes. Nat. Protoc. 2008, 3, 1253–1260. [Google Scholar] [CrossRef]
  44. Hsieh, B.S.; Huang, L.W.; Su, S.J.; Cheng, H.L.; Hu, Y.C.; Hung, T.C.; Chang, K.L. Combined arginine and ascorbic acid treatment induces apoptosis in the hepatoma cell line HA22T/VGH and changes in redox status involving the pentose phosphate pathway and reactive oxygen and nitrogen species. J. Nutr. Biochem. 2011, 22, 234–241. [Google Scholar] [CrossRef]
  45. Huang, T.C.; Chiu, P.R.; Chang, W.T.; Hsieh, B.S.; Huang, Y.C.; Cheng, H.L.; Huang, L.W.; Hu, Y.C.; Chang, K.L. Epirubicin induces apoptosis in osteoblasts through death-receptor and mitochondrial pathways. Apoptosis 2018, 23, 226–236. [Google Scholar] [CrossRef] [PubMed]
  46. Livak, K.J.; Schmittgen, T.D. Analysis of relative gene expression data using real-time quantitative PCR and the 2(-Delta Delta C(T)) Method. Methods 2001, 25, 402–408. [Google Scholar] [CrossRef] [PubMed]
  47. Cheng, H.L.; Su, S.J.; Huang, L.W.; Hsieh, B.S.; Hu, Y.C.; Hung, T.C.; Chang, K.L. Arecoline induces HA22T/VGH hepatoma cells to undergo anoikis—Involvement of STAT3 and RhoA activation. Mol. Cancer 2010, 9, 126. [Google Scholar] [CrossRef] [Green Version]
  48. Chang, K.L.; Hung, T.C.; Hsieh, B.S.; Chen, Y.H.; Chen, T.F.; Cheng, H.L. Zinc at pharmacologic concentrations affects cytokine expression and induces apoptosis of human peripheral blood mononuclear cells. Nutrition 2006, 22, 465–474. [Google Scholar] [CrossRef]
Figure 1. Effects of SNP and/or isoflavones on the viability of primary chondrocytes. (A) The cells were treated with 0.6–1.4 mM SNP for 24 h; (B) The cells were treated with 1–50 μM S-Equol for 24 h; (C) The cells were treated with 1–50 μM S-Equol for 24h in the presence or absence of 0.8 mM SNP for another 24 h; and (D) The cells were treated with 30 μM S-Equol (E), Daidzein (D), Genistein (G), or Biochanin A (B) for 24 h in the absence (control) or presence of 0.8 mM SNP for another 24 h. The results are expressed as the mean ± the S.D. for three separate experiments. * p < 0.05 compared to the untreated control group. # p < 0.05 compared to the SNP treated group.
Ijms 22 07054 g001
Figure 2. The effect of SNP and/or S-Equol on cell cycle progression and apoptosis of primary chondrocytes. After cells were treated with S-Equol for 24 h in the presence or absence of SNP for another 24 h, (A) the cell cycle distribution was determined by flow cytometry and percentage of the subG1 phase was recognized as apoptotic cells; (B) apoptotic cells were also determined by TUNEL. The gray peak is vehicle control and the percentage of apoptotic cells of treated cells is shown in the figure. The results are expressed as the mean ± S.D. for three separate experiments, each in triplicate. * p < 0.05 compared to the untreated control. # p < 0.05 compared to the SNP treated group.
Ijms 22 07054 g002
Figure 3. The effect of SNP and/or S-Equol on the mitochondrial membrane potential (ΔΨM) of primary chondrocytes. After cells were treated with S-Equol for 24 h in the presence or absence of SNP for another 24 h, ΔΨM was determined by (A) Rhodamin123, (B) DiOC6, or (C) JC-1 staining, respectively, followed by flow cytometry. The gray filled area is the untreated control, and those delimited by the purple or green lines are the treated groups. In non-damaged cells with high ΔΨM, JC-1 spontaneously forms complexes known as J-aggregates (red fluorescence), whereas in unhealthy cells with low ΔΨM, JC-1 remains in the monomeric form (green fluorescence). The results are expressed as the mean ± S.D. for three separate experiments. * p < 0.05 compared to the untreated control. # p < 0.05 compared to the corresponding SNP-treated group.
Ijms 22 07054 g003
Figure 4. The effect of SNP and/or S-Equol on expressions of apoptotic and anti-apoptotic proteins of primary chondrocytes. After cells were treated with S-Equol for 24 h in the presence or absence of SNP for another 24 h, (A) cytochrome c, caspase-9, and caspase-3 levels were measured by Western blotting. β-actin was used as the internal control. The data in the right panel are expressed as the relative density compared to the untreated cells (control), which was 100%; (B) caspase-9 and caspase-3 activity were measured by a colorimetric assay; (C) BIM, PUMA, NOXA, Bcl-XL, BAK, and BAX protein levels were measured by Western blotting; and (D) BIM, PUMA, NOXA, Bcl-2, BAK, and BAX mRNA levels were measured by real-time PCR. β-actin was used as the internal control. The data are expressed as fold changes compared to that in untreated control, which was 100%. The results are the mean ± S.D. for three separate experiments. * p < 0.05 compared to the corresponding untreated control. # p < 0.05 compared to the corresponding SNP treated group.
Ijms 22 07054 g004
Figure 5. The effect of SNP and/or S-Equol on extracellular matrix and MMPs expression of primary chondrocytes. After cells were treated with S-Equol for 24 h in the presence or absence of SNP for another 24 h, (A) glycosaminoglycan (GAG) contents were determined by toluidine blue O staining followed by colorimetric assay; (B) mRNA levels of type II collagen and aggrecan were measured by real-time PCR and β-actin was used as the internal control. The data are expressed as fold changes compared to those in untreated control; (C) MMP-2, MMP-3, MMP-9, and MMP-13 protein levels were measured by Western blotting and β-actin was used as the internal control. The data of the right panel are expressed as the relative density compared to that in untreated cells (control), which was 100%. The results are the mean ± S.D. for three separate experiments. * p < 0.05 compared to the corresponding untreated control. # p < 0.05 compared to the corresponding SNP treated group.
Ijms 22 07054 g005
Figure 6. The effect of SNP and/or S-Equol on nitric oxide (NO) and hydrogen peroxide (H2O2) production of primary chondrocytes. After cells were treated with S-Equol for 24 h in the presence or absence of SNP for another 24 h, (A) NO or (B) H2O2 production was determined by DAF-FM DA or MitoPY1 staining, respectively, followed by flow cytometry. The gray filled area is the untreated control, and those delimited by the purple or red lines are the treated groups. (C) iNOS mRNA (left side) and protein (right side) levels were measured by real-time PCR and Western blotting. β-actin was used as the internal control. The data are expressed as fold changes compared to that in untreated control. The results are expressed as the mean ± S.D. for three separate experiments. * p < 0.05 compared to the untreated control. # p < 0.05 compared to the corresponding SNP treated group.
Ijms 22 07054 g006
Figure 7. The effects of SNP and/or S-Equol on PI3K-Akt pathway of primary chondrocytes. The cells were treated with S-Equol for 24 h in the presence or absence of SNP for another 24 h, and then (A) PI3K, Akt, P-Akt, Mdm2, P-Mdm2, and p53 protein levels were measured by Western blotting and β-actin was used as the internal control. The data in the right panel are expressed as the relative density compared to the untreated cells (control), which was 100%. (B) The cells were pretreated with the 10 μM PI3K inhibitor, LY294002 (LY), for 1 h and then treated with 0.8 mM SNP and/or 30 μM S-Equol for a further 24 h and, subsequently, cell viability was measured using trypan blue exclusion. The data are expressed as a percentage of the control group. The results are the mean ± S.D. for three separate experiments. * p < 0.05 compared to the corresponding untreated control. # p < 0.05 compared to the corresponding SNP treated group. p < 0.05 compared to the corresponding S-Equol combined with SNP treated group.
Ijms 22 07054 g007
Figure 8. Schematic of S-Equol protects chondrocyte against SNP’s damage. Treatment of chondrocyte with SNP could increase p53, intracellular NO and H2O2 levels and decrease mitochondrial membrane potential (ΔΨM). Furthermore, the NO could activate MMPs, resulting in type II collagen and aggrecan degradation. Simultaneously, p53 could increase expressions of pro-apopototic proteins including BIM, PUMA, NOXA, BAX, and BAK, and cause a decrease in anti-apoptotic proteins including Bcl-XL and Bcl-2 expression, resulting in the release of cytochrome c, activation of caspase-9 and caspase-3, and finally the induction of apoptosis. The addition of S-Equol could lessen those effects caused by SNP. Moreover, S-Equol could active the PI3K/Akt pathway, an upstream of apoptosis and NO production, including an increase in phosphorylation of Akt and Mdm2 to inhibit p53 and NO production, by which the apoptosis and matrix degradation caused by SNP are decreased. Red Ijms 22 07054 i001
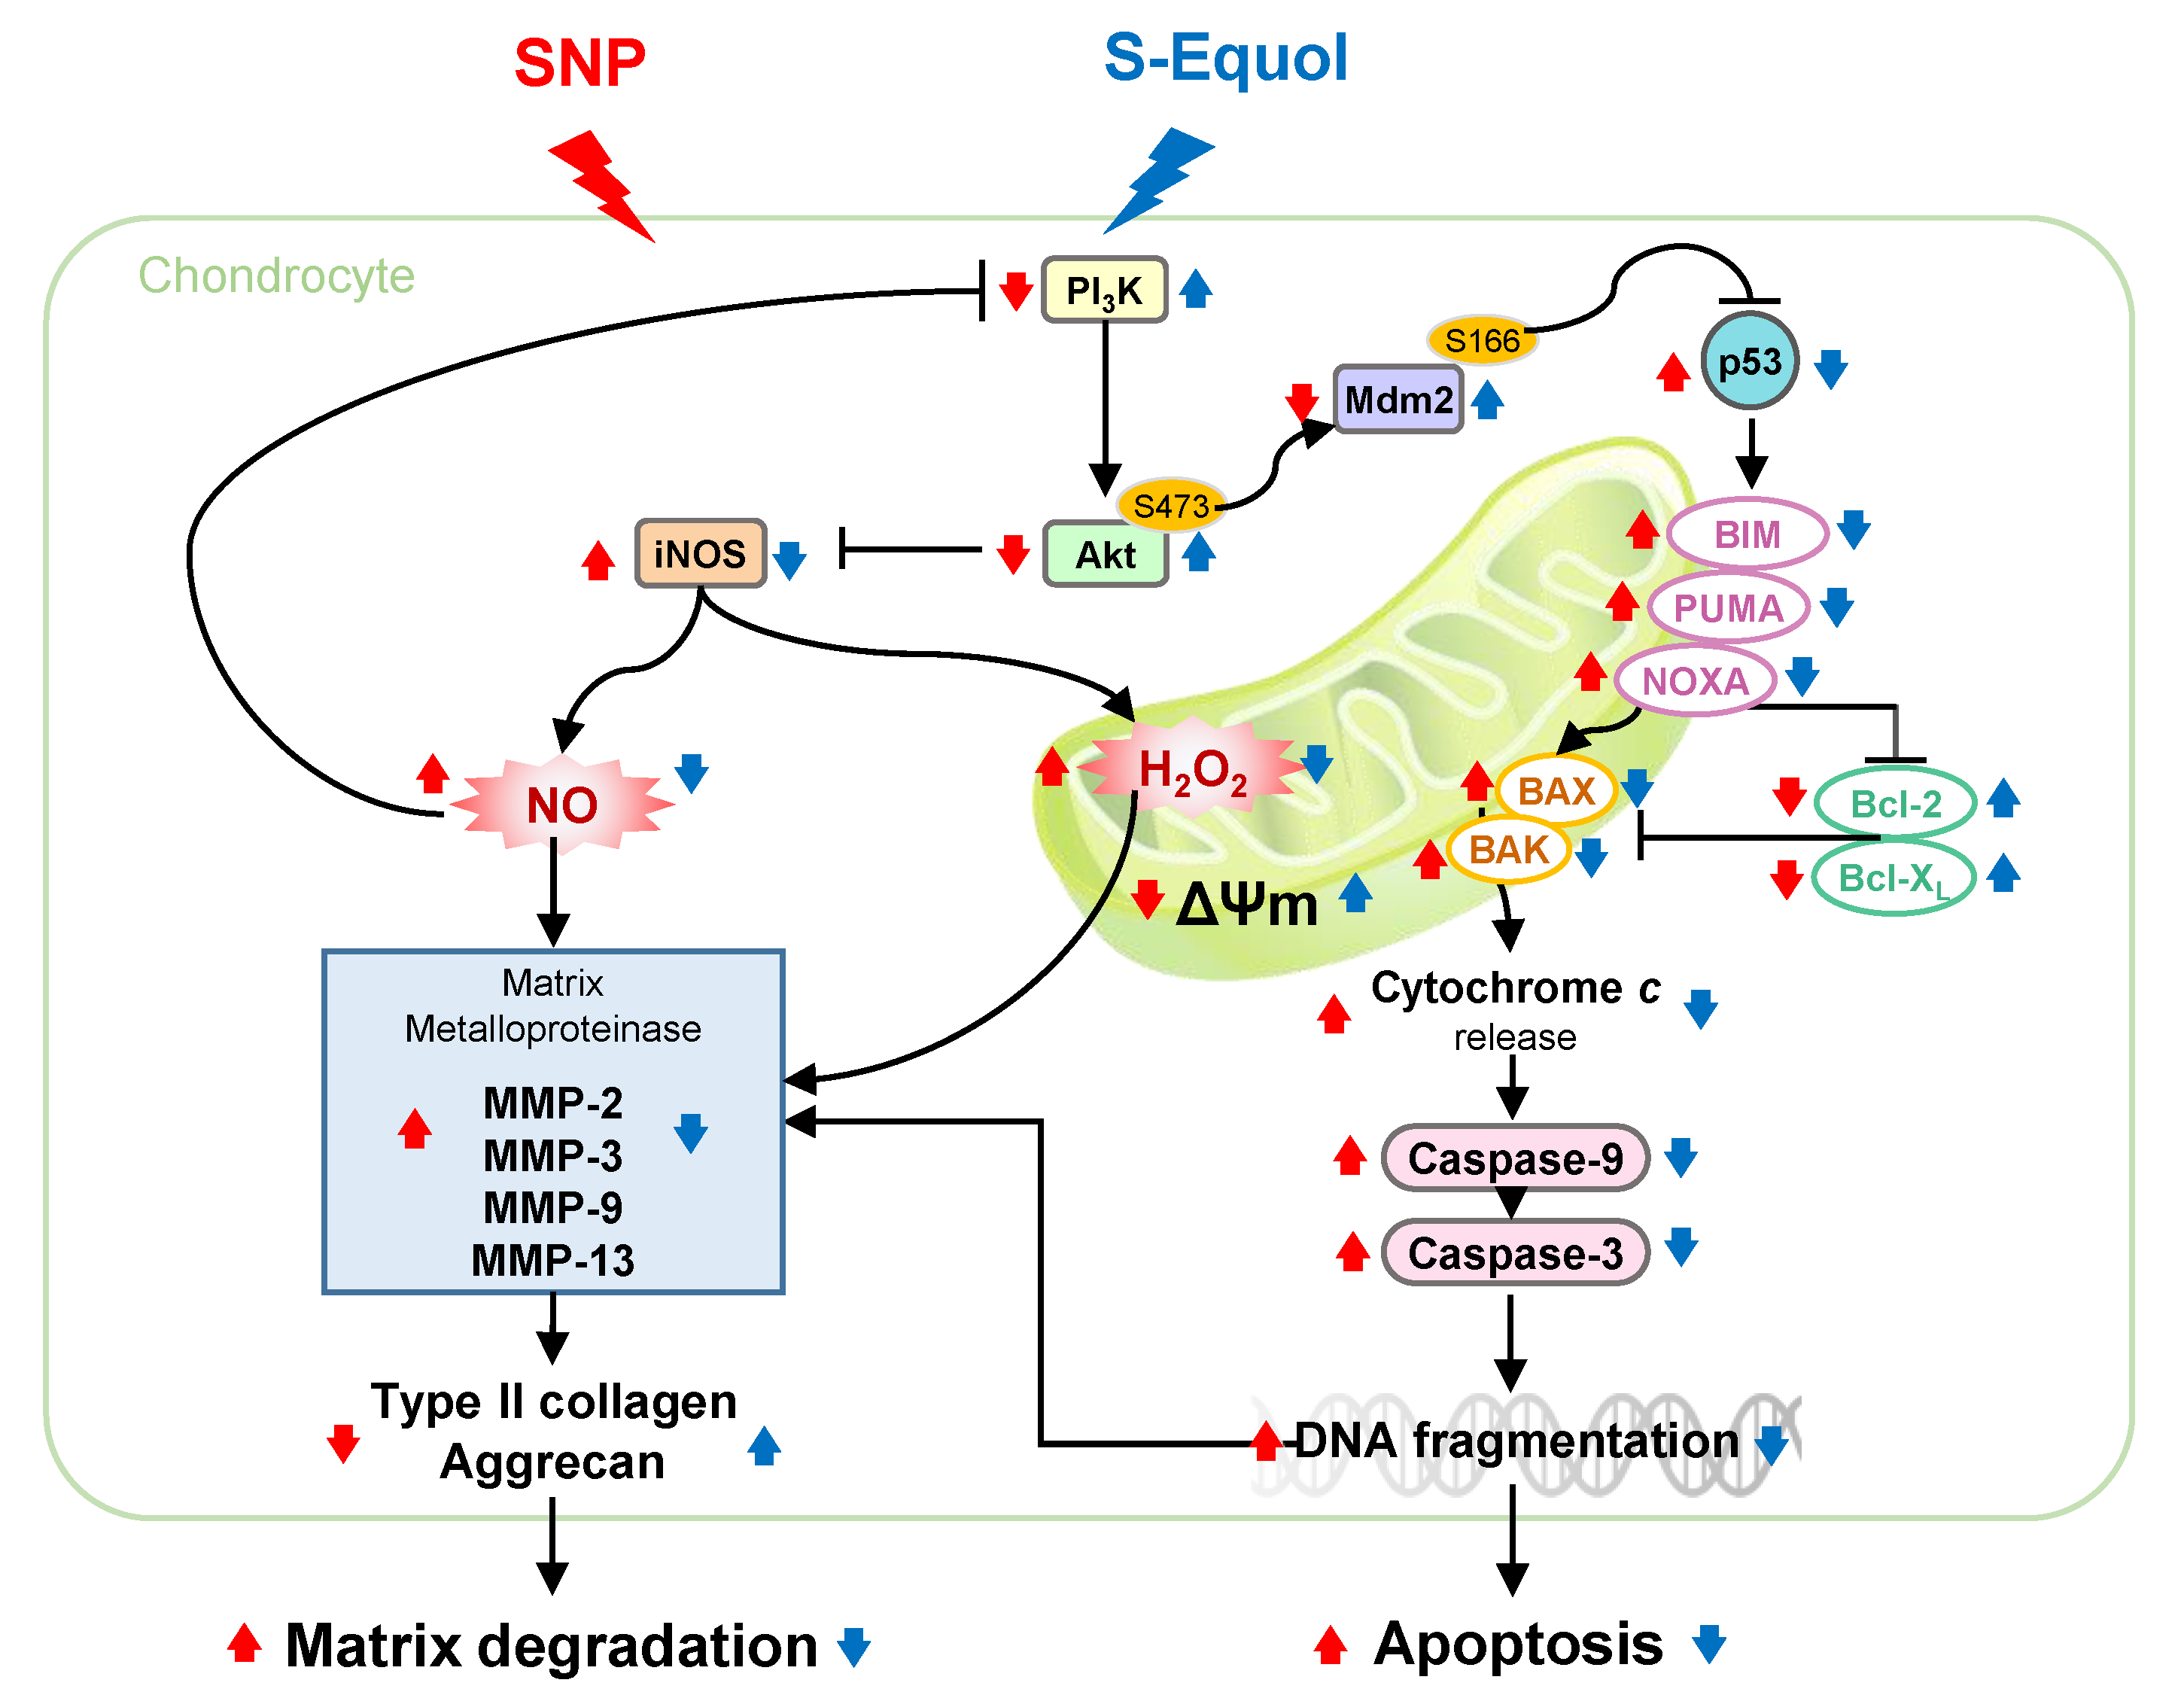
: enhanced by SNP; Red Ijms 22 07054 i002: decreased by SNP; Blue Ijms 22 07054 i001: enhanced by S-Equol; Blue Ijms 22 07054 i002: decreased by S-Equol.
Ijms 22 07054 g008
Table 1. Primer sets for qPCR analysis.
Primer NameNCBI Reference SequencePrimer Sequence (5’->3’)
β-actinEF156276.1F: ACTATCGGCAATGAGCGGTTCC
R: AGCACTGTGTTGGCATAGAGGTC
Type II collagenNM_012929.1F: CGAACCCAAAGGACCCAAAT
R: TCCGGACTGTGAGGTTAGG
AggrecanNM_022190.1F: CGAGTGAACAGCATCTACC
R: GAGTCATTGGAGCGAAGG
iNOS (NOS2)NM_012611.3F: GCTACACTTCCAACGCAACA
R: ATGGTGAACACGTTCTTGGC
BIMNM_171988.2F: GCAAACGATTACCGAGAGGC
R: TCCAGACCAGACGGAAGATG
PUMANM_173837.2F: AAGAGCAACATCGACACCGA
R: TCCAGGATCCCTGGGTAAGG
NOXANM_001008385.1F: GAGTGCACCGGACATAACTG
R: GCTTGGGCTTCTTCTCATCG
Bcl-2NM_016993.1F: CTGGGGATGACTTCTCTCGT
R: GGACATCTCTGCAAAGTCGC
BAKNM_053812.1F: CACCCATGCTCCTGTTATGC
R: CCCACCCTTGCTACATTTGG
BAXNM_017059.2F: TTGGCGATGAACTGGACAAC
R: GTAGAAAAGGGCAACCACCC
iNOS (NOS2): inducible nitric oxide synthase 2; BIM: Bcl-2-like protein 11; PUMA: p53 upregulated modulator of apoptosis; NOXA: phorbol-12-myristate-13-acetate-induced protein 1; Bcl-2: B cell lymphoma 2, apoptosis regulator); BAK: Bcl-2 antagonist/killer 1; BAX: Bcl-2 associated X, apoptosis regulator; F: Forward primer; R: Reverse primer.
Publisher’s Note: MDPI stays neutral with regard to jurisdictional claims in published maps and institutional affiliations.

