
Targeting Lysosomes to Reverse Hydroquinone-Induced Autophagy Defects and Oxidative Damage in Human Retinal Pigment Epithelial Cells

 , , , , and
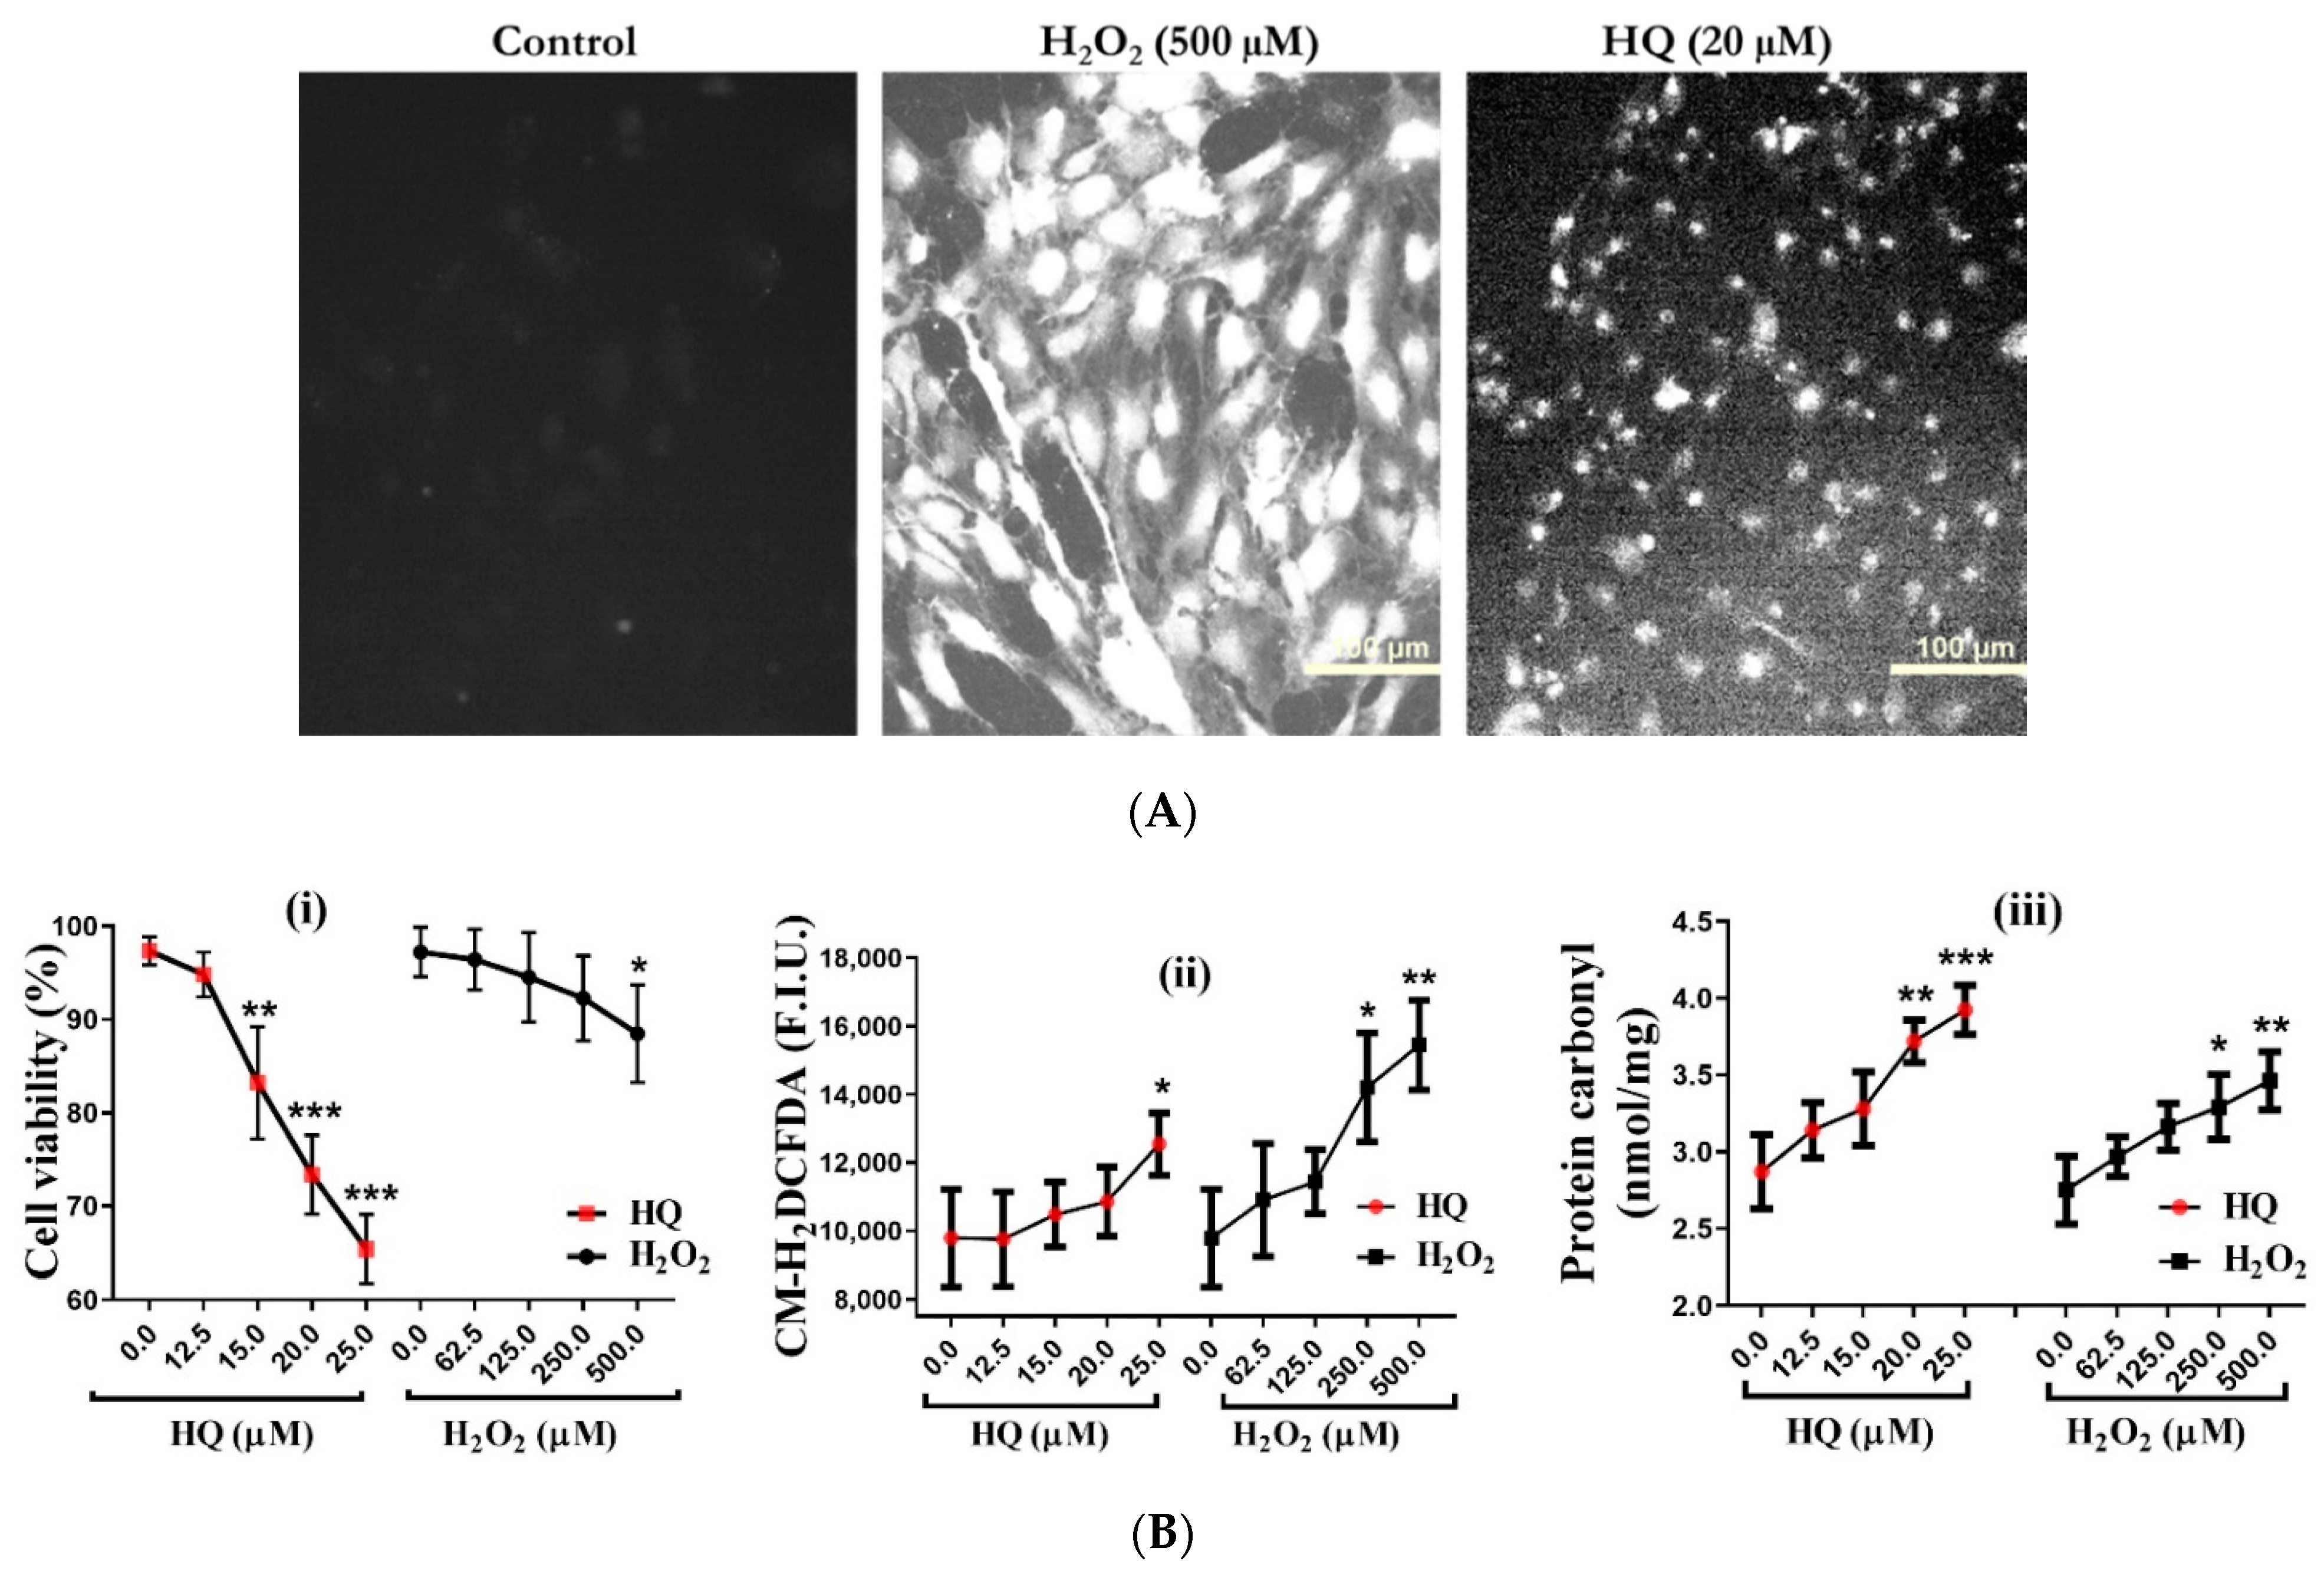
Abstract
:1. Introduction
2. Results
2.1. Comparative Vulnerability of RPE Cells to HQ-Induced Oxidative Damage
2.2. HQ-Induced Mitochondrial Dysfunction
2.3. HQ Impairs Autophagy Flux in RPE Cells
2.4. HQ Does Not Downregulate TFEB or Downstream Autophagy Genes
2.5. HQ Downregulates LAMP2 and Cathepsin D Expression
2.6. HQ Induces Lysosomal Alkalization
2.7. HQ Upregulates Proteasome Activity in RPE Cells
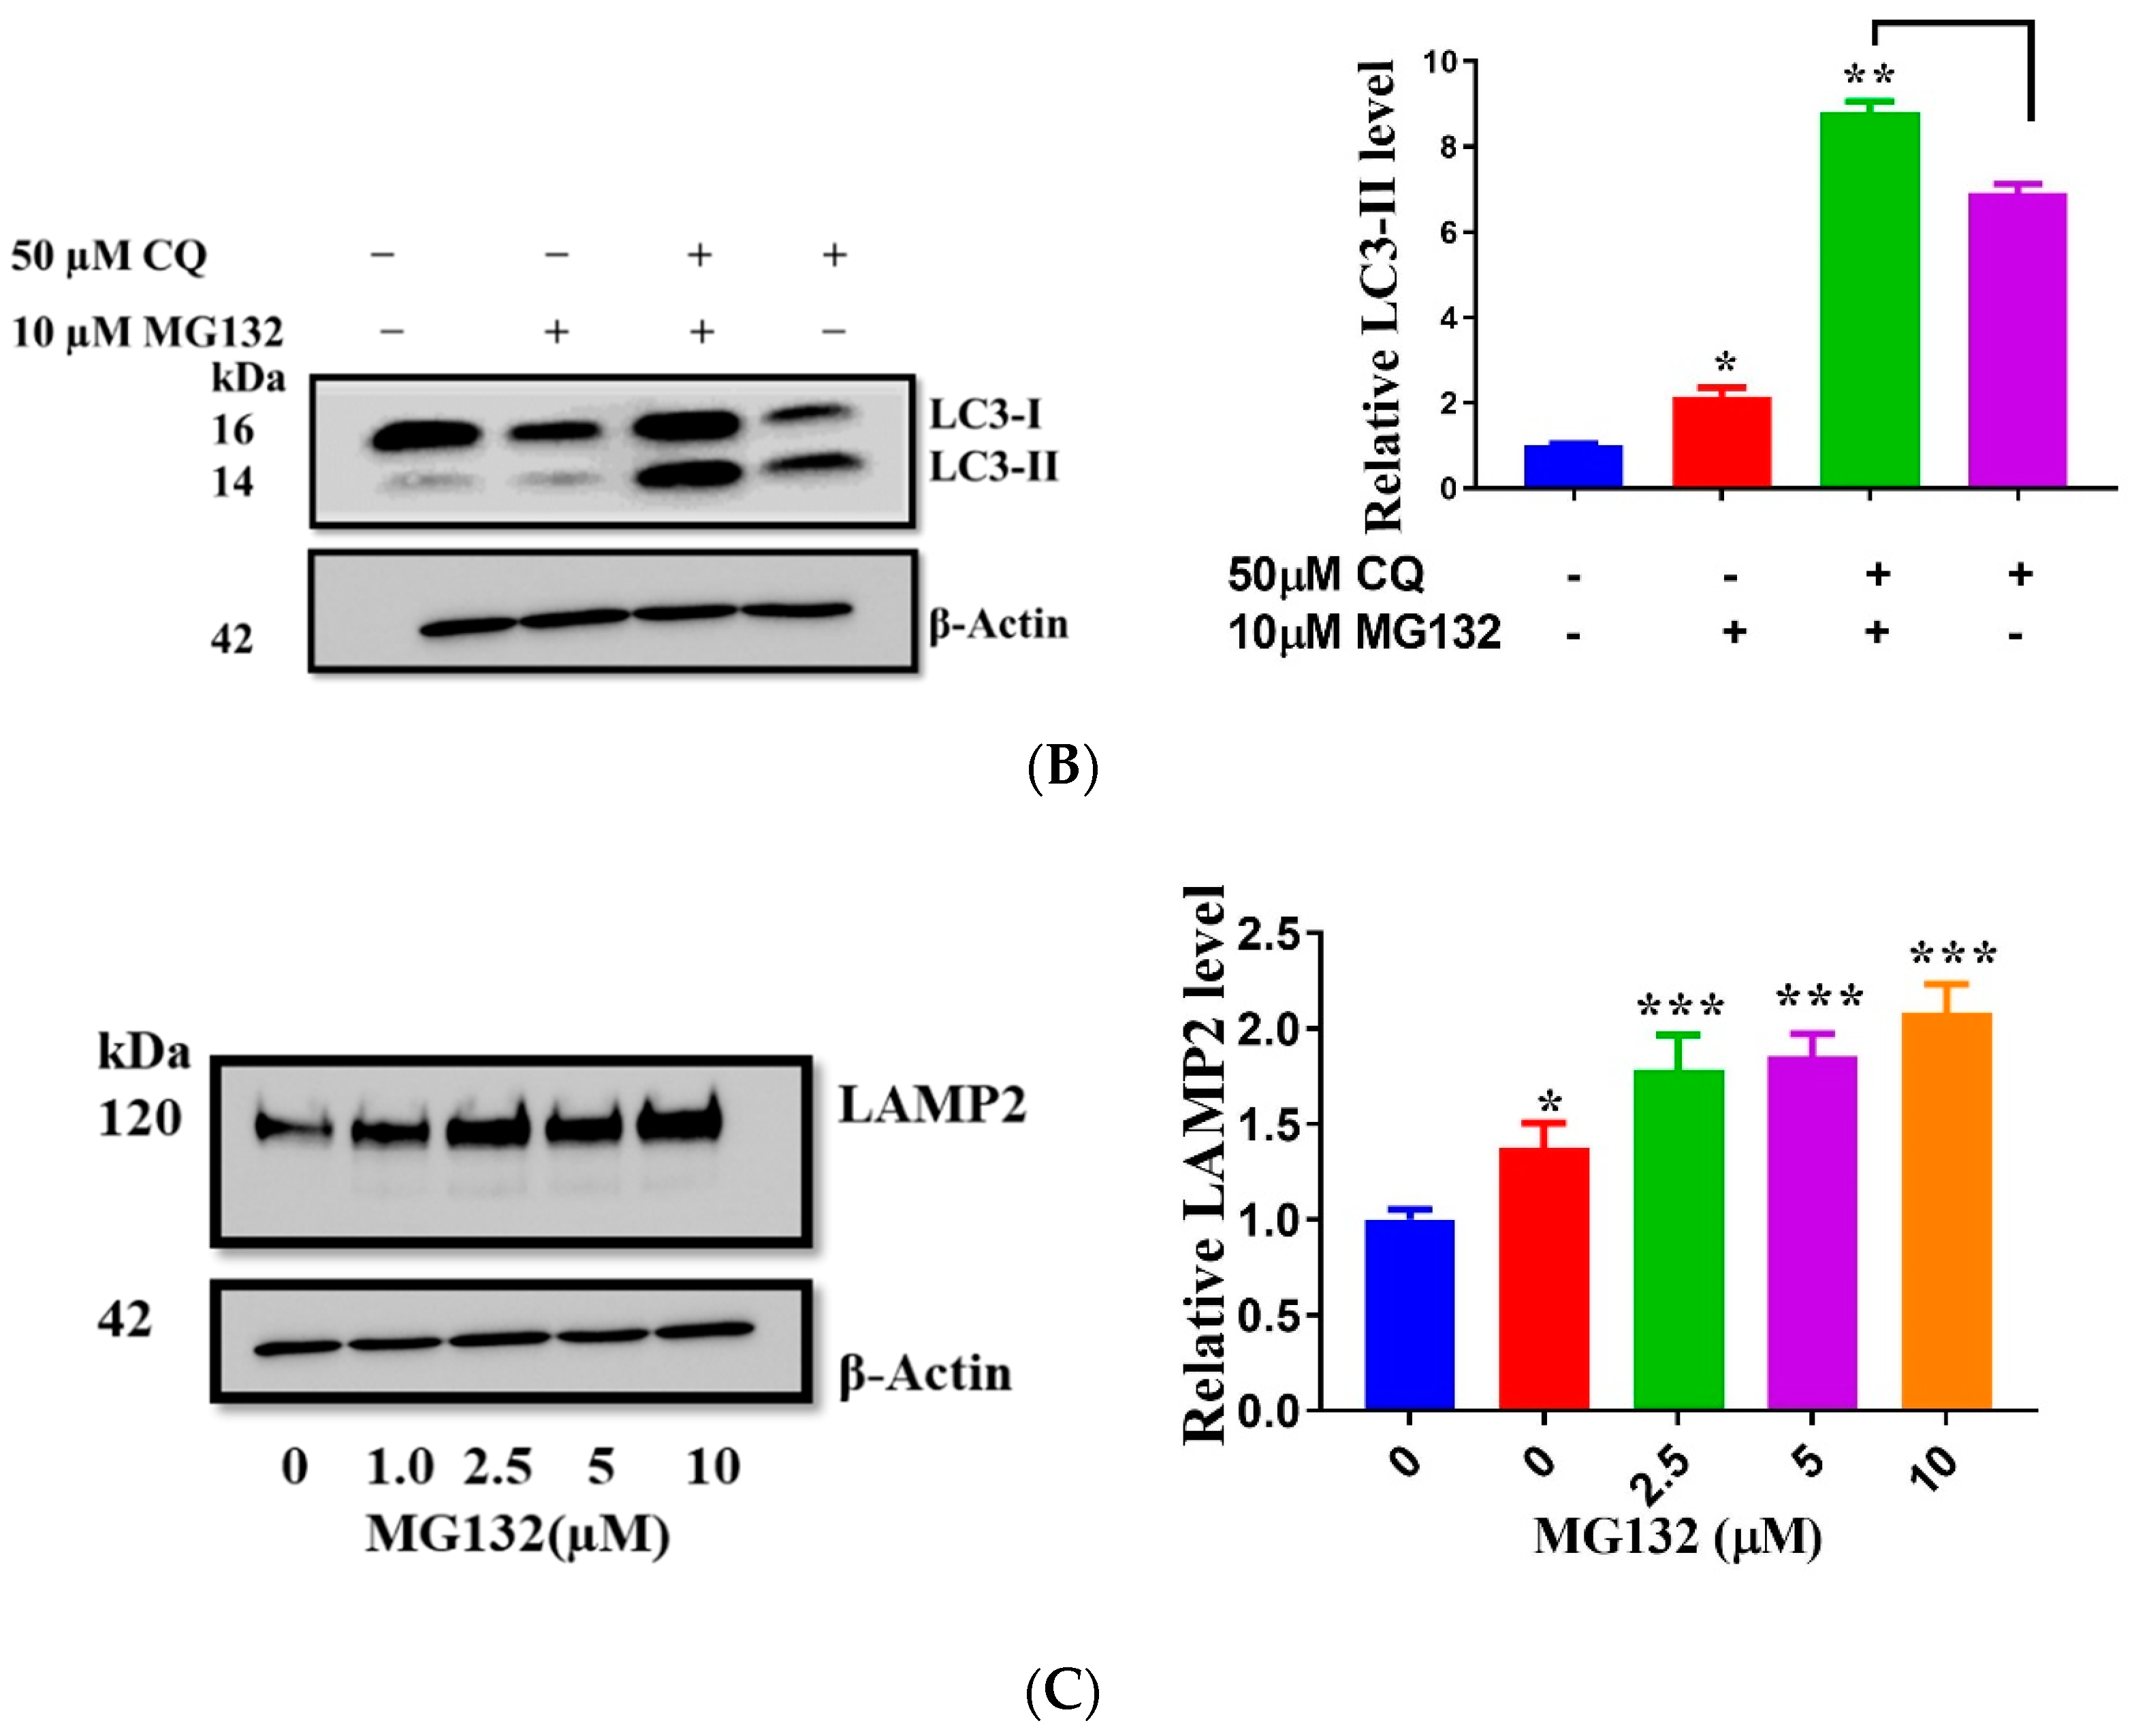
2.8. MG132 Stabilizes Lysosomes, Improves Autophagy, and Protects against Oxidative Damage
3. Discussion
3.1. Autophagy and Its Protective Role in Oxidative Stress
3.2. Lysosomal Dysfunction Underlying HQ-Induced Autophagy Deficit and RPE Damage
3.3. Role of Autophagy and UPS Crosstalk in HQ-Induced Oxidative Stress
3.4. Conclusions
4. Materials and Methods
4.1. Cell Culture and Treatment
4.2. Cell Viability Assay
4.3. Intracellular ROS Assay
4.4. Live Cell Intra-Lysosomal pH Measurement
4.5. Mitochondrial Membrane Potential
4.6. Mitochondrial Morphology Using Confocal Microscopy
4.7. Flow Cytometry with Annexin V-FITC/PI
4.8. Autophagosome Accumulation Assessment by GFP-LC3 Puncta
4.9. Protein Carbonyl Assay
4.10. Proteasome Activity Assay
4.11. Western Blot
4.12. shRNA Knockdown of ATG5
4.13. RNA Extraction and Quantitative RT-PCR
4.14. Data Analysis
Supplementary Materials
Author Contributions
Funding
Data Availability Statement
Acknowledgments
Conflicts of Interest
References
- Liguori, I.; Russo, G.; Curcio, F.; Bulli, G.; Aran, L.; Della-Morte, D.; Gargiulo, G.; Testa, G.; Cacciatore, F.; Bonaduce, D.; et al. Oxidative stress, aging, and diseases. Clin. Interv. Aging 2018, 13, 757. [Google Scholar] [CrossRef] [Green Version]
- Islam, M.T. Oxidative stress and mitochondrial dysfunction-linked neurodegenerative disorders. Neurol. Res. 2017, 39, 73–82. [Google Scholar] [CrossRef]
- Fedorova, M.; Bollineni, R.C.; Hoffmann, R. Protein carbonylation as a major hallmark of oxidative damage: Update of analytical strategies. Mass Spectrom. Rev. 2014, 33, 79–97. [Google Scholar] [CrossRef]
- Giordano, S.; Darley-Usmar, V.; Zhang, J. Autophagy as an essential cellular antioxidant pathway in neurodegenerative disease. Redox Biol. 2014, 2, 82–90. [Google Scholar] [CrossRef] [Green Version]
- Birben, E.; Sahiner, U.M.; Sackesen, C.; Erzurum, S.; Kalayci, O. Oxidative stress and antioxidant defense. World Allergy Organ. J. 2012, 5, 9–19. [Google Scholar] [CrossRef] [Green Version]
- Shang, F.; Taylor, A. Ubiquitin–proteasome pathway and cellular responses to oxidative stress. Free Radic. Biol. Med. 2011, 51, 5–16. [Google Scholar] [CrossRef] [Green Version]
- Nam, T.; Han, J.H.; Devkota, S.; Lee, H.-W. Emerging Paradigm of Crosstalk between Autophagy and the Ubiquitin-Proteasome System. Mol. Cells 2017, 40, 897–905. [Google Scholar] [CrossRef]
- Ji, C.H.; Kwon, Y.T. Crosstalk and Interplay between the Ubiquitin-Proteasome System and Autophagy. Mol. Cells 2017, 40, 441. [Google Scholar] [CrossRef] [Green Version]
- Enguita, F.J.; Leitão, A.L. Hydroquinone: Environmental Pollution, Toxicity, and Microbial Answers. BioMed Res. Int. 2013, 2013, 1–14. [Google Scholar] [CrossRef] [Green Version]
- Abokyi, S.; To, C.H.; Lam, T.T.; Tse, D.Y. Central Role of Oxidative Stress in Age-Related Macular Degeneration: Evidence from a Review of the Molecular Mechanisms and Animal Models. Oxid. Med. Cell. Longev. 2020, 2020, 7901270. [Google Scholar] [CrossRef] [Green Version]
- Lauwen, S.; de Jong, E.K.; Lefeber, D.J.; den Hollander, A.I. Omics Biomarkers in Ophthalmology. Investig. Opthalmology Vis. Sci. 2017, 58, BIO88-98. [Google Scholar] [CrossRef] [Green Version]
- Chakravarthy, U.; Augood, C.; Bentham, G.C.; de Jong, P.T.V.M.; Rahu, M.; Seland, J.; Soubrane, G.; Tomazzoli, L.; Topouzis, F.; Vingerling, J.R.; et al. Cigarette Smoking and Age-Related Macular Degeneration in the EUREYE Study. Ophthalmology 2007, 114, 1157–1163. [Google Scholar] [CrossRef]
- Deisinger, P.J.; Hill, T.S.; English, J.C. Human exposure to naturally occurring hydroquinone. J. Toxicol. Environ. Health 1996, 47, 31–46. [Google Scholar] [CrossRef]
- Espinosa-Heidmann, D.G.; Suner, I.J.; Catanuto, P.; Hernandez, E.P.; Marin-Castano, M.E.; Cousins, S.W. Cigarette smoke-related oxidants and the development of sub-RPE deposits in an experimental animal model of dry AMD. Investig. Ophthalmol. Vis. Sci. 2006, 47, 729–737. [Google Scholar] [CrossRef] [Green Version]
- Marin-Castaño, M.E.; Striker, G.E.; Alcazar, O.; Catanuto, P.; Espinosa-Heidmann, D.G.; Cousins, S.W. Repetitive nonlethal oxidant injury to retinal pigment epithelium decreased extracellular matrix turnover in vitro and induced Sub-RPE deposits in vivo. Investig. Ophthalmol. Vis. Sci. 2006, 47, 4098–4112. [Google Scholar] [CrossRef] [Green Version]
- Wang, A.L.; Lukas, T.J.; Yuan, M.; Du, N.; Handa, J.T.; Neufeld, A.H. Changes in retinal pigment epithelium related to cigarette smoke: Possible relevance to smoking as a risk factor for age-related macular degeneration. PLoS ONE 2009, 4, e5304. [Google Scholar] [CrossRef]
- Cao, S.; Walker, G.B.; Wang, X.; Cui, J.Z.; Matsubara, J.A. Altered cytokine profiles of human retinal pigment epithelium: Oxidant injury and replicative senescence. Mol. Vis. 2013, 19, 718–728. [Google Scholar]
- Abokyi, S.; wan Shan, S.; To, C.; Chan, H.H.; Tse, D.Y. Autophagy Upregulation by the TFEB Inducer Trehalose Protects against Oxidative Damage and Cell Death Associated with NRF2 Inhibition in Human RPE Cells. Oxid. Med. Cell. Longev. 2020, 2020, 1–18. [Google Scholar] [CrossRef]
- Lu, L.; Hackett, S.F.; Mincey, A.; Lai, H.; Campochiaro, P.A. Effects of different types of oxidative stress in RPE cells. J. Cell. Physiol. 2006, 206, 119–125. [Google Scholar] [CrossRef]
- Gough, D.R.; Cotter, T.G. Hydrogen peroxide: A Jekyll and Hyde signalling molecule. Cell Death Dis. 2011, 2, e213. [Google Scholar] [CrossRef] [Green Version]
- Deisinger, P.J.; English, J.C. Bioavailability and metabolism of hydroquinone after intratracheal instillation in male rats. Drug Metab. Dispos. 1999, 27, 442–448. [Google Scholar]
- Smith, M.T.; Zhang, L.; Jeng, M.; Wang, Y.; Guo, W.; Duramad, P.; Hubbard, A.E.; Hofstadler, G.; Holland, N.T. Hydroquinone, a benzene metabolite, increases the level of aneusomy of chromosomes 7 and 8 in human CD34-positive blood progenitor cells. Carcinogenesis 2000, 21, 1485–1490. [Google Scholar] [CrossRef]
- Kerzic, P.J.; Liu, W.S.; Pan, M.T.; Fu, H.; Zhou, Y.; Schnatter, A.R.; Irons, R.D. Analysis of hydroquinone and catechol in peripheral blood of benzene-exposed workers. Chem. Biol. Interact. 2010, 184, 182–188. [Google Scholar] [CrossRef]
- Halliwell, B.; Clement, M.V.; Ramalingam, J.; Long, L.H. Hydrogen Peroxide. Ubiquitous in Cell Culture and In Vivo? IUBMB Life 2001, 50, 251–257. [Google Scholar] [CrossRef]
- Munro, D.; Treberg, J.R. A radical shift in perspective: Mitochondria as regulators of reactive oxygen species. J. Exp. Biol. 2017, 220, 1170–1180. [Google Scholar] [CrossRef] [Green Version]
- Karbowski, M.; Youle, R.J. Dynamics of mitochondrial morphology in healthy cells and during apoptosis. Cell Death Differ. 2003, 10, 870–880. [Google Scholar] [CrossRef] [Green Version]
- Zorova, L.D.; Popkov, V.A.; Plotnikov, E.J.; Silachev, D.N.; Pevzner, I.B.; Jankauskas, S.S.; Zorov, S.D.; Babenko, V.A.; Zorov, D.B. Functional Significance of the Mitochondrial Membrane Potential. Biochem. Suppl. Ser. A Membr. Cell Biol. 2018, 12, 20–26. [Google Scholar] [CrossRef]
- Yang, P.; Shao, Z.; Besley, N.A.; Neal, S.E.; Buehne, K.L.; Park, J.; Karageozian, H.; Karageozian, V.; Ryde, I.T.; Meyer, J.N.; et al. Risuteganib Protects against Hydroquinone–induced Injury in Human RPE Cells. Investig. Opthalmology Vis. Sci. 2020, 61, 35. [Google Scholar] [CrossRef]
- Carlsson, S.R.; Simonsen, A. Membrane dynamics in autophagosome biogenesis. J. Cell Sci. 2015, 128, 193–205. [Google Scholar] [CrossRef] [Green Version]
- Mizushima, N.; Yoshimori, T. How to interpret LC3 immunoblotting. Autophagy 2007, 3, 542–545. [Google Scholar] [CrossRef]
- Yoshii, S.R.; Mizushima, N. Monitoring and measuring autophagy. Int. J. Mol. Sci. 2017, 18, 1865. [Google Scholar] [CrossRef]
- Mauthe, M.; Orhon, I.; Rocchi, C.; Zhou, X.; Luhr, M.; Hijlkema, K.J.; Coppes, R.P.; Engedal, N.; Mari, M.; Reggiori, F. Chloroquine inhibits autophagic flux by decreasing autophagosome-lysosome fusion. Autophagy 2018, 14, 1435–1455. [Google Scholar] [CrossRef]
- Chen, P.M.; Gombart, Z.J.; Chen, J.W. Chloroquine treatment of ARPE-19 cells leads to lysosome dilation and intracellular lipid accumulation: Possible implications of lysosomal dysfunction in macular degeneration. Cell Biosci. 2011, 1, 1–10. [Google Scholar] [CrossRef] [Green Version]
- He, Y.; Li, S.; Zhang, W.; Dai, W.; Cui, T.; Wang, G.; Gao, T.; Li, C. Dysregulated autophagy increased melanocyte sensitivity to H2O2-induced oxidative stress in vitiligo. Sci. Rep. 2017, 7, srep42394. [Google Scholar] [CrossRef]
- Szatmári-Tóth, M.; Kristóf, E.; Veréb, Z.; Akhtar, S.; Facskó, A.; Fésüs, L.; Kauppinen, A.; Kaarniranta, K.; Petrovski, G. Clearance of autophagy-associated dying retinal pigment epithelial cells – a possible source for inflammation in age-related macular degeneration. Cell Death Dis. 2016, 7, e2367. [Google Scholar] [CrossRef]
- Settembre, C.; Di Malta, C.; Polito, V.A.; Arencibia, M.G.; Vetrini, F.; Erdin, S.; Erdin, S.U.; Huynh, T.; Medina, D.; Colella, P.; et al. TFEB links autophagy to lysosomal biogenesis. Science 2011, 332, 1429–1433. [Google Scholar] [CrossRef] [Green Version]
- Settembre, C.; De Cegli, R.; Mansueto, G.; Saha, P.K.; Vetrini, F.; Visvikis, O.; Huynh, T.; Carissimo, A.; Palmer, D.; Jürgen Klisch, T.; et al. TFEB controls cellular lipid metabolism through a starvation-induced autoregulatory loop. Nat. Cell Biol. 2013, 15, 647–658. [Google Scholar] [CrossRef] [PubMed] [Green Version]
- Hubert, V.; Peschel, A.; Langer, B.; Gröger, M.; Rees, A.; Kain, R. LAMP-2 is required for incorporating syntaxin-17 into autophagosomes and for their fusion with lysosomes. Biol. Open 2016. [Google Scholar] [CrossRef] [PubMed] [Green Version]
- Cui, L.; Zhao, L.-P.; Ye, J.-Y.; Yang, L.; Huang, Y.; Jiang, X.-P.; Zhang, Q.; Jia, J.-Z.; Zhang, D.-X.; Huang, Y. The Lysosomal Membrane Protein Lamp2 Alleviates Lysosomal Cell Death by Promoting Autophagic Flux in Ischemic Cardiomyocytes. Front. Cell Dev. Biol. 2020, 8, 31. [Google Scholar] [CrossRef] [Green Version]
- Zaidi, N.; Maurer, A.; Nieke, S.; Kalbacher, H. Cathepsin D: A cellular roadmap. Biochem. Biophys. Res. Commun. 2008, 376, 5–9. [Google Scholar] [CrossRef] [PubMed]
- Eskelinen, E.L.; Illert, A.L.; Tanaka, Y.; Schwarzmann, G.; Blanz, J.; Von Figura, K.; Saftig, P. Role of LAMP-2 in lysosome biogenesis and autophagy. Mol. Biol. Cell 2002, 13, 3355–3368. [Google Scholar] [CrossRef] [Green Version]
- Guha, S.; Baltazar, G.C.; Coffey, E.E.; Tu, L.A.; Lim, J.C.; Beckel, J.M.; Patel, S.; Eysteinsson, T.; Lu, W.; O’Brien-Jenkins, A.; et al. Lysosomal alkalinization, lipid oxidation, and reduced phagosome clearance triggered by activation of the P2X7 receptor. FASEB J. 2013, 27, 4500–4509. [Google Scholar] [CrossRef] [Green Version]
- Liu, J.; Lu, W.; Reigada, D.; Nguyen, J.; Laties, A.M.; Mitchell, C.H. Restoration of Lysosomal pH in RPE Cells from Cultured Human and ABCA4 −/− Mice: Pharmacologic Approaches and Functional Recovery. Investig. Opthalmology Vis. Sci. 2008, 49, 772. [Google Scholar] [CrossRef] [Green Version]
- Wang, D.; Xu, Q.; Yuan, Q.; Jia, M.; Niu, H.; Liu, X.; Zhang, J.; Young, C.Y.; Yuan, H. Proteasome inhibition boosts autophagic degradation of ubiquitinated-AGR2 and enhances the antitumor efficiency of bevacizumab. Oncogene 2019, 38, 3458–3474. [Google Scholar] [CrossRef] [Green Version]
- Li, C.; Wang, X.; Li, X.; Qiu, K.; Jiao, F.; Liu, Y.; Kong, Q.; Liu, Y.; Wu, Y. Proteasome Inhibition Activates Autophagy-Lysosome Pathway Associated With TFEB Dephosphorylation and Nuclear Translocation. Front. Cell Dev. Biol. 2019, 7, 170. [Google Scholar] [CrossRef] [Green Version]
- Zhang, X.; Zhou, J.; Fernandes, A.F.; Sparrow, J.R.; Pereira, P.; Taylor, A.; Shang, F. The Proteasome: A Target of Oxidative Damage in Cultured Human Retina Pigment Epithelial Cells. Investig. Opthalmology Vis. Sci. 2008, 49, 3622. [Google Scholar] [CrossRef]
- Fernandes, A.F.; Zhou, J.; Zhang, X.; Bian, Q.; Sparrow, J.; Taylor, A.; Pereira, P.; Shang, F. Oxidative Inactivation of the Proteasome in Retinal Pigment Epithelial Cells. J. Biol. Chem. 2008, 283, 20745–20753. [Google Scholar] [CrossRef] [PubMed] [Green Version]
- Brojatsch, J.; Lima, H.; Kar, A.K.; Jacobson, L.S.; Muehlbauer, S.M.; Chandran, K.; Diaz-Griffero, F. A Proteolytic Cascade Controls Lysosome Rupture and Necrotic Cell Death Mediated by Lysosome-Destabilizing Adjuvants. PLoS ONE 2014, 9, e95032. [Google Scholar] [CrossRef] [PubMed]
- Sparrrow, J.R.; Hicks, D.; Hamel, C.P. The Retinal Pigment Epithelium in Health and Disease. Curr. Mol. Med. 2010. [Google Scholar] [CrossRef] [PubMed]
- Strauss, O. The Retinal Pigment Epithelium in Visual Function. Physiol. Rev. 2005, 85, 845–881. [Google Scholar] [CrossRef] [Green Version]
- Kaarniranta, K.; Tokarz, P.; Koskela, A.; Paterno, J.; Blasiak, J. Autophagy regulates death of retinal pigment epithelium cells in age-related macular degeneration. Cell Biol. Toxicol. 2017, 33, 113–128. [Google Scholar] [CrossRef] [Green Version]
- Galluzzi, L.; Bravo-San Pedro, J.M.; Levine, B.; Green, D.R.; Kroemer, G. Pharmacological modulation of autophagy: Therapeutic potential and persisting obstacles. Nat. Rev. Drug Discov. 2017, 16, 487–511. [Google Scholar] [CrossRef] [Green Version]
- Ferrington, D.A.; Sinha, D.; Kaarniranta, K. Defects in retinal pigment epithelial cell proteolysis and the pathology associated with age-related macular degeneration. Prog. Retin. Eye Res. 2016, 51, 69–89. [Google Scholar] [CrossRef] [Green Version]
- Qian, S.; Han, Y.; Shi, Y.; Xu, W.; Zhu, Y.; Jiang, S.; Chen, Y.; Yu, Z.; Zhang, S.; Yang, Y.; et al. Benzene induces haematotoxicity by promoting deacetylation and autophagy. J. Cell. Mol. Med. 2019, 23, 1022–1033. [Google Scholar] [CrossRef] [Green Version]
- Chiou, J.T.; Huang, C.H.; Lee, Y.C.; Wang, L.J.; Shi, Y.J.; Chen, Y.J.; Chang, L. Sen Compound C induces autophagy and apoptosis in parental and hydroquinone-selected malignant leukemia cells through the ROS/p38 MAPK/AMPK/TET2/FOXP3 axis. Cell Biol. Toxicol. 2020. [Google Scholar] [CrossRef] [PubMed]
- Xu, L.; Liu, J.; Chen, Y.; Yun, L.; Chen, S.; Zhou, K.; Lai, B.; Song, L.; Yang, H.; Liang, H.; et al. Inhibition of autophagy enhances Hydroquinone-induced TK6 cell death. Toxicol. Vitr. 2017. [Google Scholar] [CrossRef] [PubMed]
- Wang, A.L.; Lukas, T.J.; Yuan, M.; Du, N.; Tso, M.O.; Neufeld, A.H. Autophagy and Exosomes in the Aged Retinal Pigment Epithelium: Possible Relevance to Drusen Formation and Age-Related Macular Degeneration. PLoS ONE 2009, 4, e4160. [Google Scholar] [CrossRef] [Green Version]
- Pivtoraiko, V.N.; Stone, S.L.; Roth, K.A.; Shacka, J.J. Oxidative stress and autophagy in the regulation of lysosome-dependent neuron death. Antioxidants Redox Signal. 2009, 11, 481–496. [Google Scholar] [CrossRef] [PubMed] [Green Version]
- Pascua-Maestro, R.; Diez-Hermano, S.; Lillo, C.; Ganfornina, M.D.; Sanchez, D. Protecting cells by protecting their vulnerable lysosomes: Identification of a new mechanism for preserving lysosomal functional integrity upon oxidative stress. PLOS Genet. 2017, 13, e1006603. [Google Scholar] [CrossRef]
- Schwake, M.; Schröder, B.; Saftig, P. Lysosomal Membrane Proteins and Their Central Role in Physiology. Traffic 2013, 14, 739–748. [Google Scholar] [CrossRef] [PubMed]
- Settembre, C.; Ballabio, A. TFEB regulates autophagy: An integrated coordination of cellular degradation and recycling processes. Autophagy 2011, 7, 1379–1381. [Google Scholar] [CrossRef] [Green Version]
- Ma, L.; Ouyang, Q.; Werthmann, G.C.; Thompson, H.M.; Morrow, E.M. Live-cell Microscopy and Fluorescence-based Measurement of Luminal pH in Intracellular Organelles. Front. Cell Dev. Biol. 2017, 5. [Google Scholar] [CrossRef] [PubMed] [Green Version]
- Nicholls, D.G.; Ferguson, S.J. Ion Transport across Energy-Conserving Membranes. In Bioenergetics; Elsevier: Amsterdam, The Netherlands, 2013; pp. 13–25. [Google Scholar]
- Perry, S.W.; Norman, J.P.; Barbieri, J.; Brown, E.B.; Gelbard, H.A. Mitochondrial membrane potential probes and the proton gradient: A practical usage guide. Biotechniques 2011, 50, 98–115. [Google Scholar] [CrossRef]
- Puleston, D. Detection of Mitochondrial Mass, Damage, and Reactive Oxygen Species by Flow Cytometry. Cold Spring Harb. Protoc. 2015, 2015, pdb.prot086298. [Google Scholar] [CrossRef] [PubMed]
- Henry, C.M.; Hollville, E.; Martin, S.J. Measuring apoptosis by microscopy and flow cytometry. Methods 2013, 61, 90–97. [Google Scholar] [CrossRef] [PubMed]


Publisher’s Note: MDPI stays neutral with regard to jurisdictional claims in published maps and institutional affiliations. |
© 2021 by the authors. Licensee MDPI, Basel, Switzerland. This article is an open access article distributed under the terms and conditions of the Creative Commons Attribution (CC BY) license (https://creativecommons.org/licenses/by/4.0/).
Share and Cite
Abokyi, S.; Shan, S.-W.; Lam, C.H.-I.; Catral, K.P.; Pan, F.; Chan, H.H.-L.; To, C.-H.; Tse, D.Y.-Y. Targeting Lysosomes to Reverse Hydroquinone-Induced Autophagy Defects and Oxidative Damage in Human Retinal Pigment Epithelial Cells. Int. J. Mol. Sci. 2021, 22, 9042. https://0-doi-org.brum.beds.ac.uk/10.3390/ijms22169042
Abokyi S, Shan S-W, Lam CH-I, Catral KP, Pan F, Chan HH-L, To C-H, Tse DY-Y. Targeting Lysosomes to Reverse Hydroquinone-Induced Autophagy Defects and Oxidative Damage in Human Retinal Pigment Epithelial Cells. International Journal of Molecular Sciences. 2021; 22(16):9042. https://0-doi-org.brum.beds.ac.uk/10.3390/ijms22169042
Chicago/Turabian StyleAbokyi, Samuel, Sze-Wan Shan, Christie Hang-I Lam, Kirk Patrick Catral, Feng Pan, Henry Ho-Lung Chan, Chi-Ho To, and Dennis Yan-Yin Tse. 2021. "Targeting Lysosomes to Reverse Hydroquinone-Induced Autophagy Defects and Oxidative Damage in Human Retinal Pigment Epithelial Cells" International Journal of Molecular Sciences 22, no. 16: 9042. https://0-doi-org.brum.beds.ac.uk/10.3390/ijms22169042