
The Crosstalk between SARS-CoV-2 Infection and the RAA System in Essential Hypertension—Analyses Using Systems Approach


Abstract
:
1. Introduction
1.1. Research Context
1.2. Biological Background
- (1)
- The dysregulated RAA system;
- (2)
- The sodium balance disturbances (according to the new Tietze model [15]). Tietze has revealed that sodium, which is crucial for hypertension, can be osmotically immobilized by binding to polymerized glycosaminoglycans (GAGs) in the interstitial water space, and this is not related to water retention, see [16]. This sodium load causes an influx of mononuclear phagocyte system cells (MPS) into the interstitial water space. Here, MPS secrete a tonicity enhancer-binding protein (TonEBP), which, in turn, activates osmoprotective genes, including vascular endothelial growth factor (VEGF-C). The latter binds to the VEGFR3 receptor, stimulating lymphangiogenesis and lymphatic transport of the interstitial fluid [17]. It also binds to the VEGFR2 receptor and stimulates the synthesis of NO;
- (3)
- The influence of immunological phenomena in the regulation of sodium balance and for the maintenance of angiotensin II-induced hypertension [18]. Since the Th17-IL-17 axis is believed to be hypertensive [19], the role of lymphocytes, mainly Th17, producing IL-17, in response to IL-23, as demonstrated in many autoimmune diseases, has been indicated in the model. Besides, the detrimental effect of other pro-inflammatory cytokines such as IFN- and TNF- in the pathogenesis of hypertension has been stressed;
- (4)
- An impact of the inflammatory processes (a role of the hypertension-specific neoantigens, newly formed antigens that have not been previously recognized by the immune system). The neoantigen is captured and presented by professional antigen presentation cells (APC), which induces the priming and activation of neoantigen-specific T cells in peripheral immune organs. The chronic exposure to exogenous activators (bacteria, viruses, diet, and airborne pollutants) and endogenous activators (bacteria, viruses, cellular contents released, and other molecules) may lead to inflammation-induced tissue injury in blood pressure-regulating organs. In people more susceptible to these factors, this can be sufficient to cause hypertension [14,20];
- (5)
- The role of oxidative stress. A variety of enzymatic and non-enzymatic sources of reactive oxygen species exist in blood vessels [21]. The best-characterized source of reactive oxygen species (ROS) is NADPH oxidase and nitric oxide (NO) synthase, and they have been included in the model;
- (6)
- The role of oxidative stress in CKD, see [22];
- (7)
- Contribution of endothelial dysfunction, which is characterized by unbalanced vasodilation and contraction, increased ROS and pro-inflammatory factors, and a deficiency in the bioavailability of NO. The presence of endothelial dysfunction disrupts the permeability of the endothelial barrier, which is part of the inflammatory response in the development of cardiovascular disease, including hypertension, see [23].
2. Results
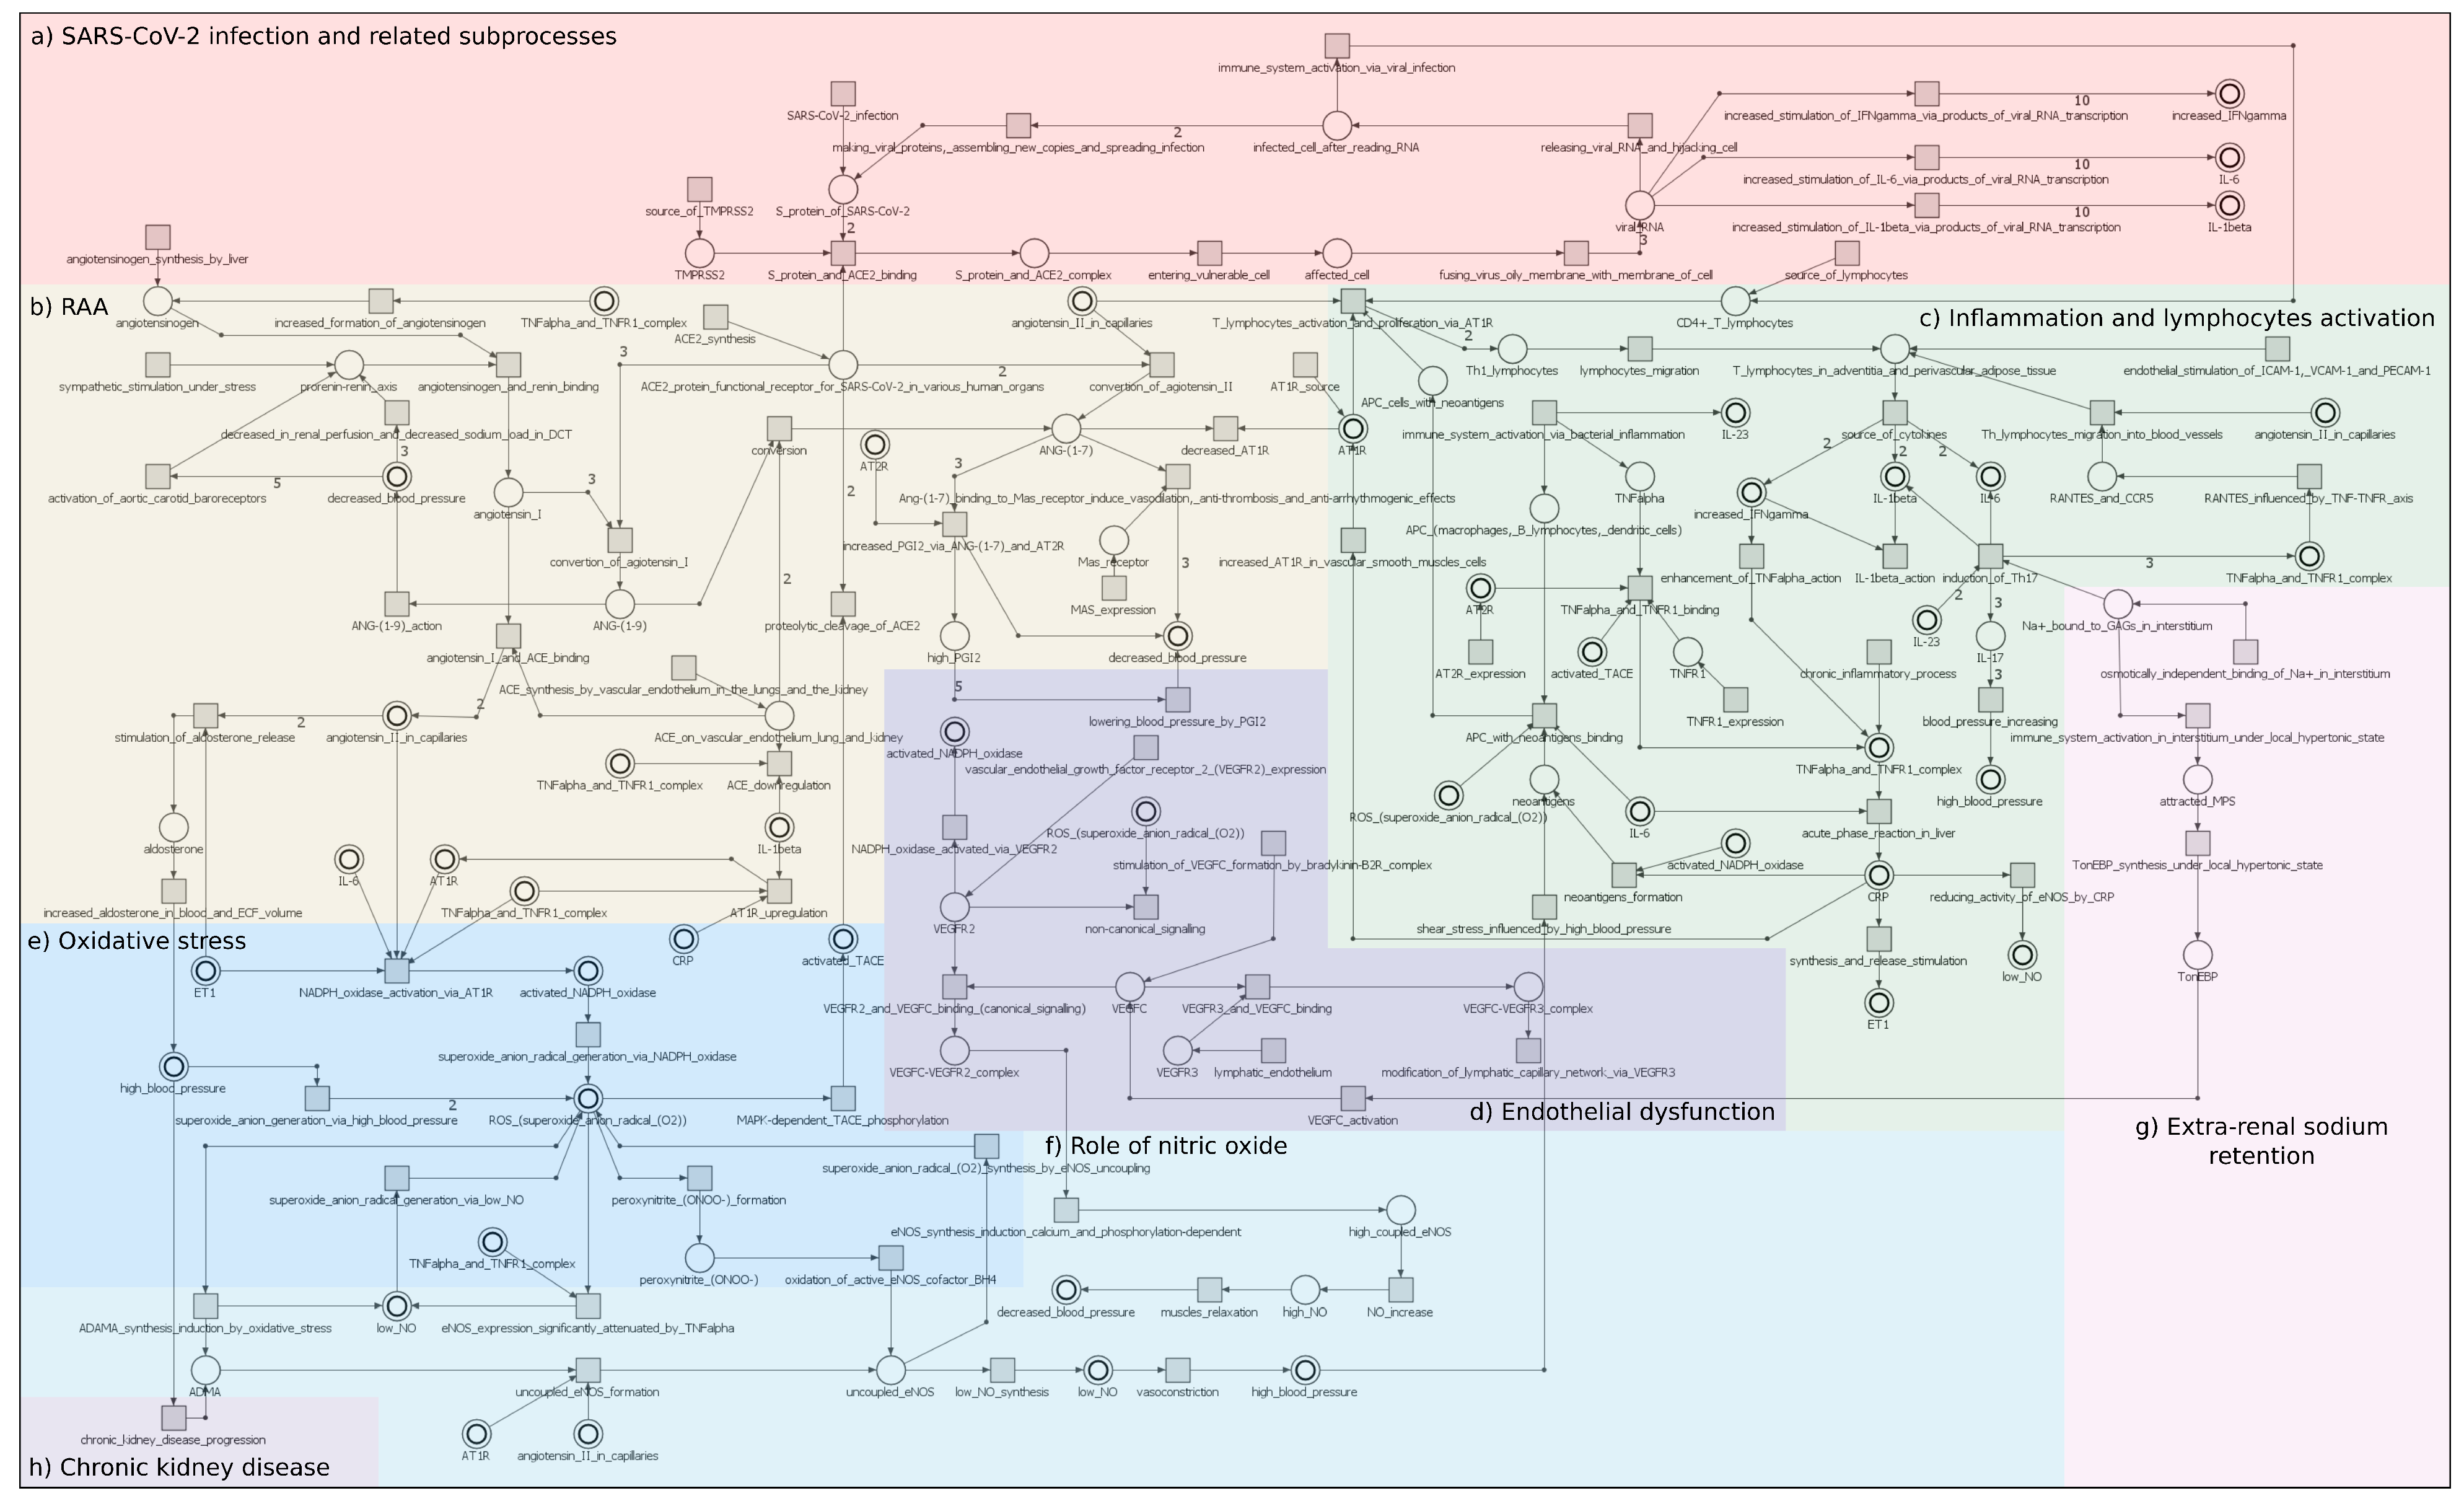
2.1. Model
2.2. Analysis
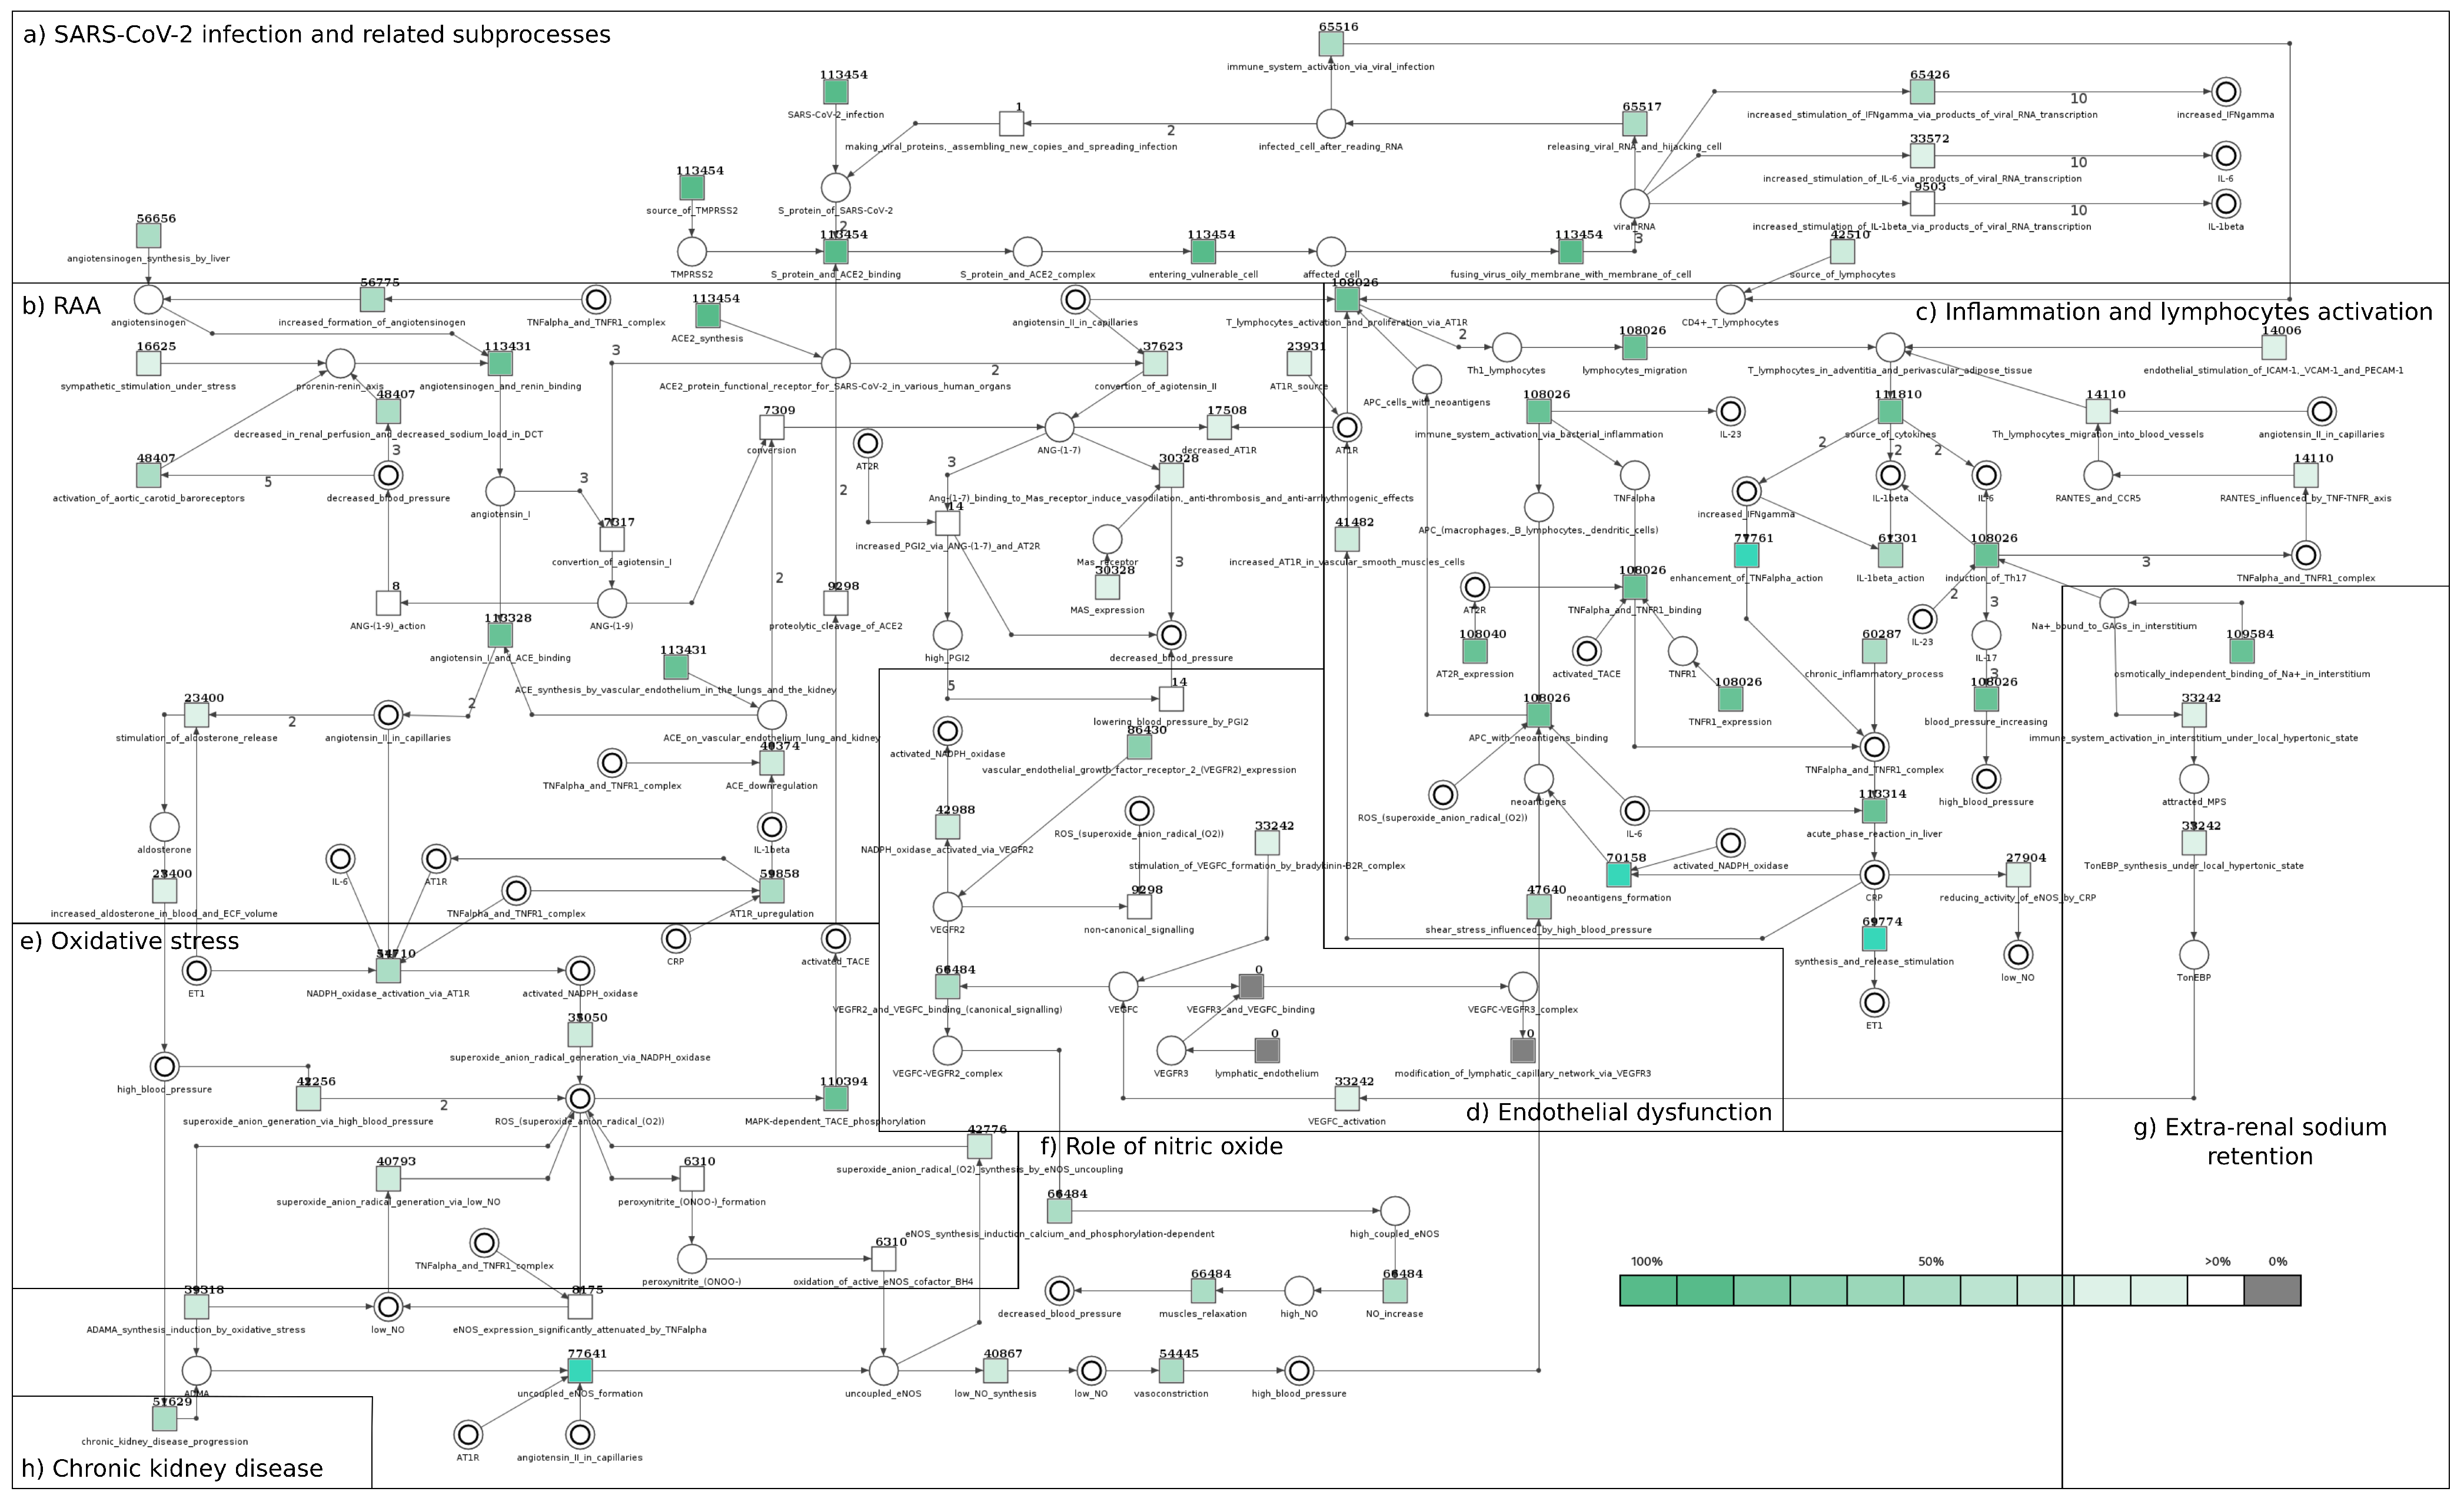
2.2.1. Significance Analysis for the Model with SARS-CoV-2 Taking into Account All t-Invariants and Only Those Related to SARS-CoV-2
2.2.2. Comparison of the Significance between the Models with and without SARS-CoV-2
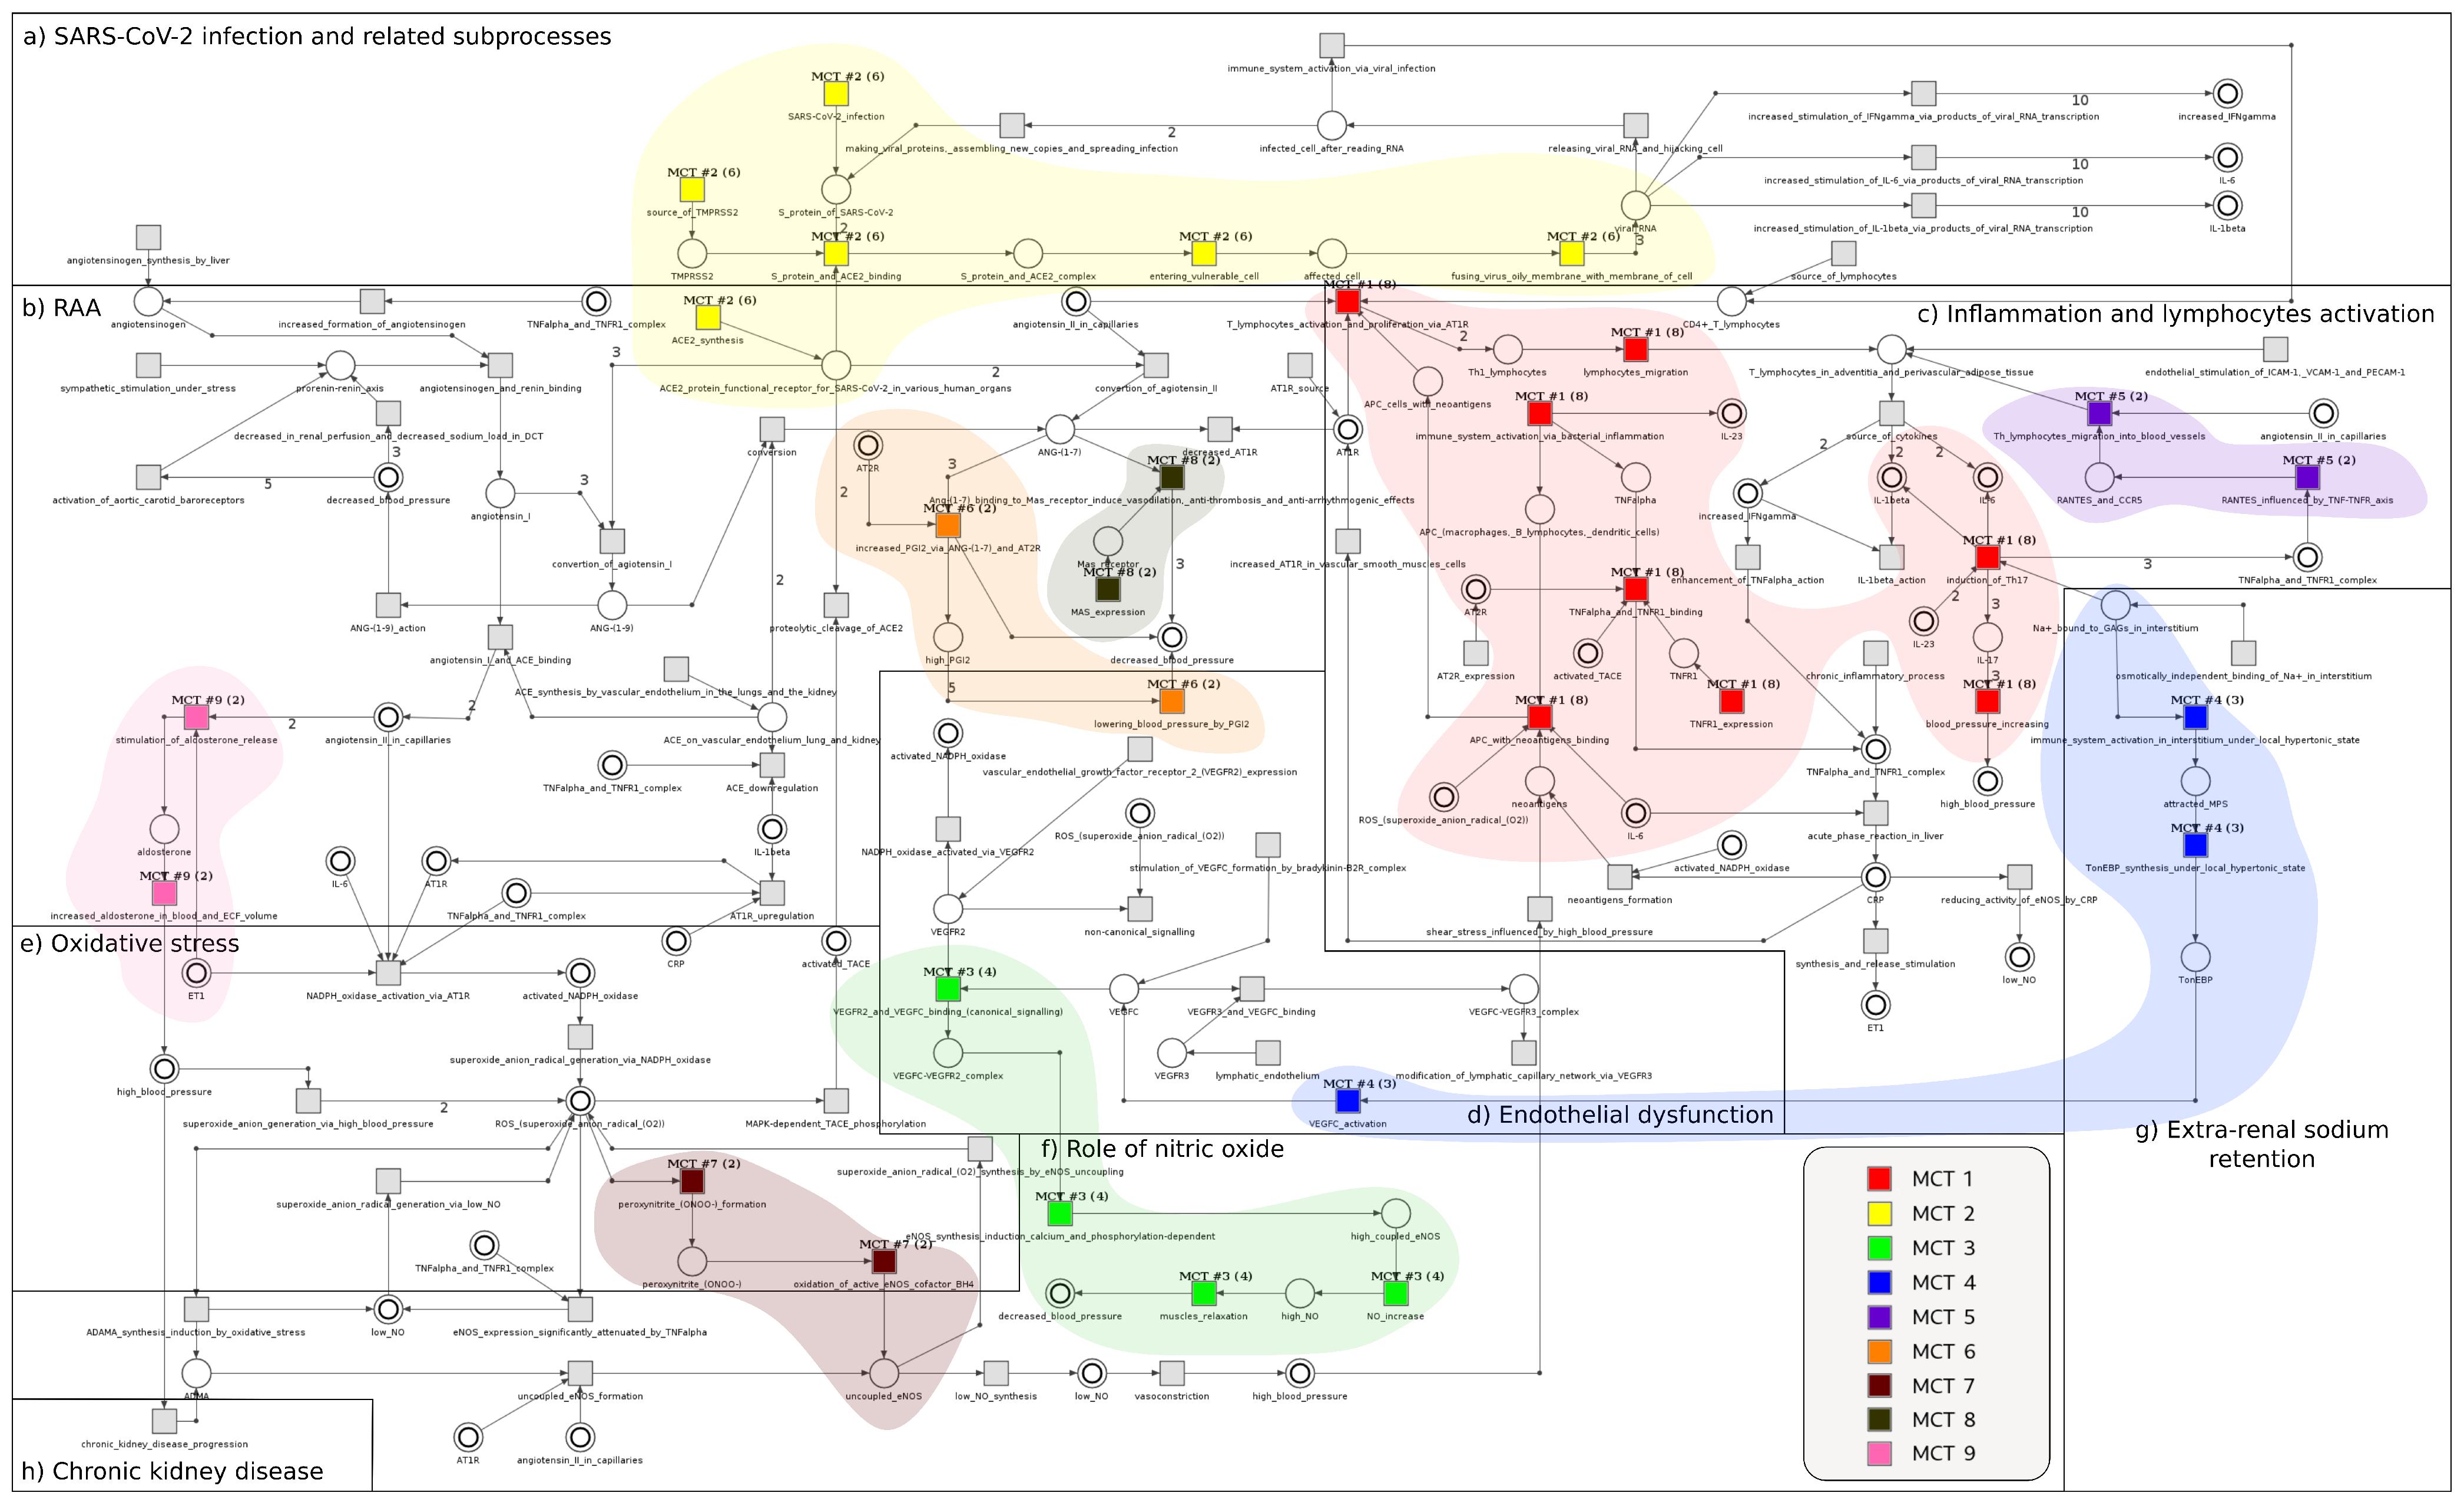
2.2.3. The Analysis of MCT Sets
2.2.4. The Knockout Simulation
3. Discussion
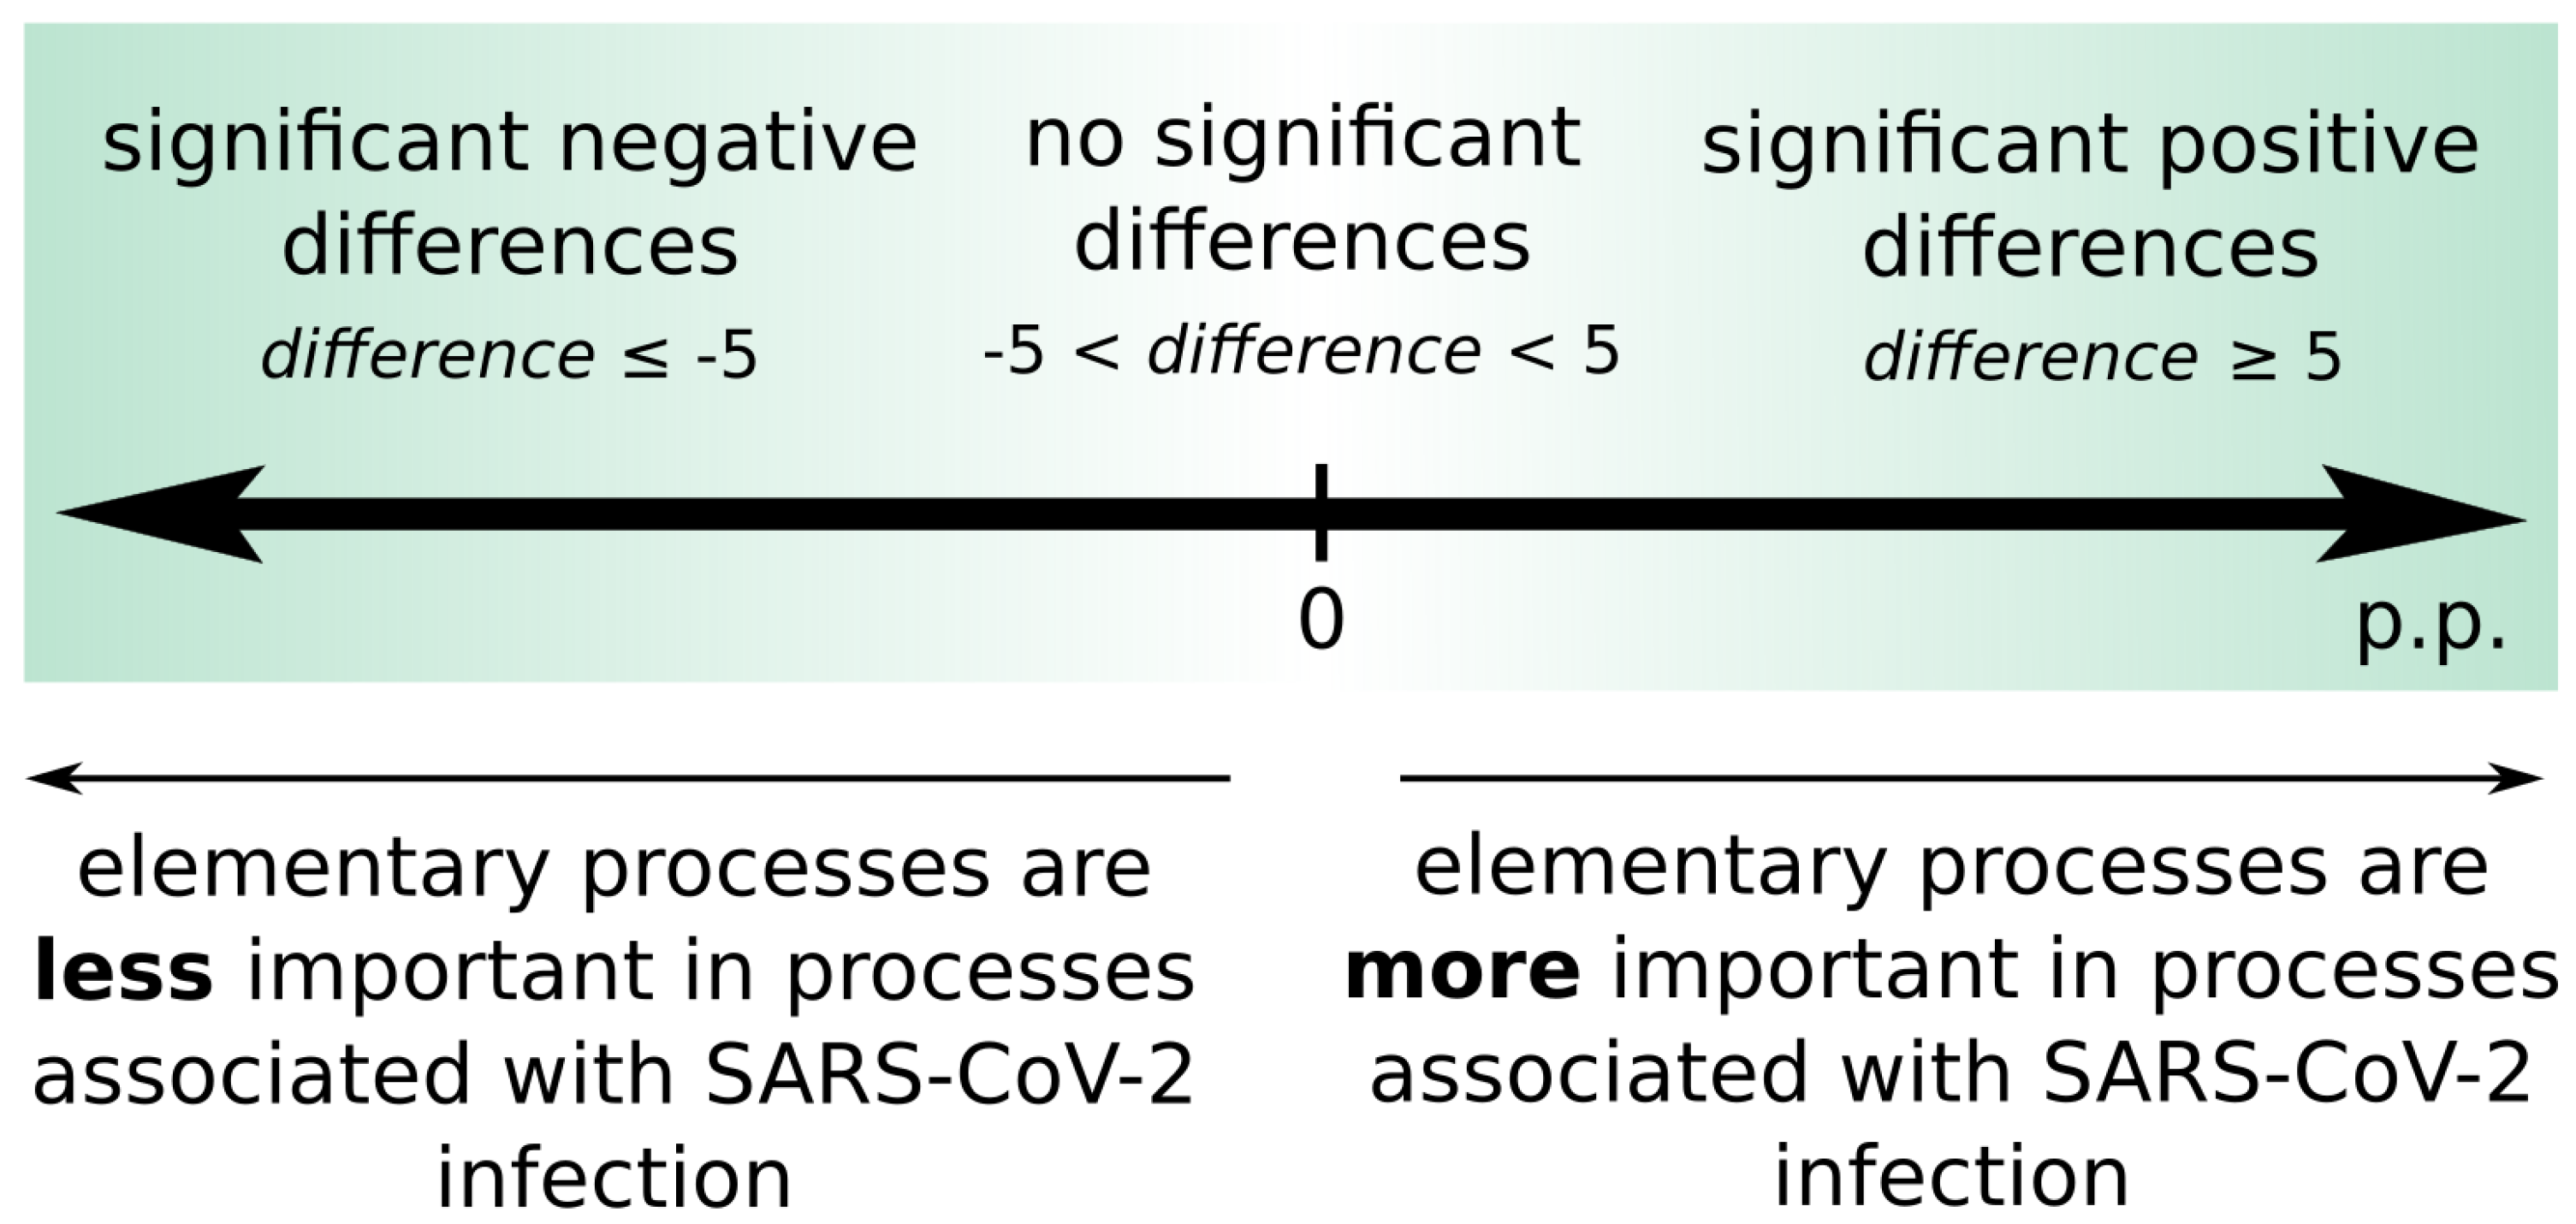
- Significant positive differences mean that the significance for given elementary processes is greater in the model with the SARS-CoV-2 virus. The following transitions indicating positive differences have been distinguished:
- -
- The enhancement of TNF- action (11.26 p.p.), TNF- and TNFR1 binding (5.47 p.p.) and TNFR1 expression (5.47 p.p.) (see Table 4)—TNF- is one of the cytokines involved in the cytokine storm, so the increase in its significance in the model with the virus is expected (which was also mentioned at the beginning of Section 3).
- -
- The immune system activation via bacterial inflammation (5.47 p.p.), and APC with neoantigens binding (5.47 p.p.)—the significance increase of these elementary processes in the model with the virus is not entirely intuitive. However, when a virus enters the host cells, the immune system (which is essential for immune response) is stimulated. This leads to an enhancement of the chronic bacterial process that is present before the SARS-CoV-2 infection. Activating the immune response is a tightly regulated, coordinated effort, the purpose of which is to control and eliminate exogenous microorganisms while responding to endogenous ligands. Establishing the proper balance of inflammation is crucial because chronic inflammatory processes lead to various host pathologies. Bacterial pathogens can induce chronic inflammation through a wide variety of evolved avoidance strategies that interfere with immune regulation [55]. The appearance of SARS-CoV-2 additionally disturbs this system and is most likely the reason for the intensification of the bacterial processes underlying essential hypertension.
- -
- T lymphocytes activation and proliferation via AT1R (5.47 p.p.), induction of Th17 (5.47 p.p.), and lymphocytes migration (5.47 p.p.)—the positive difference thus significance increase in the model with SARS-CoV-2 virus for these elementary processes is warranted, because an immune system response is the first line of defense occurring during viral infection.
- -
- Blood pressure increasing (5.47 p.p.)—this elementary process is more significant in the model with the virus. SARS-CoV-2 infection may downregulate ACE2 levels on the cell surface, leading to a decrease in ACE2 activity in the infected organs. Lowering ACE2 levels in response to SARS-CoV2 binding may serve as a mechanism to counteract viral infection at the expense of increasing angiotensin II. The presence of the virus induces ACE2 downregulation and thus contributes to an increase in blood pressure. It should be noticed that the model corresponds to a patient who, apart from SARS-CoV-2 infection, additionally suffers from accompanying disorders such as essential hypertension and CKD.
All elementary processes listed above with a positive difference equal to 5.47 p.p. occur in exactly the same number of t-invariant supports (131,032). Therefore, the calculated difference is the same for all the mentioned processes. Moreover, transitions corresponding to these elementary processes belong to the same MCT set . The exception is the elementary process “The enhancement of TNF-” which occurs in a smaller number of t-invariant supports (91,981). This process, although it occurs in a smaller number of t-invariant supports, shows a greater positive difference than other elementary processes from the same module. It can be explained by the fact that this process is directly related to the IFN cytokine, which is additionally stimulated by the SARS-CoV-2 module. The other mentioned elementary processes are not directly stimulated by the viral module. - Significant negative differences mean that the significance for given elementary processes is greater in the model without SARS-CoV-2 virus. In the case of the presence of the virus, the action of these processes may be weakened by other more significant processes, which is why their importance is decreased. The following transitions characterized by negative differences have been distinguished:
- -
- Source of lymphocytes (−41.51 p.p.)—the source of lymphocytes in general context activates the immune response, which is not solely dependent on the presence of the SARS-CoV-2 virus. This transition has been modeled as an additional source of lymphocytes that can be activated independently of SARS-CoV-2. Hence, as expected, this elementary process is definitely less important in the model with the virus.
- -
- Chronic inflammatory process (−37.73 p.p.)—it is counterintuitive that the chronic inflammation process that stimulates TNF- cytokine is characterized by negative differences. This means that this particular elementary process is less significant in the model with the SARS-CoV-2 virus in comparison to the model without SARS-CoV-2. This is unsubstantiated, especially since a positive difference has been shown (which means greater significance in the model with the virus) for the elementary process corresponding to the enhancement of this cytokine (positive differences for the enhancement of TNF- action have been described above). However, it should be noted that the modeled system is in a state of chronic inflammation even before the appearance of the virus. In the model without the virus the inflammatory process underlying hypertension is one of the key factors in maintaining essential hypertension. Therefore, its significance is high (99.51%). On the other hand, entry of the virus into the cells of a patient with persistent essential hypertension (which is sustained by a chronic inflammatory process) may result in this inflammatory process; although it is important, it loses its importance. This can be due to the entry of the SARS-CoV-2 into the patient’s cells being the additional strong influencing factor.
- -
- Th lymphocytes migration into blood vessels (−5.75 p.p.), RANTES influenced by TNF-TNFR axis (RANTES belong to the cytokines activating T cells) (−5.75 p.p.), endothelial stimulation of ICAM-1, VCAM-1 and PECAM-1 (elementary process responsible for the stimulation of T lymphocytes) (−5.50 p.p.)—these elementary processes are important components of the immune system response and therefore it seems that they should indicate positive differences, not negative ones (indicating that their significance is lower in the model with SARS-CoV-2). It may be related to the fact that in patients with a severe case of COVID-19, a decrease in lymphocytes is observed [56].
It can be noticed that the greater the negative difference, the more a given elementary process is independent of the viral module. Both the elementary processes, that is, “Source of lymphocytes” and “Chronic inflammatory process”, occur and are relevant in the model without SARS-CoV-2 infection. Moreover, due to the coexistence of other disease entities in the proposed model, such as CKD or essential hypertension, the inflammatory process is constantly maintained.
- Significant positive differences mean that the significance of given elementary processes is greater in the model with the SARS-CoV-2. We have distinguished the following transitions characterized by positive differences:
- -
- ACE2 synthesis (44.82 p.p.)—ACE2 plays the role of a functional host receptor for SARS-CoV-2. Increased expression of ACE2 may lead to an increased susceptibility to SARS-CoV-2 entering into host cells. Higher significance in the model with the virus is expected.
- -
- AT2R expression (5.39 p.p.)—AT2R is an anti-inflammatory receptor and appears in response to the presence of a viral infection. Higher significance in the model with the virus is expected.
- Significant negative differences mean that the significance of given elementary processes is greater in the model without the SARS-CoV-2. In the case of the presence of the virus, the action of these subprocesses may be covered up by other more significant subprocesses; that is why their importance is decreased. The following transitions characterized by negative differences have been distinguished:
- -
- ACE downregulation (−19.34 p.p.)—ACE2 is downregulated via the presence of SARS-CoV-2. Therefore, the balance between ACE and ACE2 is disturbed (which leads to an increase of ACE levels). The elementary processes such as ACE downregulation indicate higher significance in the model without the virus, which is the expected result.
- -
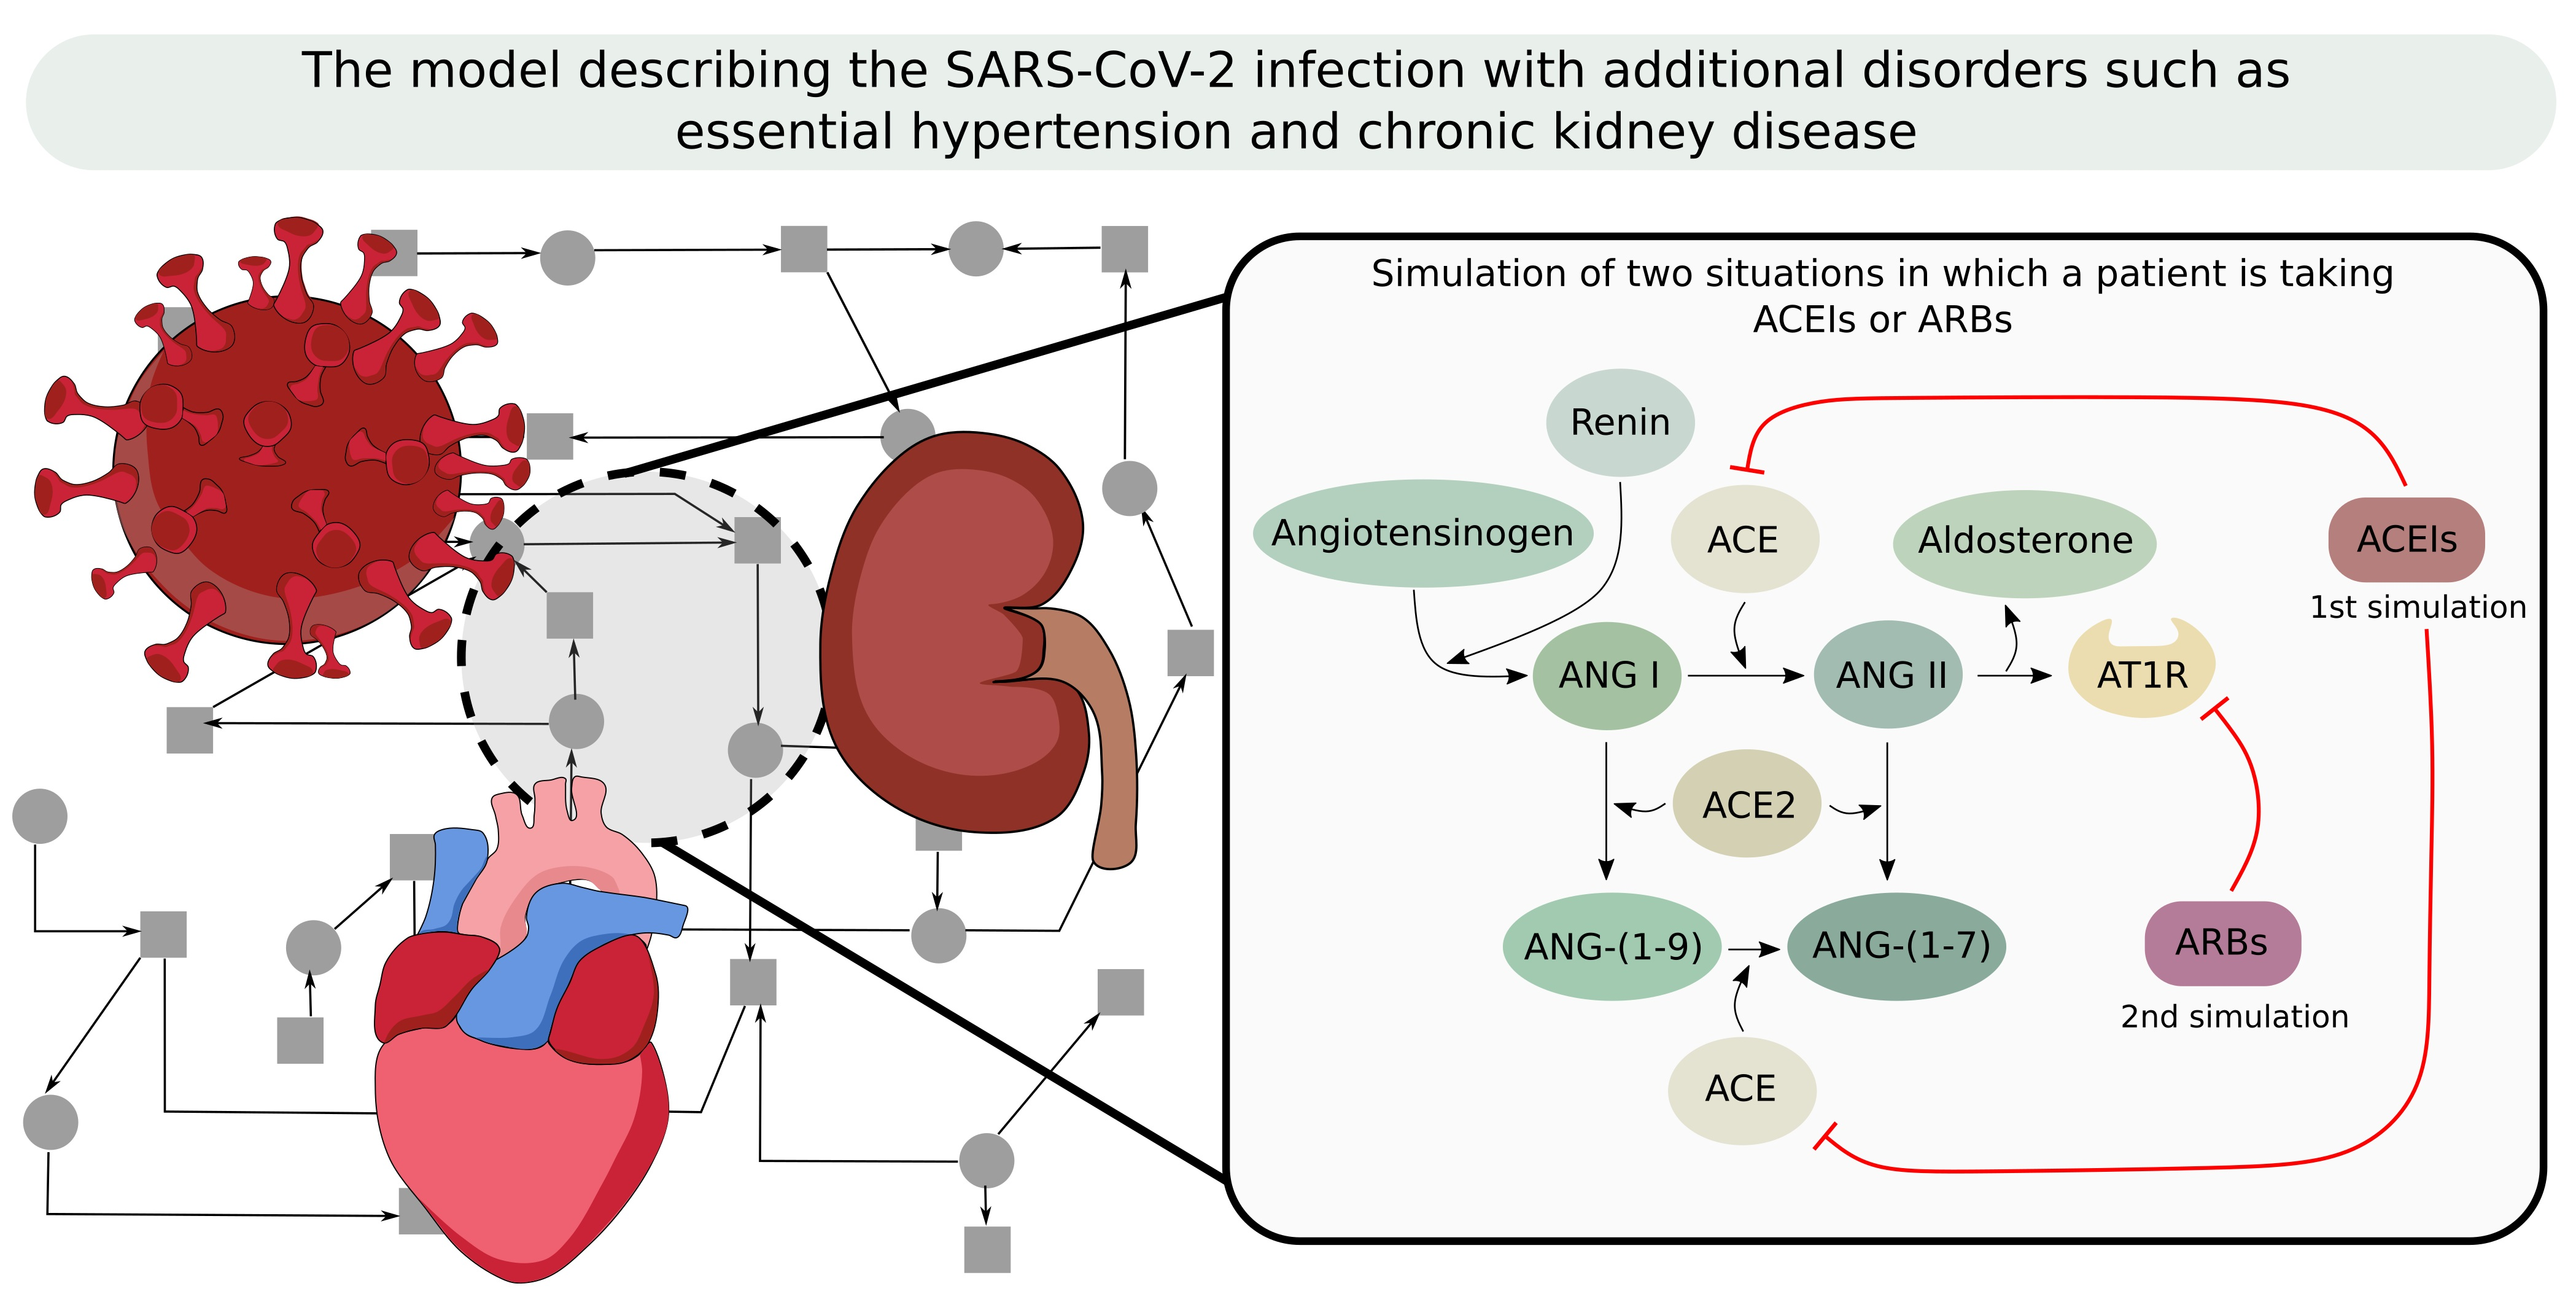
- Increased AT1R in vascular smooth muscles cells difference (−7.69 p.p.), and AT1R source (−5.17 p.p.)—it seems that AT1R, as a pro-inflammatory receptor, should indicate a higher significance in the model with SARS-CoV-2, but the result is the opposite. The knockout simulation of AT1R (simulation of receiving AR1R blockers) determined that there is no decrease in blood pressure. This leads to the assumption that this antihypertensive medication does not work properly in COVID-19 patients. However, this applies to ARBs rather than ACEIs. The antihypertensive action of AT1 antagonist may in part be due to increased Ang II metabolism by ACE2. So if there is SARS-CoV-2 infection, the availability of ACE2 becomes lower. Hence, the increased metabolism of Ang II does not take place, which in turn causes an increase in the concentration of Ang II and may even cause an increase in blood pressure. The conclusions of this analysis have been summarized below.
4. Materials and Methods
- insignificant difference: −5 p.p. < difference < 5 p.p.
- significant positive difference: difference ≥ 5 p.p.
- significant negative difference: difference ≤−5 p.p.
5. Conclusions
Supplementary Materials
Author Contributions
Funding
Institutional Review Board Statement
Informed Consent Statement
Data Availability Statement
Conflicts of Interest
Abbreviations
| ACE | angiotensin-converting enzyme |
| ACE2 | angiotensin-converting enzyme 2 |
| ACEI | angiotensin-converting enzyme inhibitor |
| ADMA | asymmetric dimethylarginine |
| ANG-(1-9) | angiotensin 1-9 |
| ANG-(1-7) | angiotensin 1-7 |
| APC | antigen-presenting cell |
| ARB | angiotensin II receptor blockers |
| AT1R | angiotensin type 1 receptor |
| AT2R | angiotensin type 2 receptor |
| B2R | bradykinin B2 receptor |
| BH | tetrahydrobiopterin |
| CCR5 | receptor for RANTES |
| CKD | chronic kidney disease |
| COVID-19 | coronavirus disease of 2019 |
| CRP | C-reactive protein |
| DCT | distal convoluted tubule |
| ECF | extracellular fluid |
| eNOS | endothelial nitric oxide synthase |
| ET1 | endothelin 1 |
| GAGs | glycosaminoglycans |
| ICAM-1 | intercellular adhesion molecule-1 |
| IL-6 | interleukin-6 |
| IL-1 | interleukin-1 |
| IL-17 | interleukin-17 |
| IL-23 | interleukin-23 |
| IFN- | interferon gamma |
| MAPK | mitogen-activated protein kinase |
| MCT sets | Maximal Common Transition sets |
| MPS | mononuclear phagocyte system cells |
| NO | nitric oxide |
| O | superoxide anion radical |
| ONOO | peroxynitrite |
| PECAM-1 | platelet endothelial cell adhesion molecule-1 |
| PGI2 | prostacyclin |
| RANTES | regulated on activation, normal T-cell expressed and secreted |
| RAS, RAA | renin-angiotensin-aldosterone system |
| ROS | reactive oxygen species |
| SARS-CoV-2 | severe acute respiratory syndrome coronavirus-2 |
| TACE | TNF- (tumour necrosis factor )-converting enzyme |
| Th17 | T helper 17 cell |
| TMPRSS2 | transmembrane protease, serine 2 |
| TNF- | tumor necrosis factor alpha |
| TNFR1 | tumor necrosis factor receptor 1 |
| TonEBP | tonicity enhancer binding protein |
| VCAM-1 | vascular cell adhesion molecule-1 |
| VEGF-C | vascular endothelial growth factor C |
| VEGFR2 | vascular endothelial growth factor receptor 2 |
| VEGFR3 | vascular endothelial growth factor receptor 3 |
References
- Zheng, J. SARS-CoV-2: An Emerging Coronavirus that Causes a Global Threat. Int. J. Biol. Sci. 2020, 16, 1678–1685. [Google Scholar] [CrossRef] [Green Version]
- Di, W.; Tiantian, W.; Qun, L.; Zhicong, Y. The SARS-CoV-2 outbreak: What we know. Int. J. Infect. Dis. 2020, 94, 44–48. [Google Scholar] [CrossRef]
- Zhou, F.; Yu, T.; Du, R.; Fan, G.; Liu, Y.; Liu, Z.; Xiang, J.; Wang, Y.; Song, B.; Gu, X.; et al. Clinical course and risk factors for mortality of adult inpatients with COVID-19 in Wuhan, China: A retrospective cohort study. Lancet 2020, 395, 1054–1062. [Google Scholar] [CrossRef]
- Phelan, A.L.; Katz, R.; Gostin, L.O. The Novel Coronavirus Originating in Wuhan, China: Challenges for Global Health Governance. JAMA 2020, 323, 709–710. [Google Scholar] [CrossRef] [Green Version]
- Sabbah, M.Y. The Novel Coronavirus Disease (COVID-19) Outbreak: The Israeli Experience. J. Med. Sci. 2020, 89, e413. [Google Scholar] [CrossRef]
- Zoufaly, A.; Poglitsch, M.; Aberle, J.H.; Hoepler, W.; Seitz, T.; Traugott, M.; Grieb, A.; Pawelka, E.; Laferl, H.; Wenisch, C.; et al. Human recombinant soluble ACE2 in severe COVID-19. Lancet Respir. Med. 2020, 8, 1154–1158. [Google Scholar] [CrossRef]
- Abd El-Aziz, T.M.; Al-Sabi, A.; Stockand, J.D. Human recombinant soluble ACE2 (hrsACE2) shows promise for treating severe COVID19. Signal Transduct. Target. Ther. 2020, 5, 1–2. [Google Scholar] [CrossRef] [PubMed]
- Matsushita, K.; Marchandot, B.; Jesel, L.; Ohlmann, P.; Morel, O. Impact of COVID-19" on the Cardiovascular System: A Review. J. Clin. Med. 2020, 9, 1407. [Google Scholar] [CrossRef]
- Formanowicz, D.; Rybarczyk, A.; Radom, M.; Formanowicz, P. A Role of Inflammation and Immunity in Essential Hypertension—Modeled and Analyzed Using Petri Nets. Int. J. Mol. Sci. 2020, 21, 3348. [Google Scholar] [CrossRef] [PubMed]
- Formanowicz, D.; Rybarczyk, A.; Formanowicz, P. Factors influencing essential hypertension and cardiovascular disease modeled and analyzed using stochastic Petri nets. Fundam. Inform. 2017, 160, 143–165. [Google Scholar] [CrossRef]
- Carey, R.M.; Padia, S.H. Chapter 1—Physiology and Regulation of the Renin–Angiotensin–Aldosterone System. In Textbook of Nephro-Endocrinology, 2nd ed.; Singh, A.K., Williams, G.H., Eds.; Academic Press: Cambridge, MA, USA, 2018; pp. 1–25. [Google Scholar] [CrossRef]
- Barrows, I.R.; Ramezani, A.; Raj, D.S. Inflammation, Immunity, and Oxidative Stress in Hypertension-Partners in Crime? Adv. Chron. Kidney Dis. 2019, 26, 122–130. [Google Scholar] [CrossRef]
- Rodriguez-Iturbe, B.; Pons, H.; Johnson, R.J. Role of the Immune System in Hypertension. Physiol. Rev. 2017, 97, 1127–1164. [Google Scholar] [CrossRef]
- Drummond, G.R.; Vinh, A.; Guzik, T.J.; Sobey, C.G. Immune mechanism of hypertension. Nat. Rev. Immunol. 2019, 19, 517–532. [Google Scholar] [CrossRef] [PubMed]
- Jens, T. Sodium balance is not just a renal affair. Curr. Opin. Nephrol. Hypertens. 2014, 23, 101–105. [Google Scholar] [CrossRef]
- Wenzel, U.O.; Bode, M.; Kurts, C.; Ehmke, H. Salt, inflammation, IL-17 and hypertension. Br. J. Pharmacol. 2019, 176, 1853–1863. [Google Scholar] [CrossRef] [PubMed]
- Shibuya, M. Vascular Endothelial Growth Factor (VEGF) and Its Receptor (VEGFR) Signaling in Angiogenesis: A Crucial Target for Anti- and Pro-Angiogenic Therapies. Genes Cancer 2011, 2, 1097–1105. [Google Scholar] [CrossRef]
- Higaki, A.; Mahmoud, A.U.M.; Paradis, P.; Schiffrin, E.L. Role of interleukin-23/interleukin-17 axis in T-cell-mediated actions in hypertension. Cardiovasc. Res. 2021, 117, 1274–1283. [Google Scholar] [CrossRef]
- Caillon, A.; Schiffrin, E.L. Role of Inflammation and Immunity in Hypertension: Recent Epidemiological, Laboratory, and Clinical Evidence. Curr. Hypertens. Rep. 2016, 18, 21. [Google Scholar] [CrossRef]
- Lopez Gelston, C.A.; Mitchell, B.M. Recent Advances in Immunity and Hypertension. Am. J. Hypertens. 2017, 30, 643–652. [Google Scholar] [CrossRef]
- Touyz, R.M.; Rios, F.J.; Alves-Lopes, R.; Neves, K.B.; Camargo, L.L.; Montezano, A.C. Oxidative Stress: A Unifying Paradigm in Hypertension. Can. J. Cardiol. 2020, 36, 659–670. [Google Scholar] [CrossRef] [Green Version]
- Podkowińska, A.; Formanowicz, D. Chronic Kidney Disease as Oxidative Stress- and Inflammatory-Mediated Cardiovascular Disease. Antioxidants 2020, 9, 752. [Google Scholar] [CrossRef]
- Sun, H.J.; Wu, Z.Y.; Nie, X.W.; Bian, J.S. Role of Endothelial Dysfunction in Cardiovascular Diseases: The Link Between Inflammation and Hydrogen Sulfide. Front. Pharmacol. 2020, 10, 1568. [Google Scholar] [CrossRef] [PubMed] [Green Version]
- Hoffmann, M.; Kleine-Weber, H.; Schroeder, S.; Krüger, N.; Herrler, T.; Erichsen, S.; Schiergens, T.S.; Herrler, G.; Wu, N.H.; Nitsche, A.; et al. SARS-CoV-2 Cell Entry Depends on ACE2 and TMPRSS2 and Is Blocked by a Clinically Proven Protease Inhibitor. Cell 2020, 181, 271–280. [Google Scholar] [CrossRef] [PubMed]
- Cai, L.; Guo, X.; Cao, Y.; Ying, P.; Hong, L.; Zhang, Y.; Yi, G.; Fu, M. Determining available strategies for prevention and therapy: Exploring COVID-19 from the perspective of ACE2 (Review). Int. J. Mol. Med. 2021, 47, 43. [Google Scholar] [CrossRef]
- Sparks, M.A.; South, A.M.; Badley, A.D.; Baker-Smith, C.M.; Batlle, D.; Bozkurt, B.; Cattaneo, R.; Crowley, S.D.; Dell’Italia, L.J.; Ford, A.L.; et al. Severe Acute Respiratory Syndrome Coronavirus 2, COVID-19, and the Renin-Angiotensin System. Hypertension 2020, 76, 1350–1367. [Google Scholar] [CrossRef] [PubMed]
- Hamming, I.; Cooper, M.; Haagmans, B.; Hooper, N.; Korstanje, R.; Osterhaus, A.; Timens, W.; Turner, A.; Navis, G.; van Goor, H. The emerging role of ACE2 in physiology and disease. J. Pathol. 2007, 212, 1–11. [Google Scholar] [CrossRef]
- Verdecchia, P.; Cavallini, C.; Spanevello, A.; Angeli, F. The pivotal link between ACE2 deficiency and SARS-CoV-2 infection. Eur. J. Intern. Med. 2020, 76, 14–20. [Google Scholar] [CrossRef] [PubMed]
- Ishiyama, Y.; Gallagher, P.E.; Averill, D.B.; Tallant, E.A.; Brosnihan, K.B.; Ferrario, C.M. Upregulation of Angiotensin-Converting Enzyme 2 after Myocardial Infarction by Blockade of Angiotensin II Receptors. Hypertension 2004, 43, 970–976. [Google Scholar] [CrossRef] [Green Version]
- Ferrario, C.M.; Jessup, J.; Chappell, M.C.; Averill, D.B.; Brosnihan, K.B.; Tallant, E.A.; Diz, D.I.; Gallagher, P.E. Effect of Angiotensin-Converting Enzyme Inhibition and Angiotensin II Receptor Blockers on Cardiac Angiotensin-Converting Enzyme 2. Circulation 2005, 111, 2605–2610. [Google Scholar] [CrossRef] [Green Version]
- Simões e Silva, A.; Silveira, K.; Ferreira, A.; Teixeira, M. ACE2, angiotensin-(1-7) and M as receptor axis in inflammation and fibrosis. Br. J. Pharmacol. 2013, 169, 477–492. [Google Scholar] [CrossRef] [Green Version]
- Ferrario, C.M. ACE2: More of Ang-(1-7) or less Ang II? Curr. Opin. Nephrol. Hypertens. 2011, 20, 1–6. [Google Scholar] [CrossRef]
- Soler, M.J.; Ye, M.; Wysocki, J.; William, J.; Lloveras, J.; Batlle, D. Localization of ACE2 in the renal vasculature: Amplification by angiotensin II type 1 receptor blockade using telmisartan. Am. J. Physiol.-Ren. Physiol. 2009, 296, F398–F405. [Google Scholar] [CrossRef] [Green Version]
- Jarcho, J.A.; Ingelfinger, J.R.; Hamel, M.B.; D’Agostino, R.B.; Harrington, D.P. Inhibitors of the Renin–Angiotensin–Aldosterone System and Covid-19. N. Engl. J. Med. 2020, 382, 2462–2464. [Google Scholar] [CrossRef] [PubMed]
- Fang, L.; Karakiulakis, G.; Roth, M. Are patients with hypertension and diabetes mellitus at increased risk for COVID-19 infection? Lancet Respir. Med. 2020, 8, e21. [Google Scholar] [CrossRef]
- Esler, M.; Esler, D. Can angiotensin receptor-blocking drugs perhaps be harmful in the COVID-19 pandemic? J. Hypertens. 2020, 38, 781–782. [Google Scholar] [CrossRef] [PubMed]
- Ciulla, M.M. Switching to another antihypertensive effective drug when using ACEIs/ARBs to treat arterial hypertension during COVID-19. Eur. Heart J. 2020, 41, 1856. [Google Scholar] [CrossRef] [PubMed]
- Sriram, K.; Insel, P.A. Risks of ACE Inhibitor and ARB Usage in COVID-19: Evaluating the Evidence. Clin. Pharmacol. Ther. 2020, 108, 236–241. [Google Scholar] [CrossRef]
- Wang, W.; Zhao, X.; Wei, W.; Fan, W.; Gao, K.; He, S.; Zhuanget, X. Angiotensin-converting enzyme inhibitors (ACEI) or angiotensin receptor blockers (ARBs) may be safe for COVID-19 patients. BMC Infect. Dis. 2021, 21, 114. [Google Scholar] [CrossRef]
- Mehra, M.R.; Desai, S.S.; Kuy, S.; Henry, T.D.; Patel, A.N. Cardiovascular Disease, Drug Therapy, and Mortality in Covid-19. N. Engl. J. Med. 2020, 382, e102. [Google Scholar] [CrossRef] [PubMed]
- Mancia, G.; Rea, F.; Ludergnani, M.; Apolone, G.; Corrao, G. Renin–Angiotensin–Aldosterone System Blockers and the Risk of Covid-19. N. Engl. J. Med. 2020, 382, 2431–2440. [Google Scholar] [CrossRef]
- Reynolds, H.R.; Adhikari, S.; Pulgarin, C.; Troxel, A.B.; Iturrate, E.; Johnson, S.B.; Hausvater, A.; Newman, J.D.; Berger, J.S.; Bangalore, S.; et al. Renin–Angiotensin–Aldosterone System Inhibitors and Risk of Covid-19. N. Engl. J. Med. 2020, 382, 2441–2448. [Google Scholar] [CrossRef] [PubMed]
- Wysocki, J.; Lores, E.; Ye, M.; Soler, M.J.; Batlle, D. Kidney and Lung ACE2 Expression after an ACE Inhibitor or an Ang II Receptor Blocker: Implications for COVID-19. J. Am. Soc. Nephrol. 2020, 31, 1941–1943. [Google Scholar] [CrossRef] [PubMed]
- Cohen, J.B.; Hanff, T.C.; William, P.; Sweitzer, N.; Rosado-Santander, N.R.; Medina, C.; Rodriguez-Mori, J.E.; Renna, N.; Chang, T.I.; Corrales-Medina, V.; et al. Continuation versus discontinuation of renin–angiotensin system inhibitors in patients admitted to hospital with COVID-19: A prospective, randomised, open-label trial. Lancet Respir. Med. 2021, 9, 275–284. [Google Scholar] [CrossRef]
- Li, J.; Wang, X.; Chen, J.; Zhang, H.; Deng, A. Association of Renin-Angiotensin System Inhibitors with Severity or Risk of Death in Patients with Hypertension Hospitalized for Coronavirus Disease 2019 (COVID-19) Infection in Wuhan, China. JAMA Cardiol. 2020, 5, 825–830. [Google Scholar] [CrossRef] [PubMed] [Green Version]
- Gurwitz, D. Angiotensin receptor blockers as tentative SARS-CoV-2 therapeutics. Drug Dev. Res. 2020, 81, 537–540. [Google Scholar] [CrossRef] [Green Version]
- Biswas, M.; Kali, M.S.K. Association of angiotensin-converting enzyme inhibitors and angiotensin-receptor blockers with risk of mortality, severity or SARS-CoV-2 test positivity in COVID-19 patients: Meta-analysis. Sci. Rep. 2021, 11. [Google Scholar] [CrossRef]
- Shukla AK, B.M. Angiotensin-Converting-Enzyme 2 and Renin-Angiotensin System Inhibitors in COVID-19: An Update. High Blood Press. Cardiovasc. Prev. 2021, 28, 129–139. [Google Scholar] [CrossRef]
- Parit, R.; Jayavel, S. Association of ACE inhibitors and angiotensin type II blockers with ACE2 overexpression in COVID-19 comorbidities: A pathway-based analytical study. Eur. J. Pharmacol. 2021, 896, 173899. [Google Scholar] [CrossRef]
- Radom, M.; Rybarczyk, A.; Szawulak, B.; Andrzejewski, H.; Chabelski, P.; Kozak, A.; Formanowicz, P. Holmes: A graphical tool for development, simulation and analysis of Petri net based models of complex biological systems. Bioinformatics 2017, 33, 3822–3823. [Google Scholar] [CrossRef] [Green Version]
- Sackmann, A.; Heiner, M.; Koch, I. Application of Petri net based analysis techniques to signal transduction pathway. BMC Bioinform. 2006, 7, 482. [Google Scholar] [CrossRef] [Green Version]
- Sackmann, A.; Formanowicz, D.; Formanowicz, P.; Koch, I.; Błażewicz, J. An analysis of Petri net based model of the human body iron homeostasis process. Comput. Biol. Chem. 2007, 31, 1–10. [Google Scholar] [CrossRef]
- Formanowicz, D.; Kozak, A.; Głowacki, T.; Radom, M.; Formanowicz, P. Hemojuvelin–hepcidin axis modeled and analyzed using Petri nets. J. Biomed. Inform. 2013, 46, 1030–1043. [Google Scholar] [CrossRef] [Green Version]
- Song, P.; Li, W.; Xie, J.; Hou, Y.; You, C. Cytokine storm induced by SARS-CoV-2. Clin. Chim. Acta 2020, 509, 280–287. [Google Scholar] [CrossRef]
- Barth, K.; Remick, D.G.; Genco, C.A. Disruption of immune regulation by microbial pathogens and resulting chronic inflammation. J. Cell. Physiol. 2013, 228, 1413–1422. [Google Scholar] [CrossRef] [PubMed] [Green Version]
- Diao, B.; Wang, C.; Tan, Y.; Chen, X.; Liu, Y.; Ning, L.; Chen, L.; Li, M.; Liu, Y.; Wang, G.; et al. Reduction and Functional Exhaustion of T Cells in Patients with Coronavirus Disease 2019 (COVID-19). Front. Immunol. 2020, 11, 827. [Google Scholar] [CrossRef]
- Koch, I.; Reisig, W.; Schreiber, F. (Eds.) Modeling in Systems Biology. The Petri Net Approach; Springer: London, UK, 2011. [Google Scholar]
- Murata, T. Petri nets: Properties, analysis and aplications. Proc. IEEE 1989, 90, 541–580. [Google Scholar] [CrossRef]
- David, R.; Alla, H. Discrete, Continuous and Hybrid Petri Nets; Springer: Berlin/Heidelberg, Germany, 2010. [Google Scholar]
- Grafahrend-Belau, E.; Schreiber, F.; Heiner, M.; Sackmann, A.; Junker, B.; Grunwald, S.; Speer, A.; Winder, K.; Koch, I. Modularization of biochemical networks based on classification of Petri net t-invariants. BMC Bioinform. 2008, 9, 90. [Google Scholar] [CrossRef] [PubMed] [Green Version]
- Gutowski, Ł.; Gutowska, K.; Pioruńska-Stolzmann, M.; Formanowicz, P.; Formanowicz, D. Systems approach to study associations between OxLDL and abdominal aortic aneurysms. Int. J. Mol. Sci. 2019, 20, 3909. [Google Scholar] [CrossRef] [PubMed] [Green Version]
- Formanowicz, D.; Radom, M.; Rybarczyk, A.; Formanowicz, P. The role of Fenton reaction in ROS-induced toxicity underlying atherosclerosis—Modeled and analyzed using a Petri net-based approach. Biosystems 2018, 165, 71–87. [Google Scholar] [CrossRef]


| ID | Biological Meaning | ID | Biological Meaning |
|---|---|---|---|
| neoantigens formation | angiotensinogen and renin binding | ||
| chronic inflammatory process | angiotensin I and ACE binding | ||
| immune system activation via bacterial inflammation | ACE synthesis by vascular endothelium in lungs and kidney | ||
| Th lymphocytes migration into blood vessels | decreased in renal perfusion and decreased sodium load in DCT | ||
| source of cytokines | activation of aortic carotid baroreceptors | ||
| acute phase reaction in liver | stimulation of VEGFC formation by bradykinin-B2R complex | ||
| increased AT1R in vascular smooth muscles cells | synthesis and release stimulation | ||
| AT1R source | ACE downregulation | ||
| T lymphocytes activation and proliferation via AT1R | sympathetic stimulation under stress | ||
| reducing activity of eNOS by CRP | AT2R expression | ||
| osmotically independent binding of Na in interstitium | RANTES influenced by TNF-TNFR axis | ||
| immune system activation in interstitium under local hypertonic state | shear stress influenced by high blood pressure | ||
| VEGFC activation | convesion of agiotensin II | ||
| modification of lymphatic capillary network via VEGFR3 | S protein and ACE2 binding | ||
| NO increase | entering vulnerable cell | ||
| induction of Th17 | fusing virus membrane with membrane of cell | ||
| TonEBP synthesis under local hypertonic state | conversion of agiotensin I | ||
| VEGFR3 and VEGFC binding | SARS-CoV-2 infection | ||
| VEGFR2 and VEGFC binding (canonical signalling) | Ang-(1-7) binding to Mas receptor induce vasodilation, anti-thrombosis and anti-arrhythmogenic effects | ||
| muscles relaxation | ACE2 synthesis | ||
| lymphatic endothelium | releasing viral RNA and hijacking cell | ||
| vascular endothelial growth factor receptor 2 (VEGFR2) expression | conversion | ||
| TNF- and TNFR1 binding | decreased AT1R | ||
| TNFR1 expression | ANG-(1-9) action | ||
| endothelial stimulation of ICAM-1, VCAM-1 and PECAM-1 | making viral proteins, assembling new copies and spreading infection | ||
| vasoconstriction | Mas expression | ||
| lowering blood pressure by PGI2 | increased PGI2 via ANG-(1-7) and AT2R | ||
| eNOS expression significantly attenuated by TNF- | stimulation of aldosterone release | ||
| APC with neoantigens binding | increased aldosterone in blood and increased ECF volume | ||
| blood pressure increasing | chronic kidney disease progression | ||
| eNOS synthesis induction calcium and phosphorylation-dependent | MAPK-dependent TACE phosphorylation | ||
| peroxynitrite (ONOO) formation | proteolytic cleavage of ACE2 | ||
| oxidation of active eNOS cofactor BH | source of TMPRSS2 | ||
| superoxide anion radical (O) synthesis by eNOS uncoupling | IL-1 action | ||
| low NO synthesis | immune system activation via viral infection | ||
| uncoupled eNOS formation | lymphocytes migration | ||
| NADPH oxidase activation via AT1R | enhancement of TNF- action | ||
| NADPH oxidase activated via VEGFR2 | AT1R upregulation | ||
| non-canonical signalling | increased formation of angiotensinogen | ||
| superoxide anion radical generation via low NO | source of lymphocytes | ||
| superoxide anion radical generation via NADPH oxidase | increased stimulation of IFN- via products of viral RNA transcription | ||
| superoxide anion radical generation via high blood pressure | increased stimulation of IL-1 via products of viral RNA transcription | ||
| ADMA synthesis induction by oxidative stress | increased stimulation of IL-6 via products of viral RNA transcription | ||
| angiotensinogen synthesis by liver |
| ID | Biological Meaning | ID | Biological Meaning |
|---|---|---|---|
| neoantigens | high blood pressure | ||
| APC cells with neoantigens | high coupled eNOS | ||
| Th1 lymphocytes | uncoupled eNOS | ||
| RANTES and CCR5 | ADMA | ||
| activated NADPH oxidase | angiotensinogen | ||
| T lymphocytes in adventitia and perivascular adipose tissue | angiotensin I | ||
| increase in IFN- | prorenin–renin axis | ||
| IL-17 | ACE on vascular endothelium lung and kidney | ||
| APC (macrophages, B lymphocytes, dendritic cells) | ET1 | ||
| CRP | TNF- and TNFR1 complex | ||
| CD4 T lymphocytes | ACE2 protein functional receptor for SARS-CoV-2 in various human organs | ||
| ROS (superoxide anion radical (O)) | ANG-(1-7) | ||
| Na bound to GAGs in interstitium | S protein of SARS-CoV-2 | ||
| attracted MPS | S protein and ACE2 complex | ||
| VEGFC | affected cell | ||
| TonEBP | ANG-(1-9) | ||
| VEGFR3 | viral RNA | ||
| VEGFC-VEGFR3 complex | infected cell after reading RNA | ||
| VEGFR2 | Mas receptor | ||
| VEGFC-VEGFR2 complex | angiotensin II in capillaries | ||
| TNFR1 | aldosterone | ||
| high NO | activated TACE | ||
| high PGI2 | TMPRSS2 | ||
| low NO | IL-6 | ||
| AT1R | IL-1 | ||
| AT2R | IL-23 | ||
| peroxynitrite (ONOO) | TNF- | ||
| decreased blood pressure |
| Modules | Name of Transition | ID | Frequency of Transitions in All t-Invariants of the Base Model with the Virus (139,451 t-inv.) | Occurrence Frequency of Transitions in Selected t-Invariants of the Model with SARS-CoV-2—Only Those Related to the SARS-CoV-2 Module (113,454 t-inv.) | ||
|---|---|---|---|---|---|---|
| Frequency trans./t-inv. | Frequency trans./t-inv. | |||||
| (b) | angiotensinogen and renin binding | 139,409 | 99.97% | 113,431 | 99.98% | |
| (b) | ACE synthesis by vascular endothelium in lungs and kidney | 139,401 | 99.96% | 113,431 | 99.98% | |
| (b) | angiotensin I and ACE binding | 139,230 | 99.84% | 113,328 | 99.89% | |
| (c) | acute phase reaction in liver | 139,048 | 99.71% | 113,314 | 99.88% | |
| (c) | source of cytokines | 137,544 | 98.63% | 111,810 | 98.55% | |
| (e) | MAPK-dependent TACE phosphorylation | 134,681 | 96.58% | 110,394 | 97.30% | |
| (g) | osmotically independent binding of Na in interstitium | 133,447 | 95.69% | 109,584 | 96.59% | |
| (b) | AT2R expression | 131,074 | 93.99% | 108,040 | 95.23% | |
| (c) | immune system activation via bacterial inflammation | 131,032 | 93.96% | 108,026 | 95.22% | |
| (c) | T lymphocytes activation and proliferation via AT1R | 131,032 | 93.96% | 108,026 | 95.22% | |
| (c) | induction of Th17 | 131,032 | 93.96% | 108,026 | 95.22% | |
| (c) | TNF- and TNFR1 binding | 131,032 | 93.96% | 108,026 | 95.22% | |
| (c) | TNFR1 expression | 131,032 | 93.96% | 108,026 | 95.22% | |
| (c) | APC with neoantigens binding | 131,032 | 93.96% | 108,026 | 95.22% | |
| (c) | blood pressure increasing | 131,032 | 93.96% | 108,026 | 95.22% | |
| (c) | lymphocytes migration | 131,032 | 93.96% | 108,026 | 95.22% | |
| (b) | ACE2 synthesis | 125,129 | 89.73% | 113,454 | 100.00% | |
| (a) | S protein and ACE2 binding | 113,454 | 81.36% | 113,454 | 100.00% | |
| (a) | entering vulnerable cell | 113,454 | 81.36% | 113,454 | 100.00% | |
| (a) | fusing virus membrane with membrane of cell | 113,454 | 81.36% | 113,454 | 100.00% | |
| (a) | SARS-CoV-2 infection | 113,454 | 81.36% | 113,454 | 100.00% | |
| (a) | source of TMPRSS2 | 113,454 | 81.36% | 113,454 | 100.00% | |
| (d) | vascular endothelial growth factor receptor 2 (VEGFR2) expression | 106,674 | 76.50% | 86,430 | 76.18% | |
| (f) | uncoupled eNOS formation | 94,871 | 68.03% | 77,641 | 68.43% | |
| (c) | enhancement of TNF- action | 91,981 | 65.96% | 77,761 | 68.54% | |
| (c) | chronic inflammatory process | 86,157 | 61.78% | 60,287 | 53.14% | |
| (c) | neoantigens formation | 84,808 | 60.82% | 70,158 | 61.84% | |
| (c) | synthesis and release stimulation | 84,624 | 60.68% | 69,774 | 61.50% | |
| (f) | NO increase | 81,628 | 58.54% | 66,484 | 58.60% | |
| (d) | VEGFR2 and VEGFC binding (canonical signalling) | 81,628 | 58.54% | 66,484 | 58.60% | |
| (f) | muscles relaxation | 81,628 | 58.54% | 66,484 | 58.60% | |
| (f) | eNOS synthesis induction calcium and phosphorylation-dependent | 81,628 | 58.54% | 66,484 | 58.60% | |
| (c) | IL-1 action | 76,537 | 54.88% | 61,301 | 54.03% | |
| (b) | AT1R upregulation | 73,060 | 52.39% | 59,858 | 52.76% | |
| (b) | increased formation of angiotensinogen | 69,764 | 50.03% | 56,775 | 50.04% | |
| (b) | angiotensinogen synthesis by liver | 69,645 | 49.94% | 56,656 | 49.94% | |
| (f) | vasoconstriction | 66,781 | 47.89% | 54,445 | 47.99% | |
| (e) | NADPH oxidase activation via AT1R | 65,728 | 47.13% | 54,710 | 48.22% | |
| (a) | releasing viral RNA and hijacking cell | 65,517 | 46.98% | 65,517 | 57.75% | |
| (a) | immune system activation via viral infection | 65,516 | 46.98% | 65,516 | 57.75% | |
| (c) | source of lymphocytes | 65,516 | 46.98% | 42,510 | 37.47% | |
| (a) | increased stimulation of IFN- via products of viral RNA transcription | 65,426 | 46.92% | 65,426 | 57.67% | |
| Biological Process | The Model with SARS-CoV-2 Infection (139,451 t-inv.) | The Model without SARS-CoV-2 Infection (25,997 t-inv.) | Difference in p.p. | ||
|---|---|---|---|---|---|
| Frequency trans./t-inv. | Frequency trans./t-inv. | ||||
| SARS infection and related subprocesses | |||||
| S protein and ACE2 binding | 113,454 | 81.36% | KNOCKOUT | ||
| entering vulnerable cell | 113,454 | 81.36% | |||
| fusing virus membrane with membrane of cell | 113,454 | 81.36% | |||
| SARS-CoV-2 infection | 113,454 | 81.36% | |||
| releasing viral RNA and hijacking cell | 65,517 | 46.98% | |||
| making viral proteins, assembling new copies and spreading infection | 1 | 0.00% | |||
| source of TMPRSS2 | 113,454 | 81.36% | |||
| immune system activation via viral infection | 65,516 | 46.98% | |||
| increased stimulation of IFN via products of viral RNA transcription | 65,426 | 46.92% | |||
| increased stimulation of IL-1 via products of viral RNA transcription | 9503 | 6.81 % | |||
| increased stimulation of IL-6 via products of viral RNA transcription | 33,572 | 24.07% | |||
| Chronic kidney disease | |||||
| chronic kidney disease progression | 62,887 | 45.10% | 11,258 | 43.30% | 1.79 |
| Oxidative stress | |||||
| peroxynitrite (ONOO) formation | 7696 | 5.52% | 1,386 | 5.33% | 0.19 |
| oxidation of active eNOS cofactor BH | 7696 | 5.52% | 1,386 | 5.33% | 0.19 |
| superoxide anion radical (O) synthesis by eNOS uncoupling | 52,323 | 37.52% | 9547 | 36.72% | 0.80 |
| NADPH oxidase activation via AT1R | 65,728 | 47.13% | 11,018 | 42.38% | 4.75 |
| NADPH oxidase activated via VEGFR2 | 53,530 | 38.39% | 10,542 | 40.55% | −2.16 |
| superoxide anion radical generation via low NO | 49,735 | 35.66% | 8942 | 34.40% | 1.27 |
| superoxide anion radical generation via NADPH oxidase | 42,986 | 30.83% | 7936 | 30.53% | 0.30 |
| superoxide anion radical generation via high blood pressure | 52,626 | 37.74% | 10,370 | 39.89% | −2.15 |
| MAPK-dependent TACE phosphorylation | 134,681 | 96.58% | 24,287 | 93.42% | 3.16 |
| Inflammation and lymphocytes activation | |||||
| neoantigens formation | 84,808 | 60.82% | 14,650 | 56.35% | 4.46 |
| chronic inflammatory process | 86,157 | 61.78% | 25,870 | 99.51% | −37.73 |
| immune system activation via bacterial inflammation | 131,032 | 93.96% | 23,006 | 88.49% | 5.47 |
| Th lymphocytes migration into blood vessels | 19,180 | 13.75% | 5070 | 19.50% | −5.75 |
| source of cytokines | 137,544 | 98.63% | 25,734 | 98.99% | −0.36 |
| acute phase reaction in liver | 139,048 | 99.71% | 25,734 | 98.99% | 0.72 |
| T lymphocytes activation and proliferation via AT1R | 131,032 | 93.96% | 23,006 | 88.49% | 5.47 |
| reducing activity of eNOS by CRP | 34,440 | 24.70% | 6536 | 25.14% | −0.44 |
| induction of Th17 | 131,032 | 93.96% | 23,006 | 88.49% | 5.47 |
| TNF- and TNFR1 binding | 131,032 | 93.96% | 23,006 | 88.49% | 5.47 |
| TNFR1 expression | 131,032 | 93.96% | 23,006 | 88.49% | 5.47 |
| endothelial stimulation of ICAM-1, VCAM-1 and PECAM-1 | 18,972 | 13.60% | 4966 | 19.10% | −5.50 |
| APC with neoantigens binding | 131,032 | 93.96% | 23,006 | 88.49% | 5.47 |
| blood pressure increasing | 131,032 | 93.96% | 23,006 | 88.49% | 5.47 |
| synthesis and release stimulation | 84,624 | 60.68% | 14,850 | 57.12% | 3.56 |
| Biological Process | Frequency trans./t-inv. | Frequency trans./t-inv. | Difference in p.p. | ||
| RANTES influenced by TNF-TNFR axis | 19,180 | 13.75% | 5070 | 19.50% | −5.75 |
| IL-1 action | 76,537 | 54.88% | 15,236 | 58.61% | −3.72 |
| lymphocytes migration | 131,032 | 93.96% | 23,006 | 88.49% | 5.47 |
| enhancement of TNF- action | 91,981 | 65.96% | 14,220 | 54.70% | 11.26 |
| source of lymphocytes | 65,516 | 46.98% | 23,006 | 88.49% | −41.51 |
| Nitric oxide | |||||
| NO increase | 81,628 | 58.54% | 15,144 | 58.25% | 0.28 |
| muscles relaxation | 81,628 | 58.54% | 15,144 | 58.25% | 0.28 |
| vasoconstriction | 66,781 | 47.89% | 12,336 | 47.45% | 0.44 |
| eNOS expression significantly attenuated by TNF- | 9938 | 7.13% | 1763 | 6.78% | 0.34 |
| eNOS synthesis induction calcium and phosphorylation-dependent | 81,628 | 58.54% | 15,144 | 58.25% | 0.28 |
| low NO synthesis | 49,796 | 35.71% | 8929 | 34.35% | 1.36 |
| uncoupled eNOS formation | 94,871 | 68.03% | 17,230 | 66.28% | 1.75 |
| ADMA synthesis induction by oxidative stress | 47,978 | 34.40% | 8660 | 33.31% | 1.09 |
| Endothelial dysfunction | |||||
| VEGFC activation | 40,815 | 29.27% | 7573 | 29.13% | 0.14 |
| modification of lymphatic capillary network via VEGFR3 | 2 | 0.00% | 2 | 0.01% | −0.01 |
| VEGFR3 and VEGFC binding | 2 | 0.00% | 2 | 0.01% | −0.01 |
| VEGFR2 and VEGFC binding (canonical signalling) | 81,628 | 58.54% | 15,144 | 58.25% | 0.28 |
| lymphatic endothelium | 2 | 0.00% | 2 | 0.01% | −0.01 |
| vascular endothelial growth factor receptor 2 (VEGFR2) expression | 106,674 | 76.50% | 20,244 | 77.87% | −1.37 |
| lowering blood pressure by PGI2 | 42 | 0.03% | 28 | 0.11% | −0.08 |
| non-canonical signalling | 12,021 | 8.62% | 2,723 | 10.47% | −1.85 |
| stimulation of VEGFC formation by bradykinin-B2R complex | 40,815 | 29.27% | 7,573 | 29.13% | 0.14 |
| shear stress influenced by high blood pressure | 58,160 | 41.71% | 10,520 | 40.47% | 1.24 |
| Extra-renal sodium retention | |||||
| osmotically independent binding of Na in interstitium | 133,447 | 95.69% | 23,863 | 91.79% | 3.90 |
| immune system activation in interstitium under local hypertonic state | 40,815 | 29.27% | 7573 | 29.13% | 0.14 |
| TonEBP synthesis under local hypertonic state | 40,815 | 29.27% | 7573 | 29.13% | 0.14 |
| RAA | |||||
| increased AT1R in vascular smooth muscles cells | 53,444 | 38.32% | 11,962 | 46.01% | −7.69 |
| AT1R source | 31,067 | 22.28% | 7136 | 27.45% | −5.17 |
| angiotensinogen synthesis by liver | 69,645 | 49.94% | 12,989 | 49.96% | −0.02 |
| angiotensinogen and renin binding | 139,409 | 99.97% | 25,978 | 99.93% | 0.04 |
| angiotensin I and ACE binding | 139,230 | 99.84% | 25,902 | 99.63% | 0.21 |
| ACE synthesis by vascular endothelium in lungs and kidney | 139,401 | 99.96% | 25,970 | 99.90% | 0.07 |
| decreased in renal perfusion and decreased sodium load in DCT | 59,507 | 42.67% | 11,100 | 42.70% | −0.02 |
| activation of aortic carotid baroreceptors | 59,507 | 42.67% | 11,100 | 42.70% | −0.02 |
| ACE downregulation | 55,806 | 40.02% | 15,432 | 59.36% | −19.34 |
| sympathetic stimulation under stress | 20,419 | 14.64% | 3794 | 14.59% | 0.05 |
| AT2R expression | 131,074 | 93.99% | 23,034 | 88.60% | 5.39 |
| Biological Process | Frequency trans./t-inv. | Frequency trans./t-inv. | Difference in p.p. | ||
| conversion of agiotensin II | 45,995 | 32.98% | 8372 | 32.20% | 0.78 |
| conversion of agiotensin I | 8681 | 6.23% | 1364 | 5.25 % | 0.98 |
| ANG-(1-7) binding to Mas receptor induces vasodilation, anti-thrombosis and anti-arrhythmogenic effects | 37,380 | 26.81% | 7052 | 27.13% | −0.32 |
| ACE2 synthesis | 125,129 | 89.73% | 11,675 | 44.91% | 44.82 |
| conversion | 8657 | 6.21% | 1348 | 5.19 % | 1.02 |
| decreased AT1R | 20,676 | 14.83% | 3168 | 12.19% | 2.64 |
| ANG-(1-9) action | 24 | 0.02% | 16 | 0.06% | −0.04 |
| Mas expression | 37,380 | 26.81% | 7052 | 27.13% | −0.32 |
| increased PGI2 via ANG-(1-7) and AT2R | 42 | 0.03% | 28 | 0.11% | −0.08 |
| stimulation of aldosterone release | 28,968 | 20.77% | 5568 | 21.42% | −0.64 |
| increased aldosterone in blood and increased ECF volume | 28,968 | 20.77% | 5568 | 21.42% | −0.64 |
| proteolytic cleavage of ACE2 | 12,021 | 8.62% | 2723 | 10.47% | −1.85 |
| AT1R upregulation | 73,060 | 52.39% | 13,202 | 50.78% | 1.61 |
| increased formation of angiotensinogen | 69,764 | 50.03% | 12,989 | 49.96% | 0.06 |
| Biological Modules | Biological Process | The Model with SARS-CoV-2 Infection (139,451 t-inv.) | The Model without SARS-CoV-2 Infection (25,997 t-inv.) | Difference in p.p. | ||
|---|---|---|---|---|---|---|
| Frequency trans./t-inv. | Frequency trans./t-inv. | |||||
| (b) | ACE2 synthesis | 125,129 | 89.73% | 11,675 | 44.91% | 44.82 |
| (c) | enhancement of TNF- action | 91,981 | 65.96% | 14,220 | 54.70% | 11.26 |
| (c) | immune system activation via bacterial inflammation | 131,032 | 93.96% | 23,006 | 88.49% | 5.47 |
| (c) | T lymphocytes activation and proliferation via AT1R | 131,032 | 93.96% | 23,006 | 88.49% | 5.47 |
| (c) | induction of Th17 | 131,032 | 93.96% | 23,006 | 88.49% | 5.47 |
| (c) | TNF- and TNFR1 binding | 131,032 | 93.96% | 23,006 | 88.49% | 5.47 |
| (c) | TNFR1 expression | 131,032 | 93.96% | 23,006 | 88.49% | 5.47 |
| (c) | APC with neoantigens binding | 131,032 | 93.96% | 23,006 | 88.49% | 5.47 |
| (c) | blood pressure increasing | 131,032 | 93.96% | 23,006 | 88.49% | 5.47 |
| (c) | lymphocytes migration | 131,032 | 93.96% | 23,006 | 88.49% | 5.47 |
| (b) | AT2R expression | 131,074 | 93.99% | 23,034 | 88.60% | 5.39 |
| (b) | AT1R source | 31,067 | 22.28% | 7136 | 27.45% | −5.17 |
| (c) | endothelial stimulation of ICAM-1, VCAM-1 and PECAM-1 | 18,972 | 13.60% | 4966 | 19.10% | −5.50 |
| (c) | Th lymphocytes migration into blood vessels | 19,180 | 13.75% | 5070 | 19.50% | −5.75 |
| (c) | RANTES influenced byTNF-TNFR axis | 19,180 | 13.75% | 5070 | 19.50% | −5.75 |
| (b) | increased AT1R in vascular smooth muscles cells | 53,444 | 38.32% | 11,962 | 46.01% | −7.69 |
| (b) | ACE downregulation | 55,806 | 40.02% | 15,432 | 59.36% | −19.34 |
| (c) | chronic inflammatory process | 86,157 | 61.78% | 25,870 | 99.51% | −37.73 |
| (c) | source of lymphocytes | 65,516 | 46.98% | 23,006 | 88.49% | −41.51 |
| MCT Set | Contained Transitions | Biological Meaning |
|---|---|---|
| , , , , , , , | Immune system’s response to inflammation | |
| , , , , | The process of SARS-CoV-2 entering the host cells | |
| , , , | Increased level of nitric oxide leads to a decrease in blood pressure | |
| , , | Extra-renal sodium retention | |
| , , | Modification lymphatic capillary network via VEGFR3 | |
| , | Th lymphocytes migration into the blood vessels | |
| , | Increased level of PGI2 by ANG-(1-7) and AT2R leads to a decrease in blood pressure | |
| , | eNOS uncoupling by peroxynitrite anion (ONOO) | |
| , | ANG-(1-7) binding to Mas receptor causes vasodilation, anti-thrombosis and anti-arrhythmogenic action | |
| , | Stimulation of aldosterone release, which leads to an increase in blood pressure |
Publisher’s Note: MDPI stays neutral with regard to jurisdictional claims in published maps and institutional affiliations. |
© 2021 by the authors. Licensee MDPI, Basel, Switzerland. This article is an open access article distributed under the terms and conditions of the Creative Commons Attribution (CC BY) license (https://creativecommons.org/licenses/by/4.0/).
Share and Cite
Formanowicz, D.; Gutowska, K.; Szawulak, B.; Formanowicz, P. The Crosstalk between SARS-CoV-2 Infection and the RAA System in Essential Hypertension—Analyses Using Systems Approach. Int. J. Mol. Sci. 2021, 22, 10518. https://0-doi-org.brum.beds.ac.uk/10.3390/ijms221910518
Formanowicz D, Gutowska K, Szawulak B, Formanowicz P. The Crosstalk between SARS-CoV-2 Infection and the RAA System in Essential Hypertension—Analyses Using Systems Approach. International Journal of Molecular Sciences. 2021; 22(19):10518. https://0-doi-org.brum.beds.ac.uk/10.3390/ijms221910518
Chicago/Turabian StyleFormanowicz, Dorota, Kaja Gutowska, Bartłomiej Szawulak, and Piotr Formanowicz. 2021. "The Crosstalk between SARS-CoV-2 Infection and the RAA System in Essential Hypertension—Analyses Using Systems Approach" International Journal of Molecular Sciences 22, no. 19: 10518. https://0-doi-org.brum.beds.ac.uk/10.3390/ijms221910518