
Quantum Artificial Neural Network Approach to Derive a Highly Predictive 3D-QSAR Model for Blood–Brain Barrier Passage

Abstract
:1. Introduction
2. Computational and Experimental Methods
2.1. Preparation of the Experimental Dataset to Derive and Validate the LogBB Prediction Model
2.2. Calculations of the 3D Molecular Descriptors
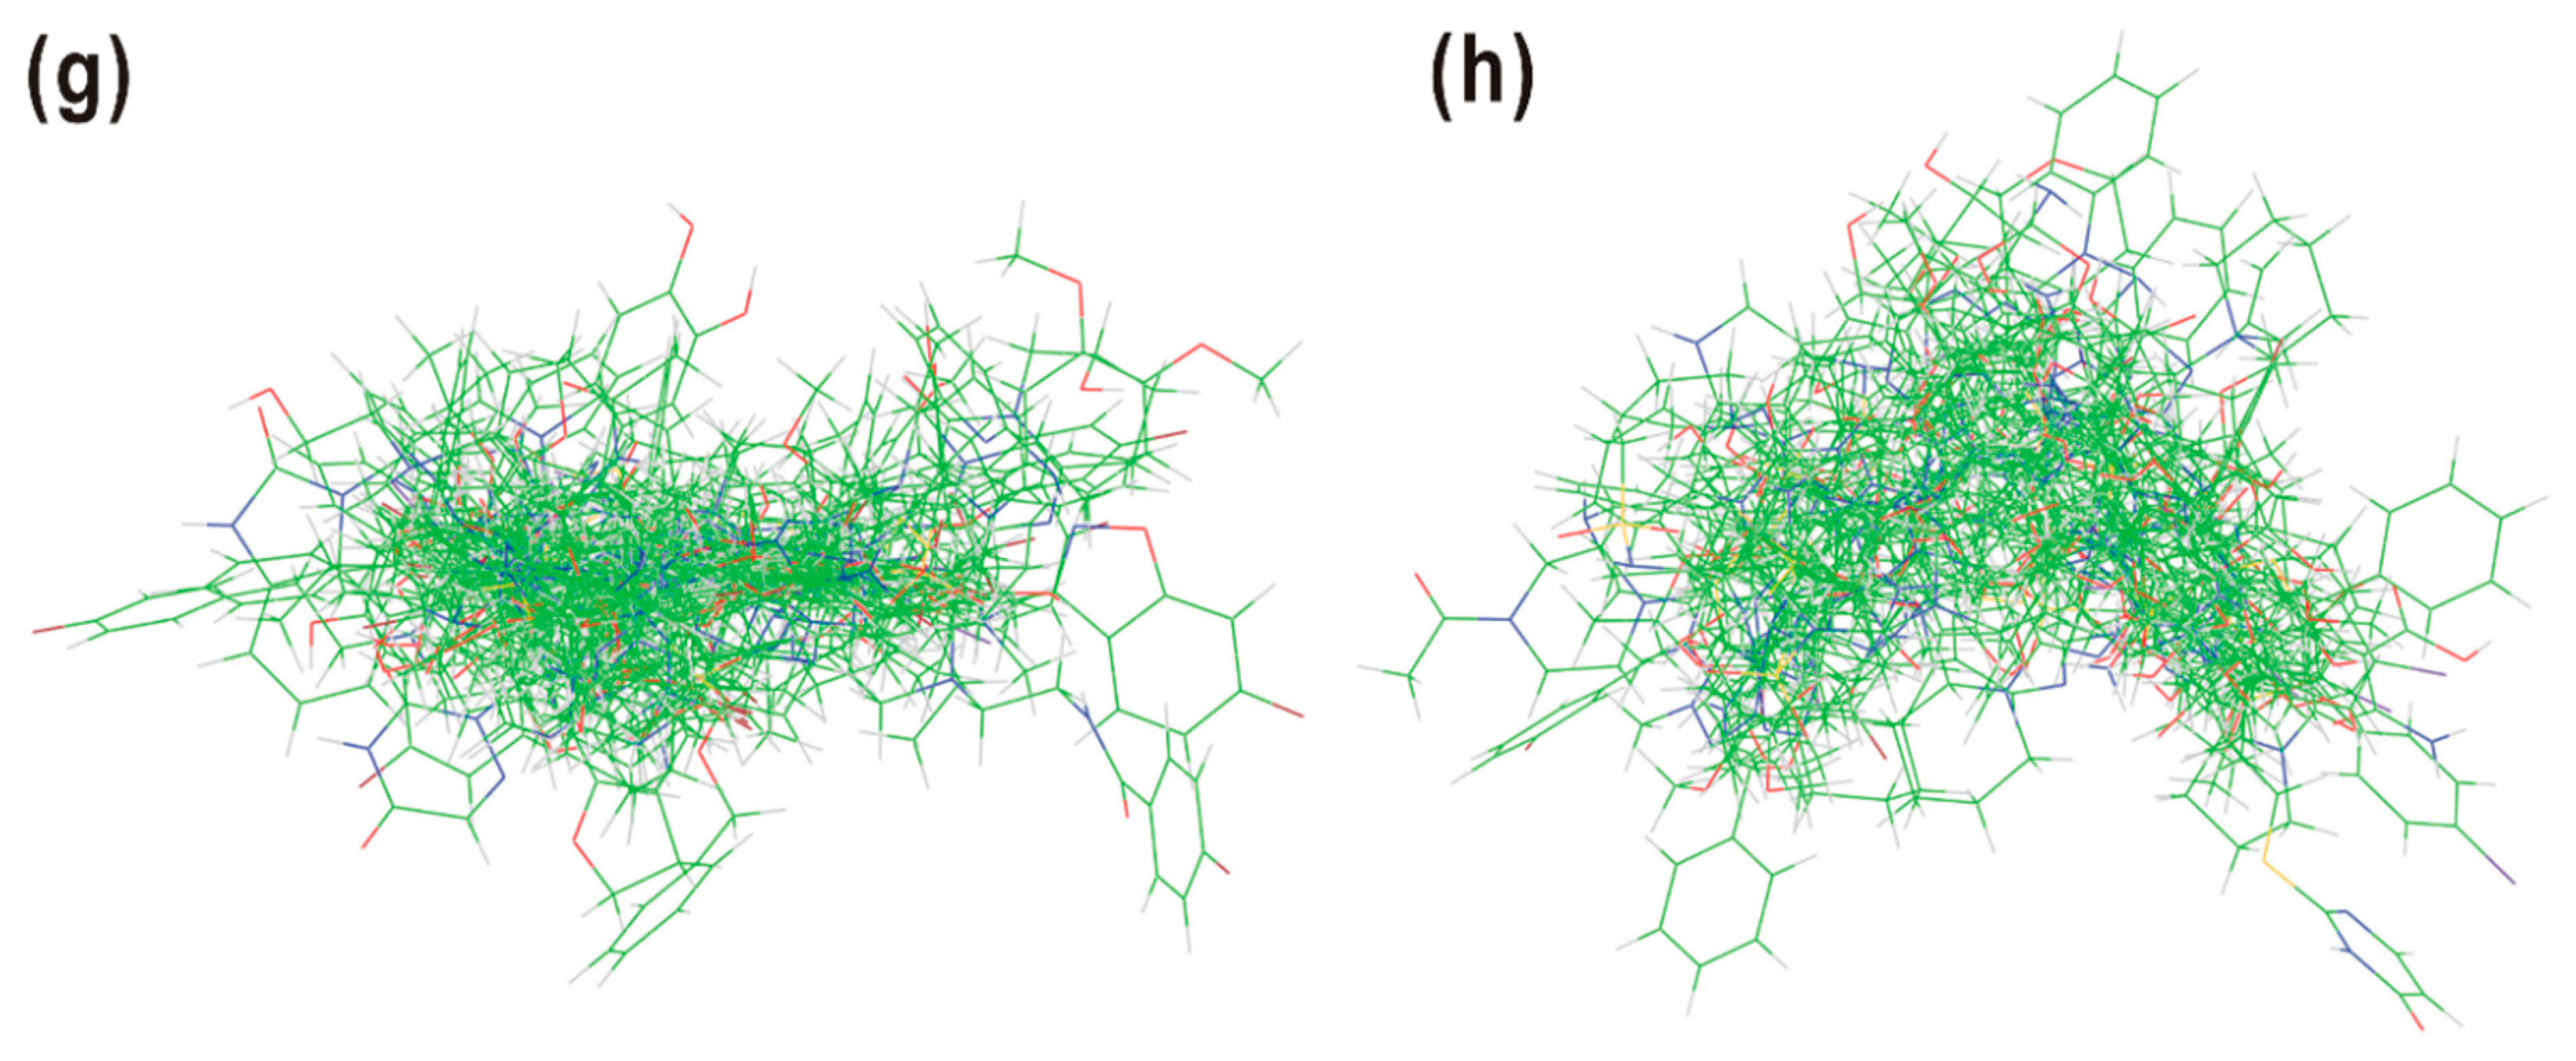
2.3. Pairwise 3D Molecular Alignments
2.4. Determination of the Template for Multiple Pairwise Alignments
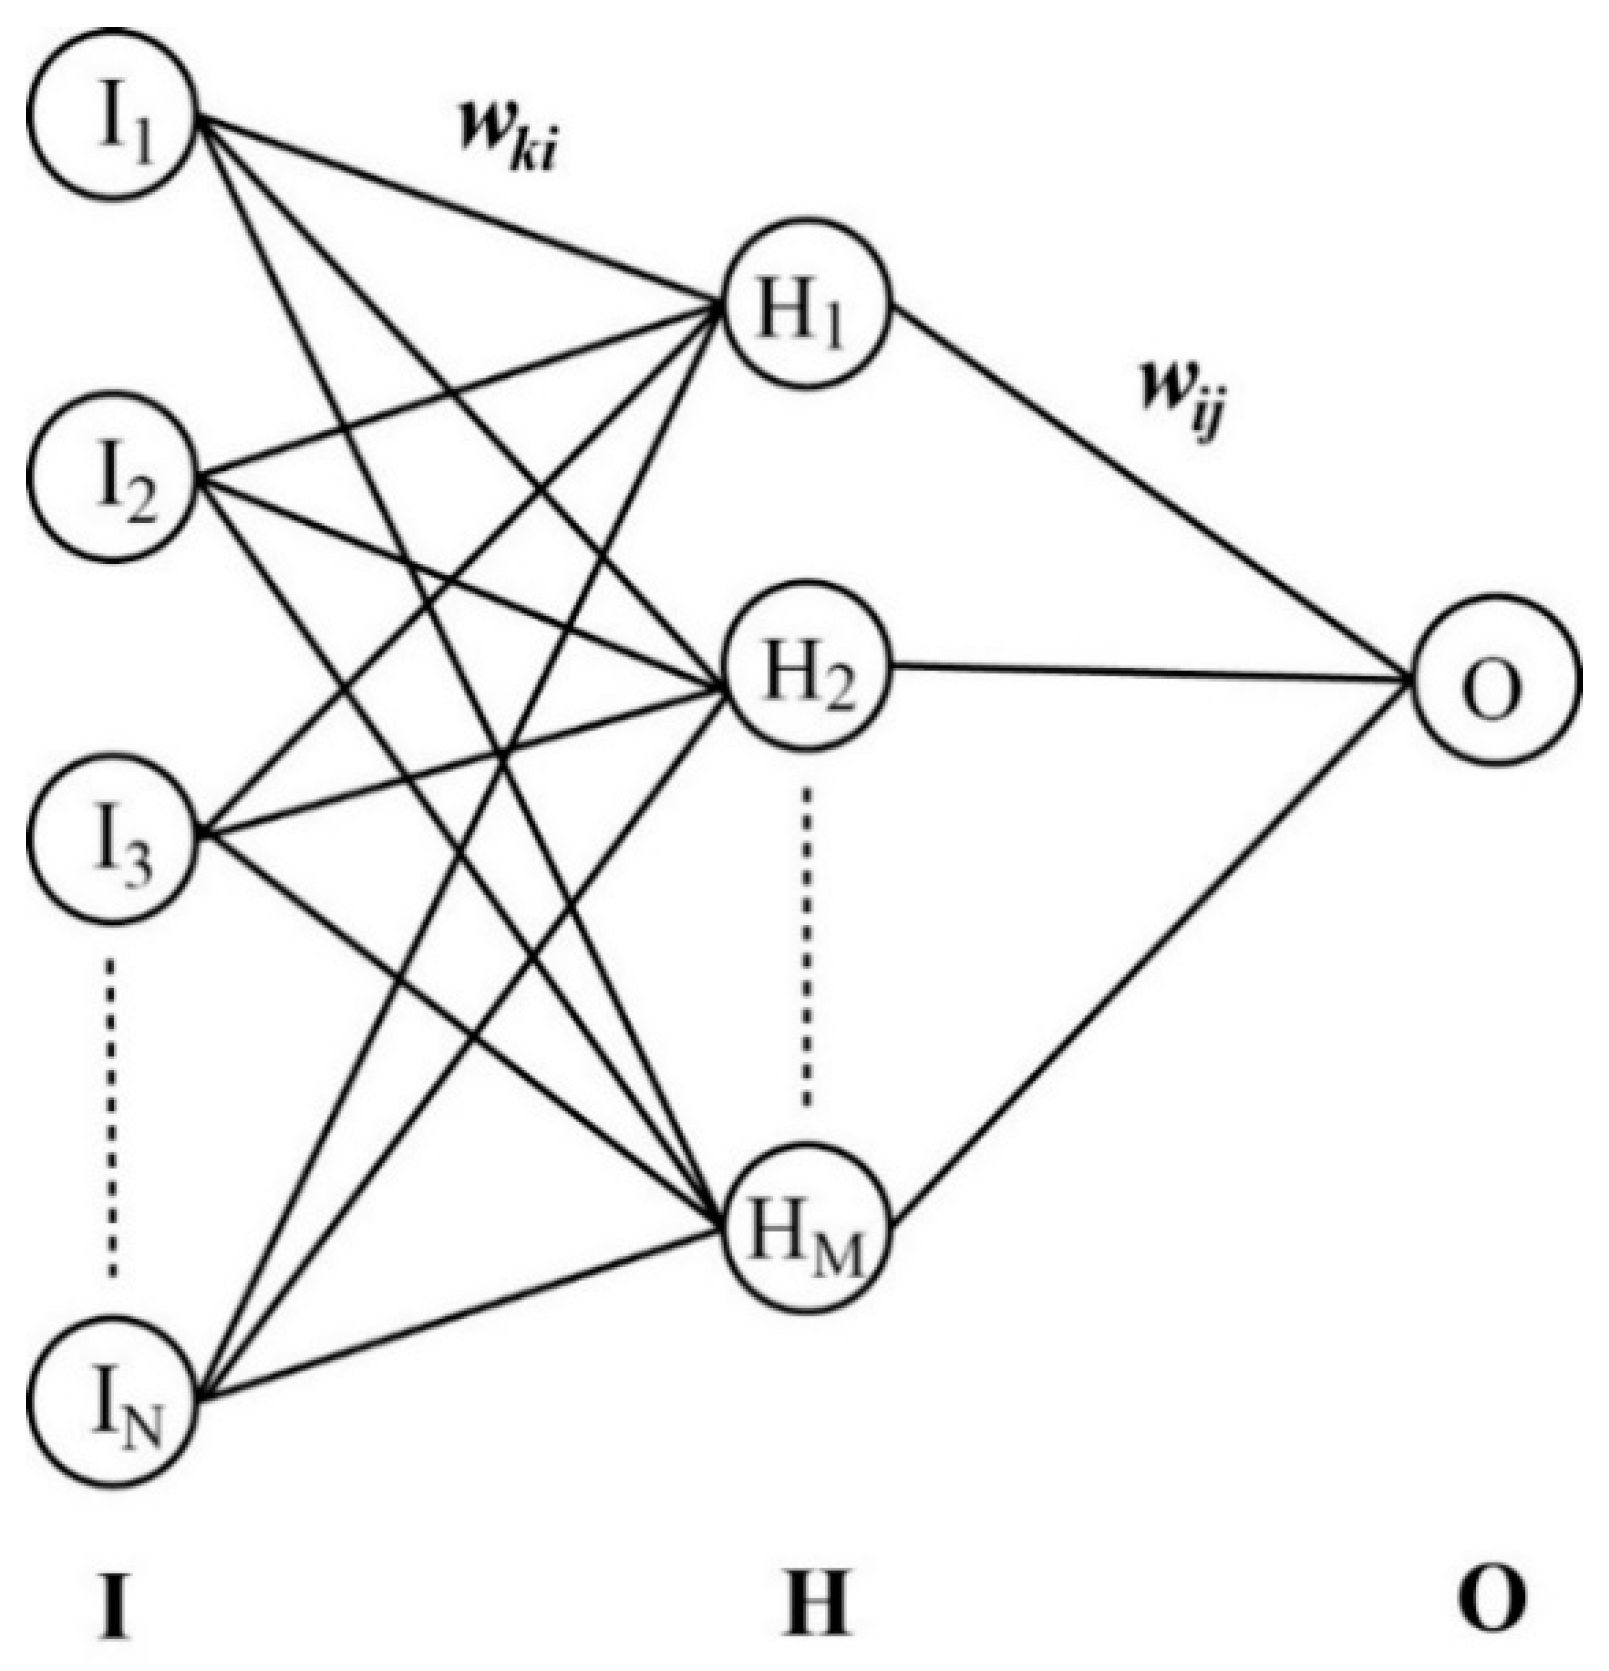
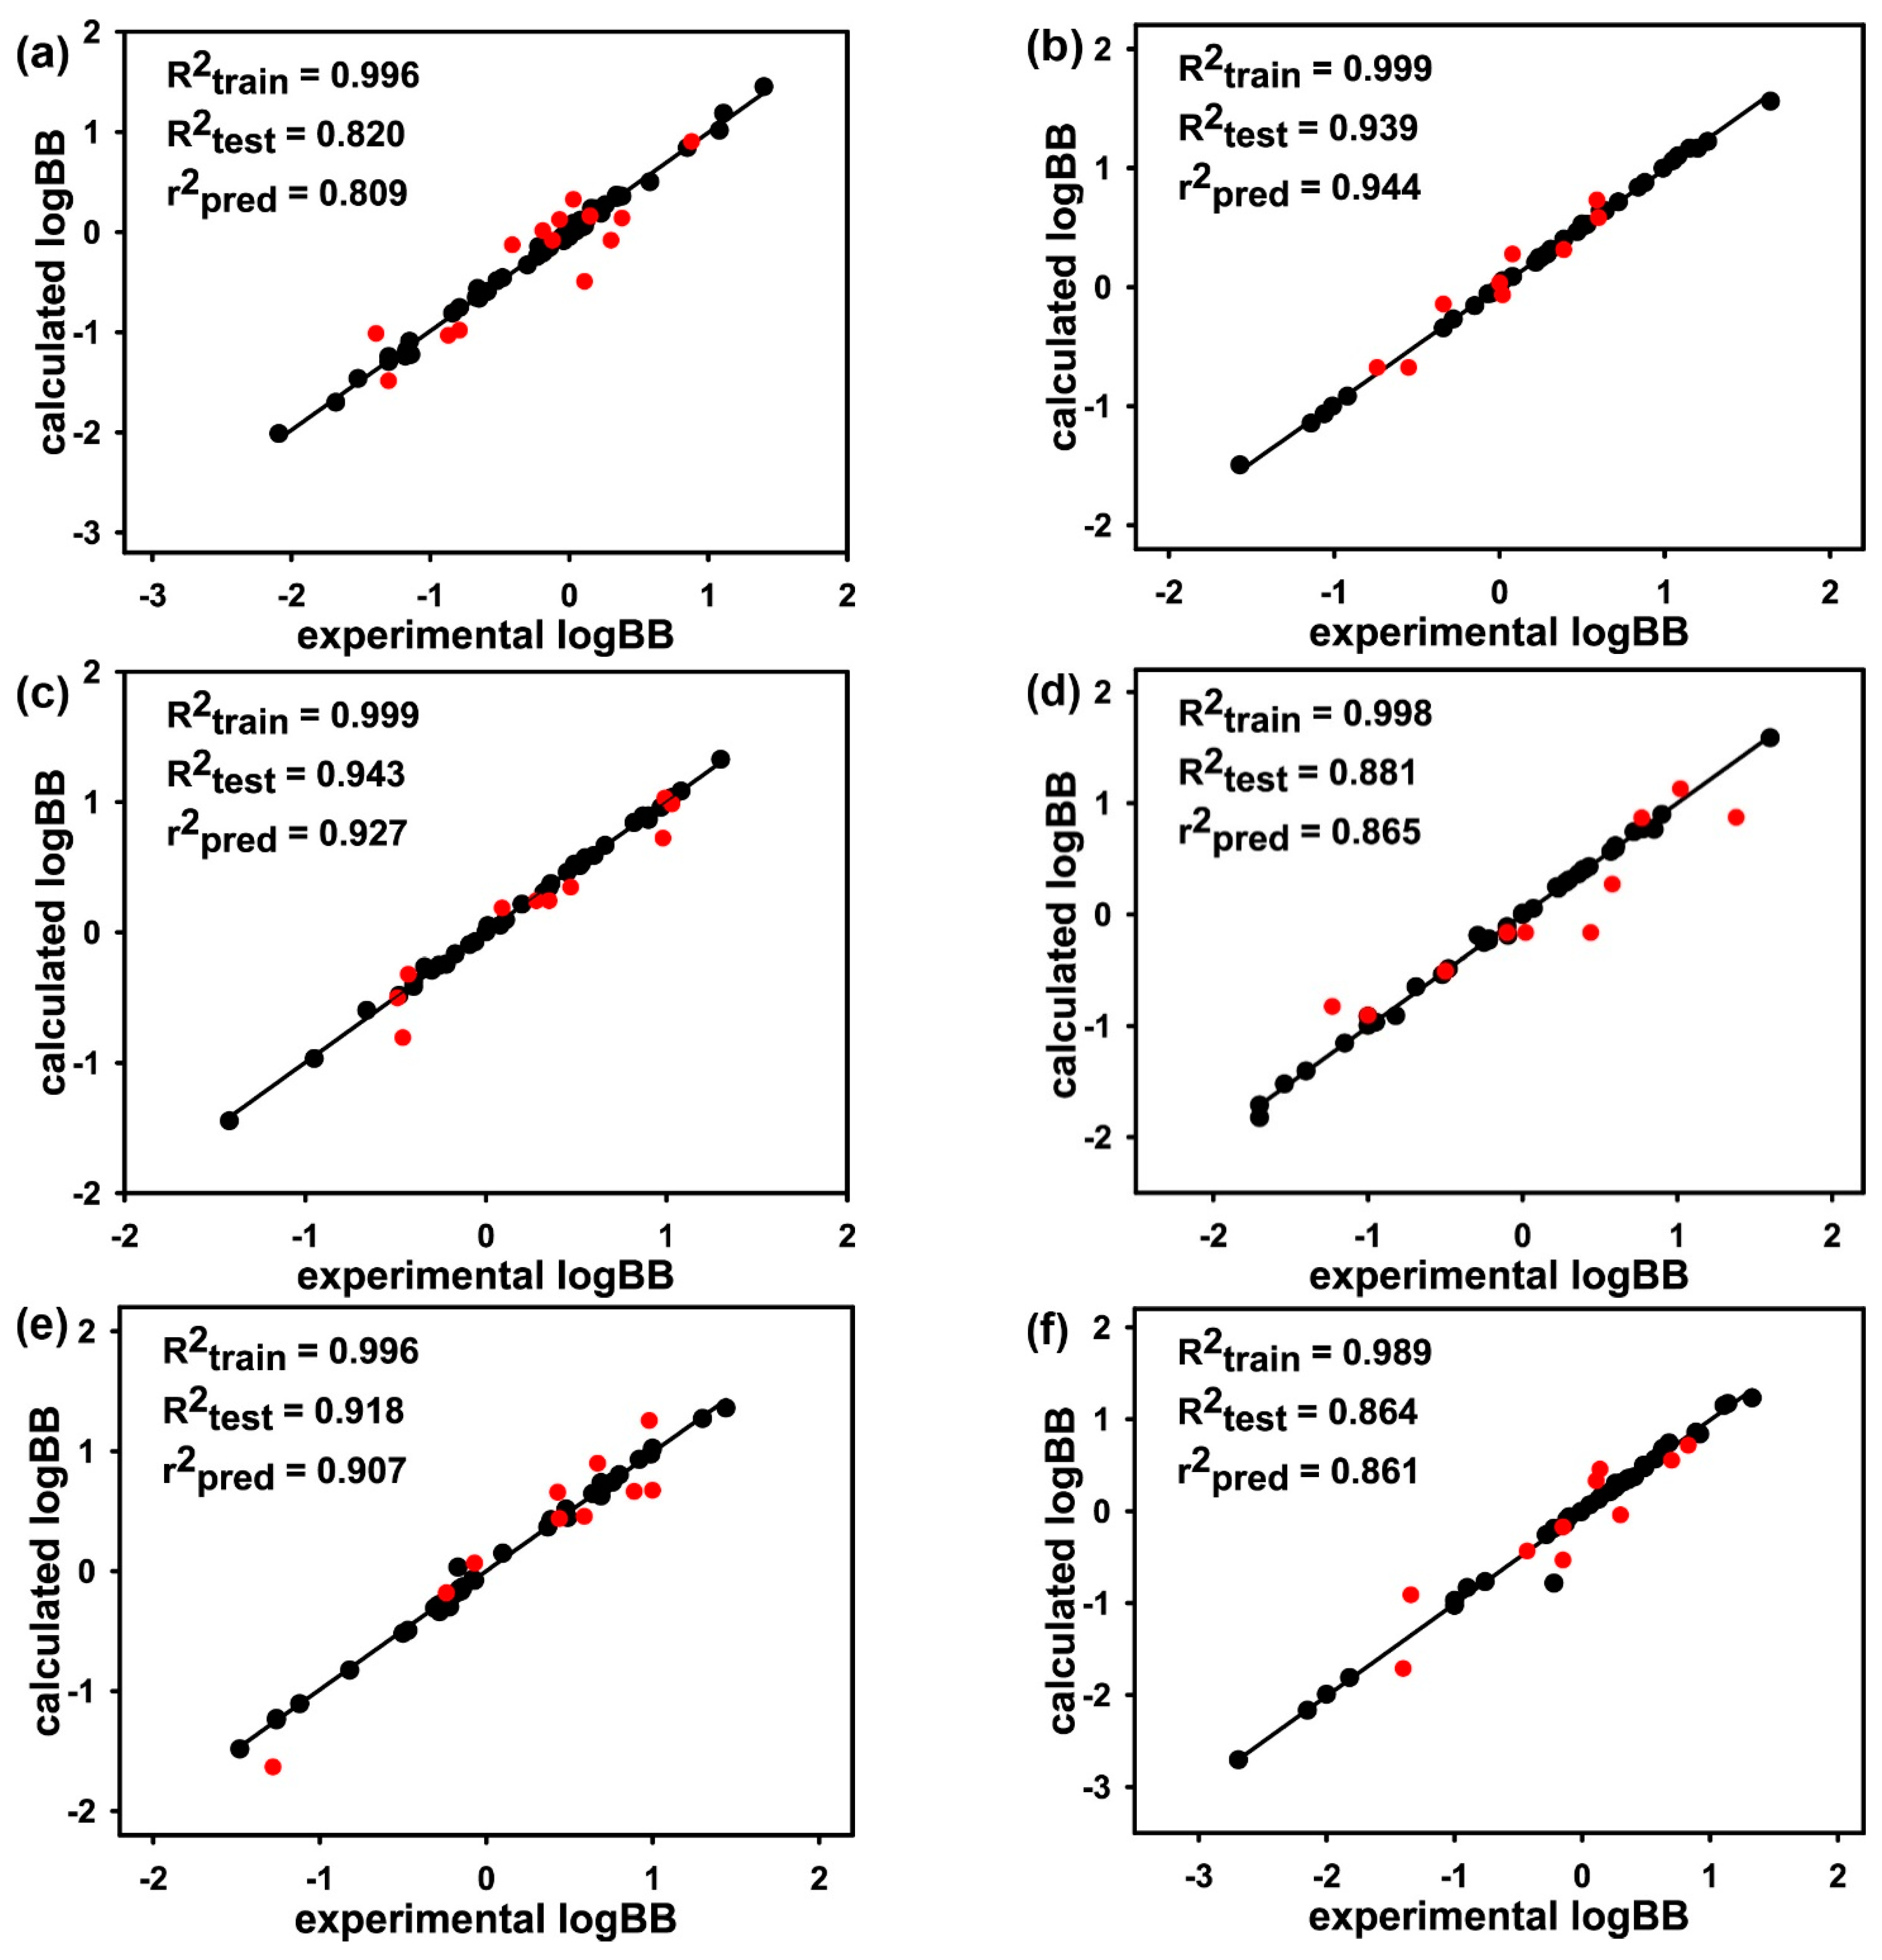
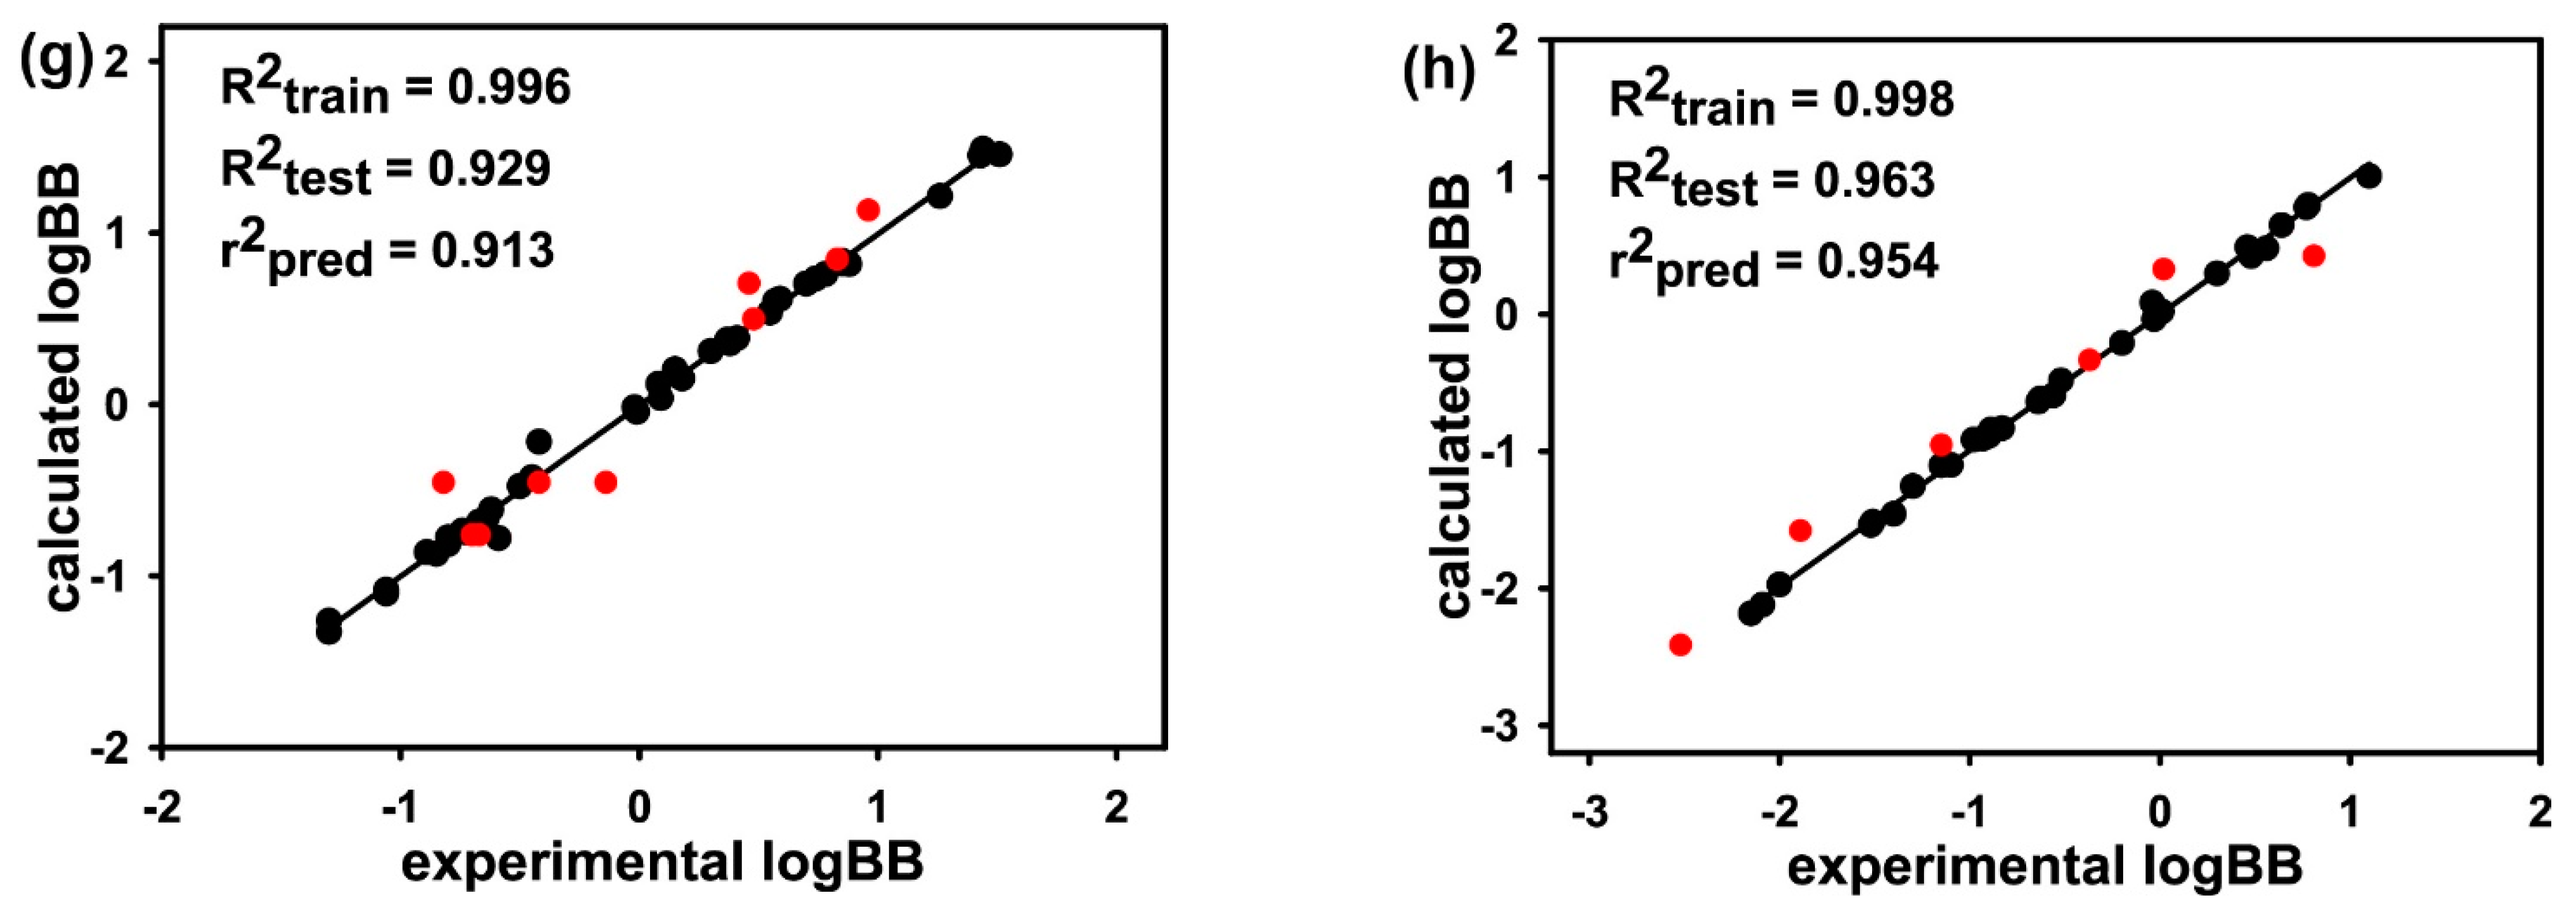
2.5. Derivation of the LogBB Prediction Models with ANN Algorithm
2.6. Experimental Determination of Molecular LogBB Values Using Mouse Models
3. Results and Discussion
4. Conclusions
Supplementary Materials
Author Contributions
Funding
Institutional Review Board Statement
Data Availability Statement
Acknowledgments
Conflicts of Interest
Abbreviations
| BBB | blood–brain barrier |
| CNS | central nervous system |
| LogBB | logarithm of the blood–brain partitioning |
| QSAR | quantitative structure-activity relationship |
| CoMFA | comparative molecular field analysis |
| CoMSIA | comparative molecular similarity index analysis |
| AI | artificial intelligence |
| ESP | electrostatic potential |
| MW | molecular weight |
| amu | atomic mass unit |
| PCA | principal component analysis |
| ANN | artificial neural network |
| GPU | graphics processing unit |
| AUC | area under the time-versus-concentration curve |
References
- Bodor, N.; Buchwald, P. Recent advances in the brain targeting of neuropharmaceuticals by chemical delivery systems. Adv. Drug Deliv. Rev. 1999, 36, 229–254. [Google Scholar] [CrossRef]
- Andersen, P.H.; Moscicki, R.; Sahakian, B.; Quirion, R.; Krishnan, R.; Race, T.; Phillips, A. Securing the future of drug discovery for central nervous system disorders. Nat. Rev. Drug Discov. 2014, 13, 871–872. [Google Scholar]
- Konovalov, D.A.; Coomans, D.; Deconinck, E.; Heyden, Y.V. Benchmarking of QSAR models for blood-brain barrier permeation. J. Chem. Inf. Model. 2007, 47, 1648–1656. [Google Scholar] [CrossRef] [PubMed]
- Cramer, R.D., III; Patterson, D.E.; Bunce, J.D. Comparative molecular field analysis (CoMFA). 1. Effect of shape on binding of steroids to carrier proteins. J. Am. Chem. Soc. 1988, 110, 5959–5967. [Google Scholar] [CrossRef] [PubMed]
- Kompany-Zareh, M.; Omidikia, N. Jackknife-based selection of Gram–Schmidt orthogonalized descriptors in QSAR. J. Chem. Inf. Model. 2010, 50, 2055–2066. [Google Scholar] [CrossRef]
- Güssregen, S.; Matter, H.; Hessler, G.; Müller, M.; Schmidt, F.; Clark, T. 3D-QSAR based on quantum-chemical molecular fields: Toward an improved description of halogen interactions. J. Chem. Inf. Model. 2012, 52, 2441–2453. [Google Scholar] [CrossRef]
- Klamt, A.; Thormann, M.; Wichmann, K.; Tosco, P. COSMOsar3D: Molecular field analysis based on local COSMO σ-profiles. J. Chem. Inf. Model. 2012, 52, 2157–2164. [Google Scholar] [CrossRef] [Green Version]
- Kerdawy, A.E.; Güssregen, S.; Matter, H.; Hennemann, M.; Clark, T. Quantum mechanics-based properties for 3D-QSAR. J. Chem. Inf. Model. 2013, 53, 1486–1502. [Google Scholar] [CrossRef]
- Cherkasov, A.; Muratov, E.N.; Fourches, D.; Varnek, A.; Baskin, I.I.; Cronin, M.; Dearden, J.; Gramatica, P.; Martin, Y.C.; Todeschini, R.; et al. QSAR modeling: Where have you been? Where are you going to? J. Med. Chem. 2014, 57, 4977–5010. [Google Scholar] [CrossRef] [Green Version]
- Cramer, R.D. R-Group template CoMFA combines benefits of “ad hoc” and topomer alignments using 3D-QSAR for lead optimization. J. Comput.-Aided Mol. Des. 2012, 26, 805–819. [Google Scholar] [CrossRef]
- Wendt, B.; Uhrig, U.; Bös, F. Capturing structure–activity relationships from chemogenomic spaces. J. Chem. Inf. Model. 2011, 51, 843–851. [Google Scholar] [CrossRef]
- Thormann, M.; Klamt, A.; Wichmann, K. COSMOsim3D: 3D-similarity and alignment based on COSMO polarization charge densities. J. Chem. Inf. Model. 2012, 52, 2149–2156. [Google Scholar] [CrossRef] [Green Version]
- Chan, S.L. MolAlign: An algorithm for aligning multiple small molecules. J. Comput.-Aided Mol. Des. 2017, 31, 523–546. [Google Scholar] [CrossRef]
- Schmidt, T.C.; Cosgrove, D.A.; Boström, J. ReFlex3D: Refined flexible alignment of molecules using shape and electrostatics. J. Chem. Inf. Model. 2018, 58, 747–760. [Google Scholar] [CrossRef]
- Ekins, S. The next era: Deep learning in pharmaceutical research. Pharm. Res. 2016, 33, 2594–2603. [Google Scholar] [CrossRef]
- Griffen, E.J.; Dossetter, A.G.; Leach, A.G.; Montague, S. Can we accelerate medicinal chemistry by augmenting the chemist with Big Data and artificial intelligence? Drug Discov. Today 2018, 23, 1373–1384. [Google Scholar] [CrossRef] [PubMed]
- Lei, T.; Sun, H.; Kang, Y.; Zhu, F.; Liu, H.; Zhou, W.; Wang, Z.; Li, D.; Li, Y.; Hou, T. ADMET evaluation in drug discovery. 18. Reliable prediction of chemical-induced urinary tract toxicity by boosting machine learning approaches. Mol. Pharm. 2017, 14, 3935–3953. [Google Scholar] [CrossRef] [PubMed]
- Korotcov, A.; Tkachenko, V.; Russo, D.P.; Ekins, S. Comparison of deep learning with multiple machine learning methods and metrics using diverse drug discovery data sets. Mol. Pharm. 2017, 14, 4462–4475. [Google Scholar] [CrossRef] [PubMed]
- Toropov, A.A.; Toropova, A.P.; Beeg, M.; Gobbib, M.; Salmona, M. QSAR model for blood-brain barrier permeation. J. Pharmacol. Toxicol. Methods 2017, 88, 7–18. [Google Scholar] [CrossRef]
- Wu, K.; Wei, G.W. Quantitative toxicity prediction using topology based multitask deep neural networks. J. Chem. Inf. Model. 2018, 58, 520–531. [Google Scholar] [CrossRef]
- Pirovano, A.; Brandmaier, S.; Huijbregts, M.A.J.; Ragas, A.M.J.; Veltman, K.; Hendriks, A.J. QSARs for estimating intrinsic hepatic clearance of organic chemicals in humans. Environ. Toxicol. Pharmacol. 2016, 42, 190–197. [Google Scholar] [CrossRef]
- Fraser, K.; Bruckner, D.M.; Dordick, J.S. Advancing predictive hepatotoxicity at the intersection of experimental, in silico, and artificial intelligence technologies. Chem. Res. Toxicol. 2018, 31, 412–430. [Google Scholar] [CrossRef]
- Pecoraro, B.; Tutone, M.; Hoffman, E.; Hutter, V.; Almerico, A.M.; Traynor, M. Predicting skin permeability by means of computational approaches: Reliability and caveats in pharmaceutical studies. J. Chem. Inf. Model. 2019, 59, 1759–1771. [Google Scholar] [CrossRef]
- Roy, D.; Hinge, V.K.; Kovalenko, A. To pass or not to pass: Predicting the blood–brain barrier permeability with the 3D-RISM-KH molecular solvation theory. ACS Omega 2019, 4, 16774–16780. [Google Scholar] [CrossRef]
- Liu, L.; Zhang, L.; Feng, H.; Li, S.; Liu, M.; Zhao, J.; Liu, H. Prediction of the blood–brain barrier (BBB) permeability of chemicals based on machine-learning and ensemble methods. Chem. Res. Toxicol. 2021, 34, 1456–1467. [Google Scholar] [CrossRef]
- Choi, H.; Kang, H.; Chung, K.C.; Park, H. Development and application of a comprehensive machine learning program for predicting molecular biochemical and pharmaceutical properties. Phys. Chem. Chem. Phys. 2019, 21, 5189–5199. [Google Scholar] [CrossRef]
- Ooms, F.; Weber, P.; Carrupt, P.A.; Testa, B. A simple model to predict blood-brain barrier permeation from 3D molecular fields. Biochim. Biophys. Acta 2002, 1587, 118–125. [Google Scholar] [CrossRef]
- Brito-Sanchez, Y.; Marrero-Ponce, Y.; Barigye, S.J.; Yaber-Goenaga, I.; Perez, C.M.; Le-Thi-Thu, H.; Cherkasov, A. Towards better BBB passage prediction using an extensive and curated data set. Mol. Inform. 2015, 34, 308–330. [Google Scholar] [CrossRef] [PubMed]
- Cramer, R.D.; Wendt, B. Template CoMFA: The 3D-QSAR grail? J. Chem. Inf. Model. 2014, 54, 660–671. [Google Scholar] [CrossRef] [PubMed]
- Song, M.; Clark, M. Development and evaluation of an in silico model for hERG binding. J. Chem. Inf. Model. 2006, 46, 392–400. [Google Scholar] [CrossRef]
- Liu, R.; Sun, H.; So, S.S. Development of quantitative structure–property relationship models for early ADME evaluation in drug discovery. 2. Blood-brain barrier penetration. J. Chem. Inf. Comput. Sci. 2001, 41, 1623–1632. [Google Scholar] [CrossRef] [PubMed]
- Buslaev, P.; Gordeliy, V.; Grudinin, S.; Gushchin, I. Principal component analysis of lipid molecule conformational changes in molecular dynamics simulations. J. Chem. Theory Comput. 2016, 12, 1019–1028. [Google Scholar] [CrossRef]
- Maisuradze, G.G.; Liwo, A.; Scheraga, H.A. Principal component analysis for protein folding dynamics. J. Mol. Biol. 2009, 385, 312–329. [Google Scholar] [CrossRef] [PubMed] [Green Version]
- Yershova, A.; Jain, S.; Lavalle, S.M.; Mitchell, J.C. Generating uniform incremental grids on SO(3) using the Hopf fibration. Int. J. Robot. Res. 2010, 29, 801–812. [Google Scholar] [CrossRef] [PubMed] [Green Version]
- Kozakov, D.; Brenke, R.; Comeau, S.R.; Vajda, S. PIPER: An FFT-based protein docking program with pairwise potentials. Proteins 2006, 65, 392–406. [Google Scholar] [CrossRef] [Green Version]
- Freeman, L.C. A set of measures of centrality based on betweenness. Sociometry 1977, 40, 35–41. [Google Scholar] [CrossRef]
- Newman, M.E. A measure of betweenness centrality based on random walks. Soc. Netw. 2005, 27, 39–54. [Google Scholar] [CrossRef] [Green Version]
- Rumelhart, D.E.; Hinton, G.E.; Williams, R.J. Learning representations by back-propagating errors. Nature 1986, 323, 533–536. [Google Scholar] [CrossRef]
- Geldenhuys, W.J.; Lockman, P.R.; Nguyen, T.H.; Van der Schyf, C.J.; Crooks, P.A.; Dwoskin, L.P.; Allen, D.D. 3D-QSAR study of bis-azaaromatic quaternary ammonium analogs at the blood–brain barrier choline transporter. Bioorg. Med. Chem. 2005, 13, 4253–4261. [Google Scholar] [CrossRef]
- Tropsha, A.; Gramatica, P.; Gombar, V.K. The importance of being earnest: Validation is the absolute essential for successful application and interpretation of QSPR models. QSAR Comb. Sci. 2003, 22, 69–77. [Google Scholar] [CrossRef]
- Gramatica, P.; Sangion, A. A historical excursus on the statistical validation parameters for QSAR models: A clarification concerning metrics and terminology. J. Chem. Inf. Model. 2016, 56, 1127–1131. [Google Scholar] [CrossRef] [PubMed]
- Shi, L.M.; Fang, H.; Tong, W.D.; Wu, J.; Perkins, R.; Blair, R.M.; Branham, W.S.; Dial, S.L.; Moland, C.I.; Sheehan, D.M. QSAR models using a large diverse set of estrogens. J. Chem. Inf. Comput. Sci. 2001, 41, 186–195. [Google Scholar] [CrossRef] [PubMed]
- Politzer, P.; Laurence, P.R.; Jayasuriya, K. Molecular electrostatic potentials: An effective tool for the elucidation of biochemical phenomena. Environ. Health Perspect. 1985, 61, 191–202. [Google Scholar] [CrossRef] [PubMed]
- Briard, J.G.; Fernandez, M.; Luna, P.D.; Woo, T.K.; Robert, N.; Ben, R.N. QSAR accelerated discovery of potent ice recrystallization inhibitors. Sci. Rep. 2016, 6, 26403. [Google Scholar] [CrossRef] [Green Version]
- Roy, A.; Skolnick, J. LIGSIFT: An open-source tool for ligand structural alignment and virtual screening. Bioinformatics 2015, 31, 539–544. [Google Scholar] [CrossRef] [PubMed] [Green Version]
- Young, R.J.; Green, D.V.S.; Luscombe, C.N.; Hill, A.P. Getting physical in drug discovery II: The impact of chromatographic hydrophobicity measurements and aromaticity. Drug Discov. Today 2011, 16, 822–830. [Google Scholar] [CrossRef]
- Gramatica, P. Principles of QSAR models validation: Internal and external. QSAR Comb. Sci. 2007, 26, 694–701. [Google Scholar] [CrossRef]
- Roy, D.; Hinge, V.K.; Kovalenko, A. Predicting blood–brain partitioning of small molecules using a novel minimalistic descriptor-based approach via the 3D-RISM-KH molecular solvation theory. ACS Omega 2019, 4, 3055–3060. [Google Scholar] [CrossRef]
- Radchenko, E.V.; Dyabina, A.S.; Palyulin, V.A. Towards deep neural network models for the prediction of the blood–brain barrier permeability for diverse organic compounds. Molecules 2020, 25, 5901. [Google Scholar] [CrossRef]
- Jeram, S.; Riego Sintes, J.M.; Halder, M.; Baraibar Fentanes, J.; Sokull-Klüttgen, B.; Hutchinson, T.H. A strategy to reduce the use of fish in acute ecotoxicity testing of new chemical substances notified in the European Union. Regul. Toxicol. Pharmacol. 2005, 42, 218–224. [Google Scholar] [CrossRef]
- Hopfinger, A.J.; Wang, S.; Tokarski, J.S.; Jin, B.; Albuquerque, M.; Madhav, P.J.; Duraiswami, C. Construction of 3D-QSAR models using the 4D-QSAR analysis formalism. J. Am. Chem. Soc. 1997, 119, 10509–10524. [Google Scholar] [CrossRef]


| Molecular Subset | MW Range | LogBB Range | No. of Training-Set Molecules | No. of Test-Set Molecules |
|---|---|---|---|---|
| Subset 1 | 200–250 | −2.09–1.40 | 57 | 14 |
| Subset 2 | 251–275 | −1.57–1.64 | 39 | 9 |
| Subset 3 | 276–301 | −1.42–1.30 | 40 | 10 |
| Subset 4 | 302–323 | −1.70–1.60 | 40 | 10 |
| Subset 5 | 324–360 | −1.48–1.44 | 40 | 10 |
| Subset 6 | 361–398 | −2.69–1.33 | 40 | 10 |
| Subset 7 | 399–453 | −1.30–1.51 | 40 | 9 |
| Subset 8 | 454–600 | −2.15–1.10 | 32 | 6 |
| Subset 1 | Subset 2 | Subset 3 | Subset 4 | Subset 5 | Subset 6 | Subset 7 | Subset 8 | |
|---|---|---|---|---|---|---|---|---|
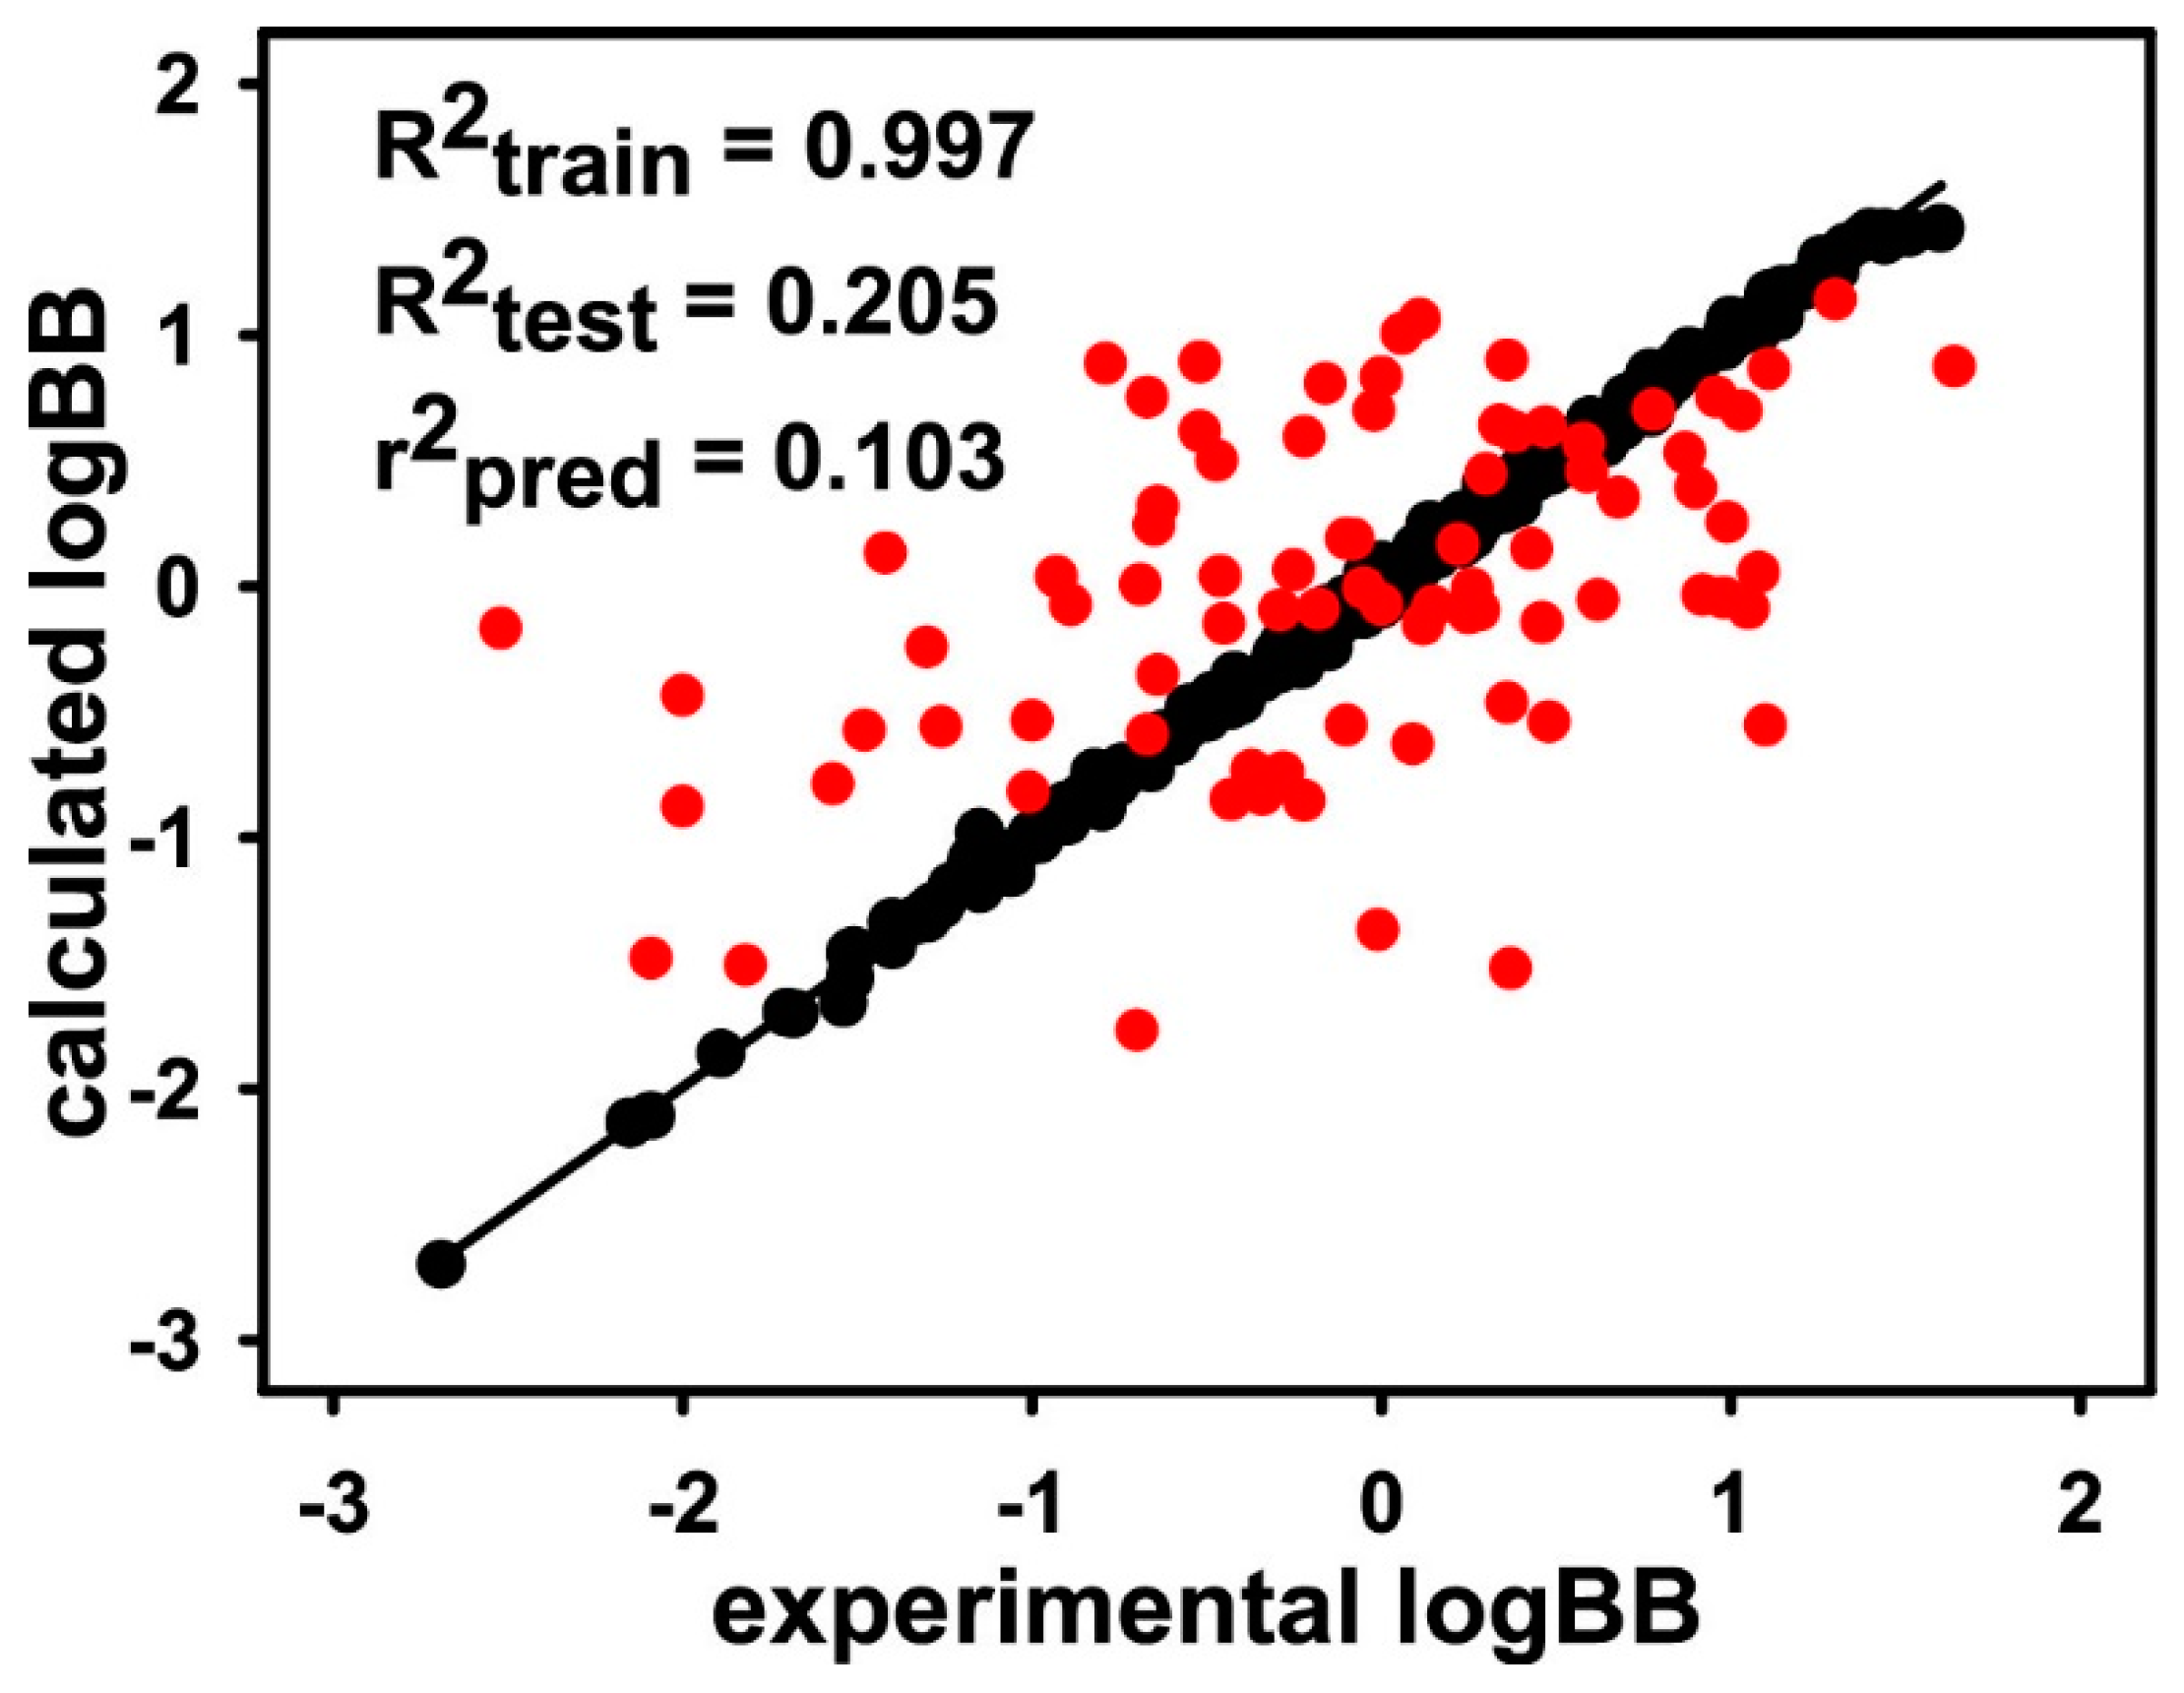
| R2train | 0.998 | 0.997 | 0.998 | 0.998 | 0.997 | 0.999 | 0.998 | 0.997 |
| R2test | 0.592 | 0.785 | 0.601 | 0.748 | 0.656 | 0.749 | 0.692 | 0.703 |
| r2pred | 0.559 | 0.694 | 0.597 | 0.714 | 0.655 | 0.659 | 0.663 | 0.658 |
| Molecules | Chemical Formula | MW | Calculated LogBB | Experimental LogBB |
|---|---|---|---|---|
| 1 | C15H10Cl2N2O2 | 321.2 | −0.16 | 0.44 |
| 2 | C10H12N4O3 | 236.2 | −0.77 | −1.30 |
| carbamazepine | C15H12N2O | 236.3 | −0.04 | −0.14 |
| 3 | C17H17ClN8O | 384.8 | −0.02 | −0.25 |
| 4 | C22H25ClN6O3 | 456.9 | −0.67 | −0.39 |
| 5 | C23H27ClN6O3 | 471.0 | −0.24 | −0.44 |
| 6 | C25H32ClN7O2 | 498.0 | 0.26 | −0.09 |
| 7 | C19H21F4N5O3 | 443.4 | −0.21 | −0.07 |
| 8 | C25H26F3N5O3 | 501.5 | −0.74 | −0.21 |
| 9 | C24H20F3N5O3 | 483.5 | −2.07 | −1.70 |
| 10 | C28H31N7O3 | 513.6 | −0.25 | −0.38 |
| 11 | C17H23N5O2 | 329.4 | 0.46 | 0.54 |
| 12 | C24H31N3O2 | 393.5 | −0.73 | −0.38 |
Publisher’s Note: MDPI stays neutral with regard to jurisdictional claims in published maps and institutional affiliations. |
© 2021 by the authors. Licensee MDPI, Basel, Switzerland. This article is an open access article distributed under the terms and conditions of the Creative Commons Attribution (CC BY) license (https://creativecommons.org/licenses/by/4.0/).
Share and Cite
Kim, T.; You, B.H.; Han, S.; Shin, H.C.; Chung, K.-C.; Park, H. Quantum Artificial Neural Network Approach to Derive a Highly Predictive 3D-QSAR Model for Blood–Brain Barrier Passage. Int. J. Mol. Sci. 2021, 22, 10995. https://0-doi-org.brum.beds.ac.uk/10.3390/ijms222010995
Kim T, You BH, Han S, Shin HC, Chung K-C, Park H. Quantum Artificial Neural Network Approach to Derive a Highly Predictive 3D-QSAR Model for Blood–Brain Barrier Passage. International Journal of Molecular Sciences. 2021; 22(20):10995. https://0-doi-org.brum.beds.ac.uk/10.3390/ijms222010995
Chicago/Turabian StyleKim, Taeho, Byoung Hoon You, Songhee Han, Ho Chul Shin, Kee-Choo Chung, and Hwangseo Park. 2021. "Quantum Artificial Neural Network Approach to Derive a Highly Predictive 3D-QSAR Model for Blood–Brain Barrier Passage" International Journal of Molecular Sciences 22, no. 20: 10995. https://0-doi-org.brum.beds.ac.uk/10.3390/ijms222010995