
Nanosecond Pulsed Electric Field Only Transiently Affects the Cellular and Molecular Processes of Leydig Cells

 , , , , , , and
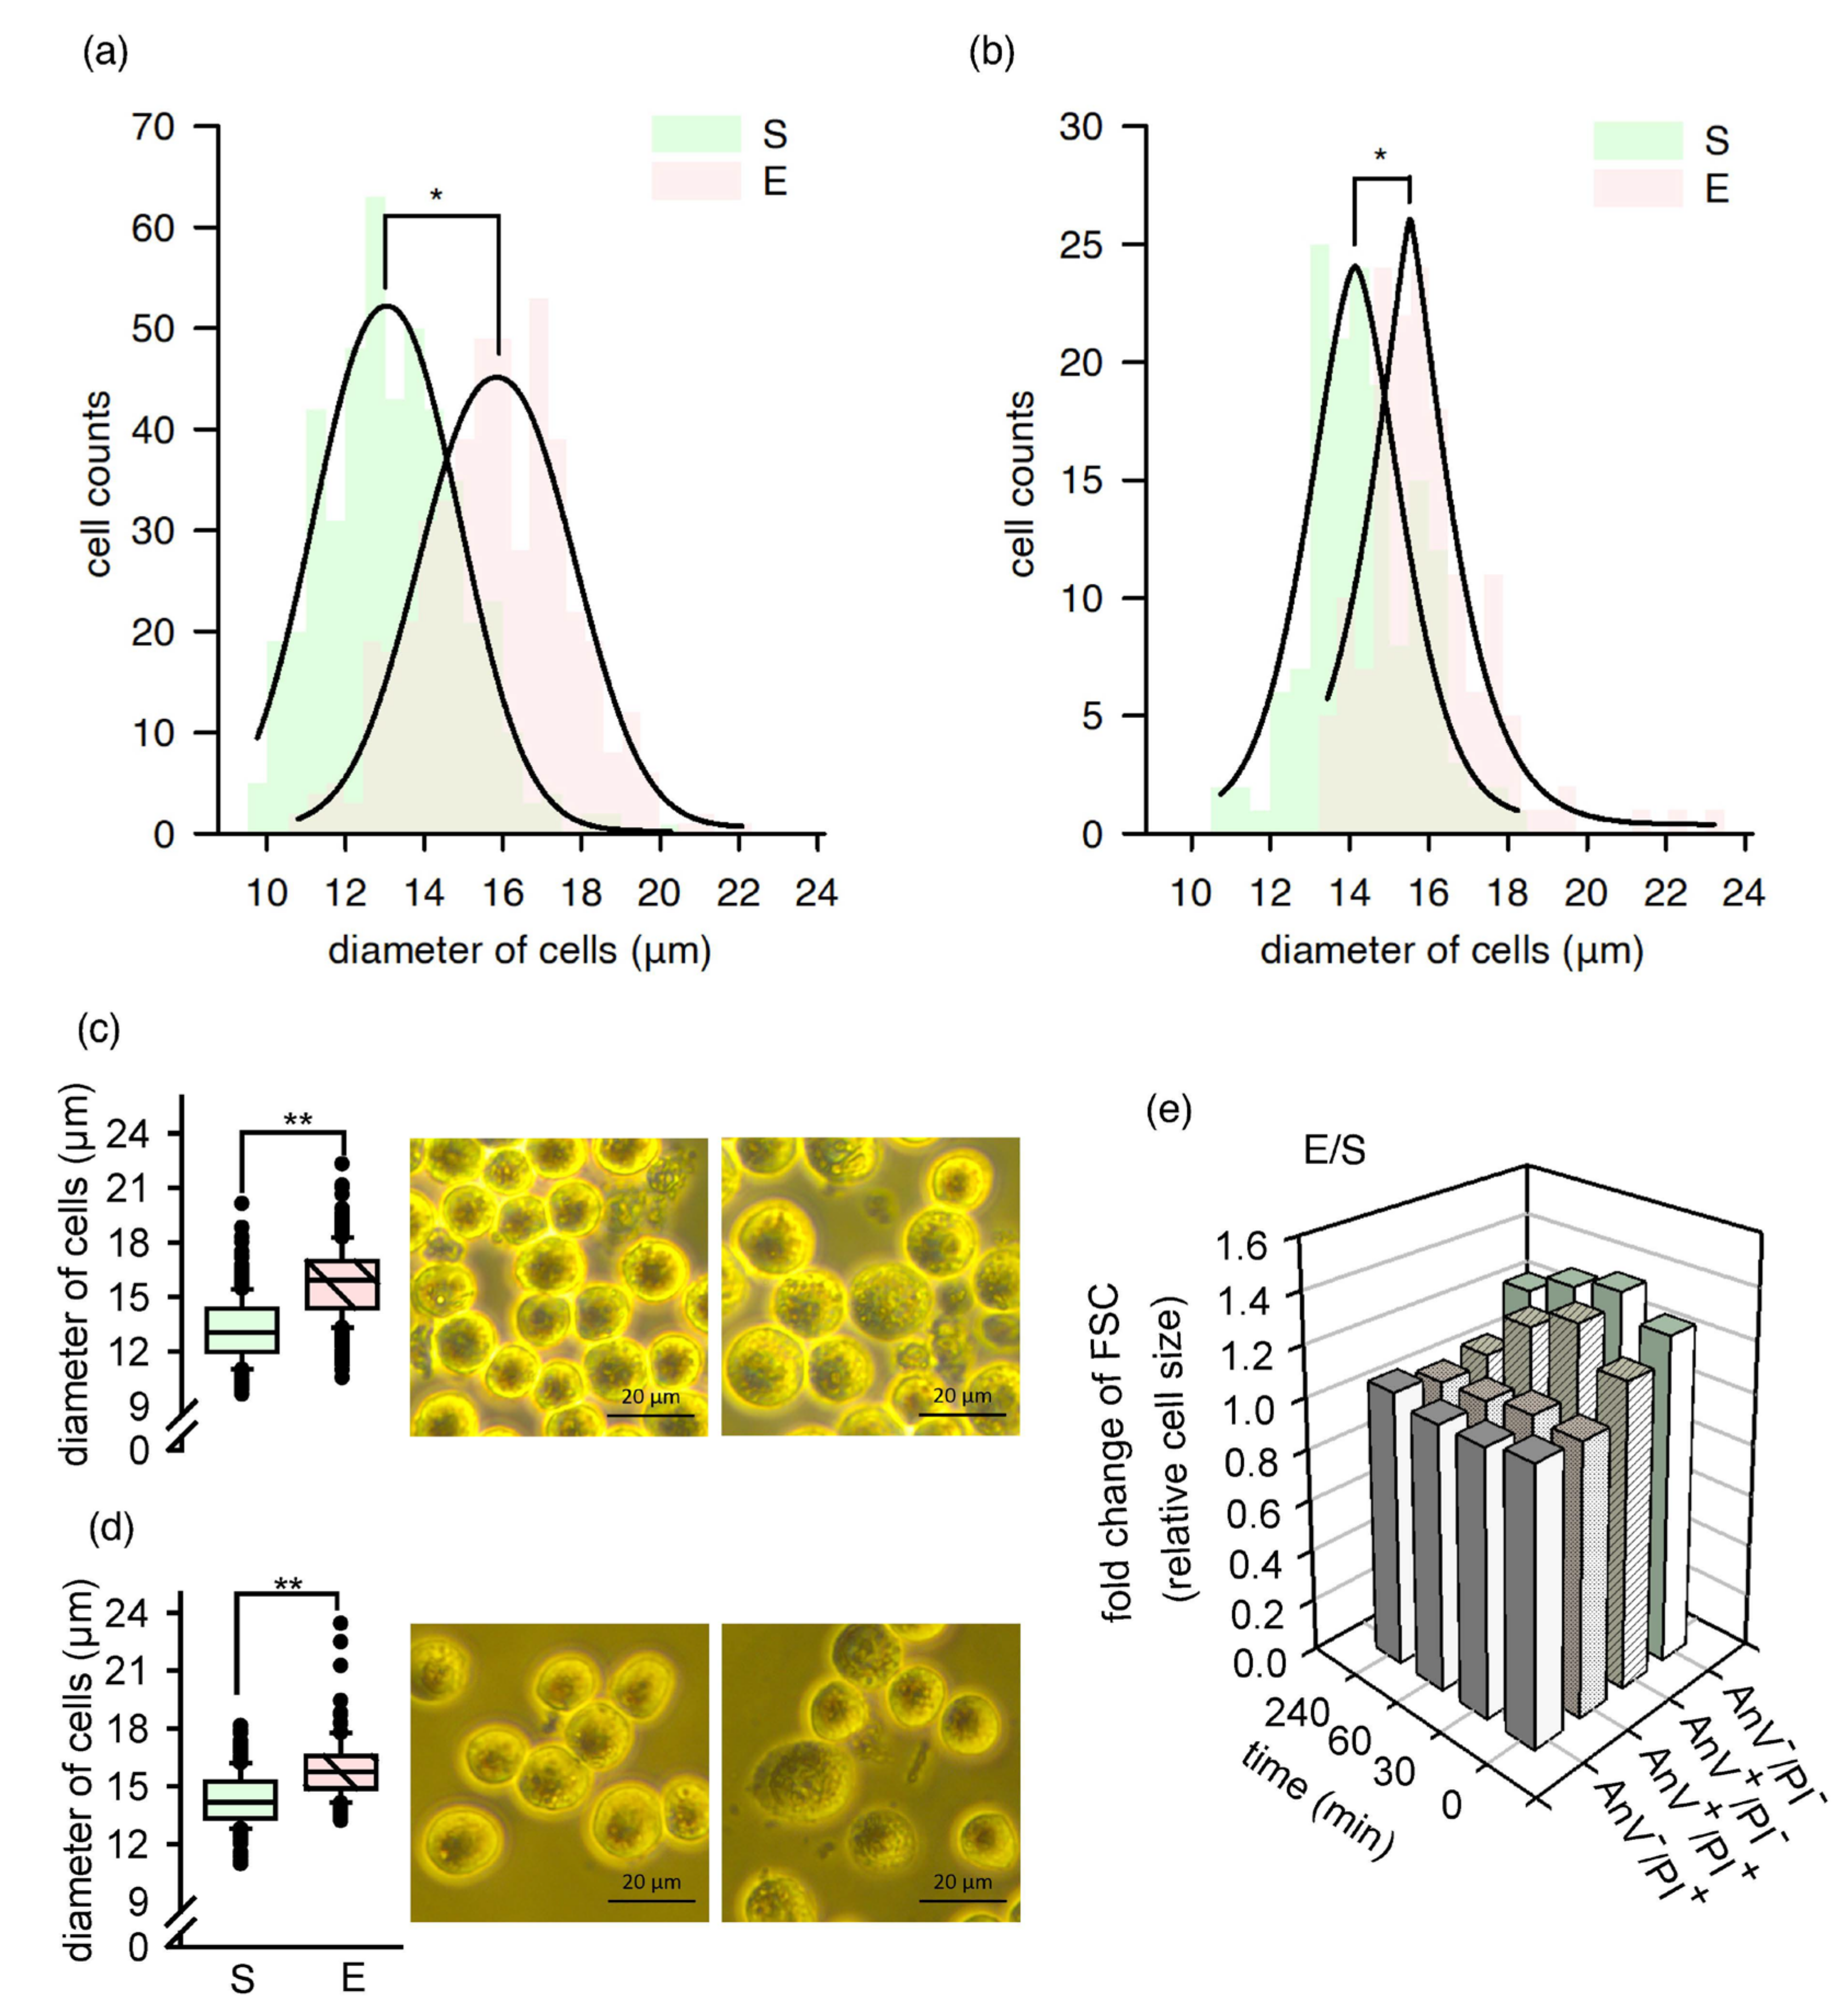
Abstract
:1. Introduction
2. Results
2.1. Temperature Not Elevated during nsPEF Treatment
2.2. A Fraction of Cells Increased in Size, and Their Morphology Temporarily Changed
2.3. Adhesion of nsPEF-Exposed Cells Diminished
2.4. Apoptosis in Only a Small Fraction of Exposed Cells
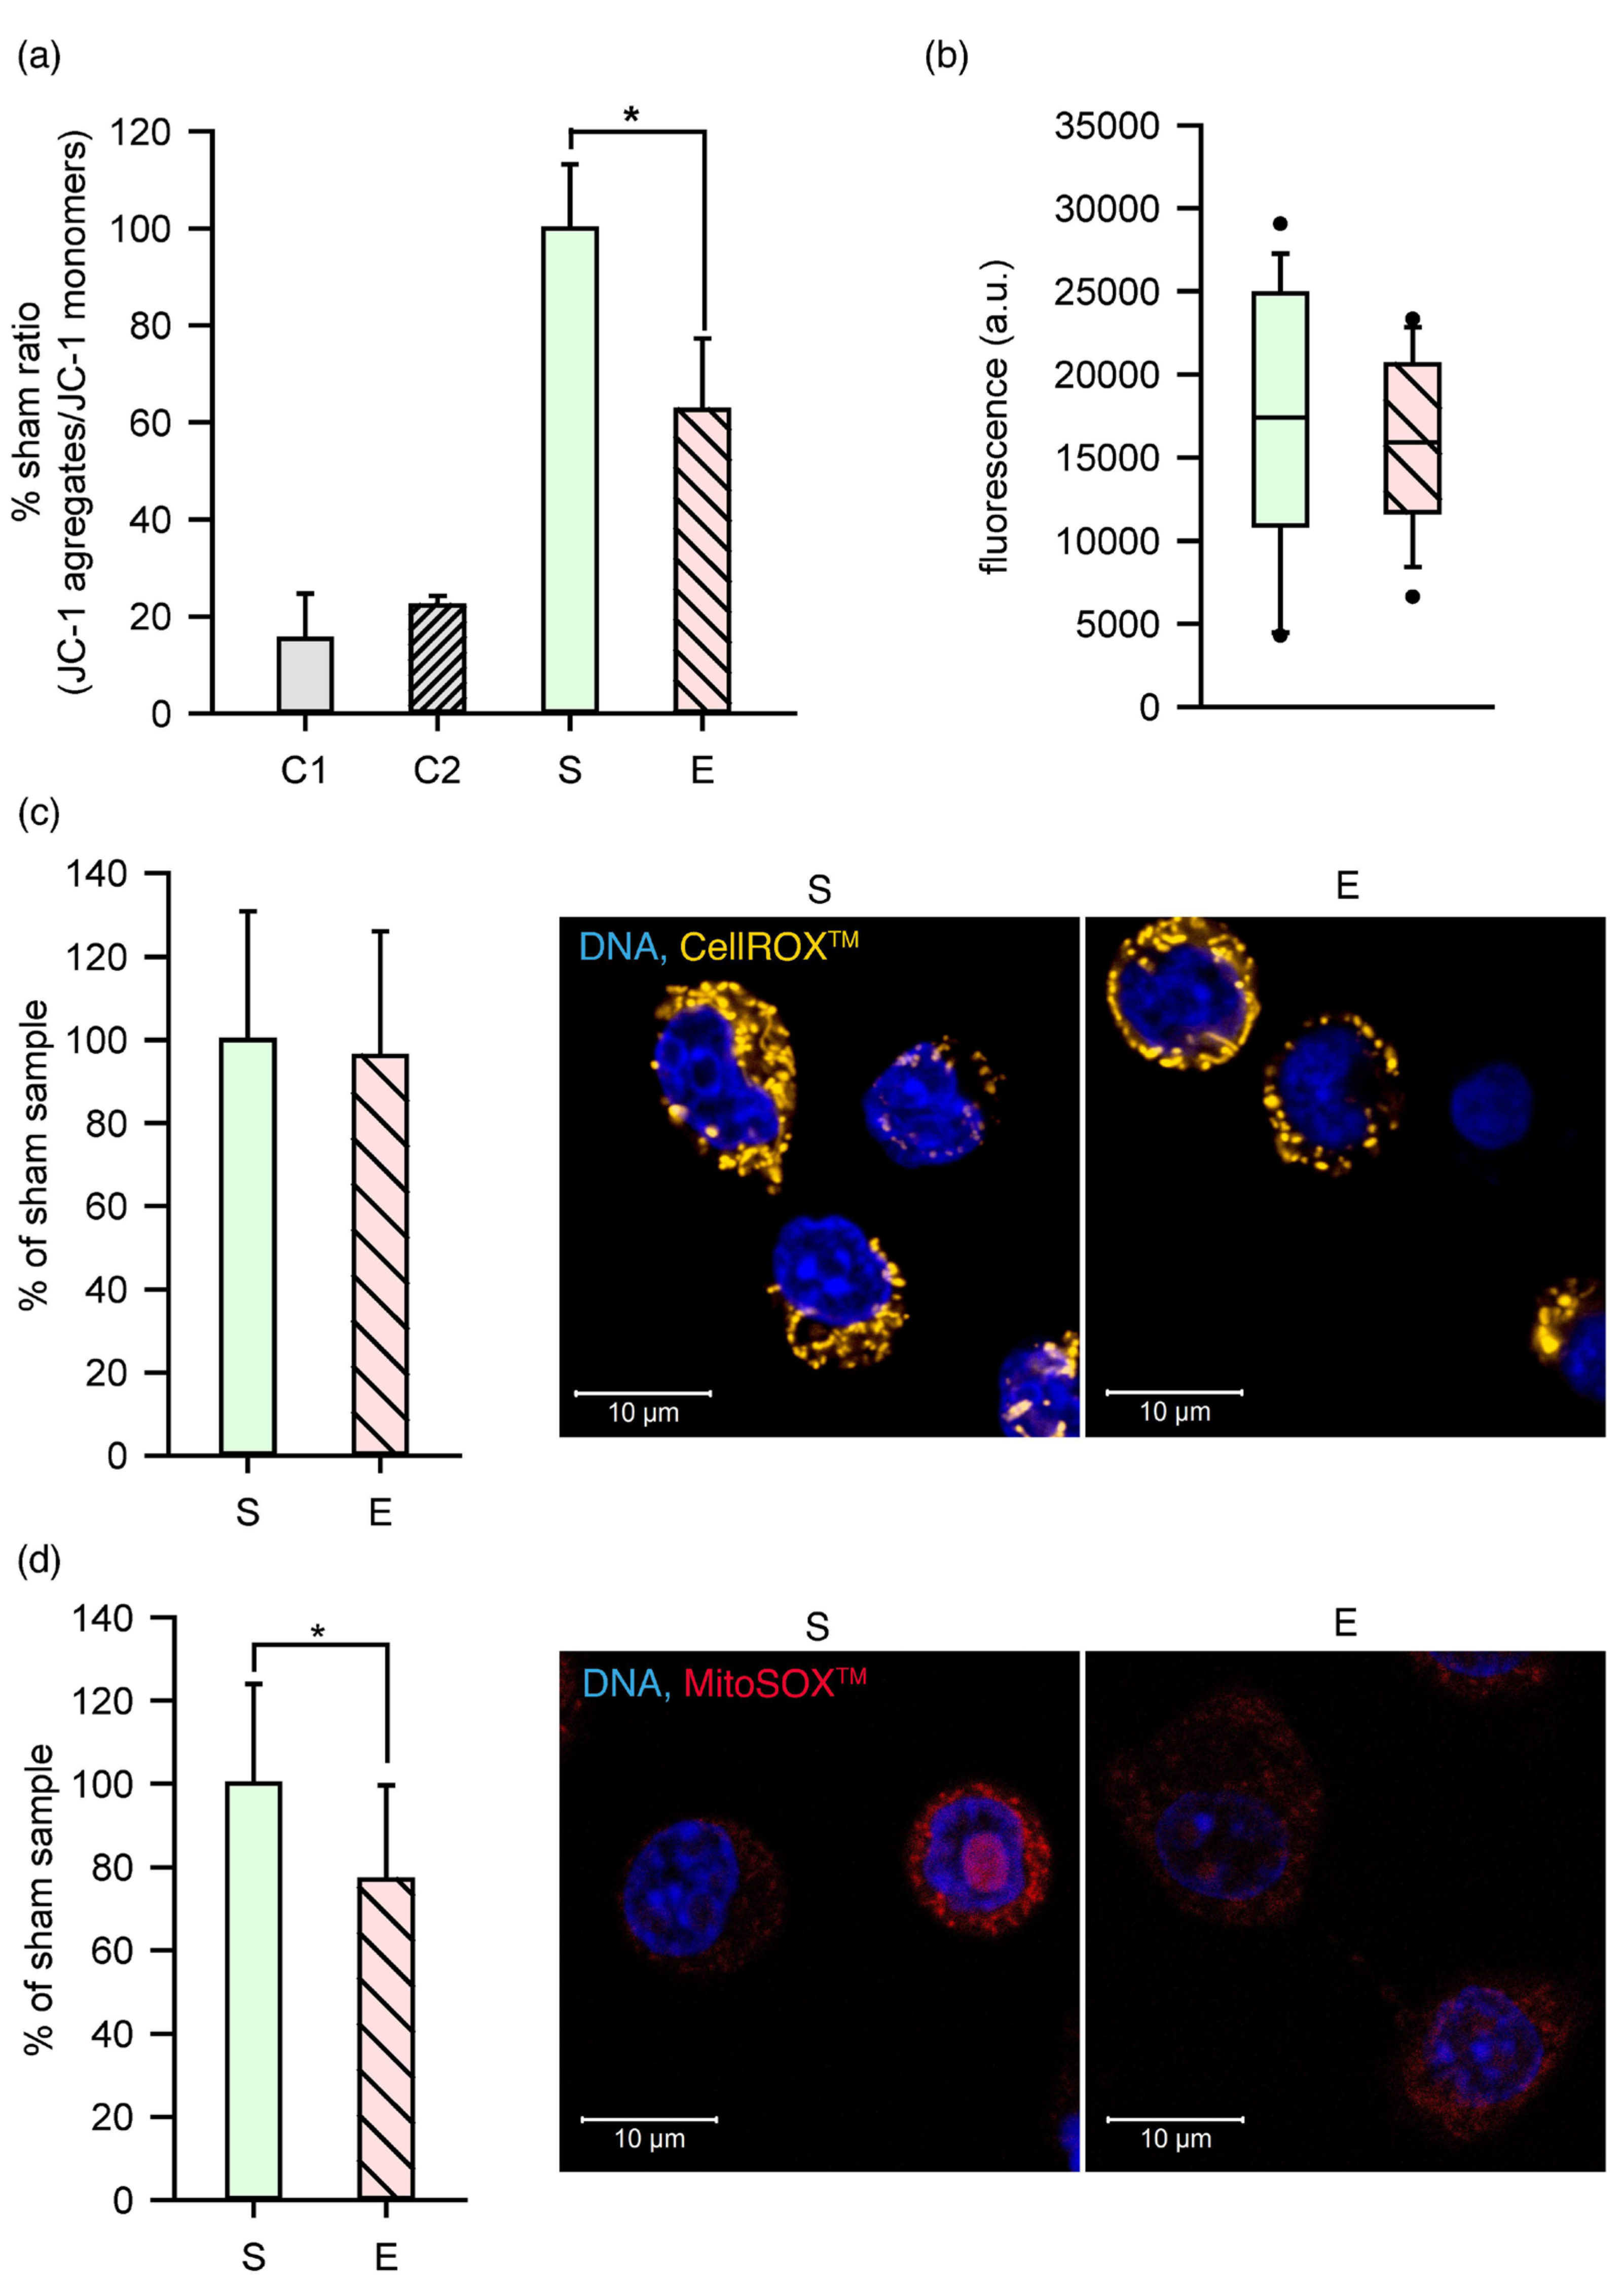
2.5. Membrane Perturbations Affected the Organelles and Metabolism
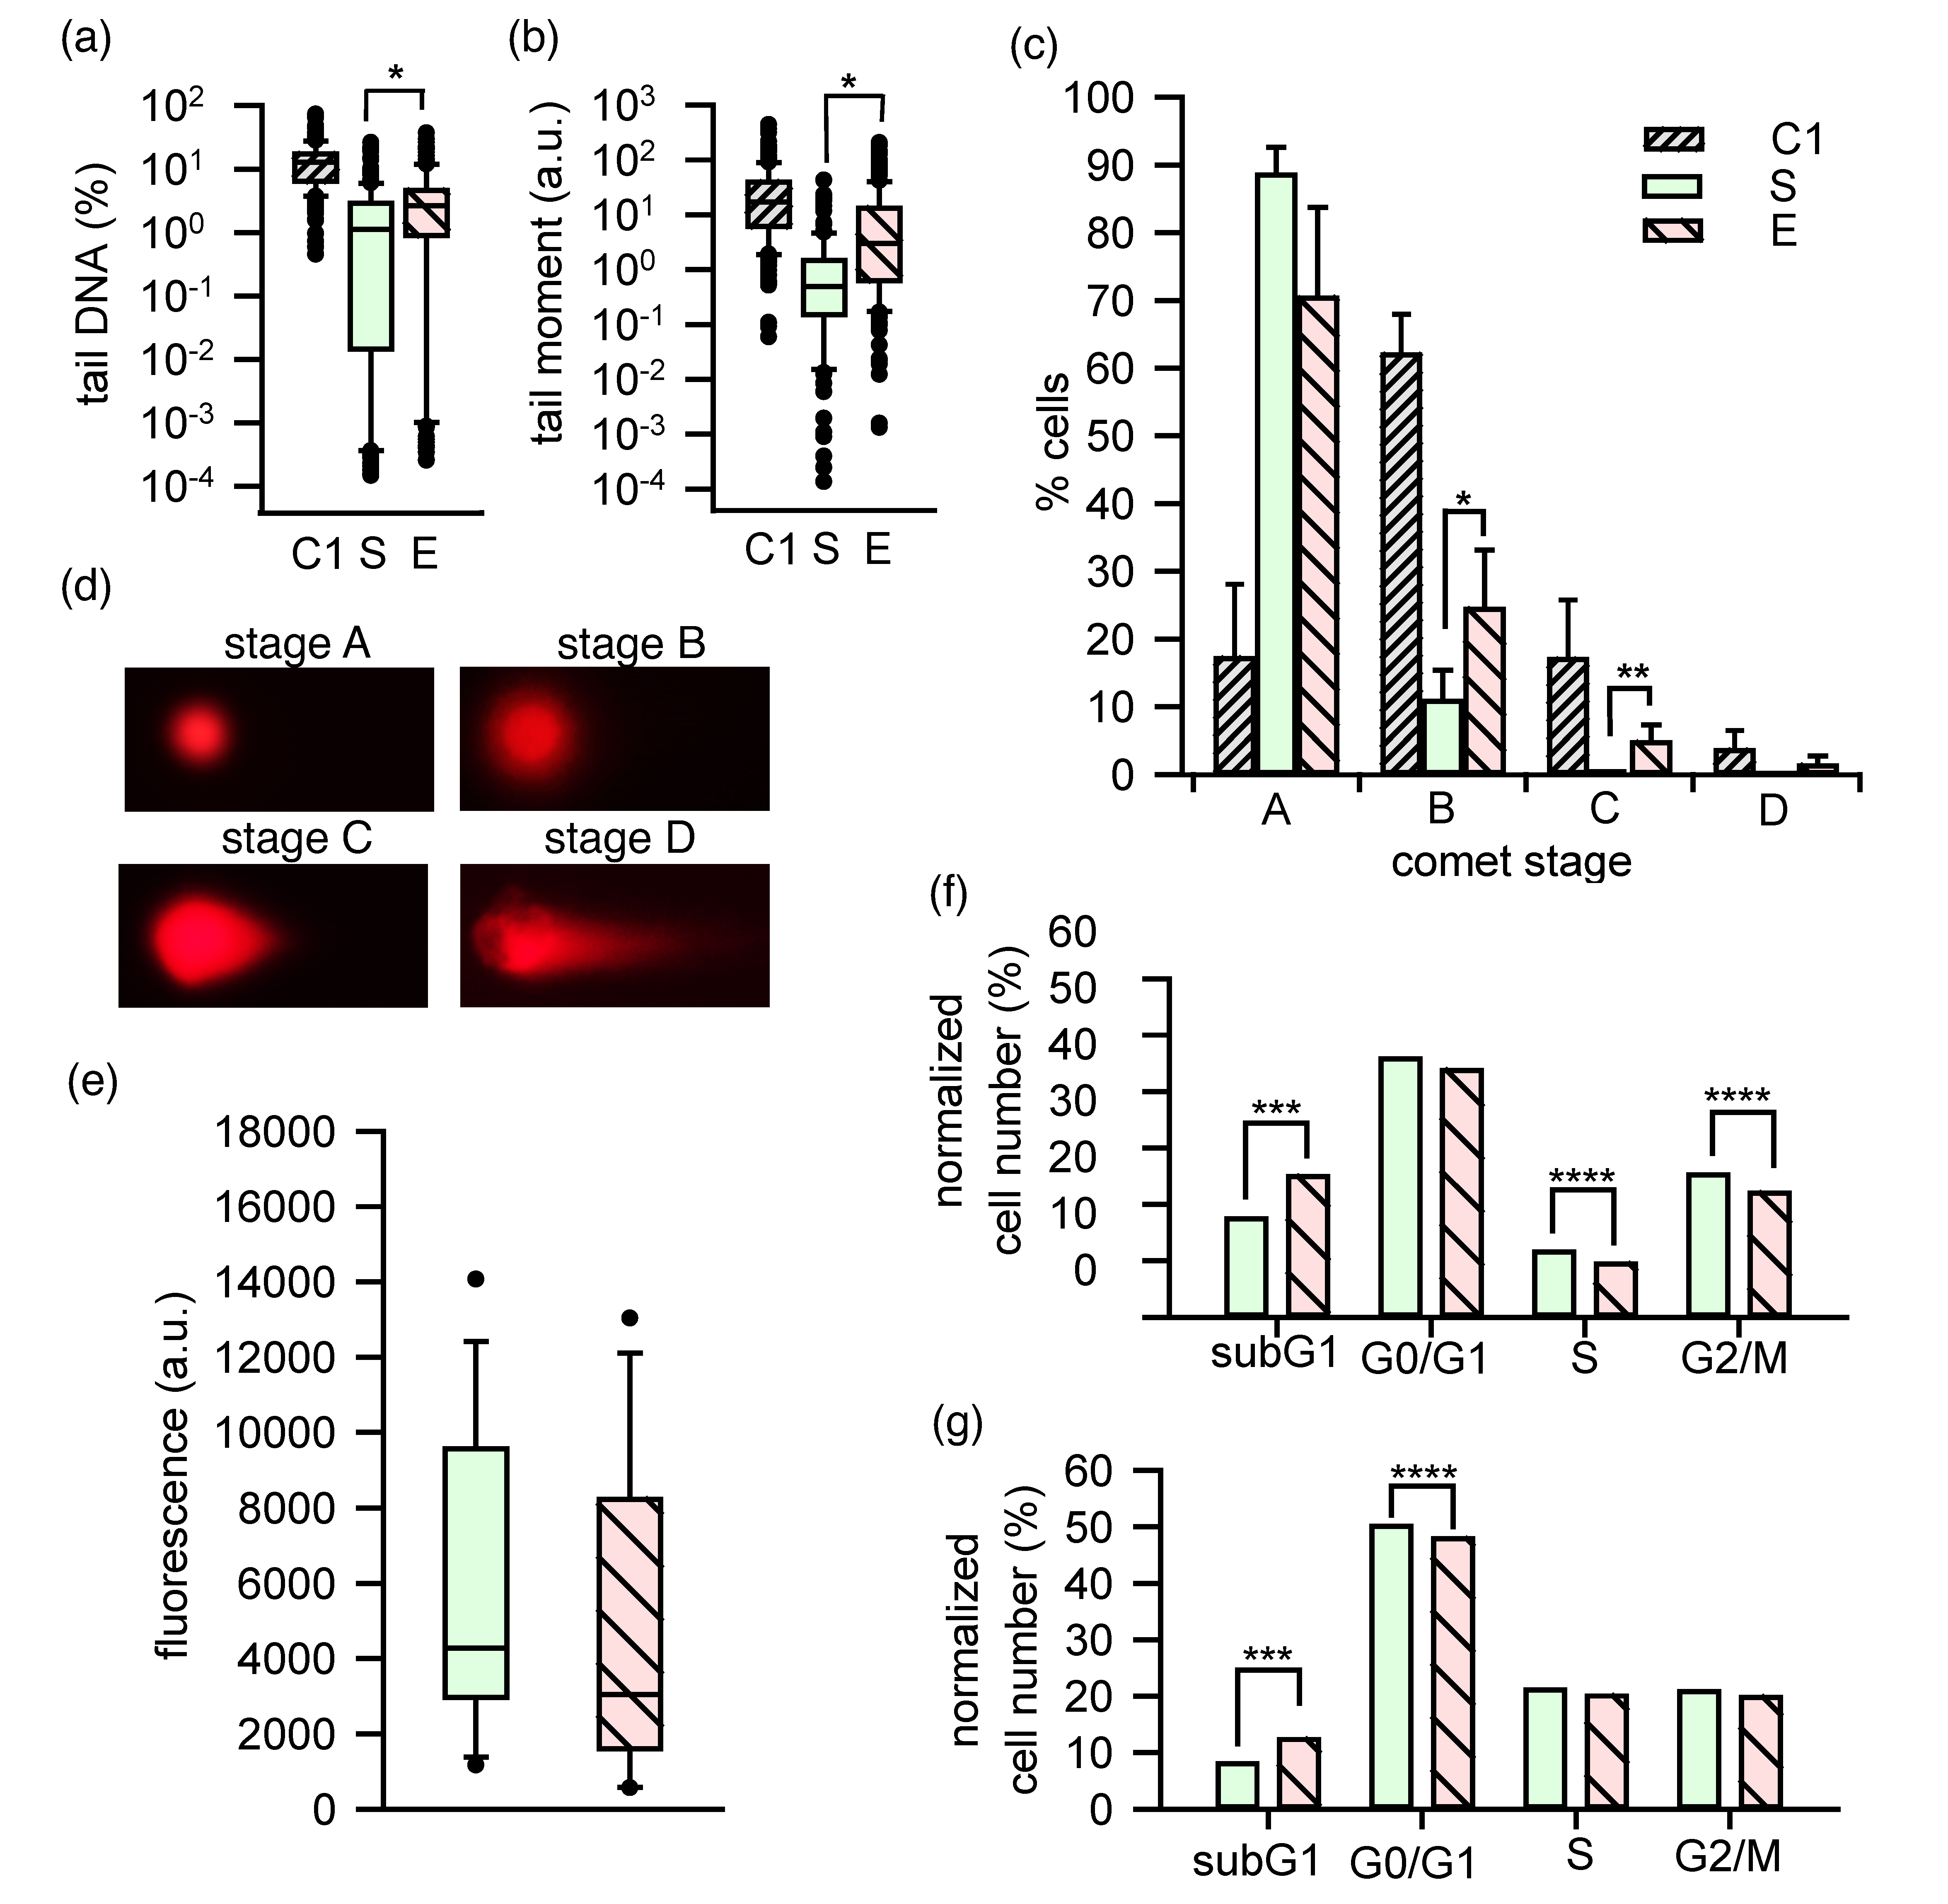
2.6. DNA and the Cell Cycle Progression Disturbed
2.7. Gene Expression Largely Unchanged
3. Discussion
4. Materials and Methods
4.1. Cell Culture
4.2. Exposure to nsPEF
4.3. Cell Diameter
4.4. Electron Microscopy
4.5. Adhesion
4.6. Filamentous Actin
4.7. Phosphatidylserine Externalization
4.8. Mitochondrial Membrane Potential
4.9. ROS Formation
4.10. Comet Assay
4.11. Cell Proliferation
4.12. Cell Cycle
4.13. Viability of Cells
4.14. RNA Isolation
4.15. Microarrays
4.16. Quantitative Reverse Transcription Polymerase Chain Reaction (QRT-PCR)
4.17. Statistical Analysis
5. Conclusions
Supplementary Materials
Author Contributions
Funding
Institutional Review Board Statement
Informed Consent Statement
Data Availability Statement
Acknowledgments
Conflicts of Interest
References
- Schoenbach, K.H. From the basic science of biological effects of ultrashort electrical pulses to medical therapies. Bioelectromagnetics 2018, 39, 257–276. [Google Scholar] [CrossRef]
- Yarmush, M.L.; Golberg, A.; Serša, G.; Kotnik, T.; Miklavčič, D. Electroporation-Based Technologies for Medicine: Principles, Applications, and Challenges. Annu. Rev. Biomed. Eng. 2014, 16, 295–320. [Google Scholar] [CrossRef] [Green Version]
- Sharifi Tabar, M.; Hesaraki, M.; Esfandiari, F.; Sahraneshin Samani, F.; Vakilian, H.; Baharvand, H. Evaluating Electroporation and Lipofectamine Approaches for Transient and Stable Transgene Expressions in Human Fibroblasts and Embryonic Stem Cells. Cell J. 2015, 17, 438–450. [Google Scholar] [PubMed]
- Casciola, M.; Tarek, M. A molecular insight into the electro-transfer of small molecules through electropores driven by electric fields. Biochim. Biophys. Acta (BBA)—Biomembr. 2016, 1858, 2278–2289. [Google Scholar] [CrossRef]
- Ruzgys, P.; Novickij, V.; Novickij, J.; Šatkauskas, S. Nanosecond range electric pulse application as a non-viral gene delivery method: Proof of concept. Sci. Rep. 2018, 8, 15502. [Google Scholar] [CrossRef]
- Breton, M.; Delemotte, L.; Silve, A.; Mir, L.M.; Tarek, M. Transport of siRNA through Lipid Membranes Driven by Nanosecond Electric Pulses: An Experimental and Computational Study. J. Am. Chem. Soc. 2012, 134, 13938–13941. [Google Scholar] [CrossRef]
- Tolstykh, G.P.; Cantu, J.C.; Tarango, M.; Ibey, B.L. Receptor- and store-operated mechanisms of calcium entry during the nanosecond electric pulse-induced cellular response. Biochim. Biophys. Acta (BBA)—Biomembr. 2019, 1861, 685–696. [Google Scholar] [CrossRef] [PubMed]
- Moen, E.K.; Ibey, B.L.; Beier, H.T.; Armani, A.M. Quantifying pulsed electric field-induced membrane nanoporation in single cells. Biochim. Biophys. Acta (BBA)—Biomembr. 2016, 1858, 2795–2803. [Google Scholar] [CrossRef]
- Hristov, K.; Mangalanathan, U.; Casciola, M.; Pakhomova, O.N.; Pakhomov, A.G. Expression of voltage-gated calcium channels augments cell susceptibility to membrane disruption by nanosecond pulsed electric field. Biochim. Biophys. Acta (BBA)—Biomembr. 2018, 1860, 2175–2183. [Google Scholar] [CrossRef]
- Beebe, S.J.; Sain, N.M.; Ren, W. Induction of Cell Death Mechanisms and Apoptosis by Nanosecond Pulsed Electric Fields (nsPEFs). Cells 2013, 2, 136–162. [Google Scholar] [CrossRef] [PubMed] [Green Version]
- Gianulis, E.C.; Labib, C.; Saulis, G.; Novickij, V.; Pakhomova, O.N.; Pakhomov, A.G. Selective susceptibility to nanosecond pulsed electric field (nsPEF) across different human cell types. Cell Mol. Life Sci. 2017, 74, 1741–1754. [Google Scholar] [CrossRef] [PubMed]
- Koga, T.; Morotomi-Yano, K.; Sakugawa, T.; Saitoh, H.; Yano, K.-I. Nanosecond pulsed electric fields induce extracellular release of chromosomal DNA and histone citrullination in neutrophil-differentiated HL-60 cells. Sci. Rep. 2019, 9, 8451. [Google Scholar] [CrossRef] [PubMed]
- Matfier, J.P. Establishment and Characterization of Two Distinct Mouse Testicular Epithelial Cell Line. Biol. Reprod. 1980, 23, 243–252. [Google Scholar] [CrossRef]
- Yazama, F.; Nishida, T.; Kurohmaru, M.; Hayashi, Y. A Scanning Electron Microscopy of the Interstitial Tissue of the Boar Testis. Exp. Anim. 1990, 39, 117–120. [Google Scholar] [CrossRef] [PubMed] [Green Version]
- Figard, L.; Sokac, A.M. A membrane reservoir at the cell surface. BioArchitecture 2014, 4, 39–46. [Google Scholar] [CrossRef] [PubMed] [Green Version]
- Goluža, T.; Boscanin, A.; Cvetko, J.; Kozina, V.; Kosović, M.; Bernat, M.M.; Kasum, M.; Kaštelan, Ž.; Ježek, D. Macrophages and Leydig Cells in Testicular Biopsies of Azoospermic Men. Biomed. Res. Int. 2014, 2014, 828697. [Google Scholar] [CrossRef] [Green Version]
- Azhar, S.; Dong, D.; Shen, W.-J.; Hu, Z.; Kraemer, F.B. The role of miRNAs in regulating adrenal and gonadal steroidogenesis. J. Mol. Endocrinol. 2020, 64, R21–R43. [Google Scholar] [CrossRef]
- Geng, X.-J.; Zhao, D.-M.; Mao, G.-H.; Tan, L. MicroRNA-150 regulates steroidogenesis of mouse testicular Leydig cells by targeting STAR. Reproduction 2017, 154, 229–236. [Google Scholar] [CrossRef]
- He, L.; Gong, H.; You, S.; Zhang, C.; Zhong, C.; Li, L. MiRNA-138-5p suppresses cigarette smoke-induced apoptosis in testicular cells by targeting Caspase-3 through the Bcl-2 signaling pathway. J. Biochem. Mol. Toxicol. 2021, 35, e22783. [Google Scholar] [CrossRef]
- Moen, E.; Roth, C.; Cerna, C.; Estalck, L.; Wilmink, G.; Ibey, B. Changes in Protein Expression of U937 and Jurkat Cells Exposed to Nanosecond Pulsed Electric Fields; SPIE BIOS: San Francisco, CA, USA, 2013; Volume 8585. [Google Scholar]
- Khetan, J.; Shahinuzzaman, M.; Barua, S.; Barua, D. Quantitative Analysis of the Correlation between Cell Size and Cellular Uptake of Particles. Biophys. J. 2019, 116, 347–359. [Google Scholar] [CrossRef] [Green Version]
- Vernier, P.T.; Ziegler, M.J.; Sun, Y.; Gundersen, M.A.; Tieleman, D.P. Nanopore-facilitated, voltage-driven phosphatidylserine translocation in lipid bilayers—In cells andin silico. Phys. Biol. 2006, 3, 233–247. [Google Scholar] [CrossRef] [PubMed]
- Thomas Vernier, P.; Sun, Y.; Marcu, L.; Craft, C.M.; Gundersen, M.A. Nanoelectropulse-Induced Phosphatidylserine Translocation. Biophys. J. 2004, 86, 4040–4048. [Google Scholar] [CrossRef] [PubMed] [Green Version]
- Tsong, T.Y. Electroporation of cell membranes. Biophys. J. 1991, 60, 297–306. [Google Scholar] [CrossRef] [Green Version]
- Bennett, W.F.D.; Tieleman, D.P. Computer simulations of lipid membrane domains. Biochim. Biophys. Acta (BBA)—Biomembr. 2013, 1828, 1765–1776. [Google Scholar] [CrossRef] [PubMed] [Green Version]
- Ibey, B.L.; Ullery, J.C.; Pakhomova, O.N.; Roth, C.C.; Semenov, I.; Beier, H.T.; Tarango, M.; Xiao, S.; Schoenbach, K.H.; Pakhomov, A.G. Bipolar nanosecond electric pulses are less efficient at electropermeabilization and killing cells than monopolar pulses. Biochem. Biophys. Res. Commun. 2014, 443, 568–573. [Google Scholar] [CrossRef] [Green Version]
- Kotnik, T.; Rems, L.; Tarek, M.; Miklavčič, D. Membrane Electroporation and Electropermeabilization: Mechanisms and Models. Annu. Rev. Biophys. 2019, 48, 63–91. [Google Scholar] [CrossRef]
- Sauvanet, C.; Wayt, J.; Pelaseyed, T.; Bretscher, A. Structure, regulation, and functional diversity of microvilli on the apical domain of epithelial cells. Annu. Rev. Cell Dev. Biol. 2015, 31, 593–621. [Google Scholar] [CrossRef]
- El-Kafoury, B.; Hamam, G.G.; Ezzat, S.F. Effect of Exposure to Different Doses of Cell Phone-Electromagnetic Waves on the Hippocampus and Testis of Adult Albino Rats: A Histological Study. Egypt. J. Histol. 2019, 42, 956–973. [Google Scholar] [CrossRef]
- Pietuch, A.; Brückner, B.R.; Janshoff, A. Membrane tension homeostasis of epithelial cells through surface area regulation in response to osmotic stress. Biochim. Biophys. Acta (BBA)—Mol. Cell Res. 2013, 1833, 712–722. [Google Scholar] [CrossRef] [Green Version]
- Yin, S.; Liu, Z.; Mashayekh, A.S.; Guo, D.; Qian, J.; Wang, Y.; Deng, G.; Zheng, C.; Ma, Z.; Zhou, L.; et al. Ultrastructural changes in hepatocellular carcinoma cells induced by exponential pulses of nanosecond duration delivered via a transmission line. Bioelectrochemistry 2020, 135, 107548. [Google Scholar] [CrossRef] [PubMed]
- Parton, R.G.; Del Pozo, M.A.; Vassilopoulos, S.; Nabi, I.R.; Le Lay, S.; Lundmark, R.; Kenworthy, A.K.; Camus, A.; Blouin, C.M.; Sessa, W.C.; et al. Caveolae: The FAQs. Traffic 2020, 21, 181–185. [Google Scholar] [CrossRef]
- Cantu, J.C.; Tolstykh, G.P.; Tarango, M.; Beier, H.T.; Ibey, B.L. Caveolin-1 is Involved in Regulating the Biological Response of Cells to Nanosecond Pulsed Electric Fields. J. Membr. Biol. 2021, 254, 141–156. [Google Scholar] [CrossRef]
- Sinha, B.; Köster, D.; Ruez, R.; Gonnord, P.; Bastiani, M.; Abankwa, D.; Stan, R.V.; Butler-Browne, G.; Vedie, B.; Johannes, L.; et al. Cells respond to mechanical stress by rapid disassembly of caveolae. Cell 2011, 144, 402–413. [Google Scholar] [CrossRef] [PubMed] [Green Version]
- Casanova, M.B.; Lustig, L.; Diaz, E.S.; Pellizzari, E.H.; Cigorraga, S.B.; Denduchis, B. Expression of caveolin-1 in rat Leydig cells. Biocell 2006, 30, 431–438. [Google Scholar] [PubMed]
- Sözer, E.B.; Wu, Y.H.; Romeo, S.; Vernier, P.T. Nanometer-Scale Permeabilization and Osmotic Swelling Induced by 5-ns Pulsed Electric Fields. J. Membr. Biol. 2017, 250, 21–30. [Google Scholar] [CrossRef] [PubMed]
- Orbach, R.; Su, X. Surfing on Membrane Waves: Microvilli, Curved Membranes, and Immune Signaling. Front Immunol. 2020, 11, 2187. [Google Scholar] [CrossRef] [PubMed]
- Rangel, L.; Bernabé-Rubio, M.; Fernández-Barrera, J.; Casares-Arias, J.; Millán, J.; Alonso, M.A.; Correas, I. Caveolin-1α regulates primary cilium length by controlling RhoA GTPase activity. Sci. Rep. 2019, 9, 1116. [Google Scholar] [CrossRef] [PubMed]
- Batista Napotnik, T.; Miklavčič, D. In vitro electroporation detection methods—An overview. Bioelectrochemistry 2018, 120, 166–182. [Google Scholar] [CrossRef]
- Rassokhin, M.A.; Pakhomov, A.G. Cellular regulation of extension and retraction of pseudopod-like blebs produced by nanosecond pulsed electric field (nsPEF). Cell Biochem. Biophys. 2014, 69, 555–566. [Google Scholar] [CrossRef] [Green Version]
- Babiychuk, E.B.; Monastyrskaya, K.; Potez, S.; Draeger, A. Blebbing confers resistance against cell lysis. Cell Death Differ. 2011, 18, 80–89. [Google Scholar] [CrossRef] [Green Version]
- Bittel, D.C.; Jaiswal, J.K. Contribution of Extracellular Vesicles in Rebuilding Injured Muscles. Front Physiol 2019, 10, 828. [Google Scholar] [CrossRef] [PubMed] [Green Version]
- Graber, Z.T.; Shi, Z.; Baumgart, T. Cations induce shape remodeling of negatively charged phospholipid membranes. Phys. Chem. Chem. Phys. 2017, 19, 15285–15295. [Google Scholar] [CrossRef] [PubMed]
- Rassokhin, M.A.; Pakhomov, A.G. Electric Field Exposure Triggers and Guides Formation of Pseudopod-Like Blebs in U937 Monocytes. J. Membr. Biol. 2012, 245, 521–529. [Google Scholar] [CrossRef] [PubMed] [Green Version]
- Kang, N.; Kim, H.; Jae, Y.; Lee, N.; Ku, C.R.; Margolis, F.; Lee, E.J.; Bahk, Y.Y.; Kim, M.-S.; Koo, J. Olfactory Marker Protein Expression Is an Indicator of Olfactory Receptor-Associated Events in Non-Olfactory Tissues. PLoS ONE 2015, 10, e0116097. [Google Scholar] [CrossRef] [PubMed] [Green Version]
- Chu, P.-J.; Robertson, H.M.; Best, P.M. Calcium channel γ subunits provide insights into the evolution of this gene family. Gene 2001, 280, 37–48. [Google Scholar] [CrossRef]
- Roohi, J.; Montagna, C.; Tegay, D.H.; Palmer, L.E.; DeVincent, C.; Pomeroy, J.C.; Christian, S.L.; Nowak, N.; Hatchwell, E. Disruption of contactin 4 in three subjects with autism spectrum disorder. J. Med. Genet. 2009, 46, 176–182. [Google Scholar] [CrossRef] [PubMed] [Green Version]
- Sugimoto, A.; Miyazaki, A.; Kawarabayashi, K.; Shono, M.; Akazawa, Y.; Hasegawa, T.; Ueda-Yamaguchi, K.; Kitamura, T.; Yoshizaki, K.; Fukumoto, S.; et al. Piezo type mechanosensitive ion channel component 1 functions as a regulator of the cell fate determination of mesenchymal stem cells. Sci. Rep. 2017, 7, 17696. [Google Scholar] [CrossRef] [PubMed] [Green Version]
- Ahmad, M.; Missler, M. Neurexins. In Encyclopedia of Neuroscience; Squire, L.R., Ed.; Academic Press: Oxford/ London, UK, 2009; pp. 261–267. [Google Scholar]
- Ono, H.; Ogasawara, O.; Okubo, K.; Bono, H. RefEx, a reference gene expression dataset as a web tool for the functional analysis of genes. Sci. Data 2017, 4, 170105. [Google Scholar] [CrossRef] [PubMed] [Green Version]
- Friederich, E.; Louvard, D. Microvilli. In Encyclopedic Reference of Genomics and Proteomics in Molecular Medicine; Springer: Heidelberg/ Berlin, Germany, 2006; pp. 1116–1121. [Google Scholar]
- Khalili, A.A.; Ahmad, M.R. A Review of Cell Adhesion Studies for Biomedical and Biological Applications. Int. J. Mol. Sci. 2015, 16, 18149–18184. [Google Scholar] [CrossRef] [Green Version]
- Parhi, P.; Golas, A.; Vogler, E.A. Role of Proteins and Water in the Initial Attachment of Mammalian Cells to Biomedical Surfaces: A Review. J. Adhes. Sci. Technol. 2010, 24, 853–888. [Google Scholar] [CrossRef]
- Bennett, K.M.; Walker, S.L.; Lo, D.D. Epithelial Microvilli Establish an Electrostatic Barrier to Microbial Adhesion. Infect. Immun. 2014, 82, 2860–2871. [Google Scholar] [CrossRef] [PubMed] [Green Version]
- Sözer, E.B.; Pocetti, C.F.; Vernier, P.T. Transport of charged small molecules after electropermeabilization—Drift and diffusion. BMC Biophys. 2018, 11, 4. [Google Scholar] [CrossRef] [PubMed]
- Graybill, P.M.; Davalos, R.V. Cytoskeletal Disruption after Electroporation and Its Significance to Pulsed Electric Field Therapies. Cancers 2020, 12, 1132. [Google Scholar] [CrossRef] [PubMed]
- Pakhomov, A.G.; Xiao, S.; Pakhomova, O.N.; Semenov, I.; Kuipers, M.A.; Ibey, B.L. Disassembly of actin structures by nanosecond pulsed electric field is a downstream effect of cell swelling. Bioelectrochemistry 2014, 100, 88–95. [Google Scholar] [CrossRef] [Green Version]
- Thompson, G.L.; Roth, C.; Tolstykh, G.; Kuipers, M.; Ibey, B.L. Disruption of the actin cortex contributes to susceptibility of mammalian cells to nanosecond pulsed electric fields. Bioelectromagnetics 2014, 35, 262–272. [Google Scholar] [CrossRef] [PubMed]
- Ibey, B.; Roth, C.; Bernhard, J.; Pakhomov, A.; Wilmink, G.; Pakhomova, O. Determination of Cellular Injury and Death Thresholds Following Exposure to High Voltage 10ns Electrical Pulses; SPIE BIOS: San Francisco, CA, USA, 2011; Volume 7901. [Google Scholar]
- Pakhomov, A.G.; Grigoryev, S.; Semenov, I.; Casciola, M.; Jiang, C.; Xiao, S. The second phase of bipolar, nanosecond-range electric pulses determines the electroporation efficiency. Bioelectrochemistry 2018, 122, 123–133. [Google Scholar] [CrossRef] [PubMed]
- Lin, Y.-C.; Chipot, C.; Scheuring, S. Annexin-V stabilizes membrane defects by inducing lipid phase transition. Nat. Commun. 2020, 11, 230. [Google Scholar] [CrossRef] [PubMed]
- Pakhomova, O.N.; Gregory, B.W.; Semenov, I.; Pakhomov, A.G. Two Modes of Cell Death Caused by Exposure to Nanosecond Pulsed Electric Field. PLoS ONE 2013, 8, e70278. [Google Scholar] [CrossRef] [PubMed] [Green Version]
- Xiao, D.; Tang, L.; Zeng, C.; Wang, J.; Luo, X.; Yao, C.; Sun, C. Effect of actin cytoskeleton disruption on electric pulse-induced apoptosis and electroporation in tumour cells. Cell Biol. Int. 2011, 35, 99–104. [Google Scholar] [CrossRef]
- Wang, Y.; Yin, S.; Zhou, Y.; Zhou, W.; Chen, T.; Wu, Q.; Zhou, L.; Zheng, S. Dual-function of Baicalin in nsPEFs-treated Hepatocytes and Hepatocellular Carcinoma cells for Different Death Pathway and Mitochondrial Response. Int. J. Med. Sci. 2019, 16, 1271–1282. [Google Scholar] [CrossRef] [Green Version]
- Estlack, L.; Roth, C.; Cerna, C.; Wilmink, G.; Ibey, B. Investigation of a Direct Effect of Nanosecond Pulse Electric Fields on Mitochondria; SPIE BIOS: San Francisco, CA, USA, 2014; Volume 8941. [Google Scholar]
- Aryaman, J.; Johnston, I.G.; Jones, N.S. Mitochondrial Heterogeneity. Front. Genet. 2019, 9, 718. [Google Scholar] [CrossRef] [Green Version]
- Zorova, L.D.; Popkov, V.A.; Plotnikov, E.Y.; Silachev, D.N.; Pevzner, I.B.; Jankauskas, S.S.; Babenko, V.A.; Zorov, S.D.; Balakireva, A.V.; Juhaszova, M.; et al. Mitochondrial membrane potential. Anal. Biochem. 2018, 552, 50–59. [Google Scholar] [CrossRef] [PubMed]
- Li, K.; Ning, T.; Wang, H.; Jiang, Y.; Zhang, J.; Ge, Z. Nanosecond pulsed electric fields enhance mesenchymal stem cells differentiation via DNMT1-regulated OCT4/NANOG gene expression. Stem Cell Res. Ther. 2020, 11, 308. [Google Scholar] [CrossRef]
- Wei, F.; Hao, P.; Zhang, X.; Hu, H.; Jiang, D.; Yin, A.; Wen, L.; Zheng, L.; He, J.Z.; Mei, W.; et al. Etoposide-induced DNA damage affects multiple cellular pathways in addition to DNA damage response. Oncotarget 2018, 9, 24122. [Google Scholar] [CrossRef] [PubMed] [Green Version]
- Qian, G.; Yu, T. Nanosecond Electric Pulses Induce Early and Late Phases of DNA Damage and Cell Death in Cisplatin-Resistant Human Ovarian Cancer Cells. Biomed Res. Int. 2018, 2018, 4504895. [Google Scholar] [CrossRef]
- Nuccitelli, R.; Chen, X.; Pakhomov, A.G.; Baldwin, W.H.; Sheikh, S.; Pomicter, J.L.; Ren, W.; Osgood, C.; Swanson, R.J.; Kolb, J.F.; et al. A new pulsed electric field therapy for melanoma disrupts the tumor’s blood supply and causes complete remission without recurrence. Int. J. Cancer 2009, 125, 438–445. [Google Scholar] [CrossRef] [Green Version]
- Romeo, S.; Zeni, L.; Sarti, M.; Sannino, A.; Scarfì, M.R.; Vernier, P.T.; Zeni, O. DNA electrophoretic migration patterns change after exposure of Jurkat cells to a single intense nanosecond electric pulse. PLoS ONE 2011, 6, e28419. [Google Scholar] [CrossRef] [PubMed] [Green Version]
- Mahlke, M.; Thompson, G.; Estlack, L.; Navara, C.; Ibey, B. Effects of Nano-Second Electrical Pulses (Nspefs) On Cell Cycle Progression and Susceptibility at Various Phases; SPIE BIOS: San Francisco, CA, USA, 2013; Volume 8585. [Google Scholar]
- Mahlke, M.; Navara, C.; Ibey, B. Effects of Nanosecond Pulsed Electrical Fields (Nspefs) on the Cell Cycle of CHO and Jurkat Cells; SPIE BIOS: San Francisco, CA, USA, 2014; Volume 8941. [Google Scholar]
- Jackowski, S. Cell Cycle Regulation of Membrane Phospholipid Metabolism. J. Biol. Chem. 1996, 271, 20219–20222. [Google Scholar] [CrossRef] [PubMed] [Green Version]
- Ren, B.; Cam, H.; Takahashi, Y.; Volkert, T.; Terragni, J.; Young, R.A.; Dynlacht, B.D. E2F integrates cell cycle progression with DNA repair, replication, and G2/M checkpoints. Genes Dev. 2002, 16, 245–256. [Google Scholar] [CrossRef] [PubMed] [Green Version]
- Li, H.; Liu, S.; Yang, X.; Du, Y.; Luo, J.; Tan, J.; Sun, Y. Cellular Processes Involved in Jurkat Cells Exposed to Nanosecond Pulsed Electric Field. Int. J. Mol. Sci. 2019, 20, 5847. [Google Scholar] [CrossRef] [PubMed] [Green Version]
- Roth, C.C.; Glickman, R.D.; Martens, S.L.; Echchgadda, I.; Beier, H.T.; Barnes, R.A., Jr.; Ibey, B.L. Adult human dermal fibroblasts exposed to nanosecond electrical pulses exhibit genetic biomarkers of mechanical stress. Biochem. Biophys. Rep. 2017, 9, 302–309. [Google Scholar] [CrossRef] [PubMed]
- Roth, C.C.; Glickman, R.D.; Tolstykh, G.P.; Estlack, L.E.; Moen, E.K.; Echchgadda, I.; Beier, H.T.; Barnes, R.A., Jr.; Ibey, B.L. Evaluation of the Genetic Response of U937 and Jurkat Cells to 10-Nanosecond Electrical Pulses (nsEP). PLoS ONE 2016, 11, e0154555. [Google Scholar] [CrossRef] [PubMed]
- Donati, G.; Montanaro, L.; Derenzini, M. Ribosome biogenesis and control of cell proliferation: p53 is not alone. Cancer Res. 2012, 72, 1602–1607. [Google Scholar] [CrossRef] [PubMed] [Green Version]
- Martens, S.L.; Roth, C.C.; Ibey, B.L. Nanosecond pulsed electric field exposure does not induce the unfolded protein response in adult human dermal fibroblasts. Bioelectromagnetics 2018, 39, 491–499. [Google Scholar] [CrossRef] [PubMed]
- Bahrami, S.; Drabløs, F. Gene regulation in the immediate-early response process. Adv. Biol. Regul. 2016, 62, 37–49. [Google Scholar] [CrossRef] [PubMed] [Green Version]
- Nishii, K.; Brodin, E.; Renshaw, T.; Weesner, R.; Moran, E.; Soker, S.; Sparks, J.L. Shear stress upregulates regeneration-related immediate early genes in liver progenitors in 3D ECM-like microenvironments. J. Cell. Physiol. 2018, 233, 4272–4281. [Google Scholar] [CrossRef]
- Stula, M.; Orzechowski, H.-D.; Gschwend, S.; Vetter, R.; von Harsdorf, R.; Dietz, R.; Paul, M. Influence of sustained mechanical stress on Egr-1 mRNA expression in cultured human endothelial cells. Mol. Cell. Biochem. 2000, 210, 101–108. [Google Scholar] [CrossRef]
- Achour, Y.; Starzyński, J.; Kasprzycka, W.; Trafny, E.A. Compact low-cost high-voltage pulse generator for biological applications. Int. J. Circuit Theory Appl. 2019, 47, 1948–1962. [Google Scholar] [CrossRef]
- Focke, F.; Schuermann, D.; Kuster, N.; Schär, P. DNA fragmentation in human fibroblasts under extremely low frequency electromagnetic field exposure. Mutat. Res. Fundam. Mol. Mech. Mutagenesis 2010, 683, 74–83. [Google Scholar] [CrossRef]
- Edgar, R.; Domrachev, M.; Lash, A.E. Gene Expression Omnibus: NCBI gene expression and hybridization array data repository. Nucleic Acids Res. 2002, 30, 207–210. [Google Scholar] [CrossRef] [PubMed] [Green Version]
- Mi, H.; Ebert, D.; Muruganujan, A.; Mills, C.; Albou, L.-P.; Mushayamaha, T.; Thomas, P.D. PANTHER version 16: A revised family classification, tree-based classification tool, enhancer regions and extensive API. Nucleic Acids Res. 2020, 49, D394–D403. [Google Scholar] [CrossRef] [PubMed]
- Subramanian, A.; Tamayo, P.; Mootha, V.K.; Mukherjee, S.; Ebert, B.L.; Gillette, M.A.; Paulovich, A.; Pomeroy, S.L.; Golub, T.R.; Lander, E.S.; et al. Gene set enrichment analysis: A knowledge-based approach for interpreting genome-wide expression profiles. Proc. Natl. Acad. Sci. USA 2005, 102, 15545–15550. [Google Scholar] [CrossRef] [Green Version]
- Mootha, V.K.; Lindgren, C.M.; Eriksson, K.-F.; Subramanian, A.; Sihag, S.; Lehar, J.; Puigserver, P.; Carlsson, E.; Ridderstråle, M.; Laurila, E.; et al. PGC-1α-responsive genes involved in oxidative phosphorylation are coordinately downregulated in human diabetes. Nat. Genet. 2003, 34, 267–273. [Google Scholar] [CrossRef] [PubMed]
- Liberzon, A.; Subramanian, A.; Pinchback, R.; Thorvaldsdóttir, H.; Tamayo, P.; Mesirov, J.P. Molecular signatures database (MSigDB) 3.0. Bioinformatics 2011, 27, 1739–1740. [Google Scholar] [CrossRef]
- Liberzon, A.; Birger, C.; Thorvaldsdóttir, H.; Ghandi, M.; Mesirov, J.P.; Tamayo, P. The Molecular Signatures Database Hallmark Gene Set Collection. Cell Syst. 2015, 1, 417–425. [Google Scholar] [CrossRef] [Green Version]
- Wang, X.; Seed, B. A PCR primer bank for quantitative gene expression analysis. Nucleic Acids Res. 2003, 31, e154. [Google Scholar] [CrossRef] [PubMed] [Green Version]
- Spandidos, A.; Wang, X.; Wang, H.; Dragnev, S.; Thurber, T.; Seed, B. A comprehensive collection of experimentally validated primers for Polymerase Chain Reaction quantitation of murine transcript abundance. BMC Genom. 2008, 9, 633. [Google Scholar] [CrossRef] [Green Version]
- Livak, K.J.; Schmittgen, T.D. Analysis of relative gene expression data using real-time quantitative PCR and the 2(-Delta Delta C(T)) Method. Methods 2001, 25, 402–408. [Google Scholar] [CrossRef] [PubMed]
- Vandesompele, J.; De Preter, K.; Pattyn, F.; Poppe, B.; Van Roy, N.; De Paepe, A.; Speleman, F. Accurate normalization of real-time quantitative RT-PCR data by geometric averaging of multiple internal control genes. Genome Biol. 2002, 3, research0034.1. [Google Scholar] [CrossRef] [Green Version]


Publisher’s Note: MDPI stays neutral with regard to jurisdictional claims in published maps and institutional affiliations. |
© 2021 by the authors. Licensee MDPI, Basel, Switzerland. This article is an open access article distributed under the terms and conditions of the Creative Commons Attribution (CC BY) license (https://creativecommons.org/licenses/by/4.0/).
Share and Cite
Kasprzycka, W.; Trębińska-Stryjewska, A.; Lewandowski, R.B.; Stępińska, M.; Osuchowska, P.N.; Dobrzyńska, M.; Achour, Y.; Osuchowski, Ł.P.; Starzyński, J.; Mierczyk, Z.; et al. Nanosecond Pulsed Electric Field Only Transiently Affects the Cellular and Molecular Processes of Leydig Cells. Int. J. Mol. Sci. 2021, 22, 11236. https://0-doi-org.brum.beds.ac.uk/10.3390/ijms222011236
Kasprzycka W, Trębińska-Stryjewska A, Lewandowski RB, Stępińska M, Osuchowska PN, Dobrzyńska M, Achour Y, Osuchowski ŁP, Starzyński J, Mierczyk Z, et al. Nanosecond Pulsed Electric Field Only Transiently Affects the Cellular and Molecular Processes of Leydig Cells. International Journal of Molecular Sciences. 2021; 22(20):11236. https://0-doi-org.brum.beds.ac.uk/10.3390/ijms222011236
Chicago/Turabian StyleKasprzycka, Wiktoria, Alicja Trębińska-Stryjewska, Rafał Bogdan Lewandowski, Małgorzata Stępińska, Paulina Natalia Osuchowska, Monika Dobrzyńska, Yahia Achour, Łukasz Paweł Osuchowski, Jacek Starzyński, Zygmunt Mierczyk, and et al. 2021. "Nanosecond Pulsed Electric Field Only Transiently Affects the Cellular and Molecular Processes of Leydig Cells" International Journal of Molecular Sciences 22, no. 20: 11236. https://0-doi-org.brum.beds.ac.uk/10.3390/ijms222011236