
Constitutive Oxidative Stress by SEPHS1 Deficiency Induces Endothelial Cell Dysfunction

 , , and
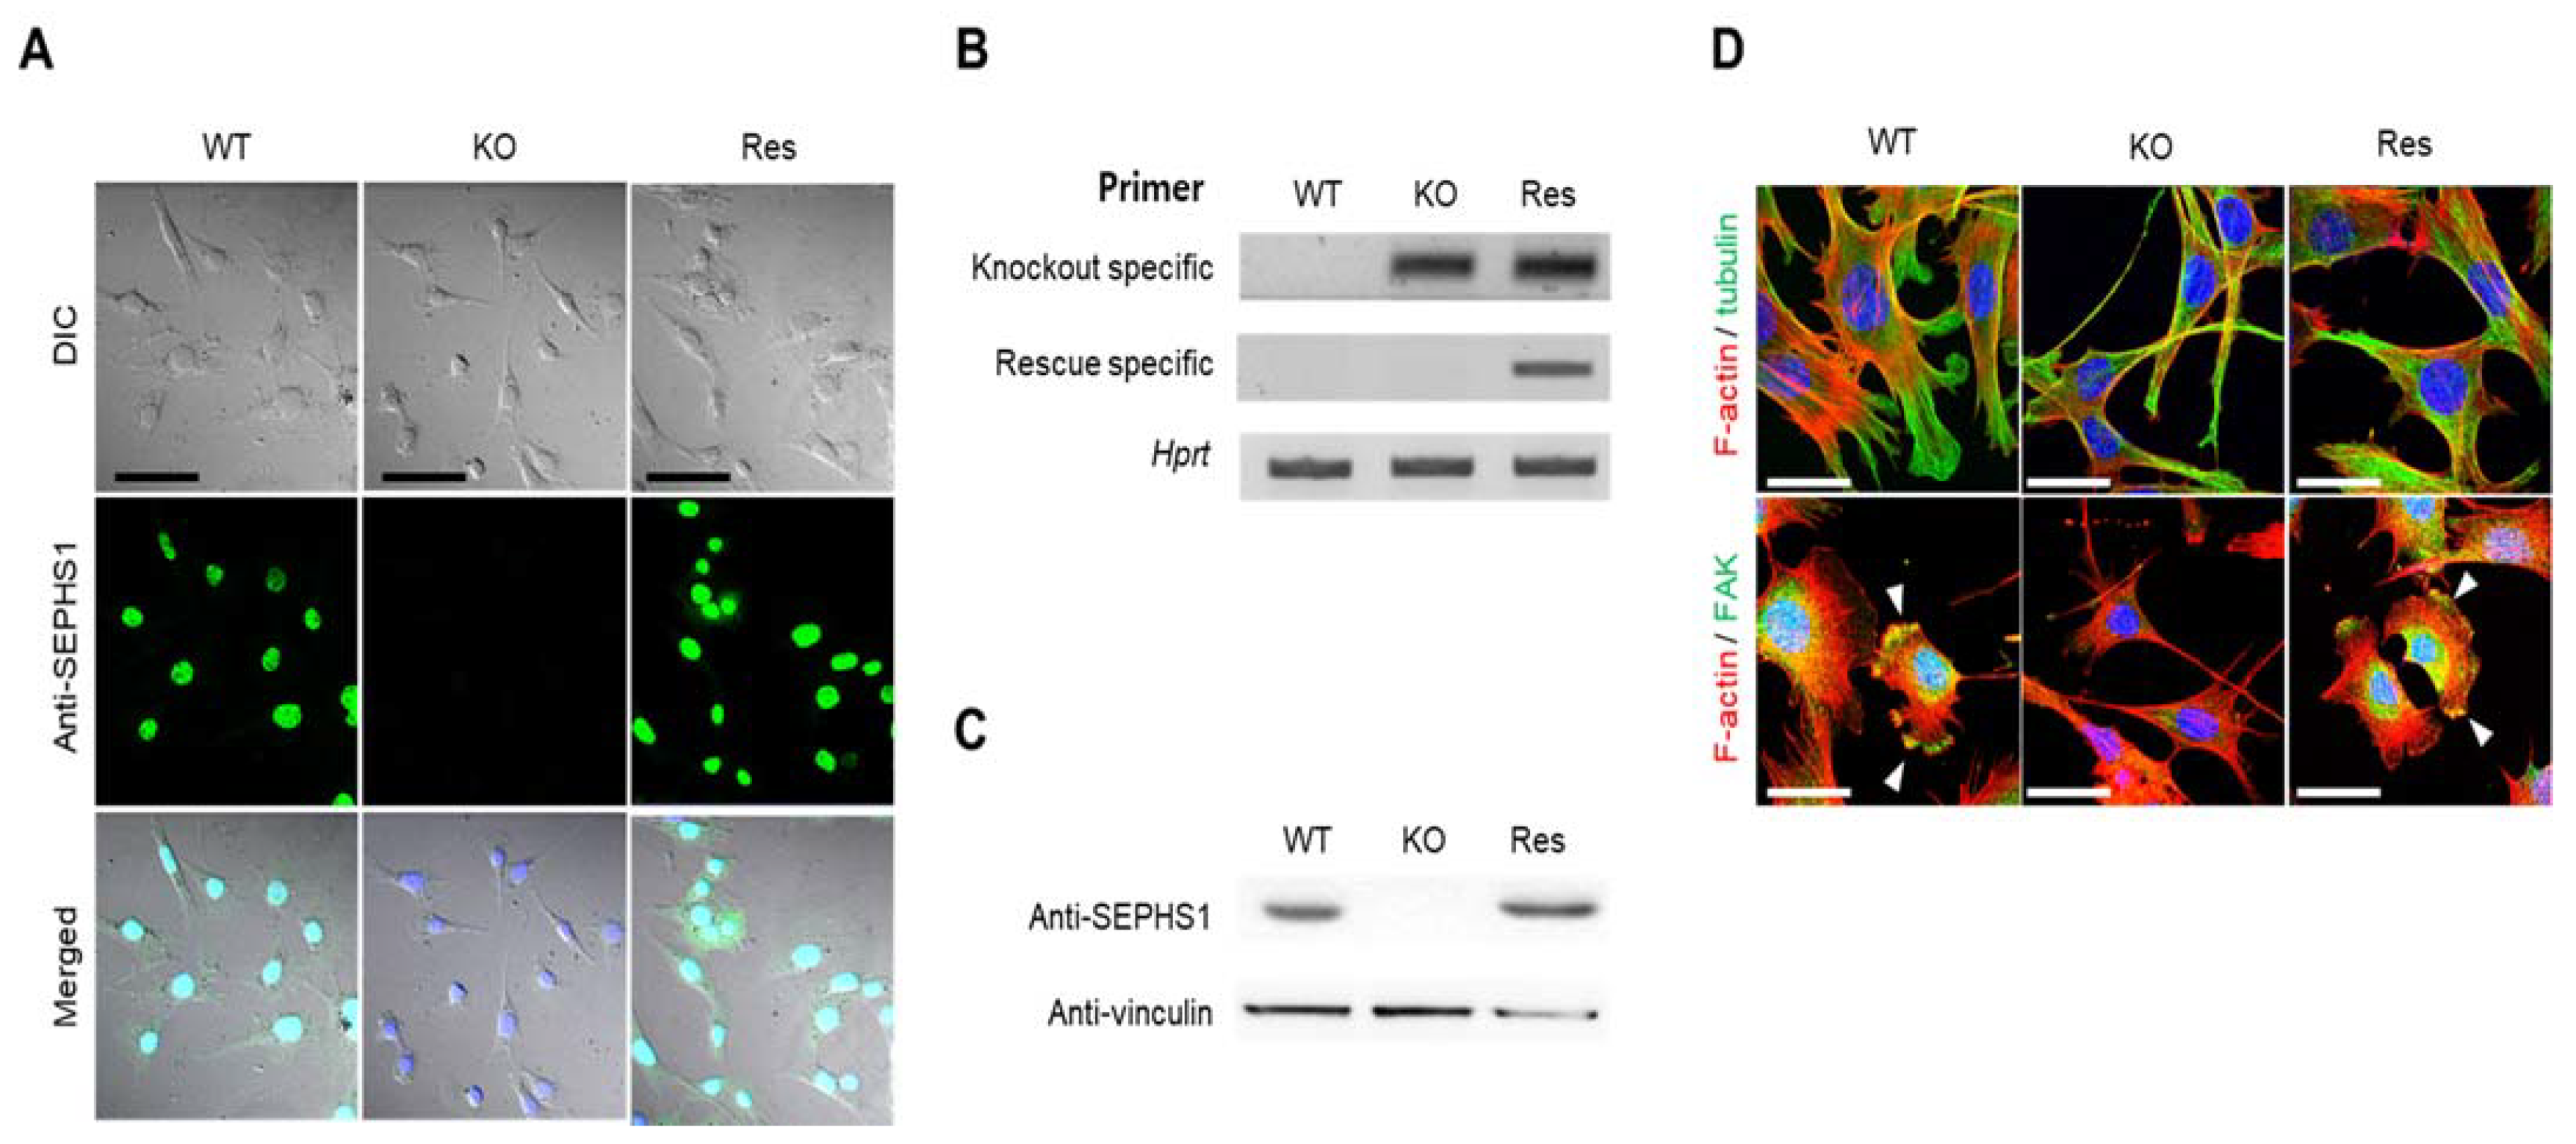
Abstract
:1. Introduction
2. Results
2.1. Sephs1 Knockout Leads to Morphological Changes
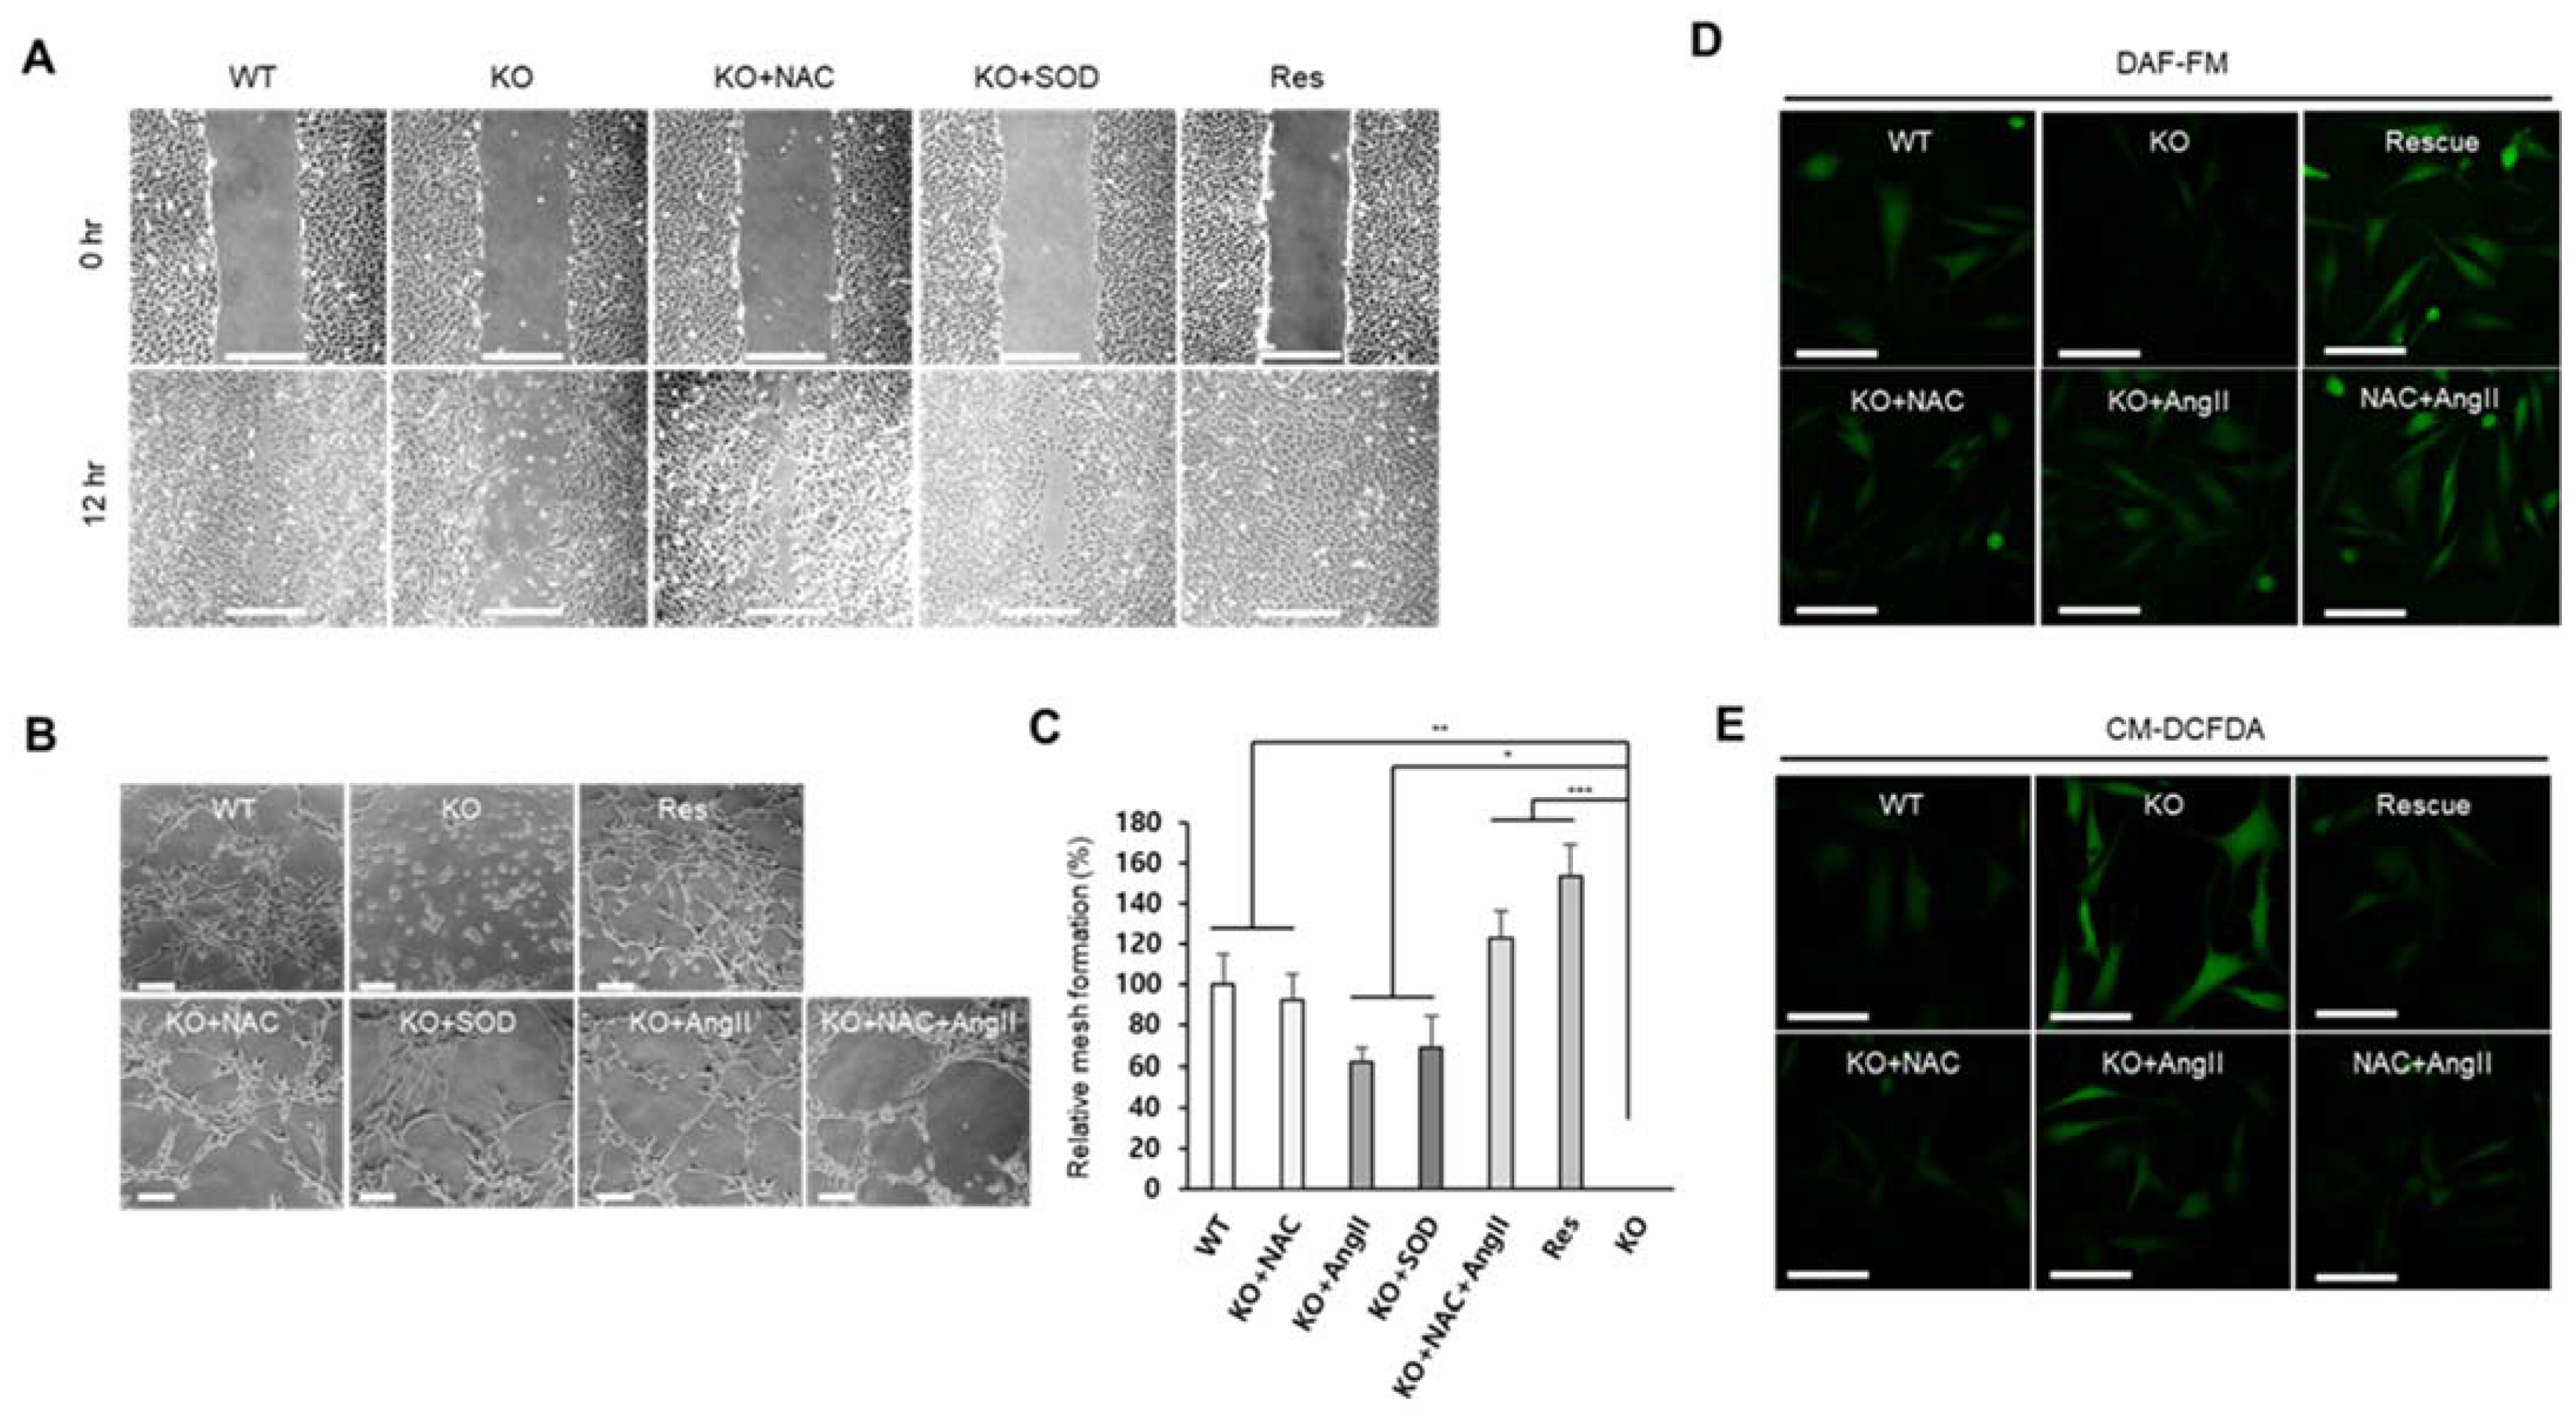
2.2. Superoxide Is Accumulated by SEPHS1 Deficiency in Endothelial Cells
2.3. SEPHS1 Regulates the Levels of Reactive Nitrogen Species and Lipid Peroxidation
2.4. Superoxide Inhibits Cell Proliferation at G2/M Phase
2.5. SEPHS1 Deficiency Inhibits Angiogenic Activity of Endothelial Cells
3. Discussion
4. Materials and Methods
4.1. Materials
4.2. Cell Culture
4.3. CRISPR-Based Knockout Cell Line Construction
4.4. CRISPR-Based Rescue Cell Line Construction
4.5. Real-Time PCR
4.6. Western Blot Analysis
4.7. Immunocytochemistry
4.8. Determining ROS Types
4.9. Measurement of ROS Levels with Fluorescence Activated Cell Sorting
4.10. Scratch-Wound Assay
4.11. Tube Formation Assay
4.12. Administration of ROS Scavengers and Inhibitor Treatments
4.13. Detection of Reactive Nitrogen Species
4.14. Cell Cycle Analysis
4.15. BrdU Incorporation Assay
4.16. Statistics
Supplementary Materials
Author Contributions
Funding
Data Availability Statement
Acknowledgments
Conflicts of Interest
References
- Na, J.; Jung, J.; Bang, J.; Qiao, L.; Carlson, B.A.; Xiong, G.; Gladyshev, V.N.; Kim, J.; Hatfield, D.L.; Lee, B.J. Selenophosphate synthetase 1 and its role in redox homeostasis, defense and proliferation. Free Radic. Biol. Med. 2018, 127, 190–197. [Google Scholar] [CrossRef] [PubMed]
- Hatfield, D.L.; Gladyshev, V.N. How selenium has altered our understanding of the genetic code. Mol. Cell. Biol. 2002, 22, 3565–3576. [Google Scholar] [CrossRef] [PubMed] [Green Version]
- Lee, B.J.; Worland, P.J.; Davis, J.N.; Stadtman, T.C.; Hatfield, D.L. Identification of a selenocysteyl-tRNA (Ser) in mammalian cells that recognizes the nonsense codon, UGA. J. Biol. Chem. 1989, 264, 9724–9727. [Google Scholar] [CrossRef]
- Longtin, R. A forgotten debate: Is selenocysteine the 21st amino acid? J. Natl. Cancer Inst. 2004, 96, 504–505. [Google Scholar] [CrossRef] [PubMed] [Green Version]
- Glass, R.S.; Singh, W.P.; Jung, W.; Veres, Z.; Scholz, T.D.; Stadtman, T.C. Monoselenophosphate: Synthesis, Characterization, and Identity with the Prokaryotic Biological Selenium Donor, Compound SePX. Biochemistry 1993, 32, 12555–12559. [Google Scholar] [CrossRef]
- Veres, Z.; Kim, I.Y.; Scholz, T.D.; Stadtman, T.C. Selenophosphate synthetase. Enzyme properties and catalytic reaction. J. Biol. Chem. 1994, 269, 10597–10603. [Google Scholar] [CrossRef]
- Xu, X.-M.; Carlson, B.A.; Irons, R.; Mix, H.; Zhong, N.; Gladyshev, V.N.; Hatfield, D.L. Selenophosphate synthetase 2 is essential for selenoprotein biosynthesis. Biochem. J. 2007, 404, 115–120. [Google Scholar] [CrossRef] [PubMed] [Green Version]
- Alsina, B.; Serras, F.; Baguñà, J.; Corominas, M. patufet, the gene encoding the Drosophila melanogaster homologue of selenophosphate synthetase, is involved in imaginal disc morphogenesis. Mol. Gen. Genet. 1998, 257, 113–123. [Google Scholar] [CrossRef]
- Serras, F.; Morey, M.; Alsina, B.; Baguñà, J.; Corominas, M. The Drosophila selenophosphate synthetase (selD) gene is required for development and cell proliferation. Biofactors 2001, 14, 143–149. [Google Scholar] [CrossRef]
- Shim, M.S.; Kim, J.Y.; Jung, H.K.; Lee, K.H.; Xu, X.-M.; Carlson, B.A.; Kim, K.W.; Kim, I.Y.; Hatfield, D.L.; Lee, B.J. Elevation of glutamine level by selenophosphate synthetase 1 knockdown induces megamitochondrial formation in Drosophila cells. J. Biol. Chem. 2009, 284, 32881–32894. [Google Scholar] [CrossRef] [Green Version]
- Tobe, R.; Carlson, B.A.; Huh, J.H.; Castro, N.P.; Xu, X.-M.; Tsuji, P.A.; Lee, S.-G.; Bang, J.; Na, J.-W.; Kong, Y.-Y.; et al. Selenophosphate synthetase 1 is an essential protein with roles in regulation of redox homoeostasis in mammals. Biochem. J. 2016, 473, 2141–2154. [Google Scholar] [CrossRef] [PubMed] [Green Version]
- Riley, P.A. Free radicals in biology: Oxidative stress and the effects of ionizing radiation. Int. J. Radiat. Biol. 1994, 65, 27–33. [Google Scholar] [CrossRef] [PubMed]
- Yildirim, A.; Mavi, A.; Oktay, M.; Kara, A.A.; Algur, O.F.; Bilaloglu, V. Comparison of antioxidant and antimicrobial activities of tilia (Tilia argentea Desf ex DC), sage (Salvia triloba l.), and black tea (Camellia sinensis) extracts. J. Agric. Food Chem. 2000, 48, 5030–5034. [Google Scholar] [CrossRef]
- Hopkins, R.Z.; Li, Y.R. Sources of free radicals and related reactive species. In Essentials of Free Radical Biology and Medicine, 1st ed.; Cell Med Press AIMSCI, Inc.: Raleigh, NC, USA, 2017; pp. 49–58. [Google Scholar]
- Cifuentes, M.E.; Pagano, P.J. Targeting reactive oxygen species in hypertension. Curr. Opin. Nephrol. Hypertens. 2006, 15, 179–186. [Google Scholar] [CrossRef] [PubMed]
- Panday, A.; Sahoo, M.K.; Osorio, D.; Batra, S. NADPH oxidases: An overview from structure to innate immunity-associated pathologies. Cell. Mol. Immunol. 2015, 12, 5–23. [Google Scholar] [CrossRef] [Green Version]
- Shanmugasundaram, K.; Nayak, B.K.; Friedrichs, W.E.; Kaushik, D.; Rodriguez, R.; Block, K. NOX4 functions as a mitochondrial energetic sensor coupling cancer metabolic reprogramming to drug resistance. Nat. Commun. 2017, 8, 997. [Google Scholar] [CrossRef] [Green Version]
- Nishino, T.; Okamoto, K. Mechanistic insights into xanthine oxidoreductase from development studies of candidate drugs to treat hyperuricemia and gout. J. Biol. Inorg. Chem. 2015, 20, 195–207. [Google Scholar] [CrossRef] [Green Version]
- Schaffer, S.W.; Roy, R.S.; McMcord, J.M. Possible role for calmodulin in calcium paradox-induced heart failure. Eur. Heart J. 1983, 4, 81–87. [Google Scholar] [CrossRef]
- Corte, E.D.; Stirpe, F. The regulation of rat liver xanthine oxidase. Involvement of thiol groups in the conversion of the enzyme activity from dehydrogenase (type D) into oxidase (type O) and purification of the enzyme. Biochem. J. 1972, 126, 739–745. [Google Scholar] [CrossRef] [Green Version]
- Lee, M.C.I.; Velayutham, M.; Komatsu, T.; Hille, R.; Zweier, J.L. Measurement and Characterization of Superoxide Generation from Xanthine Dehydrogenase: A Redox-Regulated Pathway of Radical Generation in Ischemic Tissues. Biochemistry 2014, 53, 6615–6623. [Google Scholar] [CrossRef] [Green Version]
- Schieber, M.; Chandel, N.S. ROS Function in Redox Signaling and Review Oxidative Stress. Curr. Biol. 2014, 24, R453–R462. [Google Scholar] [CrossRef] [Green Version]
- Morgan, B.; Sobotta, M.C.; Dick, T.P. Measuring E(GSH) and H2O2 with roGFP2-based redox probes. Free Radic. Biol. Med. 2011, 51, 1943–1951. [Google Scholar] [CrossRef] [PubMed]
- Gutscher, M.; Pauleau, A.L.; Marty, L.; Brach, T.; Wabnitz, G.H.; Samstag, Y.; Meyer, A.J.; Dick, T.P. Real-time imaging of the intracellular glutathione redox potential. Nat. Methods 2008, 5, 553–559. [Google Scholar] [CrossRef]
- Xu, L.; Wu, T.; Lu, S.; Hao, X.; Qin, J.; Wang, J.; Zhang, X.; Liu, Q.; Kong, B.; Gong, Y.; et al. Mitochondrial superoxide contributes to oxidative stress exacerbated by DNA damage response in RAD51-depleted ovarian cancer cells. Redox Biol. 2020, 36, 101604. [Google Scholar] [CrossRef] [PubMed]
- Fernandez-Capetillo, O.; Chen, H.T.; Celeste, A.; Ward, I.; Romanienko, P.J.; Morales, J.C.; Naka, K.; Xia, Z.; Camerini-Otero, R.D.; Motoyama, N.; et al. DNA damage-induced G2-M checkpoint activation by histone H2AX and 53BP1. Nat. Cell. Biol. 2002, 4, 993–997. [Google Scholar] [CrossRef] [PubMed]
- Lubos, E.; Handy, D.E.; Loscalzo, J. Role of oxidative stress and nitric oxide in atherothrombosis. Biosciences 2009, 13, 5323–5344. [Google Scholar] [CrossRef] [PubMed] [Green Version]
- Carpentier, G.; Berndt, S.; Ferratge, S.; Rasband, W.; Cuendet, M.; Uzan, G.; Albanese, P. Angiogenesis Analyzer for ImageJ—A comparative morphometric analysis of “Endothelial Tube Formation Assay” and “Fibrin Bead Assay”. Sci. Rep. 2020, 10, 11568. [Google Scholar] [CrossRef] [PubMed]
- Wang, Q.; Mazur, A.; François Guerrero, X.; Lambrechts, K.; Buzzacott, P.; Belhomme, M.; Theron, M. Antioxidants, endothelial dysfunction, and DCS: In vitro and in vivo study. J. Appl. Physiol. 2015, 119, 1355–1362. [Google Scholar] [CrossRef] [PubMed]
- Ran, F.A.; Hsu, P.D.; Wright, J.; Agarwala, V.; Scott, D.A.; Zhang, F. Genome engineering using the CRISPR-Cas9 system. Nat. Protoc. 2013, 8, 2281–2308. [Google Scholar] [CrossRef] [Green Version]
- Bang, J.; Huh, J.H.; Na, J.W.; Lu, Q.; Carlson, B.A.; Tobe, R.; Tsuji, P.A.; Gladyshev, V.N.; Hatfield, D.L.; Lee, B.J. Cell proliferation and motility are inhibited by G1phase arrest in 15-kDa selenoprotein-deficient Chang liver cells. Mol. Cells. 2015, 38, 457–465. [Google Scholar] [CrossRef] [Green Version]
- Kim, M.; Chen, Z.; Shim, M.S.; Lee, M.S.; Kim, J.E.; Kwon, Y.E.; Yoo, T.J.; Kim, J.Y.; Bang, J.Y.; Carlson, B.A.; et al. SUMO Modification of NZFP Mediates Transcriptional Repression through TBP Binding. Mol. Cells 2013, 35, 70–78. [Google Scholar] [CrossRef] [PubMed] [Green Version]
- Cao, J.; Liu, X.; Yang, Y.; Wei, B.; Li, Q.; Mao, G.; He, Y.; Li, Y.; Zheng, L.; Zhang, Q.; et al. Decylubiquinone suppresses breast cancer growth and metastasis by inhibiting angiogenesis via the ROS/p53/BAI1 signaling pathway. Angiogenesis 2020, 23, 325–338. [Google Scholar] [CrossRef] [PubMed]
- Kate, M.; van der Wal, J.B.C.; Sluiter, W.; Hofland, L.J.; Jeekel, J.; Sonneveld, P.; van Eijck, C.H.J. The role of superoxide anions in the development of distant tumour recurrence. Br. J. Cancer 2006, 95, 1497–1503. [Google Scholar] [CrossRef] [PubMed]
- Augsburger, F.; Filippova, A.; Rasti, D.; Seredenina, T.; Lam, M.; Maghzal, G.; Mahiout, Z.; Jansen-Dürr, P.; Knaus, U.G.; Doroshow, J.; et al. Pharmachological characterization of the seven human NOX isoforms and their inhibitors. Redox. Biol. 2019, 26, 2213–2317. [Google Scholar] [CrossRef] [PubMed]
- Handa, O.; Stephen, J.; Cepinskas, G. Role of endothelial nitric oxide synthase-derived nitric oxide in activation and dysfunction of cerebrovascular endothelial cells during early onsets of sepsis. Am. J. Physiol. Heart Circ. Physiol. 2008, 295, H1712–H1719. [Google Scholar] [CrossRef] [Green Version]
- Kim, J.Y.; Lee, K.H.; Shim, M.S.; Shin, H.I.; Xu, X.M.; Carlson, B.A.; Hatfield, D.L.; Lee, B.J. Human selenophosphate synthetase 1 has five splice variants with unique interactions, subcellular localizations and expression patterns. Biochem. Biophys. Res. Commun. 2010, 397, 53–58. [Google Scholar] [CrossRef] [Green Version]


Publisher’s Note: MDPI stays neutral with regard to jurisdictional claims in published maps and institutional affiliations. |
© 2021 by the authors. Licensee MDPI, Basel, Switzerland. This article is an open access article distributed under the terms and conditions of the Creative Commons Attribution (CC BY) license (https://creativecommons.org/licenses/by/4.0/).
Share and Cite
Jung, J.; Kim, Y.; Na, J.; Qiao, L.; Bang, J.; Kwon, D.; Yoo, T.-J.; Kang, D.; Kim, L.K.; Carlson, B.A.; et al. Constitutive Oxidative Stress by SEPHS1 Deficiency Induces Endothelial Cell Dysfunction. Int. J. Mol. Sci. 2021, 22, 11646. https://0-doi-org.brum.beds.ac.uk/10.3390/ijms222111646
Jung J, Kim Y, Na J, Qiao L, Bang J, Kwon D, Yoo T-J, Kang D, Kim LK, Carlson BA, et al. Constitutive Oxidative Stress by SEPHS1 Deficiency Induces Endothelial Cell Dysfunction. International Journal of Molecular Sciences. 2021; 22(21):11646. https://0-doi-org.brum.beds.ac.uk/10.3390/ijms222111646
Chicago/Turabian StyleJung, Jisu, Yoomin Kim, Jiwoon Na, Lu Qiao, Jeyoung Bang, Dongin Kwon, Tack-Jin Yoo, Donghyun Kang, Lark Kyun Kim, Bradley A. Carlson, and et al. 2021. "Constitutive Oxidative Stress by SEPHS1 Deficiency Induces Endothelial Cell Dysfunction" International Journal of Molecular Sciences 22, no. 21: 11646. https://0-doi-org.brum.beds.ac.uk/10.3390/ijms222111646