
Clinical and Molecular Biomarkers for Diagnosis and Staging of NAFLD

 , , ,
, , ,  , , and
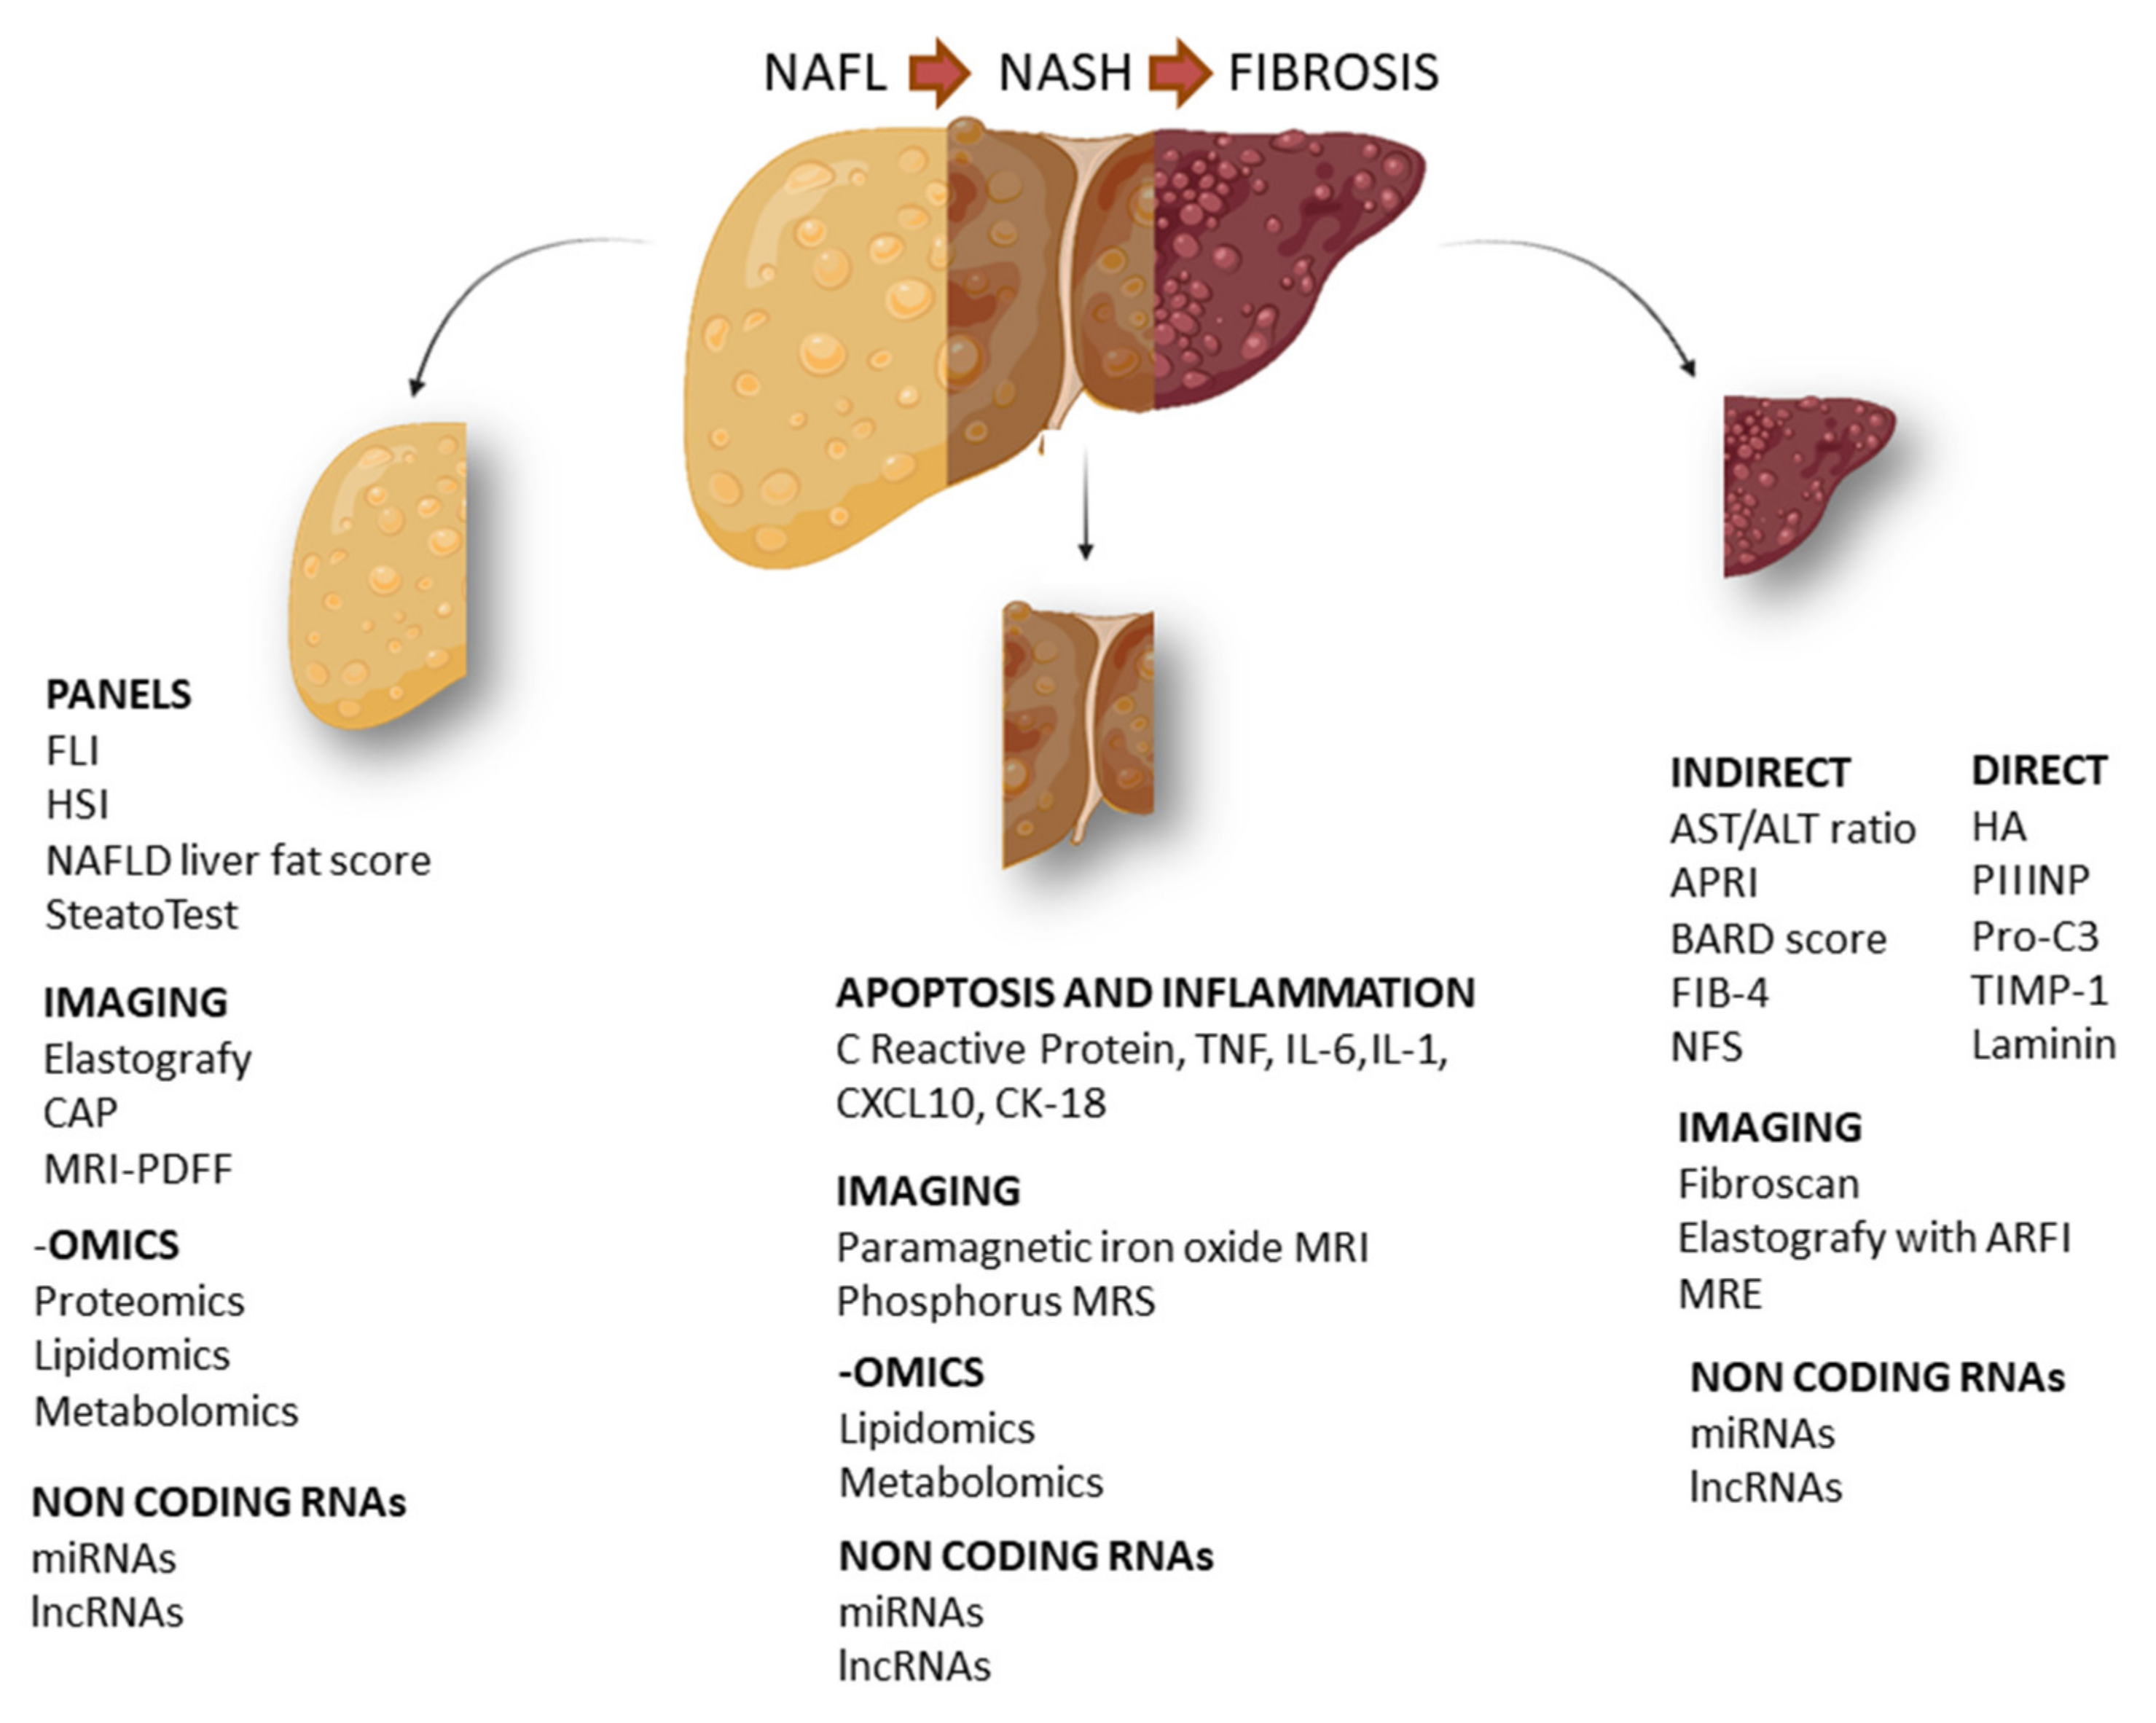
Abstract
:1. Introduction
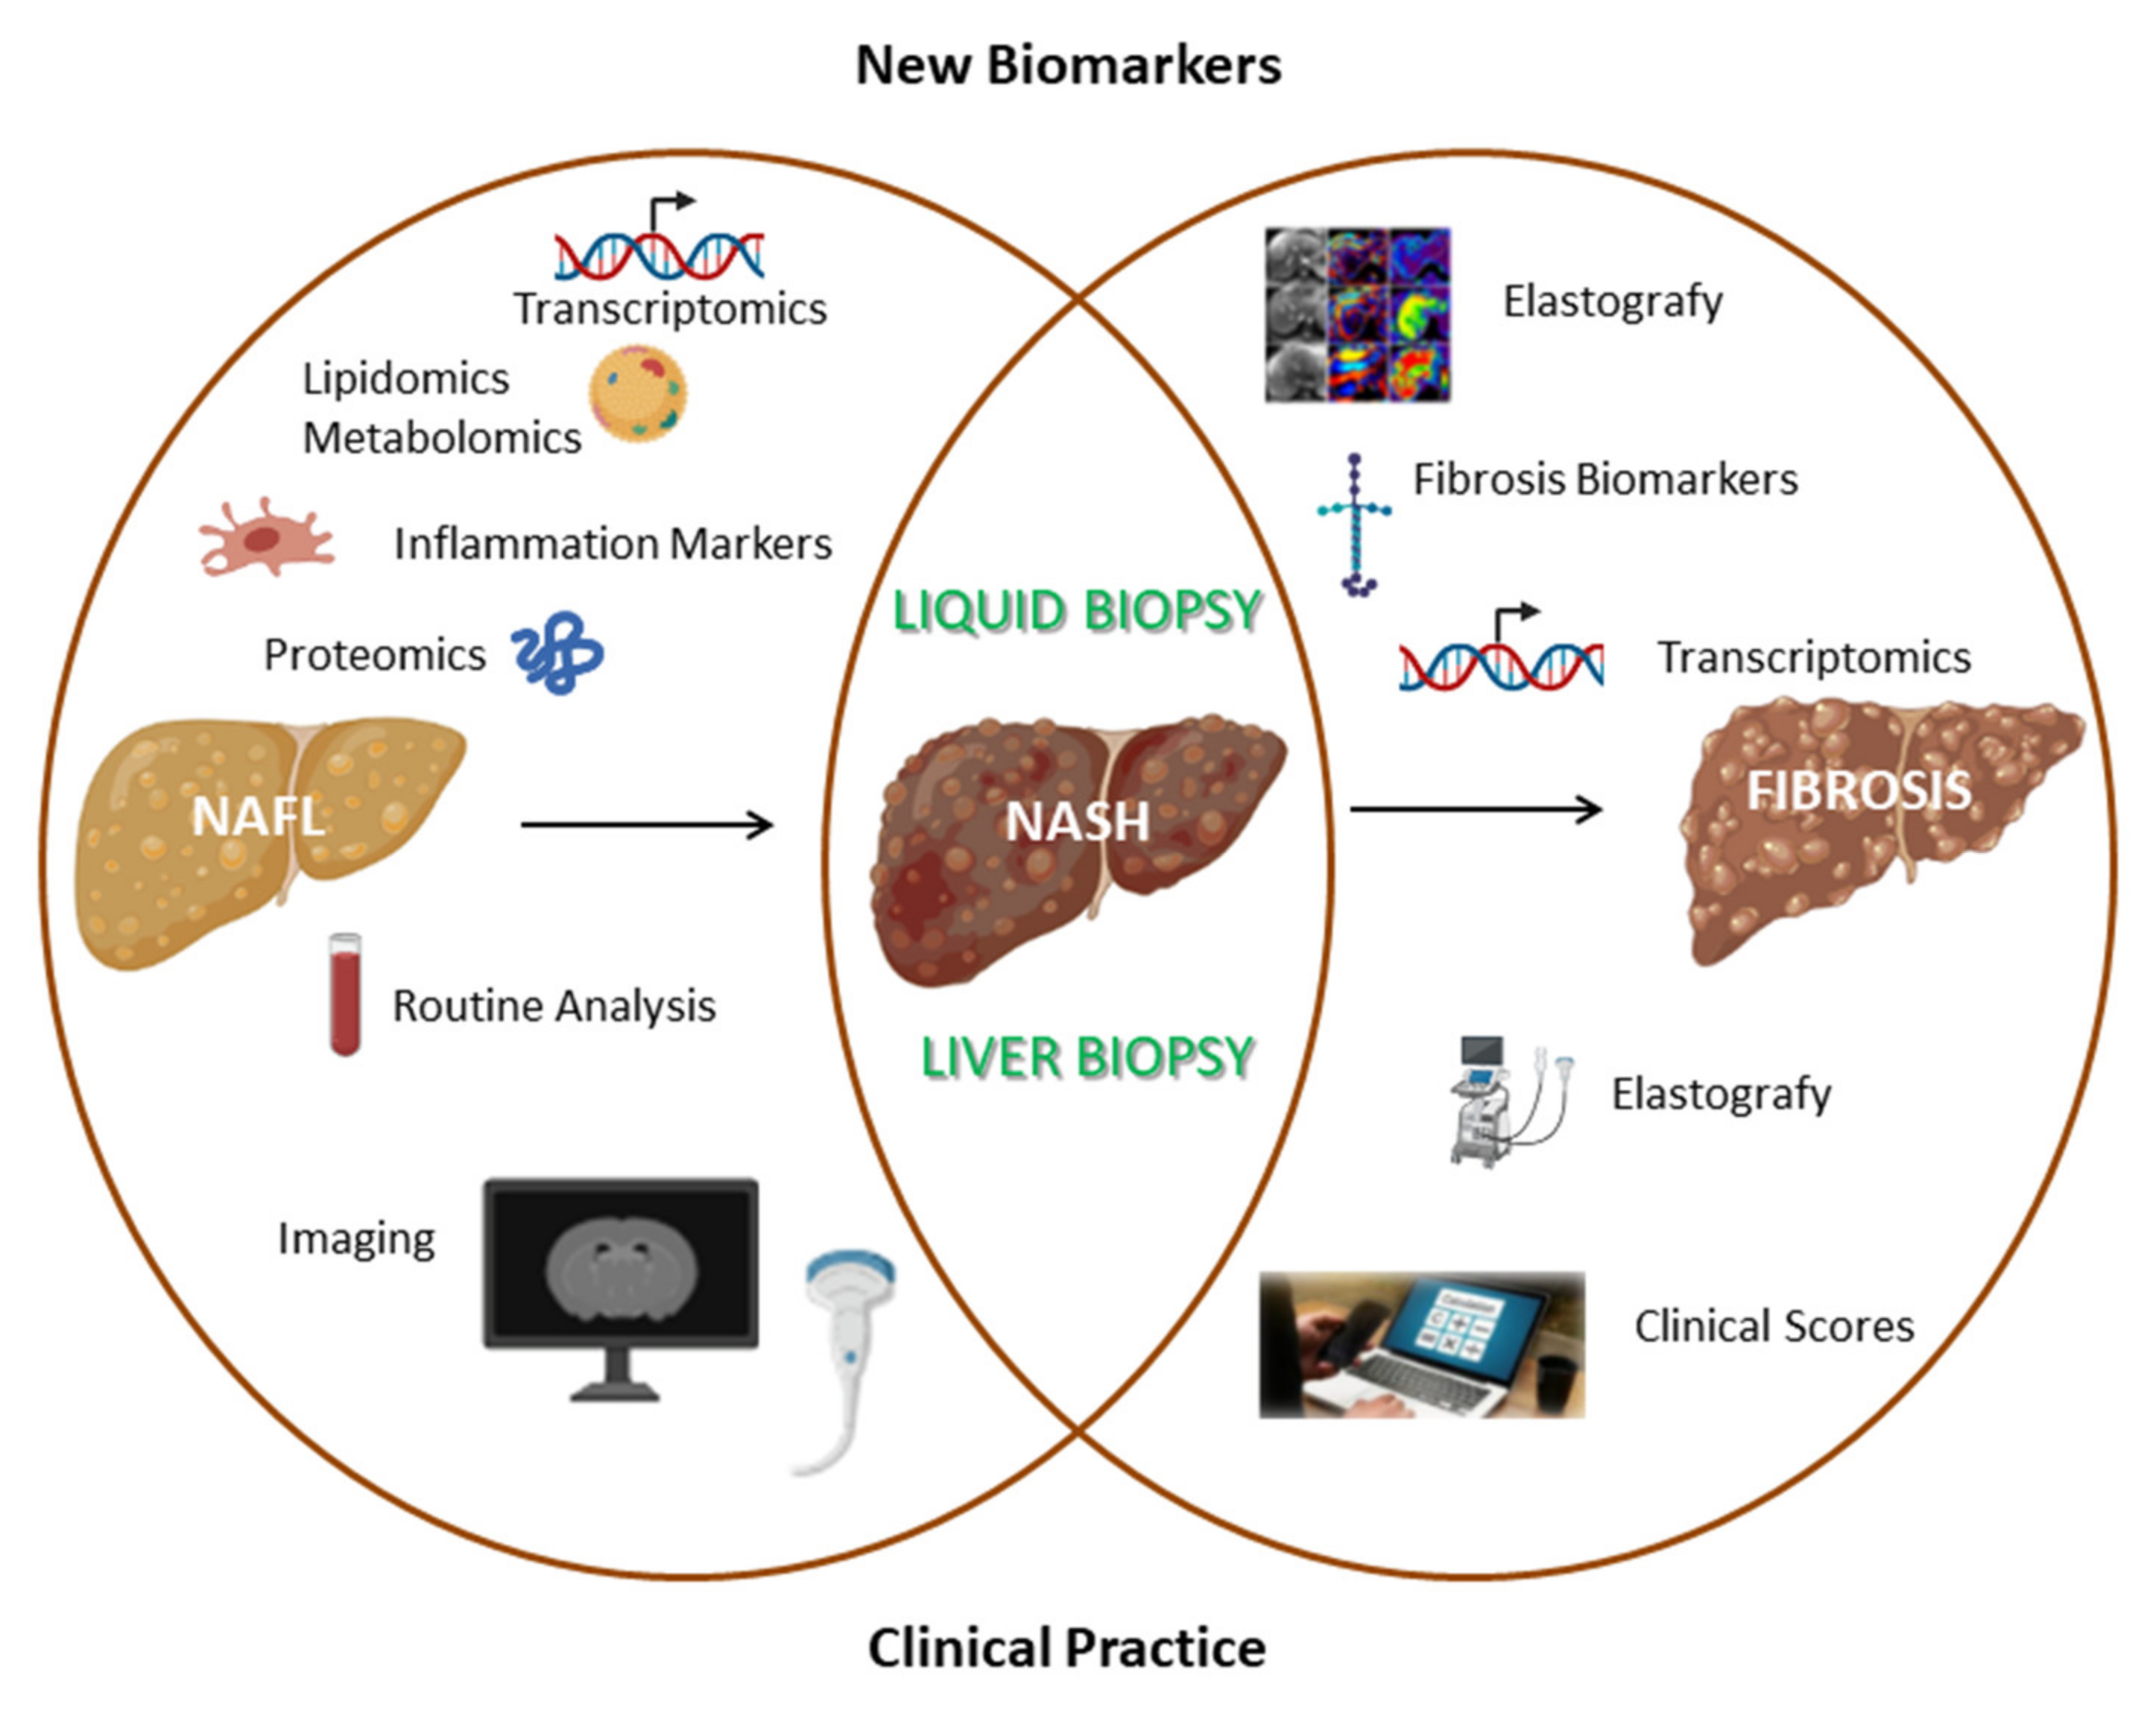
2. NAFL Biomarkers
2.1. Serum Biomarkers and Relative Panels
2.2. Imaging Biomarkers
2.3. Omics-Based Biomarkers
3. NASH Biomarkers
3.1. Protein Serum and Plasma Biomarkers Associated with Apoptosis and Inflammation
3.2. Omics-Based Biomarkers
3.3. Imaging Biomarkers
4. Fibrosis Biomarkers
4.1. Indirect Biomarkers for Hepatic Fibrosis
4.2. Fibrosis Biomarkers
4.3. Imaging Biomarkers of Fibrosis
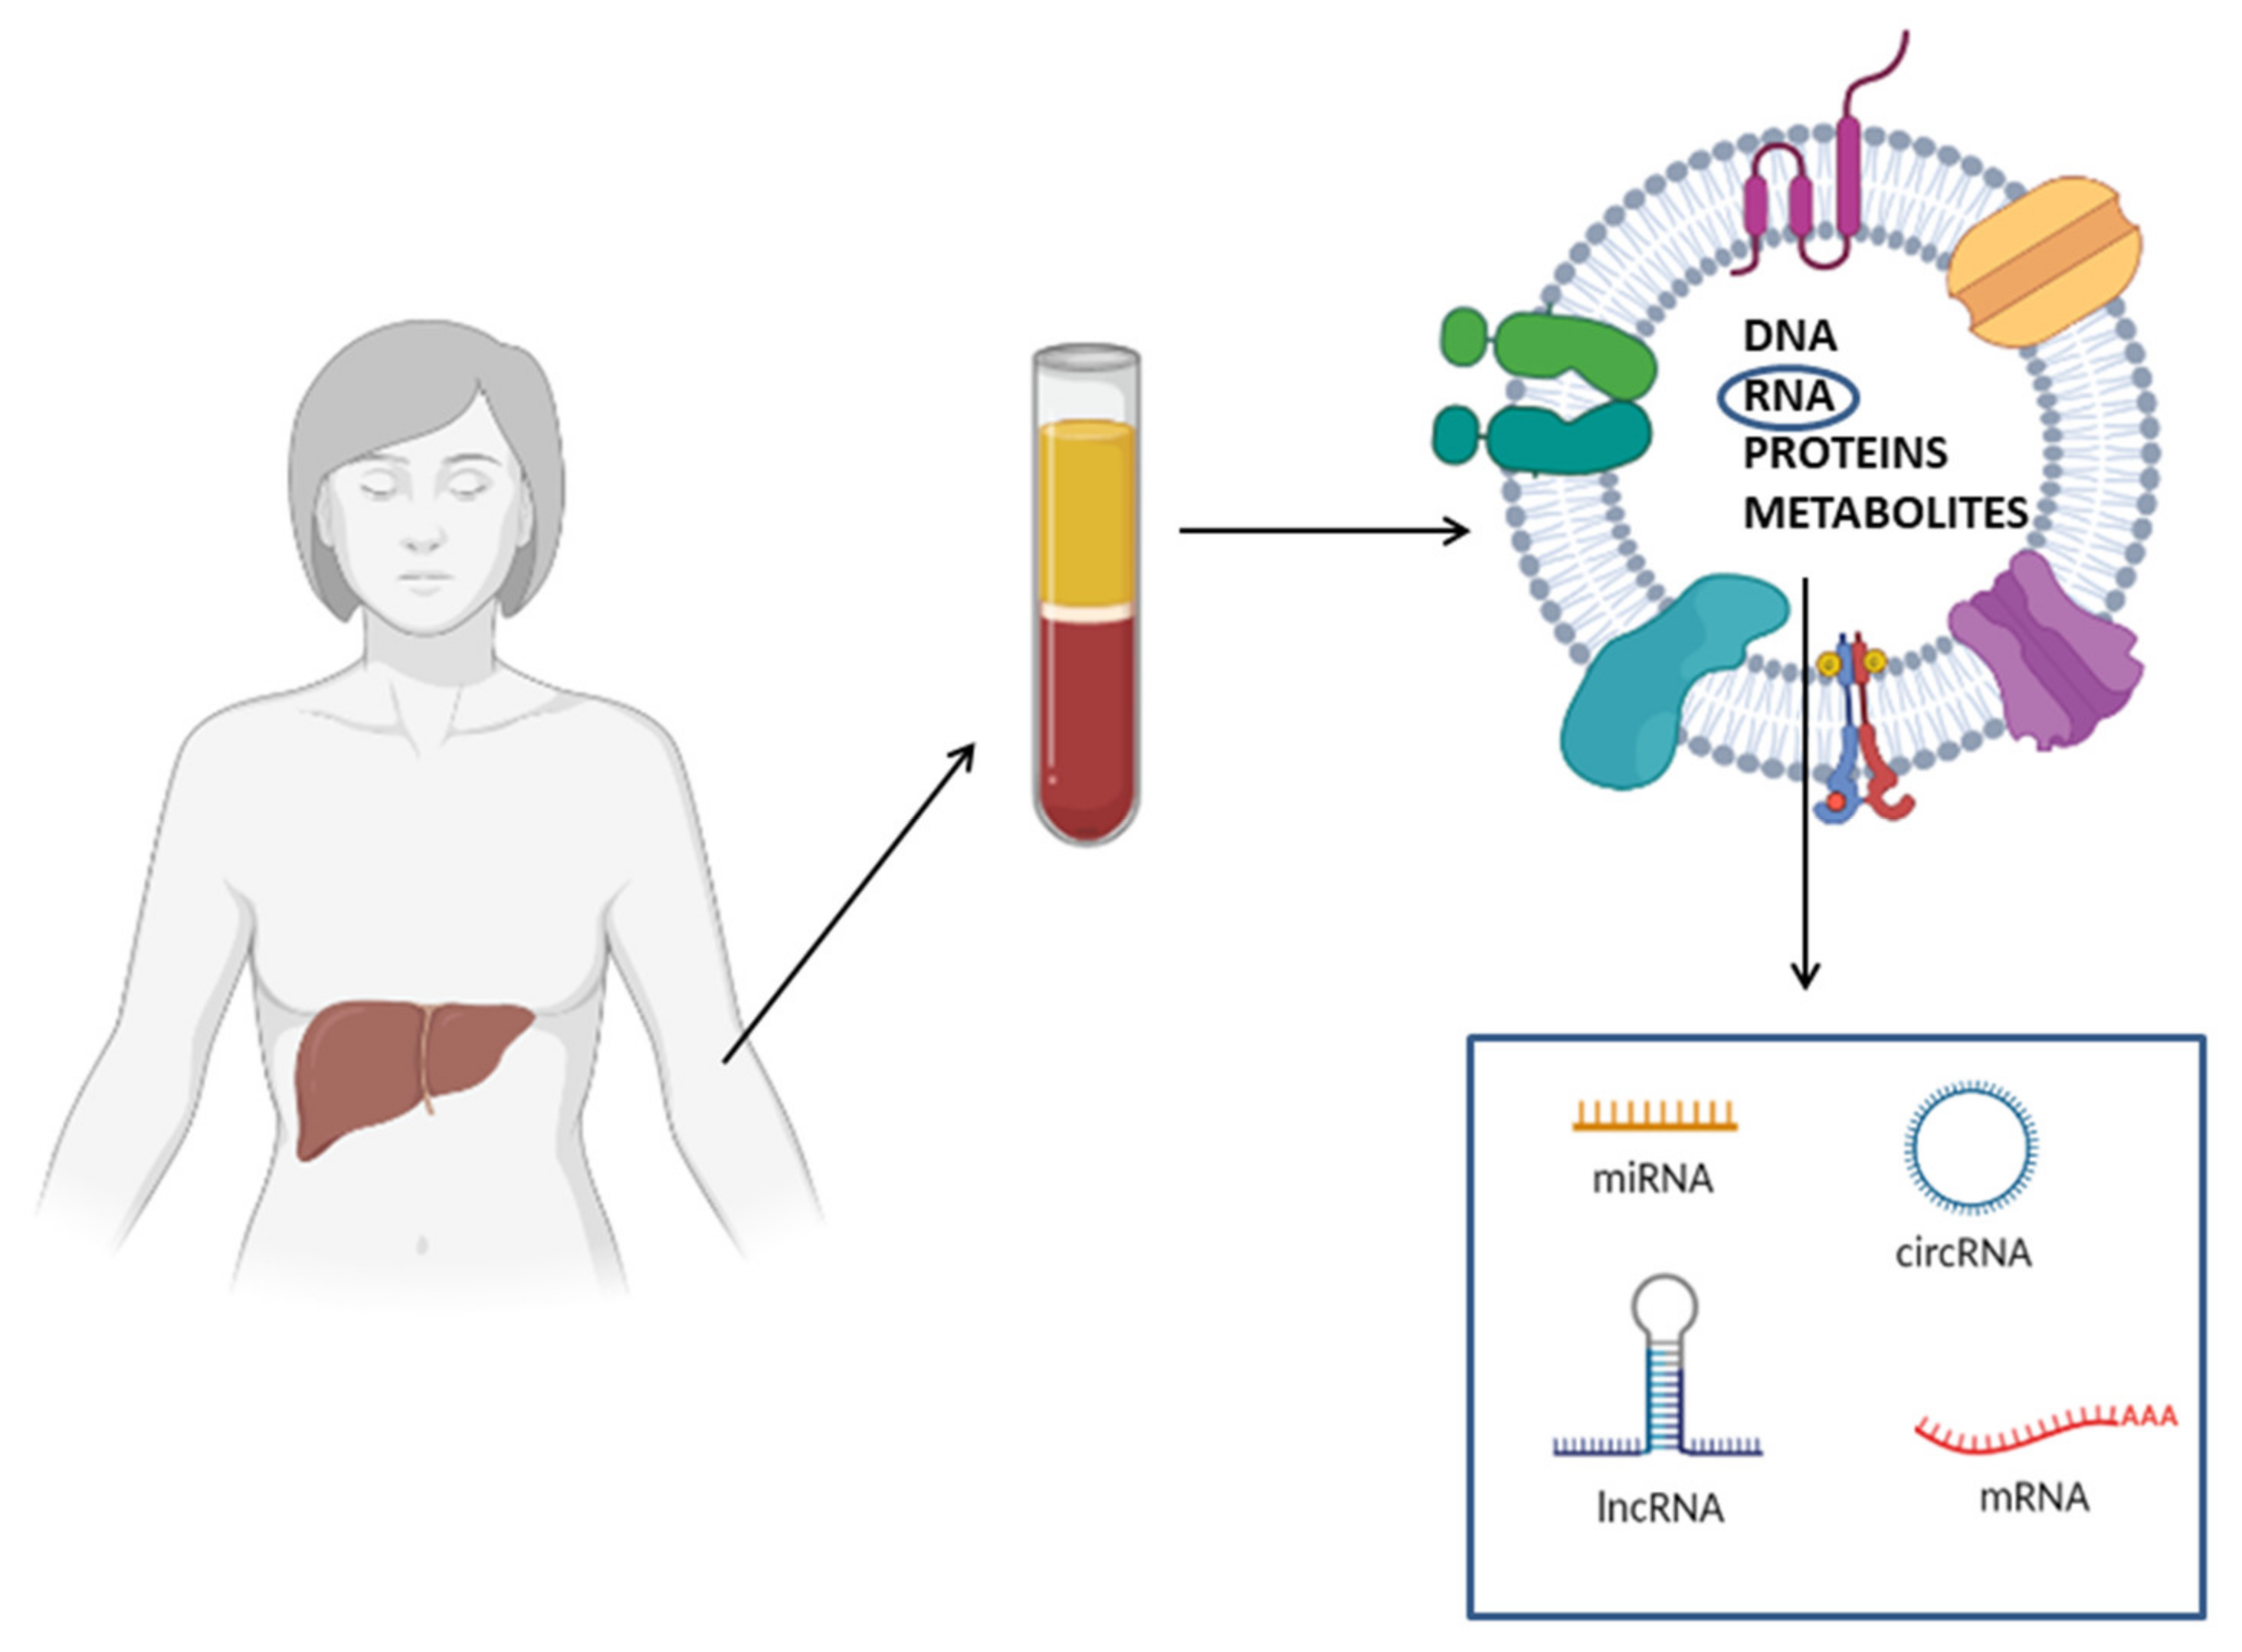
5. RNA Biomarkers
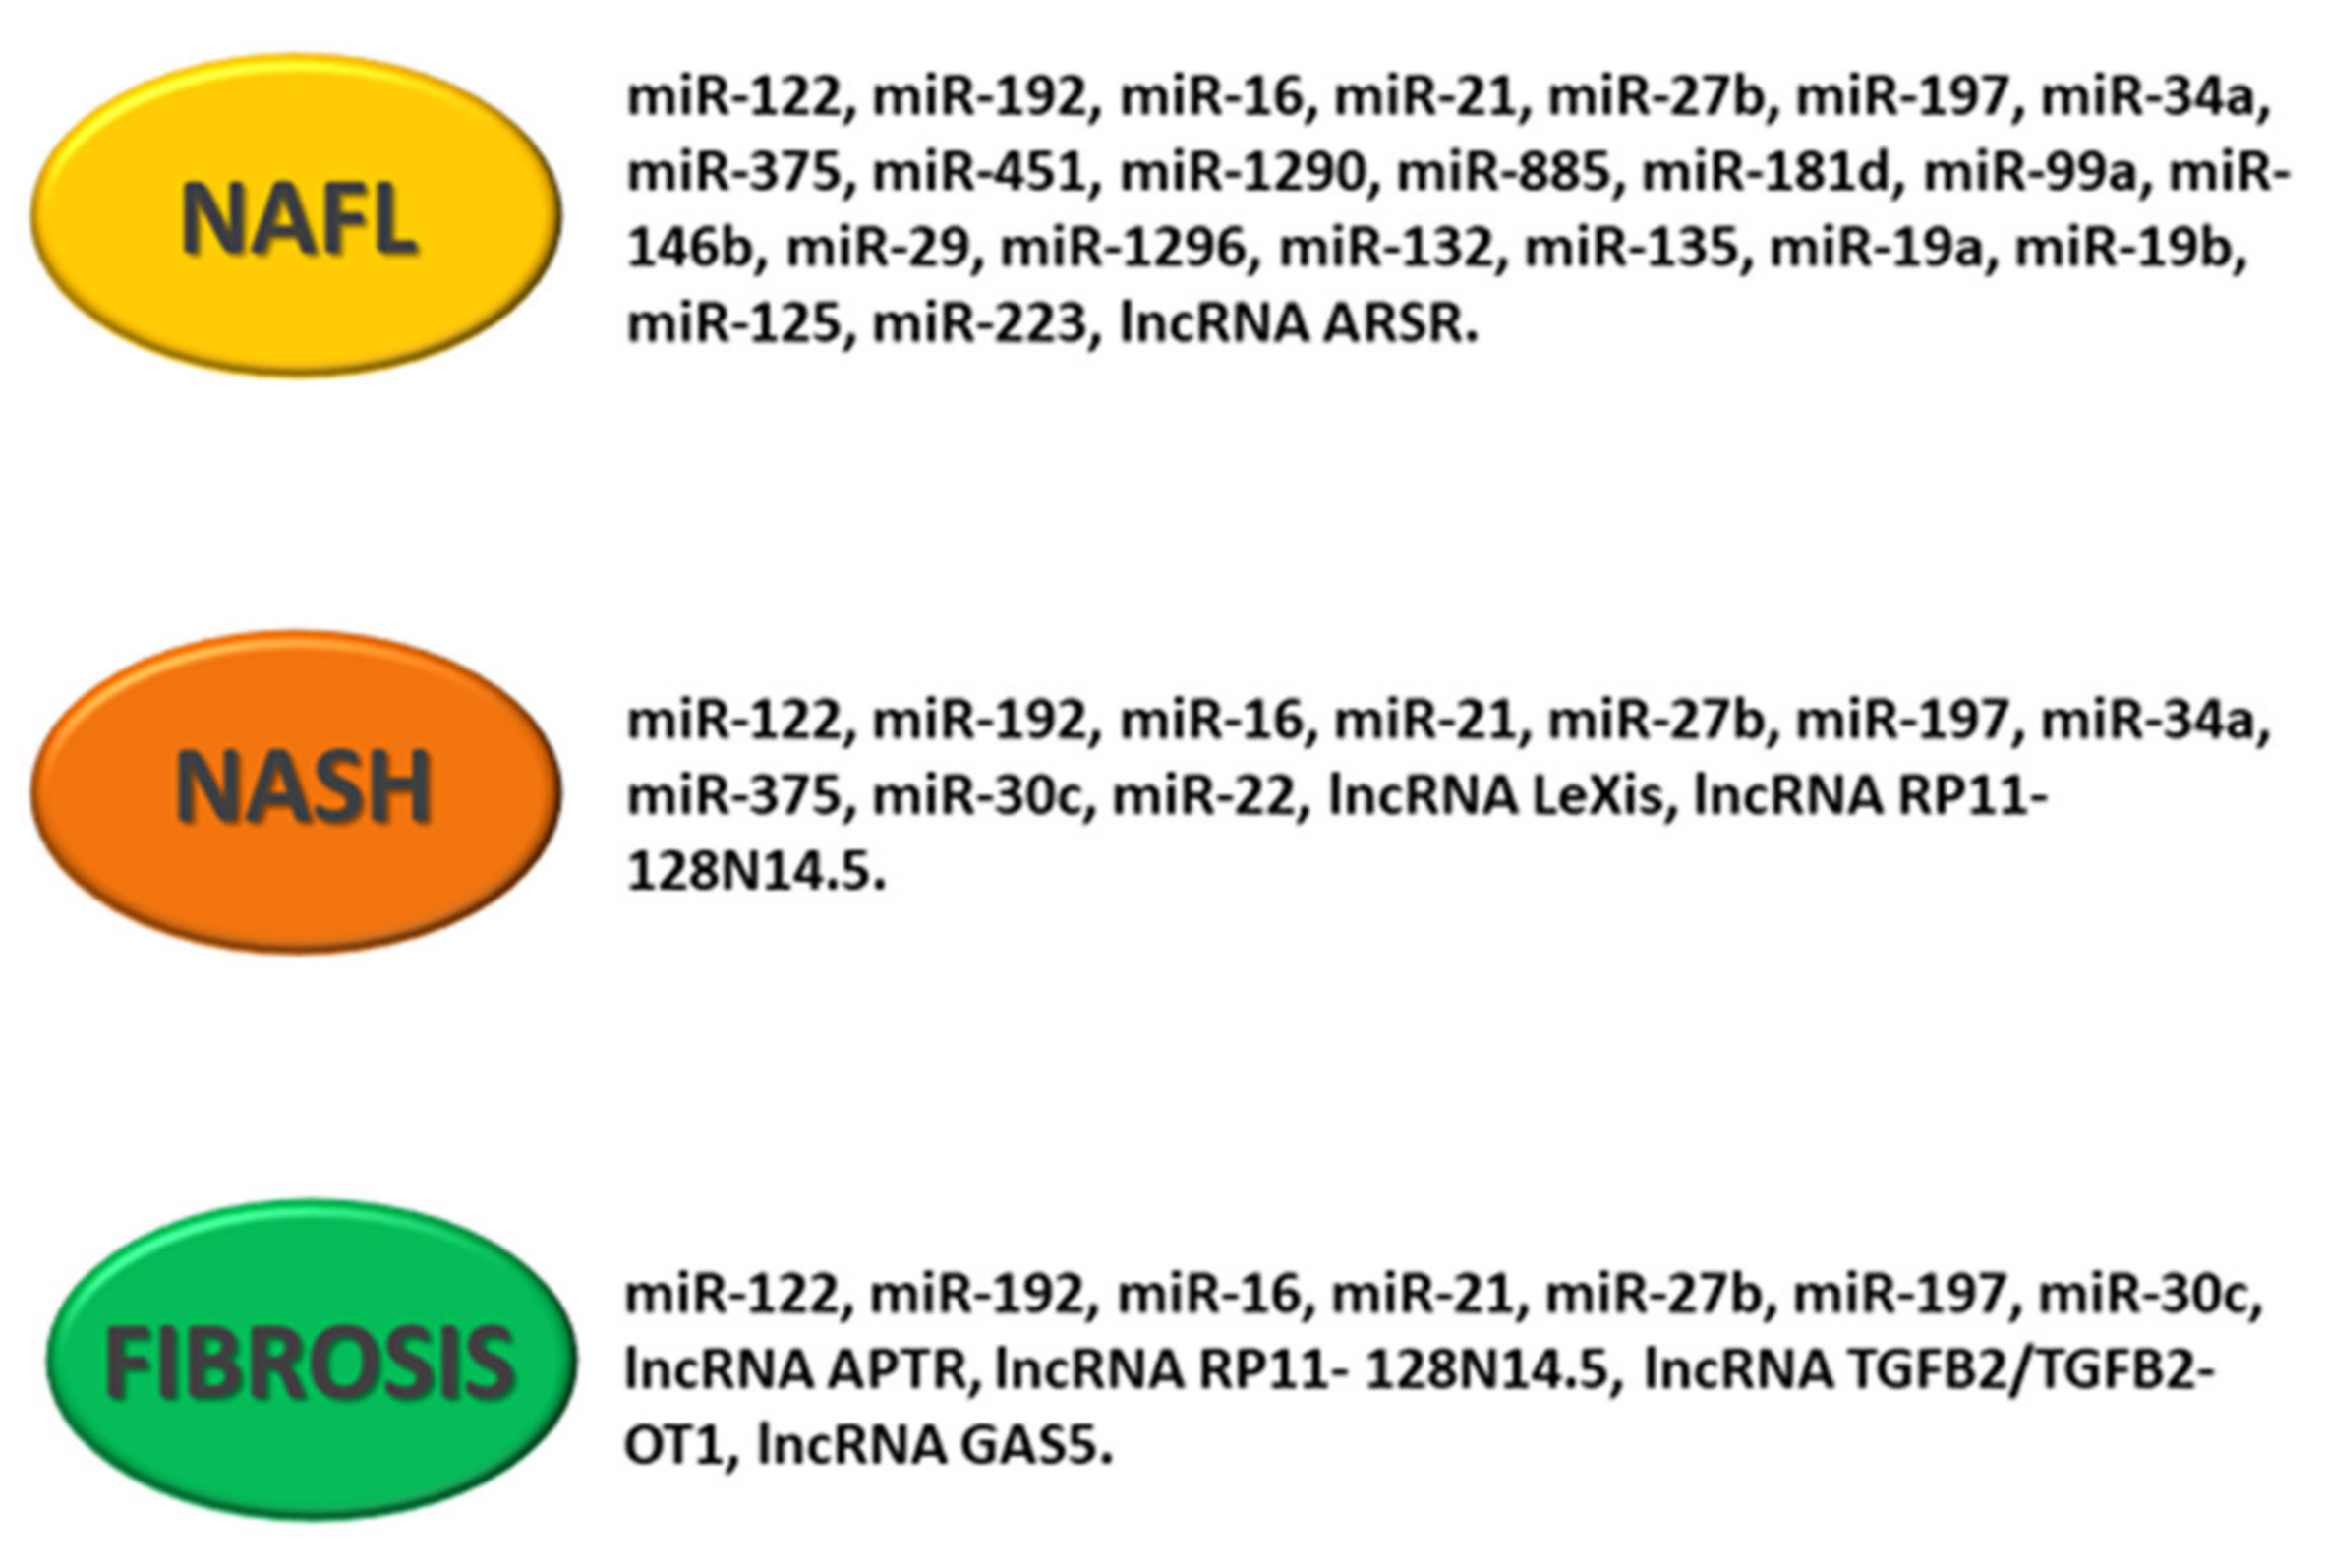
5.1. Circulating RNAs as NAFLD Biomarkers in the General Population
5.2. Circulating RNAs for Differential Diagnosis between NAFL and NASH
5.3. Circulating RNAs for Fibrosis Stage Definition
6. Conclusions
Author Contributions
Funding
Institutional Review Board Statement
Informed Consent Statement
Data Availability Statement
Acknowledgments
Conflicts of Interest
References
- Filippello, A.; Scamporrino, A.; Di Mauro, S.; Malaguarnera, R.; Di Pino, A.; Scicali, R.; Purrello, F.; Piro, S. Direct Effects of D-Chiro-Inositol on Insulin Signaling and Glucagon Secretion of Pancreatic Alpha Cells. Biomolecules 2020, 10, 1404. [Google Scholar] [CrossRef]
- Armutcu, F.; Akyol, S.; Vura, H. Metabolic Syndrome is an Important Cornerstone in the Health-disease Line and Pathological Organ Interaction. J. Cell. Signal. 2020, 1, 70–75. [Google Scholar]
- Filippello, A.; Di Mauro, S.; Scamporrino, A.; Malaguarnera, R.; Torrisi, S.A.; Leggio, G.M.; Di Pino, A.; Scicali, R.; Purrello, F.; Piro, S. High Glucose Exposure Impairs L-Cell Differentiation in Intestinal Organoids: Molecular Mechanisms and Clinical Implications. Int. J. Mol. Sci. 2021, 22, 6660. [Google Scholar] [CrossRef] [PubMed]
- Filippello, A.; Urbano, F.; Di Mauro, S.; Scamporrino, A.; Di Pino, A.; Scicali, R.; Rabuazzo, A.M.; Purrello, F.; Piro, S. Chronic Exposure to Palmitate Impairs Insulin Signaling in an Intestinal L-cell Line: A Possible Shift from GLP-1 to Glucagon Production. Int. J. Mol. Sci. 2018, 19, 3791. [Google Scholar] [CrossRef] [Green Version]
- Younossi, Z.M.; Koenig, A.B.; Abdelatif, D.; Fazel, Y.; Henry, L.; Wymer, M. Global epidemiology of nonalcoholic fatty liver disease-Meta-analytic assessment of prevalence, incidence, and outcomes. Hepatology 2016, 64, 73–84. [Google Scholar] [CrossRef] [PubMed] [Green Version]
- Di Mauro, S.; Ragusa, M.; Urbano, F.; Filippello, A.; Di Pino, A.; Scamporrino, A.; Pulvirenti, A.; Ferro, A.; Rabuazzo, A.M.; Purrello, M.; et al. Intracellular and extracellular miRNome deregulation in cellular models of NAFLD or NASH: Clinical implications. Nutr. Metab. Cardiovasc. Dis. 2016, 26, 1129–1139. [Google Scholar] [CrossRef]
- Scicali, R.; Di Pino, A.; Urbano, F.; Ferrara, V.; Marchisello, S.; Di Mauro, S.; Scamporrino, A.; Filippello, A.; Rabuazzo, A.M.; Purrello, F.; et al. Analysis of steatosis biomarkers and inflammatory profile after adding on PCSK9 inhibitor treatment in familial hypercholesterolemia subjects with nonalcoholic fatty liver disease: A single lipid center real-world experience. Nutr. Metab. Cardiovasc. Dis. 2021, 31, 869–879. [Google Scholar] [CrossRef] [PubMed]
- Masarone, M.; Rosato, V.; Aglitti, A.; Bucci, T.; Caruso, R.; Salvatore, T.; Sasso, F.C.; Tripodi, M.F.; Persico, M. Liver biopsy in type 2 diabetes mellitus: Steatohepatitis represents the sole feature of liver damage. PLoS ONE 2017, 12, e0178473. [Google Scholar] [CrossRef]
- Chalasani, N.; Younossi, Z.; Lavine, J.E.; Charlton, M.; Cusi, K.; Rinella, M.; Harrison, S.A.; Brunt, E.M.; Sanyal, A.J. The diagnosis and management of nonalcoholic fatty liver disease: Practice guidance from the American Association for the Study of Liver Diseases. Hepatology 2018, 67, 328–357. [Google Scholar] [CrossRef]
- Rinaldi, L.; Pafundi, P.C.; Galiero, R.; Caturano, A.; Morone, M.V.; Silvestri, C.; Giordano, M.; Salvatore, T.; Sasso, F.C. Mechanisms of Non-Alcoholic Fatty Liver Disease in the Metabolic Syndrome. A Narrative Review. Antioxidants 2021, 10, 270. [Google Scholar] [CrossRef]
- Zhou, J.H.; Cai, J.J.; She, Z.G.; Li, H.L. Noninvasive evaluation of nonalcoholic fatty liver disease: Current evidence and practice. World J. Gastroenterol. 2019, 25, 1307–1326. [Google Scholar] [CrossRef] [PubMed]
- Piazzolla, V.A.; Mangia, A. Noninvasive Diagnosis of NAFLD and NASH. Cells 2020, 9, 1005. [Google Scholar] [CrossRef]
- Wong, V.W.; Adams, L.A.; de Ledinghen, V.; Wong, G.L.; Sookoian, S. Noninvasive biomarkers in NAFLD and NASH—current progress and future promise. Nat. Rev. Gastroenterol. Hepatol. 2018, 15, 461–478. [Google Scholar] [CrossRef] [PubMed]
- Kogachi, S.; Noureddin, M. Noninvasive Evaluation for Nonalcoholic Fatty Liver Disease and Nonalcoholic Steatohepatitis. Clin. Ther. 2021, 43, 455–472. [Google Scholar] [CrossRef] [PubMed]
- Bedogni, G.; Bellentani, S.; Miglioli, L.; Masutti, F.; Passalacqua, M.; Castiglione, A.; Tiribelli, C. The Fatty Liver Index: A simple and accurate predictor of hepatic steatosis in the general population. BMC Gastroenterol. 2006, 6, 33. [Google Scholar] [CrossRef] [Green Version]
- Fedchuk, L.; Nascimbeni, F.; Pais, R.; Charlotte, F.; Housset, C.; Ratziu, V.; Group, L.S. Performance and limitations of steatosis biomarkers in patients with nonalcoholic fatty liver disease. Aliment. Pharmacol. Ther. 2014, 40, 1209–1222. [Google Scholar] [CrossRef]
- Lee, J.H.; Kim, D.; Kim, H.J.; Lee, C.H.; Yang, J.I.; Kim, W.; Kim, Y.J.; Yoon, J.H.; Cho, S.H.; Sung, M.W.; et al. Hepatic steatosis index: A simple screening tool reflecting nonalcoholic fatty liver disease. Dig. Liver Dis. 2010, 42, 503–508. [Google Scholar] [CrossRef]
- Koot, B.G.; van der Baan-Slootweg, O.H.; Bohte, A.E.; Nederveen, A.J.; van Werven, J.R.; Tamminga-Smeulders, C.L.; Merkus, M.P.; Schaap, F.G.; Jansen, P.L.; Stoker, J.; et al. Accuracy of prediction scores and novel biomarkers for predicting nonalcoholic fatty liver disease in obese children. Obesity 2013, 21, 583–590. [Google Scholar] [CrossRef]
- Kotronen, A.; Peltonen, M.; Hakkarainen, A.; Sevastianova, K.; Bergholm, R.; Johansson, L.M.; Lundbom, N.; Rissanen, A.; Ridderstrale, M.; Groop, L.; et al. Prediction of non-alcoholic fatty liver disease and liver fat using metabolic and genetic factors. Gastroenterology 2009, 137, 865–872. [Google Scholar] [CrossRef]
- Poynard, T.; Ratziu, V.; Naveau, S.; Thabut, D.; Charlotte, F.; Messous, D.; Capron, D.; Abella, A.; Massard, J.; Ngo, Y.; et al. The diagnostic value of biomarkers (SteatoTest) for the prediction of liver steatosis. Comp. Hepatol. 2005, 4, 10. [Google Scholar] [CrossRef] [Green Version]
- Hernaez, R.; Lazo, M.; Bonekamp, S.; Kamel, I.; Brancati, F.L.; Guallar, E.; Clark, J.M. Diagnostic accuracy and reliability of ultrasonography for the detection of fatty liver: A meta-analysis. Hepatology 2011, 54, 1082–1090. [Google Scholar] [CrossRef] [PubMed] [Green Version]
- Karlas, T.; Petroff, D.; Sasso, M.; Fan, J.G.; Mi, Y.Q.; de Ledinghen, V.; Kumar, M.; Lupsor-Platon, M.; Han, K.H.; Cardoso, A.C.; et al. Individual patient data meta-analysis of controlled attenuation parameter (CAP) technology for assessing steatosis. J. Hepatol. 2017, 66, 1022–1030. [Google Scholar] [CrossRef]
- Park, C.C.; Nguyen, P.; Hernandez, C.; Bettencourt, R.; Ramirez, K.; Fortney, L.; Hooker, J.; Sy, E.; Savides, M.T.; Alquiraish, M.H.; et al. Magnetic Resonance Elastography vs Transient Elastography in Detection of Fibrosis and Noninvasive Measurement of Steatosis in Patients With Biopsy-Proven Nonalcoholic Fatty Liver Disease. Gastroenterology 2017, 152, 598–607. [Google Scholar] [CrossRef] [PubMed] [Green Version]
- Yu, C.; Xu, C.; Xu, L.; Yu, J.; Miao, M.; Li, Y. Serum proteomic analysis revealed diagnostic value of hemoglobin for nonalcoholic fatty liver disease. J. Hepatol. 2012, 56, 241–247. [Google Scholar] [CrossRef]
- Bell, L.N.; Theodorakis, J.L.; Vuppalanchi, R.; Saxena, R.; Bemis, K.G.; Wang, M.; Chalasani, N. Serum proteomics and biomarker discovery across the spectrum of nonalcoholic fatty liver disease. Hepatology 2010, 51, 111–120. [Google Scholar] [CrossRef] [PubMed] [Green Version]
- Kalhan, S.C.; Guo, L.; Edmison, J.; Dasarathy, S.; McCullough, A.J.; Hanson, R.W.; Milburn, M. Plasma metabolomic profile in nonalcoholic fatty liver disease. Metab. Clin. Exp. 2011, 60, 404–413. [Google Scholar] [CrossRef] [PubMed] [Green Version]
- Oresic, M.; Hyotylainen, T.; Kotronen, A.; Gopalacharyulu, P.; Nygren, H.; Arola, J.; Castillo, S.; Mattila, I.; Hakkarainen, A.; Borra, R.J.; et al. Prediction of non-alcoholic fatty-liver disease and liver fat content by serum molecular lipids. Diabetologia 2013, 56, 2266–2274. [Google Scholar] [CrossRef] [Green Version]
- Mayo, R.; Crespo, J.; Martinez-Arranz, I.; Banales, J.M.; Arias, M.; Minchole, I.; Aller de la Fuente, R.; Jimenez-Aguero, R.; Alonso, C.; de Luis, D.A.; et al. Metabolomic-based noninvasive serum test to diagnose nonalcoholic steatohepatitis: Results from discovery and validation cohorts. Hepatol. Commun. 2018, 2, 807–820. [Google Scholar] [CrossRef]
- Ekstedt, M.; Hagstrom, H.; Nasr, P.; Fredrikson, M.; Stal, P.; Kechagias, S.; Hultcrantz, R. Fibrosis stage is the strongest predictor for disease-specific mortality in NAFLD after up to 33 years of follow-up. Hepatology 2015, 61, 1547–1554. [Google Scholar] [CrossRef] [PubMed] [Green Version]
- Galiero, R.; Caturano, A.; Vetrano, E.; Cesaro, A.; Rinaldi, L.; Salvatore, T.; Marfella, R.; Sardu, C.; Moscarella, E.; Gragnano, F.; et al. Pathophysiological mechanisms and clinical evidence of relationship between Nonalcoholic fatty liver disease (NAFLD) and cardiovascular disease. Rev. Cardiovasc. Med. 2021, 22, 755–768. [Google Scholar] [CrossRef]
- Eguchi, A.; Wree, A.; Feldstein, A.E. Biomarkers of liver cell death. J. Hepatol. 2014, 60, 1063–1074. [Google Scholar] [CrossRef] [PubMed] [Green Version]
- Kwok, R.; Tse, Y.K.; Wong, G.L.; Ha, Y.; Lee, A.U.; Ngu, M.C.; Chan, H.L.; Wong, V.W. Systematic review with meta-analysis: Non-invasive assessment of non-alcoholic fatty liver disease--the role of transient elastography and plasma cytokeratin-18 fragments. Aliment. Pharmacol. Ther. 2014, 39, 254–269. [Google Scholar] [CrossRef] [PubMed]
- Tamimi, T.I.; Elgouhari, H.M.; Alkhouri, N.; Yerian, L.M.; Berk, M.P.; Lopez, R.; Schauer, P.R.; Zein, N.N.; Feldstein, A.E. An apoptosis panel for nonalcoholic steatohepatitis diagnosis. J. Hepatol. 2011, 54, 1224–1229. [Google Scholar] [CrossRef] [PubMed]
- Younossi, Z.M.; Jarrar, M.; Nugent, C.; Randhawa, M.; Afendy, M.; Stepanova, M.; Rafiq, N.; Goodman, Z.; Chandhoke, V.; Baranova, A. A novel diagnostic biomarker panel for obesity-related nonalcoholic steatohepatitis (NASH). Obes. Surg. 2008, 18, 1430–1437. [Google Scholar] [CrossRef] [PubMed]
- Shen, J.; Chan, H.L.; Wong, G.L.; Choi, P.C.; Chan, A.W.; Chan, H.Y.; Chim, A.M.; Yeung, D.K.; Chan, F.K.; Woo, J.; et al. Non-invasive diagnosis of non-alcoholic steatohepatitis by combined serum biomarkers. J. Hepatol. 2012, 56, 1363–1370. [Google Scholar] [CrossRef]
- Fitzpatrick, E.; Dhawan, A. Noninvasive biomarkers in non-alcoholic fatty liver disease: Current status and a glimpse of the future. World J. Gastroenterol. 2014, 20, 10851–10863. [Google Scholar] [CrossRef]
- Ajmera, V.; Perito, E.R.; Bass, N.M.; Terrault, N.A.; Yates, K.P.; Gill, R.; Loomba, R.; Diehl, A.M.; Aouizerat, B.E.; Network, N.C.R. Novel plasma biomarkers associated with liver disease severity in adults with nonalcoholic fatty liver disease. Hepatology 2017, 65, 65–77. [Google Scholar] [CrossRef]
- Feldstein, A.E.; Lopez, R.; Tamimi, T.A.; Yerian, L.; Chung, Y.M.; Berk, M.; Zhang, R.; McIntyre, T.M.; Hazen, S.L. Mass spectrometric profiling of oxidized lipid products in human nonalcoholic fatty liver disease and nonalcoholic steatohepatitis. J. Lipid Res. 2010, 51, 3046–3054. [Google Scholar] [CrossRef] [Green Version]
- Ferslew, B.C.; Xie, G.; Johnston, C.K.; Su, M.; Stewart, P.W.; Jia, W.; Brouwer, K.L.; Barritt, A.S.T. Altered Bile Acid Metabolome in Patients with Nonalcoholic Steatohepatitis. Dig. Dis. Sci. 2015, 60, 3318–3328. [Google Scholar] [CrossRef] [Green Version]
- Smits, L.P.; Coolen, B.F.; Panno, M.D.; Runge, J.H.; Nijhof, W.H.; Verheij, J.; Nieuwdorp, M.; Stoker, J.; Beuers, U.H.; Nederveen, A.J.; et al. Noninvasive Differentiation between Hepatic Steatosis and Steatohepatitis with MR Imaging Enhanced with USPIOs in Patients with Nonalcoholic Fatty Liver Disease: A Proof-of-Concept Study. Radiology 2016, 278, 782–791. [Google Scholar] [CrossRef]
- Abrigo, J.M.; Shen, J.; Wong, V.W.; Yeung, D.K.; Wong, G.L.; Chim, A.M.; Chan, A.W.; Choi, P.C.; Chan, F.K.; Chan, H.L.; et al. Non-alcoholic fatty liver disease: Spectral patterns observed from an in vivo phosphorus magnetic resonance spectroscopy study. J. Hepatol. 2014, 60, 809–815. [Google Scholar] [CrossRef] [PubMed]
- Chen, J.; Talwalkar, J.A.; Yin, M.; Glaser, K.J.; Sanderson, S.O.; Ehman, R.L. Early detection of nonalcoholic steatohepatitis in patients with nonalcoholic fatty liver disease by using MR elastography. Radiology 2011, 259, 749–756. [Google Scholar] [CrossRef] [PubMed] [Green Version]
- Dixon, J.B.; Bhathal, P.S.; O’Brien, P.E. Nonalcoholic fatty liver disease: Predictors of nonalcoholic steatohepatitis and liver fibrosis in the severely obese. Gastroenterology 2001, 121, 91–100. [Google Scholar] [CrossRef]
- Angulo, P.; Keach, J.C.; Batts, K.P.; Lindor, K.D. Independent predictors of liver fibrosis in patients with nonalcoholic steatohepatitis. Hepatology 1999, 30, 1356–1362. [Google Scholar] [CrossRef] [PubMed]
- Ratziu, V.; Giral, P.; Charlotte, F.; Bruckert, E.; Thibault, V.; Theodorou, I.; Khalil, L.; Turpin, G.; Opolon, P.; Poynard, T. Liver fibrosis in overweight patients. Gastroenterology 2000, 118, 1117–1123. [Google Scholar] [CrossRef] [PubMed]
- Angulo, P. Long-term mortality in nonalcoholic fatty liver disease: Is liver histology of any prognostic significance? Hepatology 2010, 51, 373–375. [Google Scholar] [CrossRef] [PubMed] [Green Version]
- Sheth, S.G.; Flamm, S.L.; Gordon, F.D.; Chopra, S. AST/ALT ratio predicts cirrhosis in patients with chronic hepatitis C virus infection. Am. J. Gastroenterol. 1998, 93, 44–48. [Google Scholar] [CrossRef]
- Shaheen, A.A.; Myers, R.P. Diagnostic accuracy of the aspartate aminotransferase-to-platelet ratio index for the prediction of hepatitis C-related fibrosis: A systematic review. Hepatology 2007, 46, 912–921. [Google Scholar] [CrossRef] [PubMed]
- Shah, A.G.; Lydecker, A.; Murray, K.; Tetri, B.N.; Contos, M.J.; Sanyal, A.J.; Nash Clinical Research Network. Comparison of noninvasive markers of fibrosis in patients with nonalcoholic fatty liver disease. Clin. Gastroenterol. Hepatol. 2009, 7, 1104–1112. [Google Scholar] [CrossRef] [Green Version]
- McPherson, S.; Stewart, S.F.; Henderson, E.; Burt, A.D.; Day, C.P. Simple non-invasive fibrosis scoring systems can reliably exclude advanced fibrosis in patients with non-alcoholic fatty liver disease. Gut 2010, 59, 1265–1269. [Google Scholar] [CrossRef] [PubMed] [Green Version]
- Sterling, R.K.; Lissen, E.; Clumeck, N.; Sola, R.; Correa, M.C.; Montaner, J.; Sulkowski, M.S.; Torriani, F.J.; Dieterich, D.T.; Thomas, D.L.; et al. Development of a simple noninvasive index to predict significant fibrosis in patients with HIV/HCV coinfection. Hepatology 2006, 43, 1317–1325. [Google Scholar] [CrossRef]
- Angulo, P.; Hui, J.M.; Marchesini, G.; Bugianesi, E.; George, J.; Farrell, G.C.; Enders, F.; Saksena, S.; Burt, A.D.; Bida, J.P.; et al. The NAFLD fibrosis score: A noninvasive system that identifies liver fibrosis in patients with NAFLD. Hepatology 2007, 45, 846–854. [Google Scholar] [CrossRef] [PubMed]
- Musso, G.; Gambino, R.; Cassader, M.; Pagano, G. Meta-analysis: Natural history of non-alcoholic fatty liver disease (NAFLD) and diagnostic accuracy of non-invasive tests for liver disease severity. Ann. Med. 2011, 43, 617–649. [Google Scholar] [CrossRef] [PubMed]
- Gudowska, M.; Gruszewska, E.; Panasiuk, A.; Cylwik, B.; Flisiak, R.; Swiderska, M.; Szmitkowski, M.; Chrostek, L. Hyaluronic acid concentration in liver diseases. Clin. Exp. Med. 2016, 16, 523–528. [Google Scholar] [CrossRef] [Green Version]
- Suzuki, A.; Angulo, P.; Lymp, J.; Li, D.; Satomura, S.; Lindor, K. Hyaluronic acid, an accurate serum marker for severe hepatic fibrosis in patients with non-alcoholic fatty liver disease. Liver Int. 2005, 25, 779–786. [Google Scholar] [CrossRef]
- Monarca, A.; Petrini, C.; Perolini, S.; Pozzi, F.; Adelasco, L.; Natangelo, R.; Croce, G. Procollagen-type III peptide serum concentrations in alcoholic and non-alcoholic liver disease. Ric. Clin. Lab. 1985, 15, 167–171. [Google Scholar] [CrossRef] [PubMed]
- Nielsen, M.J.; Nedergaard, A.F.; Sun, S.; Veidal, S.S.; Larsen, L.; Zheng, Q.; Suetta, C.; Henriksen, K.; Christiansen, C.; Karsdal, M.A.; et al. The neo-epitope specific PRO-C3 ELISA measures true formation of type III collagen associated with liver and muscle parameters. Am. J. Transl. Res. 2013, 5, 303–315. [Google Scholar]
- Leeming, D.J.; Grove, J.I.; Kaye, P.; Hoad, C.; Francis, S.; Nielsen, M.J.; Karsdal, M.A.; Guha, I.N.; Aithal, G.P. Estimation of serum “true collagen type III formation” (Pro-C3) levels as a marker of non-alcoholic steatohepatitis in a prospective cohort. J. Hepatol. 2017, 1 (Suppl. S1), S154. [Google Scholar]
- Hemmann, S.; Graf, J.; Roderfeld, M.; Roeb, E. Expression of MMPs and TIMPs in liver fibrosis—A systematic review with special emphasis on anti-fibrotic strategies. J. Hepatol. 2007, 46, 955–975. [Google Scholar] [CrossRef] [PubMed]
- Abdelaziz, R.; Elbasel, M.; Esmat, S.; Essam, K.; Abdelaaty, S. Tissue Inhibitors of Metalloproteinase-1 and 2 and Obesity Related Non-Alcoholic Fatty Liver Disease: Is There a Relationship. Digestion 2015, 92, 130–137. [Google Scholar] [CrossRef]
- Santos, V.N.; Leite-Mor, M.M.; Kondo, M.; Martins, J.R.; Nader, H.; Lanzoni, V.P.; Parise, E.R. Serum laminin, type IV collagen and hyaluronan as fibrosis markers in non-alcoholic fatty liver disease. Braz. J. Med. Biol. Res. 2005, 38, 747–753. [Google Scholar] [CrossRef] [Green Version]
- Guha, I.N.; Parkes, J.; Roderick, P.; Chattopadhyay, D.; Cross, R.; Harris, S.; Kaye, P.; Burt, A.D.; Ryder, S.D.; Aithal, G.P.; et al. Noninvasive markers of fibrosis in nonalcoholic fatty liver disease: Validating the European Liver Fibrosis Panel and exploring simple markers. Hepatology 2008, 47, 455–460. [Google Scholar] [CrossRef]
- Nobili, V.; Parkes, J.; Bottazzo, G.; Marcellini, M.; Cross, R.; Newman, D.; Vizzutti, F.; Pinzani, M.; Rosenberg, W.M. Performance of ELF serum markers in predicting fibrosis stage in pediatric non-alcoholic fatty liver disease. Gastroenterology 2009, 136, 160–167. [Google Scholar] [CrossRef] [PubMed]
- Boursier, J.; de Ledinghen, V.; Leroy, V.; Anty, R.; Francque, S.; Salmon, D.; Lannes, A.; Bertrais, S.; Oberti, F.; Fouchard-Hubert, I.; et al. A stepwise algorithm using an at-a-glance first-line test for the non-invasive diagnosis of advanced liver fibrosis and cirrhosis. J. Hepatol. 2017, 66, 1158–1165. [Google Scholar] [CrossRef] [PubMed]
- Loong, T.C.; Wei, J.L.; Leung, J.C.; Wong, G.L.; Shu, S.S.; Chim, A.M.; Chan, A.W.; Choi, P.C.; Tse, Y.K.; Chan, H.L.; et al. Application of the combined FibroMeter vibration-controlled transient elastography algorithm in Chinese patients with non-alcoholic fatty liver disease. J. Gastroenterol. Hepatol. 2017, 32, 1363–1369. [Google Scholar] [CrossRef]
- Boursier, J.; Vergniol, J.; Guillet, A.; Hiriart, J.B.; Lannes, A.; Le Bail, B.; Michalak, S.; Chermak, F.; Bertrais, S.; Foucher, J.; et al. Diagnostic accuracy and prognostic significance of blood fibrosis tests and liver stiffness measurement by FibroScan in non-alcoholic fatty liver disease. J. Hepatol. 2016, 65, 570–578. [Google Scholar] [CrossRef] [PubMed]
- Wilder, J.; Patel, K. The clinical utility of FibroScan((R)) as a noninvasive diagnostic test for liver disease. Med. Devices 2014, 7, 107–114. [Google Scholar] [CrossRef] [Green Version]
- Bonder, A.; Tapper, E.B.; Afdhal, N.H. Contemporary assessment of hepatic fibrosis. Clin. Liver Dis. 2015, 19, 123–134. [Google Scholar] [CrossRef]
- Xiao, G.; Zhu, S.; Xiao, X.; Yan, L.; Yang, J.; Wu, G. Comparison of laboratory tests, ultrasound, or magnetic resonance elastography to detect fibrosis in patients with nonalcoholic fatty liver disease: A meta-analysis. Hepatology 2017, 66, 1486–1501. [Google Scholar] [CrossRef]
- Cassinotto, C.; Boursier, J.; de Ledinghen, V.; Lebigot, J.; Lapuyade, B.; Cales, P.; Hiriart, J.B.; Michalak, S.; Bail, B.L.; Cartier, V.; et al. Liver stiffness in nonalcoholic fatty liver disease: A comparison of supersonic shear imaging, FibroScan, and ARFI with liver biopsy. Hepatology 2016, 63, 1817–1827. [Google Scholar] [CrossRef] [PubMed]
- Venkatesh, S.K.; Wang, G.; Teo, L.L.; Ang, B.W. Magnetic resonance elastography of liver in healthy Asians: Normal liver stiffness quantification and reproducibility assessment. J. Magn. Reson. Imaging 2014, 39, 1–8. [Google Scholar] [CrossRef] [PubMed]
- Lee, Y.; Lee, J.M.; Lee, J.E.; Lee, K.B.; Lee, E.S.; Yoon, J.H.; Yu, M.H.; Baek, J.H.; Shin, C.I.; Han, J.K.; et al. MR elastography for noninvasive assessment of hepatic fibrosis: Reproducibility of the examination and reproducibility and repeatability of the liver stiffness value measurement. J. Magn. Reson. Imaging 2014, 39, 326–331. [Google Scholar] [CrossRef] [PubMed]
- Singh, S.; Venkatesh, S.K.; Wang, Z.; Miller, F.H.; Motosugi, U.; Low, R.N.; Hassanein, T.; Asbach, P.; Godfrey, E.M.; Yin, M.; et al. Diagnostic performance of magnetic resonance elastography in staging liver fibrosis: A systematic review and meta-analysis of individual participant data. Clin. Gastroenterol. Hepatol. 2015, 13, 440–451.e6. [Google Scholar] [CrossRef] [PubMed] [Green Version]
- Imajo, K.; Kessoku, T.; Honda, Y.; Tomeno, W.; Ogawa, Y.; Mawatari, H.; Fujita, K.; Yoneda, M.; Taguri, M.; Hyogo, H.; et al. Magnetic Resonance Imaging More Accurately Classifies Steatosis and Fibrosis in Patients With Nonalcoholic Fatty Liver Disease Than Transient Elastography. Gastroenterology 2016, 150, 626–637.e7. [Google Scholar] [CrossRef] [Green Version]
- Drag, M.H.; Kilpelainen, T.O. Cell-free DNA and RNA-measurement and applications in clinical diagnostics with focus on metabolic disorders. Physiol. Genomics 2021, 53, 33–46. [Google Scholar] [CrossRef]
- Di Mauro, S.; Scamporrino, A.; Fruciano, M.; Filippello, A.; Fagone, E.; Gili, E.; Scionti, F.; Purrazzo, G.; Di Pino, A.; Scicali, R.; et al. Circulating Coding and Long Non-Coding RNAs as Potential Biomarkers of Idiopathic Pulmonary Fibrosis. Int. J. Mol. Sci. 2020, 21, 8812. [Google Scholar] [CrossRef]
- Scicali, R.; Di Pino, A.; Pavanello, C.; Ossoli, A.; Strazzella, A.; Alberti, A.; Di Mauro, S.; Scamporrino, A.; Urbano, F.; Filippello, A.; et al. Analysis of HDL-microRNA panel in heterozygous familial hypercholesterolemia subjects with LDL receptor null or defective mutation. Sci. Rep. 2019, 9, 20354. [Google Scholar] [CrossRef] [PubMed] [Green Version]
- Barbagallo, C.; Di Martino, M.T.; Grasso, M.; Salluzzo, M.G.; Scionti, F.; Cosentino, F.I.I.; Caruso, G.; Barbagallo, D.; Di Pietro, C.; Ferri, R.; et al. Uncharacterized RNAs in Plasma of Alzheimer’s Patients Are Associated with Cognitive Impairment and Show a Potential Diagnostic Power. Int. J. Mol. Sci. 2020, 21, 7644. [Google Scholar] [CrossRef]
- Happel, C.; Ganguly, A.; Tagle, D.A. Extracellular RNAs as potential biomarkers for cancer. J. Cancer Metastasis Treat 2020, 6, 32. [Google Scholar] [CrossRef]
- Zhu, H.; Fan, G.C. Extracellular/circulating microRNAs and their potential role in cardiovascular disease. Am. J. Cardiovasc Dis. 2011, 1, 138–149. [Google Scholar]
- Pos, O.; Biro, O.; Szemes, T.; Nagy, B. Circulating cell-free nucleic acids: Characteristics and applications. Eur. J. Hum. Genet. 2018, 26, 937–945. [Google Scholar] [CrossRef] [PubMed] [Green Version]
- Turchinovich, A.; Baranova, A.; Drapkina, O.; Tonevitsky, A. Cell-Free Circulating Nucleic Acids as Early Biomarkers for NAFLD and NAFLD-Associated Disorders. Front. Physiol. 2018, 9, 1256. [Google Scholar] [CrossRef] [PubMed] [Green Version]
- Velu, V.K.; Ramesh, R.; Srinivasan, A.R. Circulating MicroRNAs as Biomarkers in Health and Disease. J. Clin. Diagn. Res. 2012, 6, 1791–1795. [Google Scholar] [CrossRef] [PubMed]
- Akuta, N.; Kawamura, Y.; Suzuki, F.; Saitoh, S.; Arase, Y.; Fujiyama, S.; Sezaki, H.; Hosaka, T.; Kobayashi, M.; Suzuki, Y.; et al. Analysis of association between circulating miR-122 and histopathological features of nonalcoholic fatty liver disease in patients free of hepatocellular carcinoma. BMC Gastroenterol. 2016, 16, 141. [Google Scholar] [CrossRef] [Green Version]
- Sun, C.; Huang, F.; Liu, X.; Xiao, X.; Yang, M.; Hu, G.; Liu, H.; Liao, L. miR-21 regulates triglyceride and cholesterol metabolism in non-alcoholic fatty liver disease by targeting HMGCR. Int. J. Mol. Med. 2015, 35, 847–853. [Google Scholar] [CrossRef] [Green Version]
- Yamada, H.; Suzuki, K.; Ichino, N.; Ando, Y.; Sawada, A.; Osakabe, K.; Sugimoto, K.; Ohashi, K.; Teradaira, R.; Inoue, T.; et al. Associations between circulating microRNAs (miR-21, miR-34a, miR-122 and miR-451) and non-alcoholic fatty liver. Clin. Chim. Acta 2013, 424, 99–103. [Google Scholar] [CrossRef] [PubMed]
- Tan, Y.; Ge, G.; Pan, T.; Wen, D.; Gan, J. A pilot study of serum microRNAs panel as potential biomarkers for diagnosis of nonalcoholic fatty liver disease. PLoS ONE 2014, 9, e105192. [Google Scholar] [CrossRef] [Green Version]
- Raitoharju, E.; Seppala, I.; Lyytikainen, L.P.; Viikari, J.; Ala-Korpela, M.; Soininen, P.; Kangas, A.J.; Waldenberger, M.; Klopp, N.; Illig, T.; et al. Blood hsa-miR-122-5p and hsa-miR-885-5p levels associate with fatty liver and related lipoprotein metabolism-The Young Finns Study. Sci. Rep. 2016, 6, 38262. [Google Scholar] [CrossRef]
- Celikbilek, M.; Baskol, M.; Taheri, S.; Deniz, K.; Dogan, S.; Zararsiz, G.; Gursoy, S.; Guven, K.; Ozbakir, O.; Dundar, M.; et al. Circulating microRNAs in patients with non-alcoholic fatty liver disease. World J. Hepatol. 2014, 6, 613–620. [Google Scholar] [CrossRef] [PubMed]
- Jampoka, K.; Muangpaisarn, P.; Khongnomnan, K.; Treeprasertsuk, S.; Tangkijvanich, P.; Payungporn, S. Serum miR-29a and miR-122 as Potential Biomarkers for Non-Alcoholic Fatty Liver Disease (NAFLD). Microrna 2018, 7, 215–222. [Google Scholar] [CrossRef] [PubMed]
- Yu, F.; Wang, X.; Zhao, H.; Hao, Y.; Wang, W. Decreased Serum miR-1296 may Serve as an Early Biomarker for the Diagnosis of Non-Alcoholic Fatty Liver Disease. Clin. Lab. 2019, 65. [Google Scholar] [CrossRef]
- He, Z.; Yang, J.J.; Zhang, R.; Li, H.T.; Wu, L.; Jiang, F.; Jia, W.P.; Hu, C. Circulating miR-29b positively correlates with non-alcoholic fatty liver disease in a Chinese population. J. Dig. Dis. 2019, 20, 189–195. [Google Scholar] [CrossRef]
- Zong, Y.; Yan, J.; Jin, L.; Xu, B.; He, Z.; Zhang, R.; Hu, C.; Jia, W. Relationship between circulating miR-132 and non-alcoholic fatty liver disease in a Chinese population. Hereditas 2020, 157, 22. [Google Scholar] [CrossRef] [PubMed]
- Jiang, H.; Qian, Y.; Shen, Z.; Liu, Y.; He, Y.; Gao, R.; Shen, M.; Chen, S.; Fu, Q.; Yang, T. Circulating microRNA135a3p in serum extracellular vesicles as a potential biological marker of nonalcoholic fatty liver disease. Mol. Med. Rep. 2021, 24, 1–12. [Google Scholar] [CrossRef]
- Di Mauro, S.; Salomone, F.; Scamporrino, A.; Filippello, A.; Morisco, F.; Guido, M.; Lembo, V.; Cossiga, V.; Pipitone, R.M.; Piro, S.; et al. Coffee Restores Expression of lncRNAs Involved in Steatosis and Fibrosis in a Mouse Model of NAFLD. Nutrients 2021, 13, 2952. [Google Scholar] [CrossRef]
- Zhang, M.; Chi, X.; Qu, N.; Wang, C. Long noncoding RNA lncARSR promotes hepatic lipogenesis via Akt/SREBP-1c pathway and contributes to the pathogenesis of nonalcoholic steatohepatitis. Biochem. Biophys. Res. Commun. 2018, 499, 66–70. [Google Scholar] [CrossRef]
- Cocucci, E.; Meldolesi, J. Ectosomes and exosomes: Shedding the confusion between extracellular vesicles. Trends Cell Biol. 2015, 25, 364–372. [Google Scholar] [CrossRef] [PubMed]
- Kornek, M.; Lynch, M.; Mehta, S.H.; Lai, M.; Exley, M.; Afdhal, N.H.; Schuppan, D. Circulating microparticles as disease-specific biomarkers of severity of inflammation in patients with hepatitis C or nonalcoholic steatohepatitis. Gastroenterology 2012, 143, 448–458. [Google Scholar] [CrossRef] [PubMed] [Green Version]
- Povero, D.; Yamashita, H.; Ren, W.; Subramanian, M.G.; Myers, R.P.; Eguchi, A.; Simonetto, D.A.; Goodman, Z.D.; Harrison, S.A.; Sanyal, A.J.; et al. Characterization and Proteome of Circulating Extracellular Vesicles as Potential Biomarkers for NASH. Hepatol. Commun. 2020, 4, 1263–1278. [Google Scholar] [CrossRef] [PubMed]
- Cermelli, S.; Ruggieri, A.; Marrero, J.A.; Ioannou, G.N.; Beretta, L. Circulating microRNAs in patients with chronic hepatitis C and non-alcoholic fatty liver disease. PLoS ONE 2011, 6, e23937. [Google Scholar] [CrossRef] [Green Version]
- Pirola, C.J.; Fernandez Gianotti, T.; Castano, G.O.; Mallardi, P.; San Martino, J.; Mora Gonzalez Lopez Ledesma, M.; Flichman, D.; Mirshahi, F.; Sanyal, A.J.; Sookoian, S. Circulating microRNA signature in non-alcoholic fatty liver disease: From serum non-coding RNAs to liver histology and disease pathogenesis. Gut 2015, 64, 800–812. [Google Scholar] [CrossRef] [PubMed] [Green Version]
- Becker, P.P.; Rau, M.; Schmitt, J.; Malsch, C.; Hammer, C.; Bantel, H.; Mullhaupt, B.; Geier, A. Performance of Serum microRNAs -122, -192 and -21 as Biomarkers in Patients with Non-Alcoholic Steatohepatitis. PLoS ONE 2015, 10, e0142661. [Google Scholar] [CrossRef]
- Liu, X.L.; Pan, Q.; Zhang, R.N.; Shen, F.; Yan, S.Y.; Sun, C.; Xu, Z.J.; Chen, Y.W.; Fan, J.G. Disease-specific miR-34a as diagnostic marker of non-alcoholic steatohepatitis in a Chinese population. World J. Gastroenterol. 2016, 22, 9844–9852. [Google Scholar] [CrossRef] [PubMed]
- Lopez-Riera, M.; Conde, I.; Quintas, G.; Pedrola, L.; Zaragoza, A.; Perez-Rojas, J.; Salcedo, M.; Benlloch, S.; Castell, J.V.; Jover, R. Non-invasive prediction of NAFLD severity: A comprehensive, independent validation of previously postulated serum microRNA biomarkers. Sci. Rep. 2018, 8, 10606. [Google Scholar] [CrossRef]
- Park, J.G.; Kim, G.; Jang, S.Y.; Lee, Y.R.; Lee, E.; Lee, H.W.; Han, M.H.; Chun, J.M.; Han, Y.S.; Yoon, J.S.; et al. Plasma Long Noncoding RNA LeXis is a Potential Diagnostic Marker for Non-Alcoholic Steatohepatitis. Life 2020, 10, 230. [Google Scholar] [CrossRef]
- Di Mauro, S.; Scamporrino, A.; Petta, S.; Urbano, F.; Filippello, A.; Ragusa, M.; Di Martino, M.T.; Scionti, F.; Grimaudo, S.; Pipitone, R.M.; et al. Serum coding and non-coding RNAs as biomarkers of NAFLD and fibrosis severity. Liver Int. 2019, 39, 1742–1754. [Google Scholar] [CrossRef] [PubMed] [Green Version]
- Sun, C.; Fan, J.G.; Qiao, L. Potential epigenetic mechanism in non-alcoholic Fatty liver disease. Int. J. Mol. Sci. 2015, 16, 5161–5179. [Google Scholar] [CrossRef]
- Miyaaki, H.; Ichikawa, T.; Kamo, Y.; Taura, N.; Honda, T.; Shibata, H.; Milazzo, M.; Fornari, F.; Gramantieri, L.; Bolondi, L.; et al. Significance of serum and hepatic microRNA-122 levels in patients with non-alcoholic fatty liver disease. Liver Int. 2014, 34, e302–e307. [Google Scholar] [CrossRef] [PubMed]
- Yu, F.; Zheng, J.; Mao, Y.; Dong, P.; Li, G.; Lu, Z.; Guo, C.; Liu, Z.; Fan, X. Long non-coding RNA APTR promotes the activation of hepatic stellate cells and the progression of liver fibrosis. Biochem. Biophys. Res. Commun. 2015, 463, 679–685. [Google Scholar] [CrossRef] [PubMed]
- Han, M.H.; Lee, J.H.; Kim, G.; Lee, E.; Lee, Y.R.; Jang, S.Y.; Lee, H.W.; Chun, J.M.; Han, Y.S.; Yoon, J.S.; et al. Expression of the Long Noncoding RNA GAS5 Correlates with Liver Fibrosis in Patients with Nonalcoholic Fatty Liver Disease. Genes 2020, 11, 545. [Google Scholar] [CrossRef]
- Estes, C.; Razavi, H.; Loomba, R.; Younossi, Z.; Sanyal, A.J. Modeling the epidemic of nonalcoholic fatty liver disease demonstrates an exponential increase in burden of disease. Hepatology 2018, 67, 123–133. [Google Scholar] [CrossRef] [PubMed]


Publisher’s Note: MDPI stays neutral with regard to jurisdictional claims in published maps and institutional affiliations. |
© 2021 by the authors. Licensee MDPI, Basel, Switzerland. This article is an open access article distributed under the terms and conditions of the Creative Commons Attribution (CC BY) license (https://creativecommons.org/licenses/by/4.0/).
Share and Cite
Di Mauro, S.; Scamporrino, A.; Filippello, A.; Di Pino, A.; Scicali, R.; Malaguarnera, R.; Purrello, F.; Piro, S. Clinical and Molecular Biomarkers for Diagnosis and Staging of NAFLD. Int. J. Mol. Sci. 2021, 22, 11905. https://0-doi-org.brum.beds.ac.uk/10.3390/ijms222111905
Di Mauro S, Scamporrino A, Filippello A, Di Pino A, Scicali R, Malaguarnera R, Purrello F, Piro S. Clinical and Molecular Biomarkers for Diagnosis and Staging of NAFLD. International Journal of Molecular Sciences. 2021; 22(21):11905. https://0-doi-org.brum.beds.ac.uk/10.3390/ijms222111905
Chicago/Turabian StyleDi Mauro, Stefania, Alessandra Scamporrino, Agnese Filippello, Antonino Di Pino, Roberto Scicali, Roberta Malaguarnera, Francesco Purrello, and Salvatore Piro. 2021. "Clinical and Molecular Biomarkers for Diagnosis and Staging of NAFLD" International Journal of Molecular Sciences 22, no. 21: 11905. https://0-doi-org.brum.beds.ac.uk/10.3390/ijms222111905