Article

Impaired Innate Immunity in Pediatric Patients Type 1 Diabetes—Focus on Toll-like Receptors Expression

by
Katarzyna Kurianowicz
1,
Maria Klatka
1,
Agnieszka Polak
2,
Anna Hymos
3,
Dominika Bębnowska
4,
Martyna Podgajna
5,
Rafał Hrynkiewicz
4,
Olga Sierawska
4 and
Paulina Niedźwiedzka-Rystwej
4,*
1
Department of Pediatric Endocrinology and Diabetology, Medical University of Lublin, Gębali 1 St., 20-093 Lublin, Poland
2
Department of Endocrinology, Medical University of Lublin, Jaczewskiego 8 St., 20-954 Lublin, Poland
3
Department of Experimental Immunology, Medical University of Lublin, Chodźki 4a St., 20-093 Lublin, Poland
4
Institute of Biology, University of Szczecin, 71-412 Szczecin, Poland
5
Department of Clinica Immunology and Immunotherapy, Medical University of Lublin, Chodźki 4a St., 20-093 Lublin, Poland
*
Author to whom correspondence should be addressed.
Int. J. Mol. Sci. 2021, 22(22), 12135; https://0-doi-org.brum.beds.ac.uk/10.3390/ijms222212135
Submission received: 23 September 2021 / Revised: 23 October 2021 / Accepted: 27 October 2021 / Published: 9 November 2021

Abstract

:
Type 1 diabetes (DM1) is classified as an autoimmune disease. An uncontrolled response of B and T lymphocytes to the body’s own tissues develops in the absence of immune tolerance. The main aim of the study was to evaluate the effect of the duration of type 1 diabetes in children on the expression of TLR receptors and the relationship with the parameters of glycemic control in patients. As a result, we showed significant differences in the level of TLR2, TLR4 and TLR9 expression in patients with DM1 in the early stage of the disease and treated chronically compared to the healthy group. Additionally, in this study, we found that the numbers of CD19+ B cells, CD3+ CD4+, CD3+ CD8+ T cells and NK cells are different for newly diagnosed DM1 individuals, patients receiving chronic treatment and for healthy controls, indicating an important role of these cells in killing pancreatic beta cells. Moreover, higher levels of IL-10 in patients with newly diagnosed DM1 have also been found, confirming the reports found in the literature.

1. Introduction

Diabetes mellitus is one of the most common chronic metabolic diseases. The United Nations recognized that it is the first and only non-communicable disease to be the epidemic of the 21st century [1]. The term “diabetes” as defined by the American Diabetes Association (ADA) is a group of metabolic diseases characterized by chronic hyperglycemia resulting from disturbances in insulin secretion and/or function. Insufficient insulin secretion and/or reduced tissue response to insulin impairs its action in target tissues, which affects the metabolism of carbohydrates, lipids, and proteins [2].
Type 1 diabetes mellitus (DM 1) is one of the most common chronic metabolic diseases in the population under the age of 18. According to the 2017 report by the International Diabetes Federation (IDF), the number of children up to 14 years old diagnosed with type 1 diabetes has reached almost 586,000 [3]. Incidence reaches 3% of the child population. It has been estimated that approximately 96,000 new cases of diabetes are revealed annually [3,4]. Type 1 diabetes is caused by the destruction of the β-cells of the pancreas, which leads to an absolute insulin deficiency. The principles of diagnosing diabetes are based on the assessment of blood glucose levels and the presence of characteristic clinical symptoms [2,5]. Common symptoms of diabetes include polyuria, increased thirst (polydipsia) and weight loss. This triad may be associated with bedwetting (nocturia), involuntary urination, weakness, behavioral changes, candidiasis in the external urinary tract, increased appetite, and blurred vision. Hyperglycaemia leads to ketoacidosis or, less commonly, non-keto hyperosmolar syndrome, followed by stupor or coma. Untreated diabetes leads to death [5]. Type 1 diabetes mellitus is a multifactorial disease, but its etiopathogenesis is not fully understood. According to the currently adopted model of the pathogenesis of type 1 diabetes, proposed in 1986 by George Eisenbarth, the development of the disease requires the interaction of three components: genetic predisposition, environmental factors and the immune system [6,7]. Considering the prevalence of diabetes and its serious consequences, we believe that any research that brings us closer to increasing our knowledge of each of these aspects can be very valuable both for improving the treatment and quality of life of patients.
The autoimmune disorders in DM1 are triggered by an impaired immune response. Toll-like receptors (TLRs) are receptors classified as pattern recognition receptors (PRR). TLR receptors combine non-specific immunity with specific immunity. By recognizing molecular patterns associated with pathogens, they initiate a non-specific immune response. Moreover, they enable cells of the immune system to distinguish self and foreign antigens [8]. TLRs are expressed particularly on the surface of antigen-presenting cells—dendritic cells, macrophages, B lymphocytes, and also on the surface of CD4+, CD8+ T cells and CD4+ CD25+ FoxP3+ regulatory T cells [9,10]. TLRs play a dual role in modulating the immune response. On the one hand, they enhance innate and adaptive defense mechanisms against pathogens, while on the other hand, they are involved in the autoimmune destruction of β-cells in DM1 by T cells. It has been suggested that manipulating TLR signaling may protect against DM1 [11]. CD4+ CD25+ FoxP3+ (Treg) T cells play a major role in regulating the inflammatory response within the pancreatic islets [12]. Their role is to maintain the balance between inflammatory cytokines and tolerance to own tissues. Reducing the proportion of these populations or disrupting their function is one of the key factors in the pathogenesis of type 1 diabetes [13,14,15,16].
Activation of appropriate signaling pathways involving TLR receptors in predisposed individuals may reduce the likelihood of developing diabetes in the future. Assessing TLRs can be the key in preventing uncontrolled inflammation and reducing disease progression. The main aim of this study was to assess the effect of the duration of type 1 diabetes in children on the expression of TLR receptors and the relationship with the parameters of glycemic control in patients. Additionally, we assessed the concentrations of IFN-γ, IL-2, IL-4 and IL-10 in the plasma of individuals with type 1 diabetes and healthy group.

2. Results

The characteristics of the study and the control Group Ire presented in Table 1. Group I—patients with newly diagnosed type 1 diabetes (<3 months from diagnosis), group II—patients with chronic type 1 diabetes (>3 months from diagnosis).

2.1. Assessment of the Subpopulation of Peripheral Blood Lymphocytes in the Study and Control Group

The percentage and absolute values of CD3+ T cells in the peripheral blood of patients with type 1 diabetes and in the control group were analyzed. The results are presented in Table 1.
The conducted analysis showed a significantly higher percentage (p = 0.009) and a higher number (p = 0.036) of CD3+ T cells in the group of children with type 1 diabetes compared to the control group. There was a significantly higher percentage (p = 0.016) and higher number (p = 0.019) of CD3+ T cells in the newly diagnosed diabetic group (<3 months from diagnosis) than in the control group. It was also found that the percentage of CD3+ T cells in the peripheral blood of patients suffering from type 1 diabetes for more than 3 months was higher than the percentage of these cells in the control group (p = 0.042).
The results showing the percentage and absolute values of CD19+ B cells in the peripheral blood of patients with type 1 diabetes and in the control group are provided in Table 1.
The conducted analysis showed a significantly higher number (p = 0.015) of CD19+ B lymphocytes in the group of children with type 1 diabetes than in the control group. There was a significantly higher percentage (p = 0.016) and higher number (p = 0.003) of CD19+ B lymphocytes in the group of patients with newly diagnosed diabetes (<3 months from diagnosis) than in the control group. There was a higher percentage (p = 0.019) and a higher number (p = 0.019) of CD19+ B cells in children with type 1 diabetes for less than 3 months compared to chronic DM1 patients.
The percentage and absolute values of CD3+ CD4+ T cells in the peripheral blood of patients with type 1 diabetes and in the control Group Ire presented in Table 1.
There was a statistically significantly higher percentage (p = 0.038) and a higher number (p = 0.028) of CD3+ CD4+ T cells in the group with type 1 diabetes than in the control group. There was a significantly higher number (p = 0.022) of CD3+ CD4+ T cells in the group of patients with newly diagnosed diabetes (<3 months from diagnosis) than in the control group.
The percentage and absolute values of CD3+ CD8+ T cells in patients with type 1 diabetes and in the control group are presented in Table 1.
The analysis showed a significantly higher number (p = 0.038) of CD3+ CD8+ T cells in the group of children with type 1 diabetes than in healthy subjects. There was a significantly higher percentage (p = 0.015) and higher number (p = 0.015) of CD3+ CD8+ T cells in the group of patients with newly diagnosed type 1 diabetes than in the control group.
The assessment of the relationship between the ratio of CD3+ CD4+ lymphocytes to CD3+ CD8+ in the studied groups did not show any statistically significant differences (Table 1).
The absolute values and the percentage of NK cells in children with type 1 diabetes and in the control group are presented in Table 1.
The percentage of NK cells in the DM1 group was statistically significantly lower than in the control group (p = 0.007).
There was a significantly lower percentage (p < 0.001) and a lower number (p = 0.035) of NK cells in the group with DM1 lasting less than 3 months than in the control group. There was also an increase in the percentage (p = 0.001) and the number (p = 0.041) of NK cells in patients with long-term diabetes mellitus type 1 compared to the group with newly diagnosed DM1.

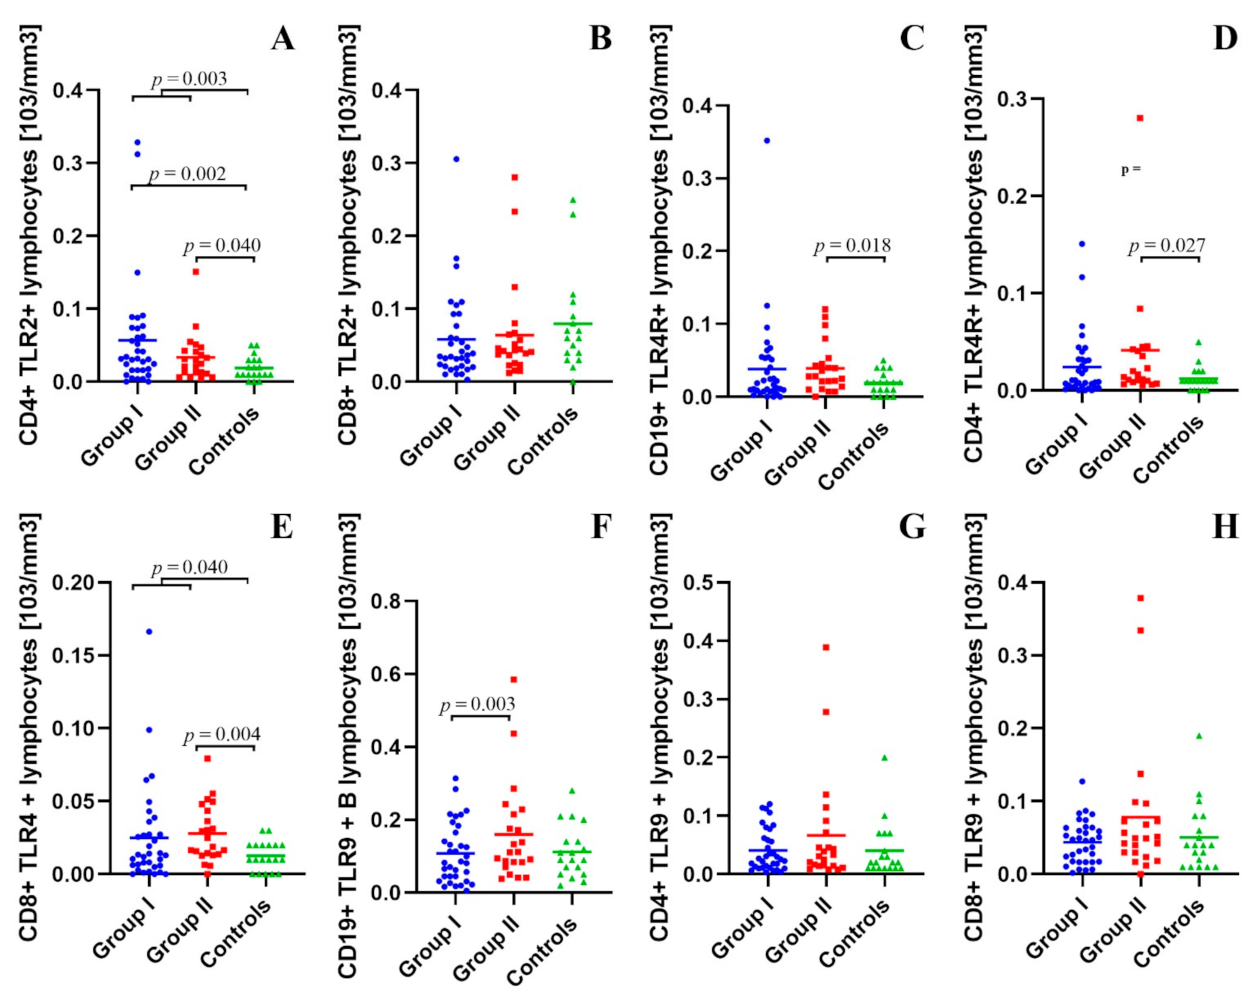
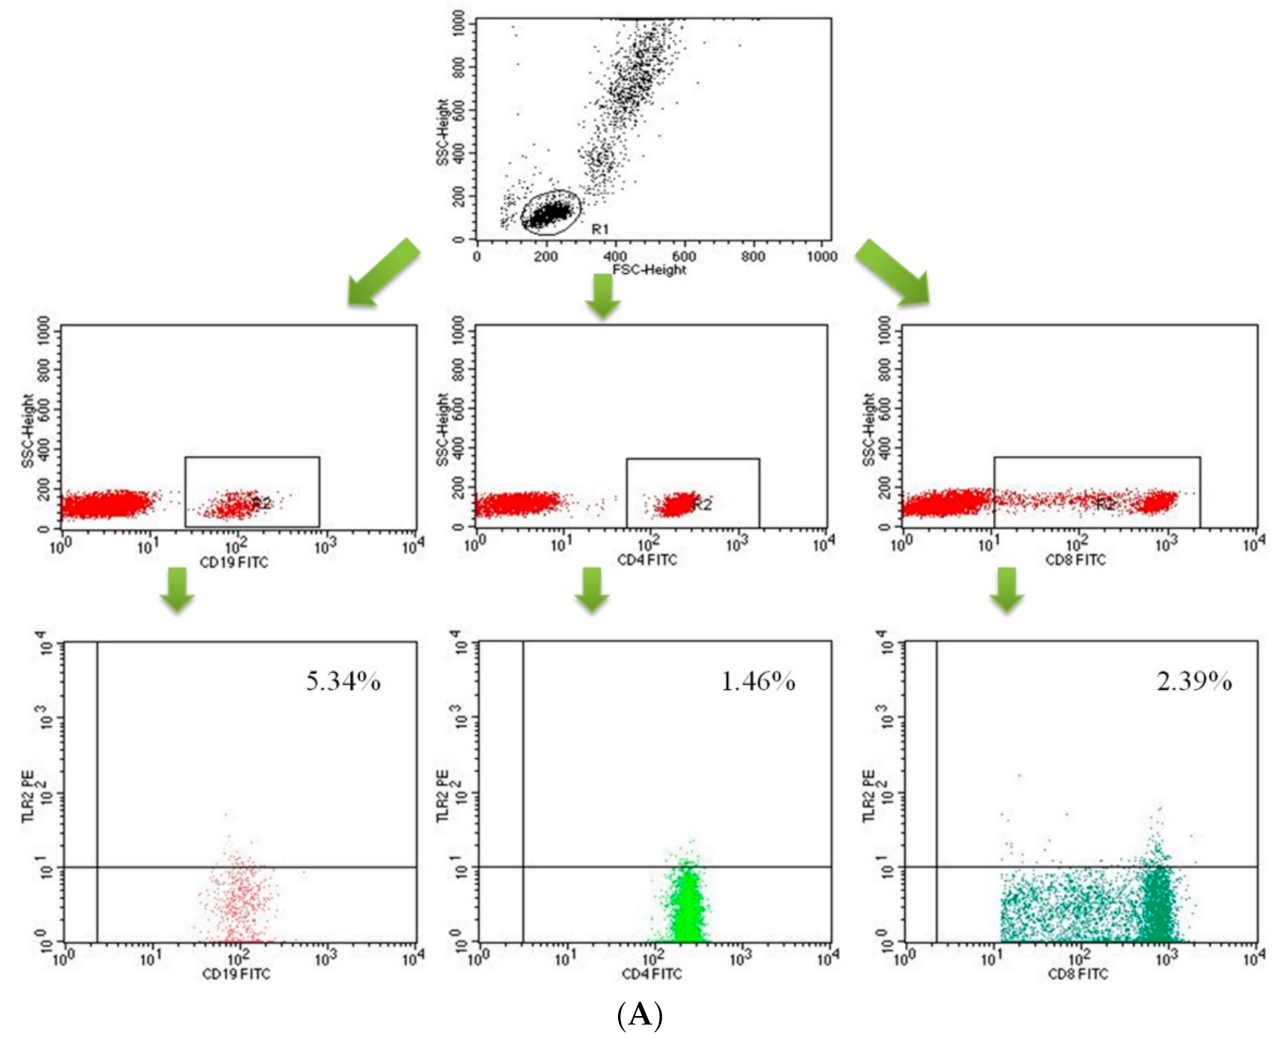
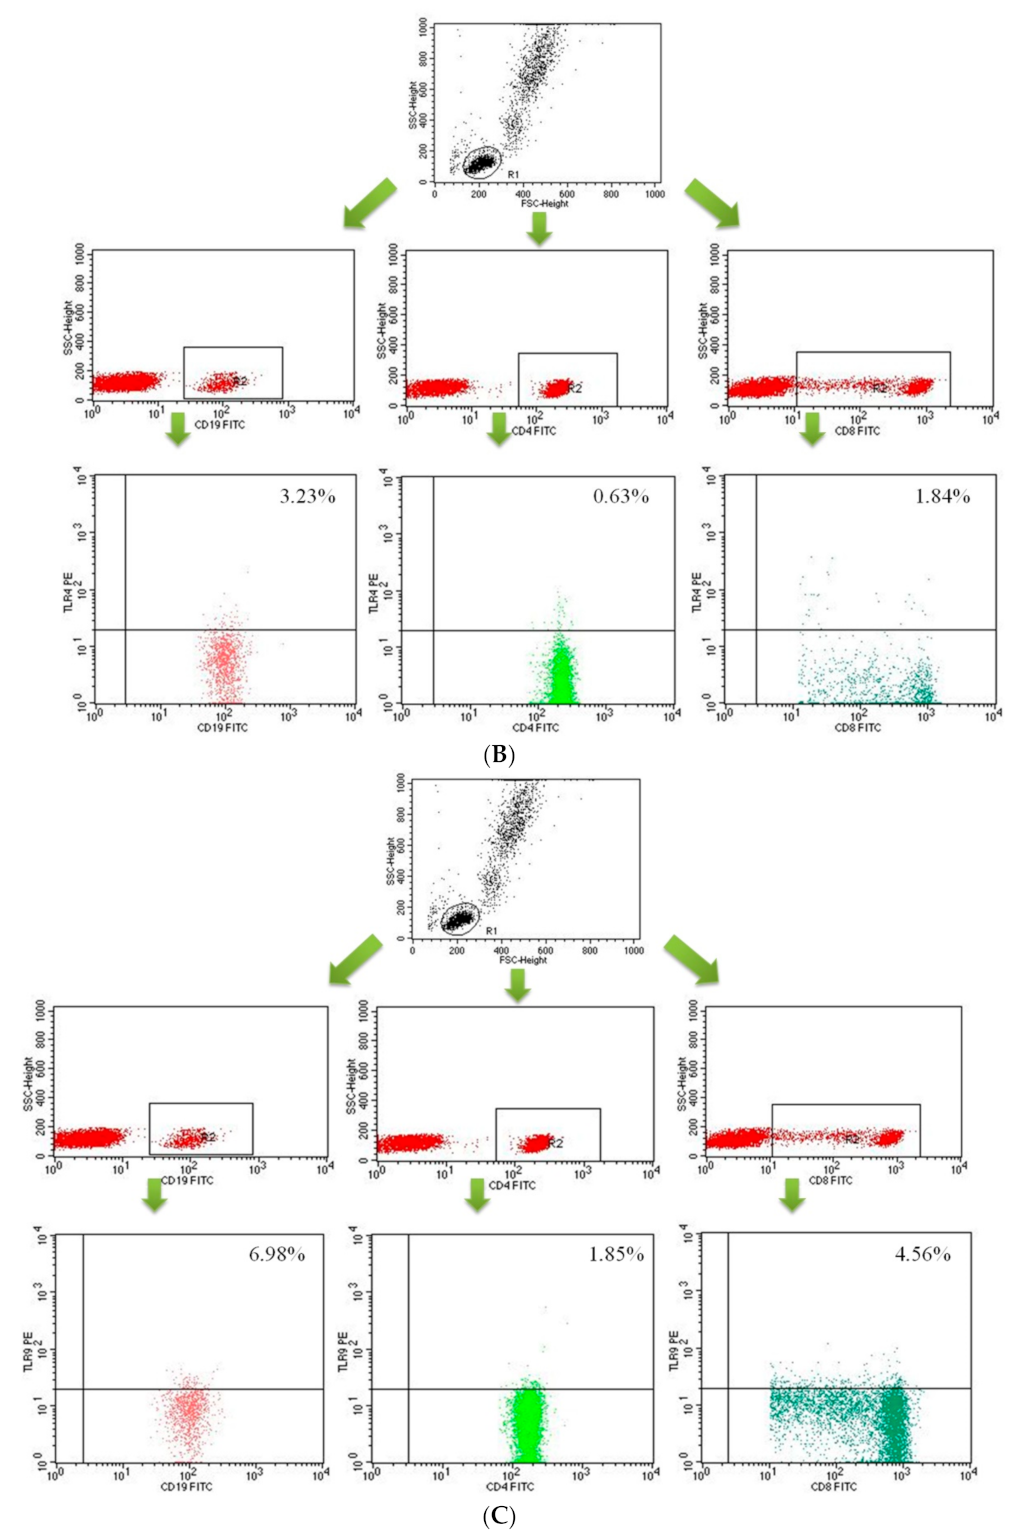
2.2. Assessment of B CD19+, T CD4+ and T CD8+ Lymphocytes with TLR2, TLR4, TLR9 Expression in the Study and Control Groups

The detailed results of the assessment of B CD19+, T CD4+ and T CD8+ lymphocytes with TLR2, TLR4, TLR9 expression in the study and control groups with statistical analysis are presented in Supplementary Table S1.
There were no statistically significant differences between the study group and the control group, as well as between both study groups in the percentage and the number of CD19+ B cells with TLR2 expression in the peripheral blood.
It was shown that the percentage (p = 0.018) and the number (p = 0.003) of lymphocytes with the CD4+ TLR2+ phenotype in the peripheral blood of patients with type 1 diabetes mellitus were higher than in the control group. The percentage (p = 0.010) and number (p = 0.002) of CD4+ TLR2+ T cells in patients with newly diagnosed type 1 diabetes mellitus were higher compared to the control group. The number (p = 0.040) of CD4+ TLR2+ T cells in children with long-term type 1 diabetes mellitus was higher than in the control group (Figure 1A).
The conducted analysis showed that the percentage of CD8+ TLR2+ lymphocytes in the peripheral blood of children with type 1 diabetes was lower than in the control group (p = 0.026). The percentage of CD8+ TLR2+ lymphocytes in the group with DM1 < 3 months was statistically significantly lower than in the control group (p = 0.025). Those differences were not visible when we compared the absolute values of those cells (Figure 1B).
In children with type 1 diabetes for more than 3 months, the percentage (p = 0.021) and number (p = 0.018) of CD19+ TLR4+ B cells were higher than in healthy subjects (Figure 1C).
The number of lymphocytes with the CD4+ TLR4+ phenotype in the peripheral blood of children with chronic DM1 patients was higher than in the control group (p = 0.027) (Figure 1D).
It was shown that the number of cells with the CD8+ TLR4+ phenotype in the peripheral blood of children suffering from DM1 compared to the number of these cells in the control group was statistically significantly higher (p = 0.040). It was found that the percentage (p = 0.006) and the number (p = 0.004) of CD8+ TLR4+ T cells in the peripheral blood of patients with DM1 for more than 3 months compared to the percentage of these cells in the control group were statistically significantly higher (Figure 1F). It was also found that the percentage of CD8+ TLR4+ T lymphocytes in the group of children suffering from DM1 below 3 months compared to children suffering from DM1 for more than 3 months was statistically significantly lower (p = 0.035).
The percentage of CD19+ B cells expressing TLR9 in the group with newly diagnosed type 1 diabetes mellitus compared to the control group was significantly lower (p = 0.004). The percentage (p = 0.001) and the number (p = 0.003) of CD19+ TLR9+ B cells in the group of children suffering from DM1 below 3 months were statistically significantly lower than in children suffering from DM1 for over 3 months (Figure 1F).
There were no statistically significant differences in the percentage and number of CD4+ T cells with TLR9 expression between the studied groups (Figure 1G).
It was found that the percentage of CD8+ TLR9+ T cells in children with type 1 diabetes less than 3 months was lower compared to the control group (p = 0.040). The percentage of CD8+ TLR9+ T cells in the group of children with newly diagnosed type 1 diabetes mellitus was lower than in children with long-term type 1 diabetes (p = 0.016). Those differences did not show the statistical power in absolute values (Figure 1H).

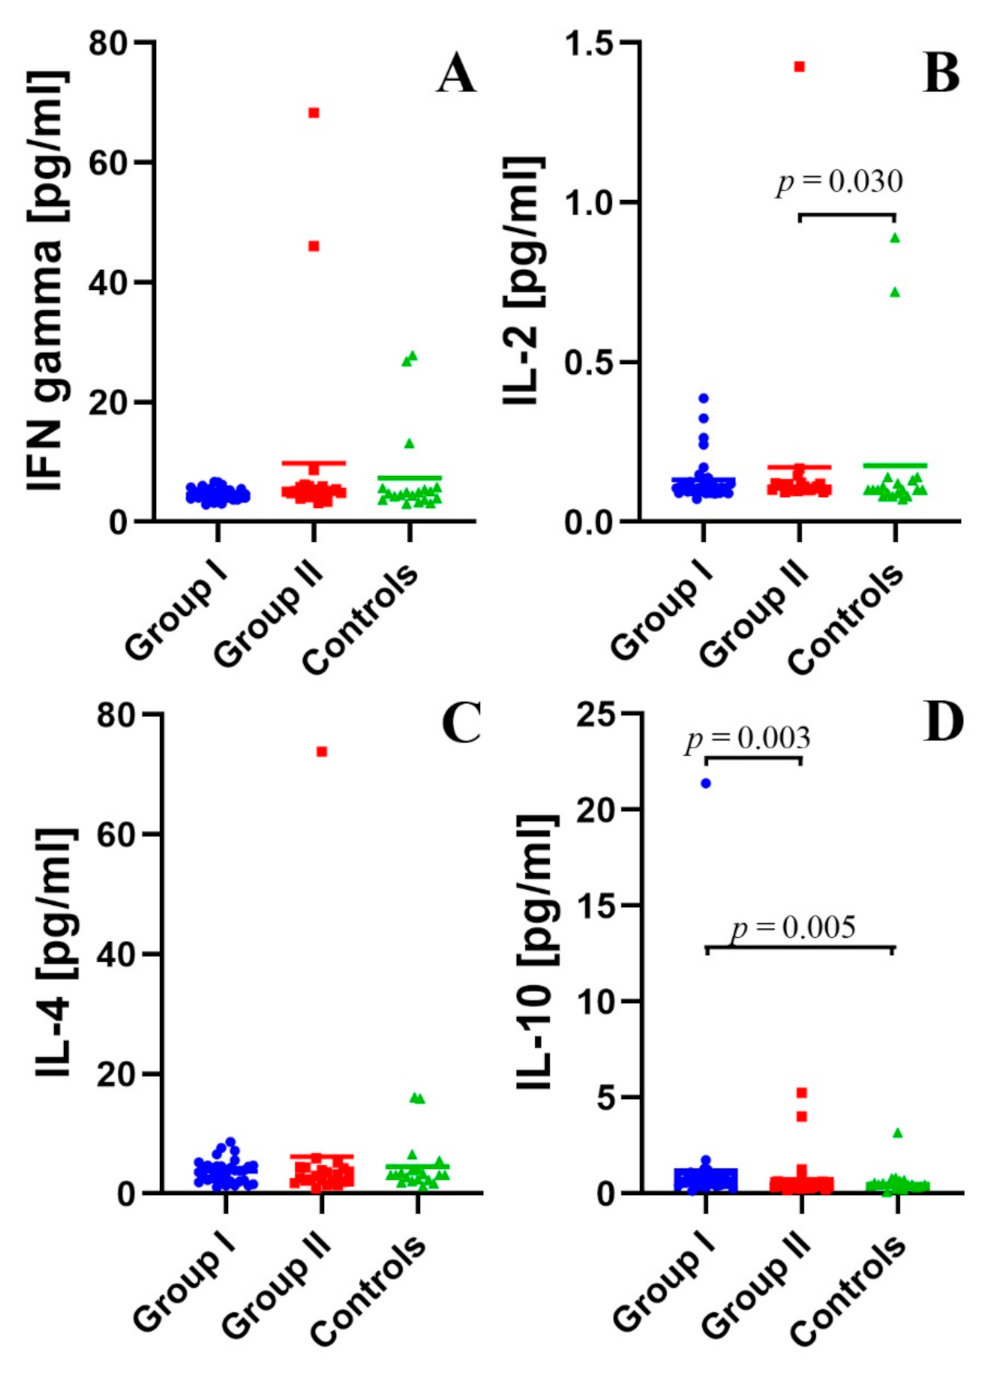
2.3. Assessment of the Concentration of IFN-γ, IL-2, IL-4, and IL-10 in the Peripheral Blood Plasma in the Study and Control Groups

The detailed results of the assessment of the concentration of IFN-γ, IL-2, IL-4, and IL-10 in the peripheral blood plasma in the study and control groups with statistical analysis are presented in Supplementary Table S2.
There were no statistically significant differences in IFN-γ concentrations between the group of subjects with type 1 diabetes and healthy subjects. There were also no statistically significant differences in the concentration of IFN-γ in the peripheral blood plasma in the group of children with type 1 diabetes with different duration of the disease (Figure 2A).
It was found that the concentration of IL-2 in children with long duration type 1 diabetes was higher than in healthy subjects (p = 0.030, Figure 2B).
There were no statistically significant differences between the study group and the control group, as well as between patients with type 1 diabetes of various duration in the concentration of IL-4 (Figure 2C).
The analysis showed that the concentration of IL-10 in the peripheral blood plasma in children suffering from DM1 below 3 months, compared to the concentration of these cytokines in the control group, was statistically significantly higher (p = 0.005). The concentration of IL-10 in the peripheral blood plasma of patients suffering from DM1 for less than 3 months compared to patients suffering from DM1 more than 3 months was higher (p = 0.003) (Figure 2D).

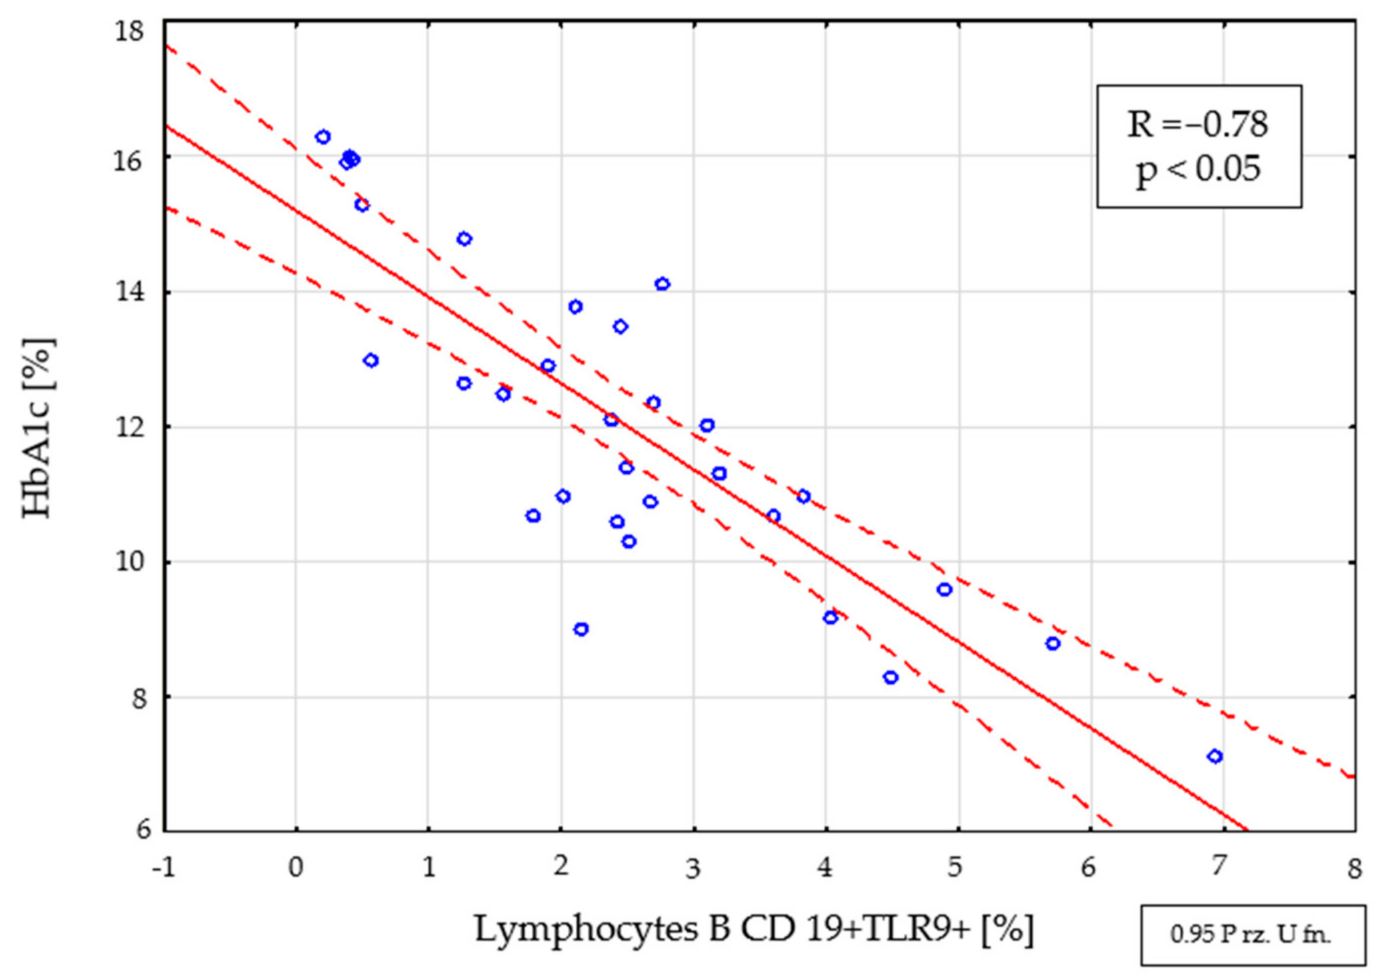
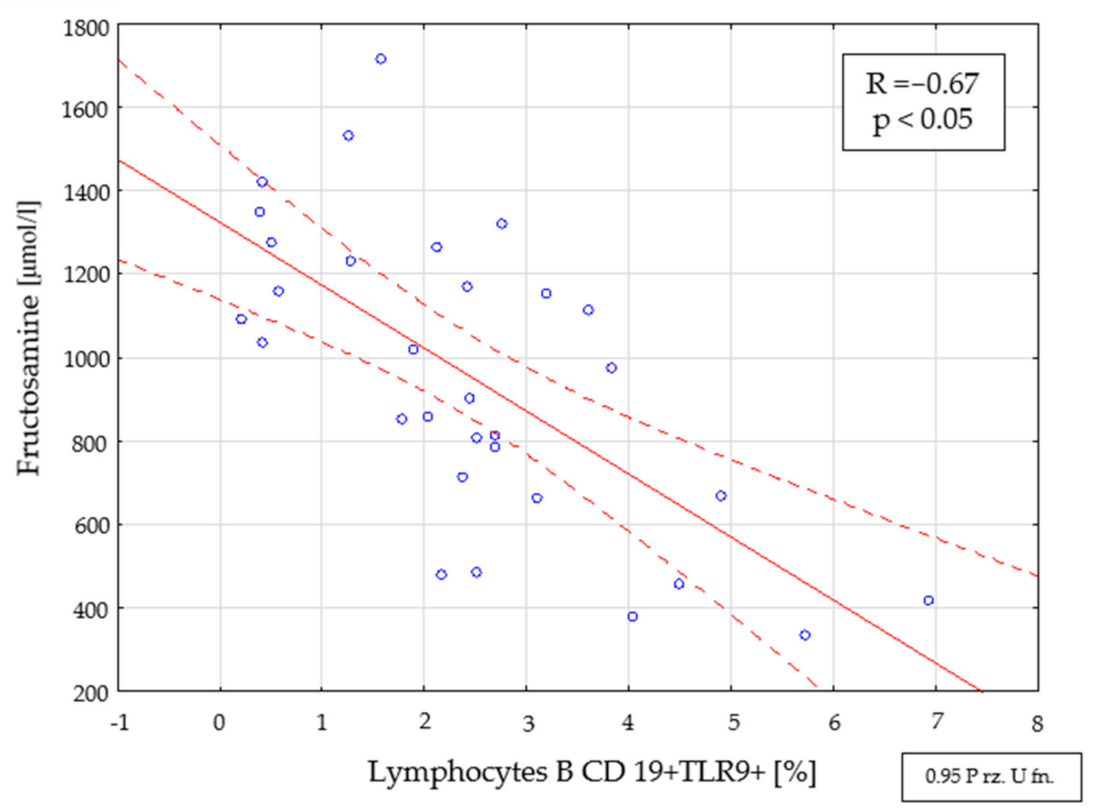
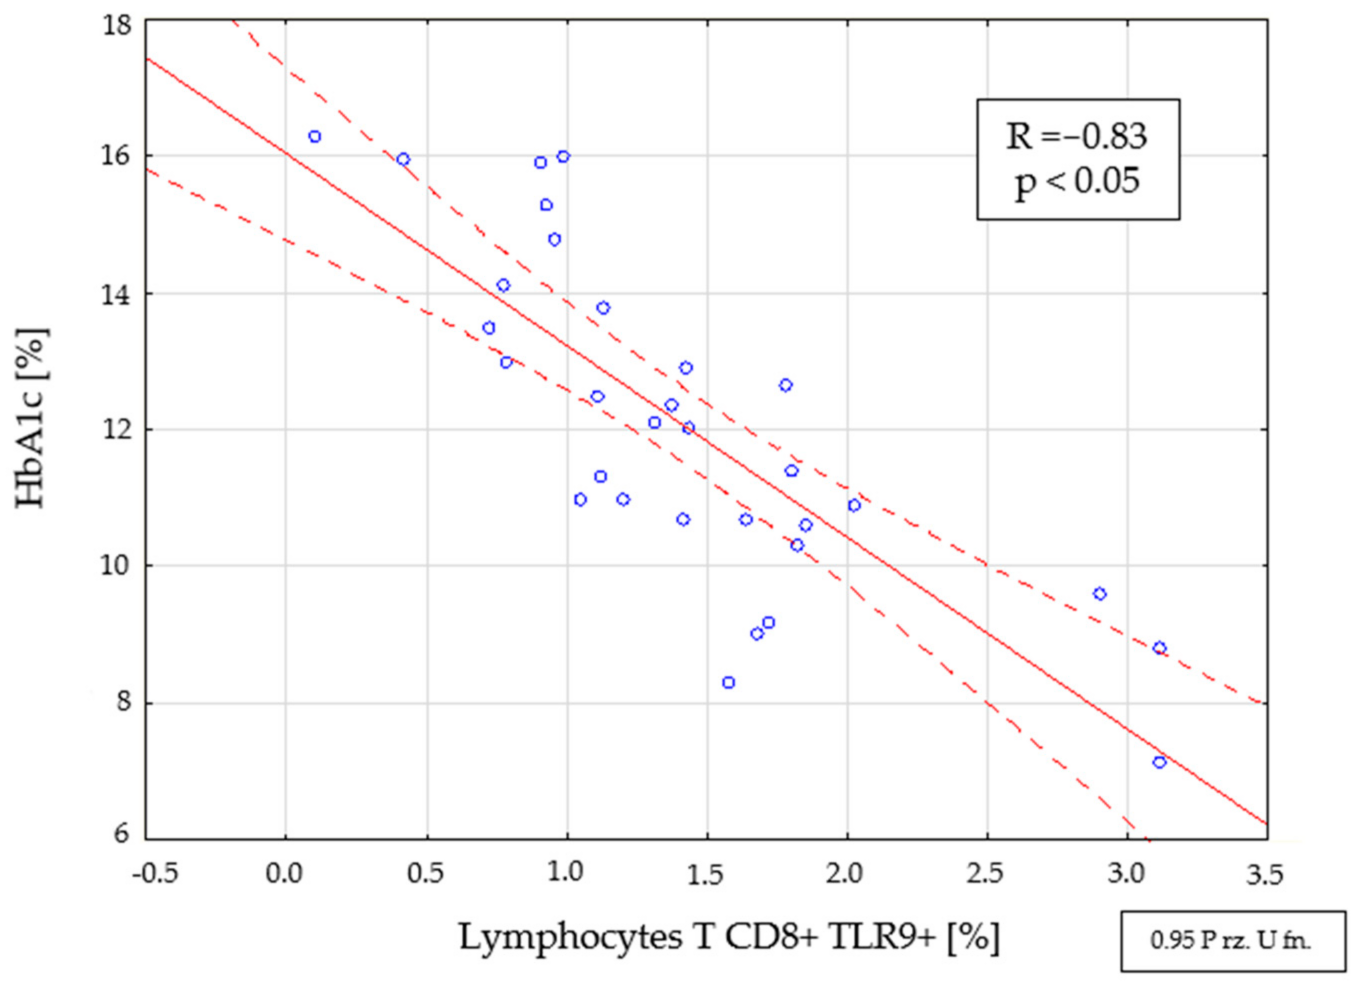
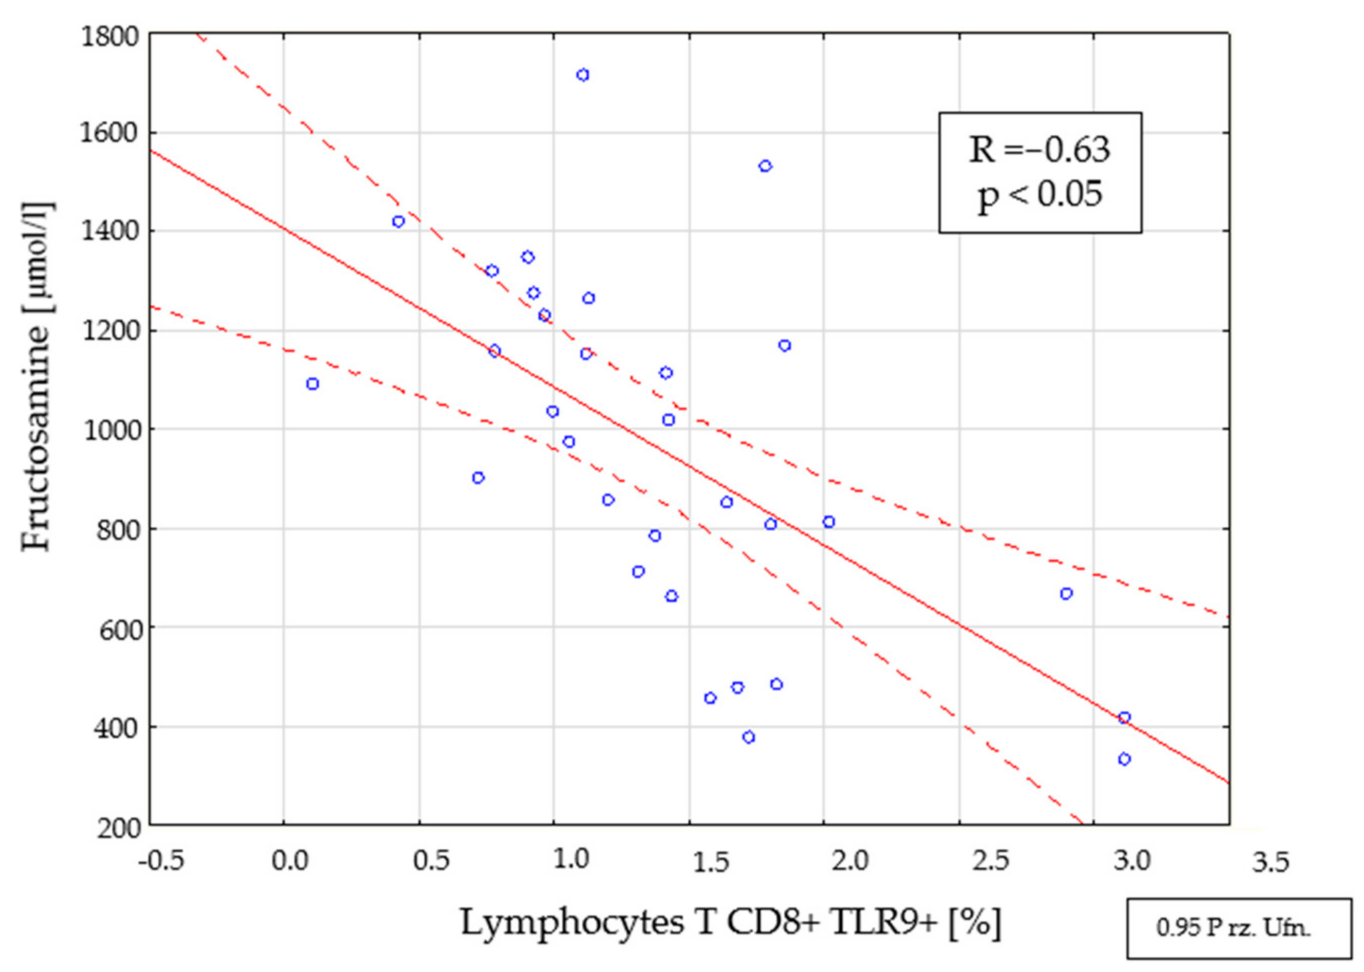
2.4. Assessment of Interdependencies between the Investigated Immunological and Clinical Parameters in the Study Group

The performed analysis showed a negative correlation of the percentage (R = −0.78; p < 0.05) (Figure 3) and the number (R = −0.69, p < 0.05) of CD19+ TLR9+ B cells with the level of glycated hemoglobin in a group of patients with newly diagnosed type 1 diabetes.
Statistically significant relationships were also found between the percentage (R = −0.67; p < 0.05) (Figure 4) and the number (R = −0.53, p < 0.05) of CD19+ TLR9+ B cells and the level of fructosamine in a group of patients with newly diagnosed type 1 diabetes.
There was a negative correlation between the percentage (R = −0.83, p < 0.05) (Figure 5) and the number (R = 0.67, p < 0.05) of CD8+ TLR9+ T cells with the level of glycosylated hemoglobin in people with DM1 of short duration (<3 months from diagnosis).
There was also a relationship between the percentage (R = −0.63, p < 0.05) (Figure 6) and the number (R = −0.51, p < 0.05) of CD8+ TLR9+ T cells and the level of fructosamine in the tested group (<3 months from diagnosis).

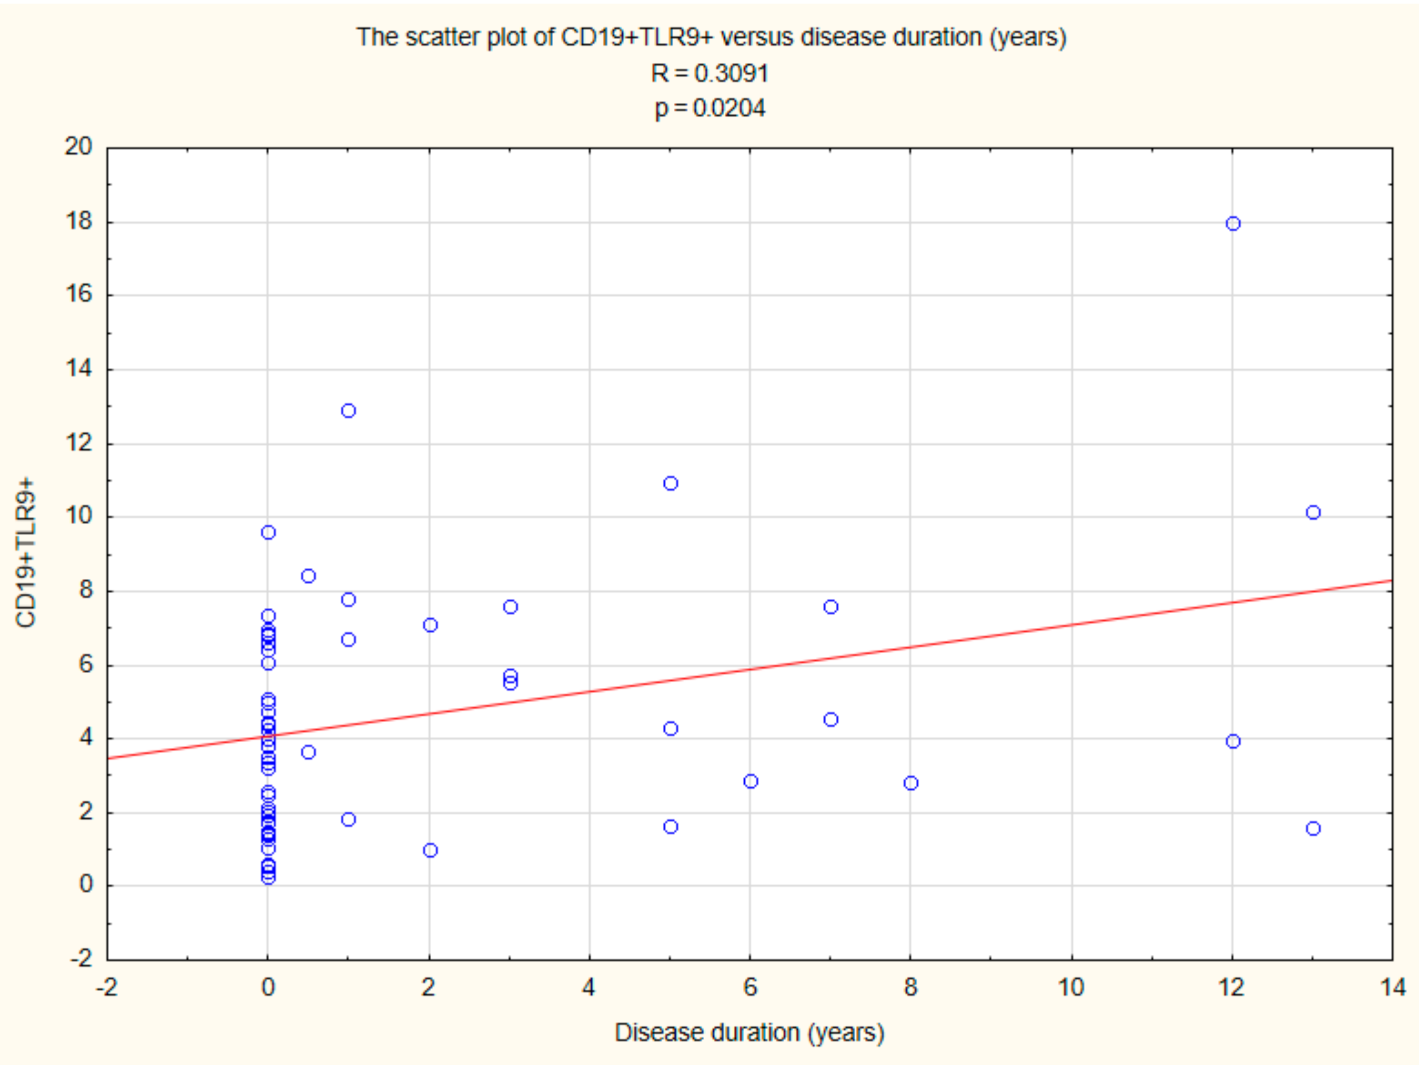
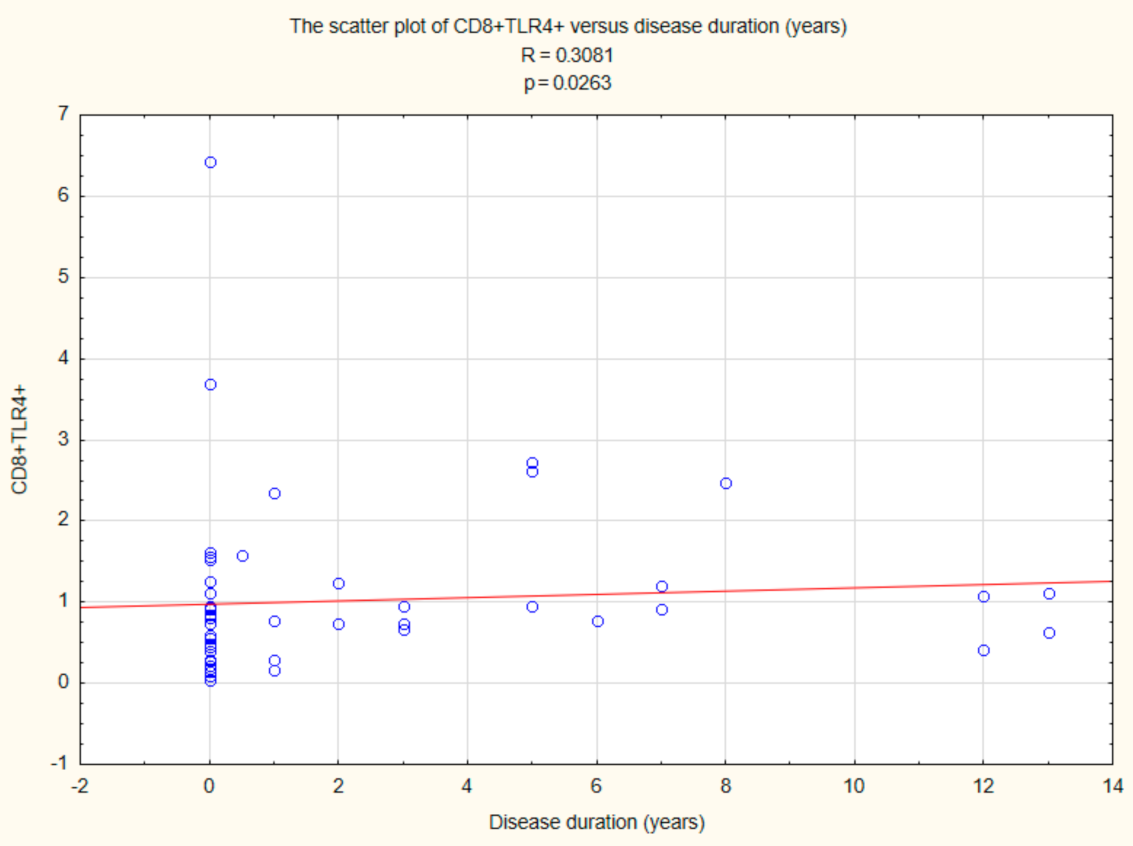
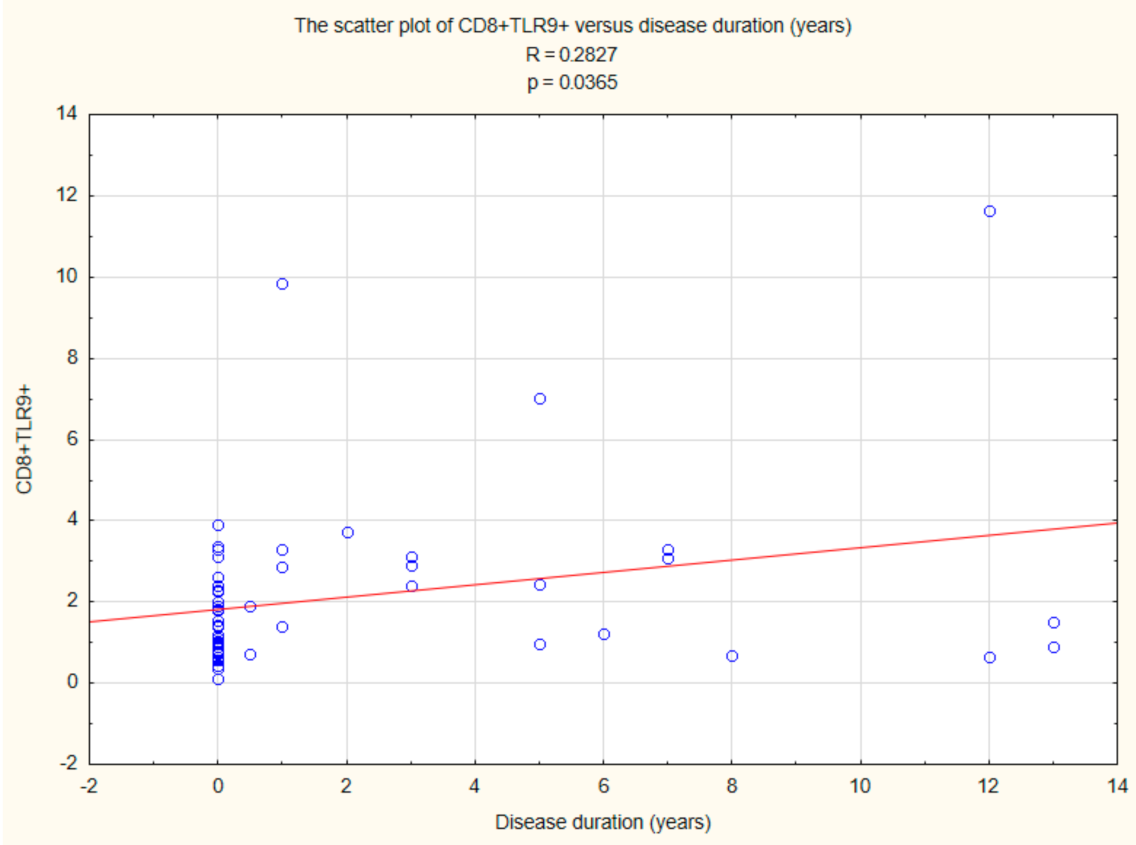
2.5. Assessment of the Relationships between B CD19+, T CD4+, and T CD8+ Lymphocytes with TLR2, TLR4, TLR9 Expression, and Duration Time after the Onset of DM1

The performed analysis showed a correlation between CD19+ TLR9+ B cells (R = 0.3091, p < 0.05) and duration time after the onset of DM1 (Figure 7).
There was also a relationship between CD8+ TLR4+ T cells (R = 0.3081, p < 0.05) and duration time after the onset of DM1 (Figure 8).
Statistically significant relationships were also found between CD8+ TLR9+ T cells (R = 0.2827, p < 0.05) and duration time after the onset of DM1 (Figure 9).

3. Discussion

The uncontrolled response of B and T lymphocytes towards the body’s own tissues develops in the absence of immune tolerance. The mechanisms responsible for the autoimmunological process include the activation of antigen-presenting cells, which promote the enhancement of autoantigen-presentation, and molecular mimicry [17]. It has been suggested that TLRs may also play an important role in the development of autoimmune diseases [18]. Inappropriate activation of receptors by endogenous and exogenous ligands and the influence of TLR-dependent pathways on Treg function contribute to the development of these diseases [17].
In this study, the percentage and number of selected lymphocytes expressing TLR2, TLR4, and TLR9 receptors in children with type 1 diabetes mellitus were assessed. The study group was divided into patients with newly diagnosed DM1, i.e., those who were diagnosed in previous 3 months and in patients suffering from chronic diabetes (>3 months). The conducted research showed significant differences in both groups and in comparison with the control group. A significantly lower percentage of CD19+ B lymphocytes (p = 0.004) and CD8+ T lymphocytes (p = 0.040) with TLR9 expression were found in the group of patients with newly diagnosed diabetes as compared to the control group. The obtained results may confirm the reports of Nündel et al. [19] on the participation of the TLR9 receptor in autoimmune diseases. There was a higher percentage of CD4+ TLR2+ lymphocytes (p = 0.010) and a significantly lower percentage of CD8+ TLR2+ lymphocytes (p = 0.025). In the group of patients treated for more than 3 months, a higher percentage of CD19+ TLR4+ lymphocytes (p = 0.021) and CD8+ TLR4+ T cells (p = 0.006) and a higher number of CD4+ TLR2+ T cells (p = 0.040) and CD4+ TLR4+ were found. (p = 0.027). The presented results are consistent with the reports of Devaraj et al. [20,21], in which a much higher expression of these receptors was found, and an increase in their ligands was observed.
A comparative assessment of the percentage and number of lymphocytes expressing TLR receptors between the groups of patients was also performed. A significantly lower percentage of CD19+ TLR9+ B cells (p <0.001) and CD8+ TLR9+ T cells (p = 0.016) was demonstrated in patients with newly diagnosed diabetes. In the group of subjects with type 1 diabetes (<3 months from diagnosis), a negative correlation was found between the percentage and the number of B lymphocytes with the CD19+ TLR9+ phenotype, as well as the percentage and the number of T lymphocytes with the CD8+ TLR9+ phenotype with HbA1c and the concentration of fructosamine. The results of the research suggest a change in the percentage of CD19+ B cells and CD8+ T cells with TLR9 expression depending on the time since the diagnosis of DM1. It was found that there is a relationship between the percentage and number of CD19+ B cells and CD8+ T cells expressing TLR9 and the parameters of glycemic control. The obtained results are consistent with the reports of Gupta et al. [22], who showed a correlation between the reduction of TLR9 expression, and the abnormal glucose concentration found in diabetic patients. Moreover, additional analysis of the obtained results showed that in the case of CD19+ TLR9+ B cells and CD8+ TLR4+ and CD8+ TLR9+ T cells, their values correlated statistically with the duration of the disease.
The pathogenesis of type 1 diabetes includes the abnormal activation of many cells: B cells, macrophages, dendritic cells, CD4+ T cells, and CD8+ T cells [23]. After stimulation with autoantigens, CD4+ T cells are activated, which differentiate into T helper cells (Th1, Th2 and Th17). IL-12, which is released by antigen-presenting cells, induces the production of IFN-γ and IL-2 by Th1 lymphocytes. The concentration of these cytokines correlates with the pathogenesis of type 1 diabetes [24]. IL-2 and IFN-γ activate CD8+ T cells to differentiate into effector CD8+ cytotoxic T lymphocytes (CTLs). CTLs release granzymes and perforins that are toxic to pancreatic beta cells [25]. CD8+ T cells are believed to be involved in the destruction of pancreatic beta cells. After 5 years of type 1 diabetes mellitus, a decrease in these lymphocytes and a correlation with glucose concentration and inflammation have been demonstrated [26,27]. Sarikonda et al. [28] showed that activation of CD4+ T cells is characteristic of both the pathogenesis of type 1 and type 2 diabetes, while activation of CD8+ T cells is unique in type 1 diabetes and leads to massive destruction of pancreatic beta cells.
The present study showed a significantly higher number of CD3+ T cells, CD19+ B cells, CD3+ CD4+ T cells and CD3+ CD8+ T cells in the study group (<3 months from diagnosis) than in the control group. The obtained results confirm the involvement of lymphocytes at the early stage of the disease and are consistent with the reports of Sarikonda et al. [28].
CD4+ CD25+ T cells play an important role in preventing autoimmunity. These lymphocytes are functionally regulated by signaling mediated by TLRs. Filippi et al. [29] showed that treating mice with TLR2 agonists before developing diabetes reduced the likelihood of developing type 1 diabetes by increasing the number of CD4+ CD25+ T cells and imparting tolerogenic properties to DC. It was then demonstrated that TLR2 signaling improves immunoregulation and prevents type 1 diabetes.
NK cells that produce IFN-γ contribute to the activation of autoreactive CD4+ and CD8+ T cells [30]. The presence of the NKp46 receptor is critical for the development of diabetes mellitus. Gur et al. [31] showed that the use of a protein fused with this receptor in mice reduced the ability to kill pancreatic beta cells and inhibited the development of diabetes mellitus. Alba et al. found that NK depletion also had a similar effect [32]. Similarly, the depletion of Treg cells leads to the accumulation of NK cells in the environment of the pancreas [30]. NKp46 ligand expression has also been found on pancreatic beta cells [33]. Gur et al. [31] confirmed that immunization with anti-NKp46 antibodies lowered diabetic incidents in mice. Zhang et al. [34] demonstrated a reduction in the percentage of NK cells in children with type 1 diabetes. Impaired ability of NK cells to produce IFN-γ was also detected after stimulation with phorbol myristate acetate (PMA) and ionomycin [34]. Studies have shown [34] that lowering the percentage of NK cells is involved in the pathogenesis of diabetes. It has been suggested that a reduction in the ability of NK cells to secrete cytokines is associated with viral factors that impair NK cell function [31].
Our own research showed a significantly lower percentage (p < 0.001) and number (p = 0.035) of NK cells in the study group (<3 months from diagnosis) than in the control group. There was also an increase in the percentage (p = 0.001) and the number (p = 0.041) of these cells in chronically ill patients compared to the group with newly diagnosed diabetes. The obtained results are consistent with the reports of Zhang et al. [34] and may suggest the involvement of these cells in the pathogenesis of the disease.
Binding of PAMPs by the TLR receptor induces the maturation of antigen-presenting cells and the production of pro-inflammatory cytokines and chemokines [35]. Alkanani et al. [36] assessed TLR—dependent release of IL-6 and IL-1β by monocytes and dendritic cells in patients susceptible to the development of type 1 diabetes. An imbalance between pro-inflammatory and regulatory mechanisms has been demonstrated, which in patients predisposed to the development of diabetes may lead to the development of full-blown diabetes in the future [36].
Zhang et al. [34] assessed cytokine levels in patients with type 1 diabetes, which showed a significantly higher concentration of IFN-γ and IL-2 compared to the control group. Rydén et al. [37] found a reduced percentage of Th2 lymphocytes in people at high risk of developing diabetes. It has been suggested that inducing a Th2-mediated response towards autoantigens in these individuals could keep the C-peptide at a residual level. Consequently, lowering the activation of Th1 lymphocytes may contribute to decreased risk of pancreatic beta cell destruction [37]. Studies by He et al. [38] have shown significantly higher levels of IL-1α, tumor necrosis factor (TNF-alpha), IL-6 and IL-12 in children with type 1 diabetes [38]. The obtained results suggested that there is a dysfunction of the regulatory mechanisms, including disturbances in the balance of Th1 and Th2 lymphocytes. In children with type 1 diabetes, excessive activation of the cytokines secretion by Th1 lymphocytes is observed. At the same time, the lack of Th2 lymphocyte response contributes to the disturbance of homeostasis, which leads to pancreatic cell damage and disease progression [38]. Ligand binding by TLR leads to the stimulation of Th1 cytokine production [39]. Mortezagholi et al. [40] showed that in SLE patients, TLR9 expression on the surface of B lymphocytes is significantly higher and correlates with the production of anti-dsDNA antibodies. TLR9 mediates the production of IFN-α, which is activated by autoantibody complexes [40].
He et al. [38] demonstrated much higher concentration of IL-10 in the blood plasma, which exhibits immunosuppressive properties. On the opposite, Kikodze et al. [41] observed a much lower concentration of IL-10 in the study group [41]. Esposito et al. [42] conducted a study in which they assessed the concentration of IL-10 in obese patients. The authors showed significantly higher levels of this cytokine in these patients, along with an increase in plasma levels of IL-6 and CRP, than in non-obese patients. The evaluation of IL-10 in patients with obesity and associated lipid metabolism disorders and arterial hypertension showed a reduction in IL-10 concentration compared to obese subjects who did not show any concomitant abnormalities. IL-10 lowers the production of pro-inflammatory cytokines, and the observed higher concentration of IL-10 may be an attempt to inhibit the increasing production of pro-inflammatory cytokines. On the other hand, a reduction of IL-10 production may indicate an impairment of this pathway. It can be assumed that a decrease in IL-10 concentration may signal the exhaustion of the mechanisms of physiological metabolic control [42]. Measurement of IL-10 concentration may indicate the pro-inflammatory cytokines activation [43]. Pestana et al. [44] demonstrated much higher concentrations of IL-6 and TNF-α along with a higher concentration of IL-10 in the blood plasma of patients with type 1 diabetes. Our own research showed a significantly higher concentration of IL-10 in the study group (<3 months from diagnosis) than in the control group (p = 0.005) and in the group of chronic DM1 patients (p = 0.024). The results of the assessment of IL-10 concentration from our own studies may confirm the suggestion that although IL-10 is an anti-inflammatory cytokine, its increase may suggest a compensatory effect, counterbalancing the increase in the concentration of pro-inflammatory cytokines.
Another cytokine that may participate in the pathogenesis of type 1 diabetes in children is IL-2. Studies by Dogan et al. [45] have shown a significantly lower concentration of this cytokine in diabetic patients than in the control group. The presence of dysfunctional regulatory T lymphocytes may be associated with the observed IL-2 deficiency [46]. IL-2 may affect Treg cell function and improve disease prognosis. The rejection of the proliferation signal for Treg from IL-2 accelerated disease progression in mice [47]. The use of antibodies to the IL-2 receptor resulted in an more frequent incidence of diabetes in mice [48]. In contrast, IL-2 therapy has contributed to Treg activation [49]. IL-10 and IL-4 demonstrate anti-inflammatory properties that affect the function and viability of pancreatic cells. Cytokines may show protective properties and protect against cell damage after cytotoxic reactions [50]. Kamiński et al. [51] showed that IL-4 modulates the synthesis of nitric oxides in macrophages, leading to pro-inflammatory cytokines’ contribution to the death of pancreatic beta cells. In some cell types, IL-4 has the ability to induce the synthesis of an antagonist of the IL-1β receptor, which reduces its activation upon binding to the receptor [52]. IL-4 exhibits properties that improve glucose tolerance and insulin effectiveness, and enhances glucose utilization. The enormous role of IL-4 may suggest that deficiency of this cytokine leads to metabolic disorders in patients with type 1 diabetes [53,54].

4. Materials and Methods

4.1. Patients and Control

The study group included 53 children with type 1 diabetes who were patients of the Department of Pediatric Endocrinology and Diabetology of the Medical University of Lublin in the period from October 2016 to February 2018. Patients diagnosed with type 1 diabetes based on the clinical picture and laboratory exponents of hyperglycemia, in accordance with the criteria of the Polish Diabetes Society.
The study group was divided into patients with newly diagnosed type 1 diabetes—group I (diagnosed type 1 diabetes within 3 months of inclusion in the study, after previous recovery from ketosis) and chronic patients—group II (duration of the disease over 3 months). 31 patients were qualified to group I, including 15 girls (48.4%) and 16 boys (51.6%). The studies were carried out in children aged 10.27 years (4–17 years) on average. Group II comprised 22 people, including 9 girls (40.91%) and 13 boys (59.09%). The average age of the respondents was 14.06 years (3.33 to 17.92 years).
The control group consisted of 20 children with an average age of 12.65 years (5.75–17.33 years)—5 girls (25%) and 15 boys (75%), diagnosed due to short stature at the Department of Pediatric Endocrinology and Diabetology at the Medical University of Lublin and the Endocrinology Clinic of the University Children’s Hospital in Lublin, in which physical examination and laboratory tests excluded glucose metabolism disorders, autoimmune diseases as well as somatotropinic and multi-hormonal pituitary insufficiency.
The study design was approved by the Bioethics Committee at the Medical University of Lublin (consent number KE-0254/299/2016). The funds for the study were obtained as part of DS 417. The study was conducted in accordance with the Helsinki Declaration.
Determination of glycemic control parameters: glycated hemoglobin (HbA1c), fructosamine, C-peptide concentration and peripheral blood counts were performed according to standard procedures of the ALAB Medical Analysis Laboratory at the University Children’s Hospital in Lublin. In the group of children with type 1 diabetes lasting more than 3 months, C-peptide levels were assessed retrospectively at the diagnosis of the disease.

4.2. Preparation of the Material

Peripheral blood was collected from the ulnar vein of patients and controls using sterile, EDTA-coated blood collection tubes (S-Monovette, SARSTEDT, Aktiengesellschaft and Co., Numbrecht, Germany) during hospitalization. The collected material was immediately used to assess the immunophenotype of lymphocytes, with particular emphasis on TLR2, TLR4, and TLR9 receptors, and to obtain plasma to assess the concentration of selected cytokines.

4.3. Assessment of Peripheral Blood Lymphocyte Subpopulation by Flow Cytometry

In order to assess the presence of lymphocyte surface antigens, the appropriate monoclonal antibodies were added to the test tubes in the amount of 20 µL per tube: anti-CD3/CD19-FITC/PE, anti-CD4/CD8/CD3-FITC/PE/PE-Cy5, anti-45/14-FITC/PE, anti-CD3/CD16+CD56-FITC/PE, anti-CD19-FITC, anti-CD4-FITC and anti-CD8-FITC from BD Biosciences (USA). Percentages of natural killer (NK) and natural killer T-like (NKT-like) cells were evaluated with flow cytometry using monoclonal antibody anti-CD3 FITC/CD16+CD56 PE (BD Biosciences, East Rutherford, NJ, USA), which allowed for simultaneous assessment of T CD3+ lymphocytes and NK cells CD3/CD16+CD56+. Then, 50 µL of whole blood was added to each tube, followed by a 20-min incubation at room temperature. After incubation, 2 mL of lysis solution was added to each tube, and an 8-min incubation at room temperature was performed again. After this time, cells were washed twice with PBS buffered saline (700× g, for 5 min) and immediately analyzed on a FacsCalibur flow cytometer (Becton Dickinson, USA). The assessment of intracellular antigens was performed using the appropriate monoclonal antibodies: anti-TLR2-PE, anti-TLR4-PE, anti-TLR9-PE from BD Biosciences (USA) and the BD Cytofix/Cytoperm™ reagent kit (Becton Dickinson, USA) according to manufacturer’s protocol.
Data acquisition was performed using the FACS Diva Software 6.1.3 software, collecting 30,000 cells for each assay, while analyzing them using the CellQuest Pro program (Becton Dickinson, San Diego, CA, USA). The results of the cytometric analysis were presented as a percentage of cells stained with monoclonal antibodies conjugated with fluorescent dyes. Background fluorescence was determined, and the samples were gated to remove the cellular debris and include only single cells. An example of the cytometric analysis of T CD4+ lymphocytes, T CD8+ lymphocytes and B CD19+ lymphocytes expressing TLR-2 or TLR-4 is shown in the figure below (Figure 10A–C).

4.4. Assessment of the Concentration of IFN-γ, IL-2, IL-4 and IL-10 in the Plasma

Plasma cytokine concentration was assessed using the following ELISA kits (as recommended by the kit manufacturer): Human IFN-γ ELISA Kit, sensitivity < 8 pg/mL (R&D Systems, Minneapolis, MN, USA), Human IL-2 ELISA Kit, sensitivity < 7 pg/mL (R&D Systems, USA), Human IL-4 HS ELISA Kit, sensitivity 0.03–0.22 pg/mL (R&D Systems, USA) and Human IL-10 HS ELISA Kit, sensitivity 0.03–0.17 pg/mL (R&D Systems, USA).
The light absorbance readings in the tested samples were performed using an automated VICTOR reader (Perkin Elmer, Waltham, MA, USA). The concentration of the samples was assessed on the basis of a standard curve made of standards with different concentrations and plotted by the WorkOut computer program.

4.5. Statistical Analysis

The obtained data were statistically analyzed using the Statistica 12 PL computer program (StatSoft, Tulsa, OK, USA), assuming p < 0.05 as the level of significance. The normality of the distribution of continuous variables was assessed using the Shapiro-Wilk test. Statistical characteristics of continuous variables were presented in the form of medians, arithmetic means, standard deviations and extreme values (minimum and maximum). Intergroup comparisons for independent variables were performed using Student’s t tests for variables showing a normal distribution and Mann-Whitney U test for variables that did not show a normal distribution. Spearman’s rank correlation coefficient (R) was used to assess the strength and direction of the relationship between pairs of variables. The scatterplots were prepared with the use of Prism 8.4.2 computer program (Graphpad Software, San Diego, CA, USA).

5. Conclusions

The increase of lymphocytes expressing TLR2 and TLR4 receptors in patients’ cases with type 1 diabetes in the early stage of the disease and those treated chronically suggests that stimulation of these receptors accompanies the development of the disease.
The decrease of the number of CD8+ T and CD19+ B cells expressing the TLR9 receptor in patients’ cases at an early stage of the disease compared to patients treated chronically and demonstrated significant relationships with HbA1c and the concentration of fructosamine confirms that changes in the expression of this receptor may be involved in the regulation of glucose metabolism of patients with type 1 diabetes.
Considerably a higher number of CD19+ B lymphocytes, CD3+CD4+ T and CD3+CD8+ T lymphocytes and a lower number of NK cells of patients with newly diagnosed type 1 diabetes in the absence of significant changes in the number of these cells in chronic patients’ cases confirm the thesis of participation of these cells in early stage of the disease, which may contribute to the destruction of pancreatic beta cells.
A significantly higher concentration of IL-10 in the plasma of patients with newly diagnosed diabetes compared to patients treated chronically and the control group suggests an attempt to activate regulatory mechanisms in patients’ cases at an early stage of the disease, which do not constitute protection against the progressive progression of the disease.
There is an undeniable need for broader studies in order to better understand the immunological mechanisms leading to the development of type I diabetes. Such knowledge would be crucial in finding a potential agent that would interfere with that process slowing down or stopping the progression of the disease.

Supplementary Materials

Author Contributions

Conceptualization, M.K., K.K., A.H. and A.P.; methodology, M.K., A.H., D.B., R.H., P.N.-R. and A.P.; software, M.K.; validation, A.H.; formal analysis, A.P., A.H., D.B., R.H., P.N.-R. and M.K.; investigation, M.K., A.P., K.K. and A.H.; data curation, M.K., K.K., D.B., R.H., O.S. and P.N.-R.; writing—original draft preparation, M.K., K.K., D.B., R.H., O.S. and A.P.; writing—review and editing, P.N.-R. and A.H.; visualization, K.K., D.B., R.H. and P.N.-R.; supervision, M.K.; project administration, A.P., A.H., D.B., R.H., P.N.-R. and O.S.; funding acquisition, M.K. and A.H.; additional calculations and analyzes, M.P., preparation of a graphic design, M.P., significant intellectual contribution to the improvement of manuscript, M.P. All authors have read and agreed to the published version of the manuscript.

Funding

This research was supported by the Medical University of Lublin (grant no. DS345).

Institutional Review Board Statement

The study was conducted according to the guidelines of the Declaration of Helsinki, and approved by the Ethics Committee of Medical University of Lublin, Poland (approval no. KE-0254/299/2016).

Informed Consent Statement

Informed consent was obtained from all subjects involved in the study. Written informed consent has been obtained from the patients to publish this paper.

Data Availability Statement

Due to privacy and ethical concerns, the data that support the findings of this study are available on request from [M.K.].

Conflicts of Interest

The authors declare no conflict of interest.

References

  1. Ginter, E.; Simko, V. Global prevalence and future of diabetes mellitus. Adv. Exp. Med. Biol. 2012, 771, 35–41. [Google Scholar] [CrossRef] [PubMed]
  2. American Diabetes Association. Classification and diagnosis of diabetes. Diabetes Care 2019, 42, 13–28. [Google Scholar]
  3. IDF. Diabetes Atlas—Eighth Edition. Available online: https://www.idf.org/ (accessed on 1 October 2021).
  4. EURODIAB ACE Study Group. Variation and trends in incidence of childhood diabetes in Europe. Lancet 2000, 355, 873–876. [Google Scholar] [CrossRef]
  5. World Health Organization. Definition and Diagnosis Mellitus and Intermediate Hyperglycemia: Report of WHO/IDF Consultation; World Health Organization: Geneva, Switzerland, 2006. [Google Scholar]
  6. Eisenbarth, G.S. Type I diabetes mellitus. A chronic autoimmune disease. N. Engl. J. Med. 1986, 314, 1360–1368. [Google Scholar] [CrossRef]
  7. Ting, C.; Bansal, V.; Batal, I.; Mounayar, M.; Chabtini, L.; El Akikki, G.; Azzi, J. Impairment of immune systems in diabetes. Adv. Exp. Med. Biol. 2012, 771, 62–75. [Google Scholar]
  8. Matzinger, P. The danger model: A renewed sense of self. Science 2002, 296, 301–305. [Google Scholar] [CrossRef] [Green Version]
  9. Damo, X.; Haiying, L.; Mousa, K.K. Direct and indirect role of Toll-like receptors in T cell mediated immunity. Cell Mol. Immunol. 2004, 1, 239–246. [Google Scholar]
  10. Majewska, M.; Szczepanik, M. The role of Toll-Like Receptors (TLR) in innate and adaptive immune responses and their function in immune response regulation. Post Hig. Med. Dośw. 2006, 60, 52–63. [Google Scholar]
  11. Zipris, D. Innate immunity and its role in type 1 diabetes. Curr. Opin. Endocrinol. Diabetes Obes. 2008, 15, 326–331. [Google Scholar] [CrossRef]
  12. Hori, S.; Nomura, T.; Sakaguchi, S. Control of regulatory T cell development by the transcription factor Foxp3. Science 2003, 299, 1057–1061. [Google Scholar] [CrossRef] [Green Version]
  13. Xiao, F.; Ma, L.; Zhao, M.; Huang, G.; Mirenda, V.; Dorling, A.; Lechler, R.; Lombardi, G. Ex vivo expanded human regulatory T cells delay islet allograft rejection via inhibiting islet-derived monocyte chemoattractant protein-1 production in CD34+ stem cells-reconstituted NOD-scid IL2rγnull mice. PLoS ONE 2014, 9, e90387. [Google Scholar] [CrossRef]
  14. Salomon, B.; Lenschow, D.J.; Rhee, L.; Ashourian, N.; Singh, B.; Sharpe, A.; Bluestone, J.A. B7/CD28 costimulation is essential for the homeostasis of the CD4+CD25+ immunoregulatory T cells that control autoimmune diabetes. Immunity 2000, 12, 431–440. [Google Scholar] [CrossRef] [Green Version]
  15. Pop, S.M.; Wong, C.P.; Culton, D.A.; Clarke, S.H.; Tisch, R. Single cell analysis shows decreasing FoxP3 and TGFbeta1 coexpressing CD4+CD25+ regulatory T cells during autoimmune diabetes. J. Exp. Med. 2005, 201, 1333–1346. [Google Scholar] [CrossRef] [PubMed]
  16. Sakaguchi, S.; Sakaguchi, N.; Shimizu, J.; Yamazaki, S.; Sakihama, T.; Itoh, M.; Kuniyasu, Y.; Nomura, T.; Toda, M.; Takahashi, T. Immunologic tolerance maintained by CD25+CD4+ regulatory T cells: Their common role in controlling autoimmunity, tumor immunity, and transplantation tolerance. Immunol. Rev. 2001, 182, 18–32. [Google Scholar] [CrossRef]
  17. Papadimitraki, E.D.; Bertsias, G.K.; Boumpas, D.T. Toll like receptors and autoimmunity: A critical appraisal. J. Autoimmun. 2007, 29, 310–318. [Google Scholar] [CrossRef] [PubMed]
  18. Ehlers, M.; Ravetch, J.V. Opposing effects of Toll-like receptor stimulation induce autoimmunity or tolerance. Trends Immunol. 2007, 28, 74–79. [Google Scholar] [CrossRef]
  19. Nündel, K.; Green, N.M.; Shaffer, A.L.; Moody, K.L.; Busto, P.; Eilat, D.; Miyake, K.; Oropallo, M.A.; Cancro, M.P.; Marshak-Rothstein, A. Cell-intrinsic expression of TLR9 in autoreactive B cells constrains BCR/TLR7-dependent responses. J. Immunol. 2015, 194, 2504–2512. [Google Scholar] [CrossRef] [Green Version]
  20. Devaraj, S.; Dasu, M.R.; Park, S.H.; Jialal, I. Increased levels of ligands of Toll-like receptors 2 and 4 in type 1 diabetes. Diabetologia 2009, 52, 1665–1668. [Google Scholar] [CrossRef] [Green Version]
  21. Devaraj, S.; Jialal, I. Increased secretion of IP-10 from monocytes under hyperglycemia is via the TLR2 and TLR4 pathway. Cytokine 2009, 47, 6–10. [Google Scholar] [CrossRef] [PubMed] [Green Version]
  22. Gupta, S.; Maratha, A.; Siednienko, J.; Natarajan, A.; Gajanayake, T.; Hoashi, S.; Miggin, S. Analysis of inflammatory cytokine and TLR expression levels in Type 2 diabetes with complications. Sci. Rep. 2017, 7, 7633. [Google Scholar] [CrossRef] [PubMed] [Green Version]
  23. Tisch, R.; McDevitt, H. Insulin-dependent diabetes mellitus. Cell 1996, 85, 291–297. [Google Scholar] [CrossRef] [Green Version]
  24. Yoon, J.W.; Jun, H.S. Autoimmune destruction of pancreatic beta cells. Am. J. Ther. 2005, 12, 580–591. [Google Scholar] [CrossRef]
  25. Faustman, D.L.; Davis, M. The primacy of CD8 T lymphocytes in type 1 diabetes and implications for therapies. J. Mol. Med. 2009, 87, 1173–1178. [Google Scholar] [CrossRef] [PubMed]
  26. Pender, M.P. CD8+ T-Cell deficiency, epstein-barr virus infection, vitamin D deficiency and steps to autoimmunity: A unifying hypothesis. Autoimmune Dis. 2012, 2012, 1–16. [Google Scholar] [CrossRef] [Green Version]
  27. Apostolopoulou, M.; Menart-Houtermans, B.; Ruetter, R.; Nowotny, B.; Gehrmann, U.; Markgraf, D.; Szendroedi, J.; Schloot, N.C.; Roden, M. Characterization of circulating leukocytes and correlation of leukocyte subsets with metabolic parameters 1 and 5 years after diabetes diagnosis. Acta Diabetol. 2018, 55, 723–731. [Google Scholar] [CrossRef]
  28. Sarikonda, G.; Pettus, J.; Phatak, S.; Sachithanantham, S.; Miller, J.F.; Wesley, J.D.; Cadag, E.; Chae, J.; Ganesan, L.; Mallios, R.; et al. CD8 T-cell reactivity to islet antigens is unique to type 1 while CD4 T-cell reactivity exists in both type 1 and type 2 diabetes. J. Autoimmun. 2014, 50, 77–82. [Google Scholar] [CrossRef]
  29. Filippi, C.; Ehrhardt, K.; Estes, E.; Larsson, P.; Oldham, J.; Herrath, M. TLR2 signaling improves immunoregulation to prevent type 1 diabetes. Eur. J. Immunol. 2011, 41, 1399–1409. [Google Scholar] [CrossRef] [PubMed]
  30. Fraker, C.; Bayer, A.L. The expanding role of natural killer cells in type 1 diabetes and immunotherapy. Curr. Diabetes Rep. 2016, 16, 109. [Google Scholar] [CrossRef]
  31. Gur, C.; Porgador, A.; Elboim, M.; Gazit, R.; Mizrahi, S.; Stern-Ginossar, N.; Achdout, H.; Ghadially, H.; Dor, Y.; Nir, T.; et al. The activating receptor NKp46 is essential for the development of type 1 diabetes. Nat. Immunol. 2010, 11, 121–128. [Google Scholar] [CrossRef] [PubMed]
  32. Alba, A.; Planas, R.; Clemente, X.; Carrillo, J.; Ampudia, R.; Puertas, M.-C.; Pastor, X.; Tolosa, E.; Pujol-Borrell, R.; Verdaguer, J.; et al. Natural killer cells are required for accelerated type 1 diabetes driven by interferon-beta. Clin. Exp. Immunol. 2008, 151, 467–475. [Google Scholar] [CrossRef]
  33. Enk, J.; Mandelboim, O. The role of natural cytotoxicity receptors in various pathologies: Emphasis on type I diabetes. Front. Immunol. 2014, 5, 4. [Google Scholar] [CrossRef] [Green Version]
  34. Zhang, Y.; Wang, H.; Lou, X.; Qu, X.; Gao, L.; Liu, X.; Li, M.; Guo, H.; Jiang, Y. Decreased percentage of NKG2D+NK cells in patients with incident onset of Type 1 Diabetes. Clin. Exp. Pharmacol. Physiol. 2017, 44, 180–190. [Google Scholar] [CrossRef] [PubMed]
  35. Marsland, B.J.; Kopf, M. Toll-like receptors: Paving the path to T cell-driven autoimmunity? Curr. Opin. Immunol. 2007, 19, 611–614. [Google Scholar] [CrossRef]
  36. Alkanani, A.K.; Rewers, M.; Dong, F.; Waugh, K.; Gottlieb, P.A.; Zipris, D. Dysregulated Toll-like receptor-induced interleukin-1β and interleukin-6 responses in subjects at risk for the development of type 1 diabetes. Diabetes 2012, 61, 2525–2533. [Google Scholar] [CrossRef] [PubMed] [Green Version]
  37. Rydén, A.; Faresjö, M. Altered immune profile from pre-diabetes to manifestation of type 1 diabetes. Diabetes Res. Clin. Pract. 2013, 100, 74–84. [Google Scholar] [CrossRef]
  38. He, J.S.; Xie, P.S.; Luo, D.S.; Sun, C.J.; Zhang, Y.G.; Liu, F.X. Role of immune dysfunction in pathogenesis of type 1 diabetes mellitus in children. Asian Pac. J. Trop. Med. 2014, 7, 823–826. [Google Scholar] [CrossRef] [Green Version]
  39. Anders, H.J.; Zecher, D.; Pawar, R.D.; Patole, P.S. Molecular mechanisms of autoimmunity triggered by microbial infection. Arthritis Res. Ther. 2005, 7, 215–224. [Google Scholar] [CrossRef] [PubMed] [Green Version]
  40. Mortezagholi, S.; Babaloo, Z.; Rahimzadeh, P.; Namdari, H.; Ghaedi, M.; Gharibdost, F.; Mirzaei, R.; Bidad, K.; Salehi, E. Evaluation of TLR9 expression on PBMCs and CpG ODN-TLR9 ligation on IFN-α production in SLE patients. Immunopharmacol. Immunotoxicol. 2017, 39, 11–18. [Google Scholar] [CrossRef]
  41. Kikodze, N.; Pantsulaia, I.; Rekhviashvili, K.; Iobadze, M.; Dzhakhutashvili, N.; Pantsulaia, N.; Kukuladze, N.; Bikashvili, N.; Metreveli, D.; Chikovani, T. Cytokines and T regulatory cells in the pathogenesis of type 1 diabetes. Georgian Med. News 2013, 29–35. [Google Scholar]
  42. Esposito, K.; Pontillo, A.; Giugliano, F.; Giugliano, G.; Marfella, R.; Nicoletti, G.; Giugliano, D. Association of low interleukin-10 levels with the metabolic syndrome in obese women. J. Endocronol. Metab. 2003, 88, 1055–1058. [Google Scholar] [CrossRef]
  43. Kulshrestha, H.; Gupta, V.; Mishra, S.; Mahdi, A.A.; Awasthi, S.; Kumar, S. Interleukin-10 as a novel biomarker of metabolic risk factors. Diabetes Metab. Syndr. 2018, 12, 543–547. [Google Scholar] [CrossRef]
  44. Pestana, R.M.C.; Domingueti, C.P.; Duarte, R.C.F.; Fóscolo, R.B.; Reis, J.S.; Rodrigues, A.M.S.; Martins, L.B.; Sousa, L.P.; Lage, D.P.; Ferreira, C.N.; et al. Cytokines profile and its correlation with endothelial damage and oxidative stress in patients with type 1 diabetes mellitus and nephropathy. Immunol. Res. 2016, 64, 951–960. [Google Scholar] [CrossRef]
  45. Dogan, Y.; Akarsu, S.; Ustundag, B.; Yilmaz, E.; Gurgoze, M. Serum IL-1β, IL-2, and IL-6 in insulin-dependent diabetic children. Mediat. Inflamm. 2006, 2006, 59206. [Google Scholar] [CrossRef] [Green Version]
  46. Pérol, L.; Lindner, J.M.; Caudana, P.; Nunez, N.G.; Baeyens, A.; Valle, A.; Sedlik, C.; Loirat, D.; Boyer, O.; Créange, A.; et al. Loss of immune tolerance to IL-2 in type 1 diabetes. Nat. Commun. 2016, 7, 13027. [Google Scholar] [CrossRef]
  47. Gitelman, S.E.; Bluestone, J.A. Regulatory T cell therapy for type 1 diabetes: May the force be with you. J. Autoimmun. 2016, 71, 78–87. [Google Scholar] [CrossRef] [Green Version]
  48. Rosenzwajg, M.; Churlaud, G.; Hartemann, A.; Klatzmann, D. Interleukin 2 in the pathogenesis and therapy of type 1 diabetes. Curr. Diab. Rep. 2014, 14, 553. [Google Scholar] [CrossRef]
  49. Long, S.A.; Rieck, M.; Sanda, S.; Bollyky, J.B.; Samuels, P.L.; Goland, R.; Ahmann, A.; Rabinovitch, A.; Aggarwal, S.; Phippard, D.; et al. Rapamycin/IL-2 combination therapy in patients with type 1 diabetes augments Tregs yet transiently impairs beta-cell function. Diabetes 2012, 61, 2340–2348. [Google Scholar] [CrossRef] [Green Version]
  50. Russell, M.A.; Morgan, N.G. The impact of anti-inflammatory cytokines on the pancreatic β cell. Islets 2014, 6, e950547. [Google Scholar] [CrossRef] [Green Version]
  51. Kaminski, A.; Kaminski, E.R.; Morgan, N.G. Pre-incubation with interleukin-4 mediates a direct protective effect against the loss of pancreatic β-cell viability induced by proinflammatory cytokines. Clin. Exp. Immunol. 2007, 148, 583–588. [Google Scholar] [CrossRef]
  52. Wong, H.L.; Costa, G.L.; Lotze, M.T.; Wahl, S.M. Interleukin-4 diferentially regulates monocyte IL-1 family gene expression and synthesis in vitro and in vivo. J. Exp. Med. 1993, 177, 775–781. [Google Scholar] [CrossRef] [Green Version]
  53. Chang, Y.H.; Ho, K.T.; Lu, S.H. Regulation of glucose/lipid metabolism and insulin sensitivity by interleukin-4. Int. J. Obes. 2012, 36, 993–998. [Google Scholar] [CrossRef] [PubMed] [Green Version]
  54. Yang, C.P.; Shiau, M.Y.; Lai, Y.R.; Ho, K.T.; Hsiao, C.W.; Chen, C.-J.; Lo, Y.-L.; Chang, Y.-H. Interleukin-4 boosts insulin-induced energy deposits by enhancing glucose uptake and lipogenesis in hepatocytes. Oxid. Med. Cell Longev. 2018, 2018, 6923187. [Google Scholar] [CrossRef] [PubMed]
Figure 1. (AH). Assessment of B CD19+, T CD4+, and T CD8+ lymphocytes with TLR2, TLR4, TLR9 expression in the study and control groups.
Ijms 22 12135 g001
Figure 2. (AD). Selected plasma cytokine levels.
Ijms 22 12135 g002
Figure 3. Relationship between the percentage of CD19+ TLR9+ B cells and the level of HbA1c in the group with newly diagnosed type 1 diabetes (<3 months from diagnosis).
Ijms 22 12135 g003
Figure 4. Relationship between the percentage of CD19+ TLR9+ B cells and the level of fructosamine in the group with newly diagnosed type 1 diabetes (<3 months from diagnosis).
Ijms 22 12135 g004
Figure 5. Relationship between the percentage of CD8+ TLR9+ T cells and the level of HbA1c in the group with newly diagnosed type 1 diabetes (<3 months from diagnosis).
Ijms 22 12135 g005
Figure 6. Relationship between the percentage of CD8+ TLR9+ T cells and the level of fructosamine in the group with newly diagnosed type 1 diabetes (<3 months from diagnosis).
Ijms 22 12135 g006
Figure 7. Relationship between CD19+ TLR9+ B cells and duration time after the onset of DM1.
Ijms 22 12135 g007
Figure 8. Relationship between CD8+ TLR4+ T cells and duration time after the onset of DM1.
Ijms 22 12135 g008
Figure 9. Relationship between CD8+ TLR9+ T cells and duration time after the onset of DM1.
Ijms 22 12135 g009
Figure 10. Dot-plots showing the percentage of B lymphocytes (CD19+) and T lymphocytes (CD4+, CD8+) with TLR2 expression (A), B lymphocytes (CD19+) and T lymphocytes (CD4+, CD8+) with TLR4 expression (B) B lymphocytes (CD19+) and T lymphocytes (CD4+, CD8+) with TLR9 expression (C).
Ijms 22 12135 g010aIjms 22 12135 g010b
Table 1. Basic characteristics of study and control groups.
ParameterMeanMedianMinimumMaximumSD
Glycated hemoglobin [%]Group I1212.017.14162.40
Group II8.89.205.70162
Fructosamine [μmol/L]Group I950.049743331714360.34
Group II513.10520.502867000134.58
C-peptide [ng/mL]Group I0.460.340.101.890.39
Group II0.530.530.200.820.21
White blood cells [103/μL]Group I9.638.404.1824.324.28
Group II6.946.714.0412.991.89
Controls6.435.914.058.991.38
Neutrocytes [103/μL]Group I5.864.771.5017.413.64
Group II3.553.351.606.901.22
Controls3.332.982.065.551.11
Lymphocytes [103/μL]Group I2.882.800.724.530.95
Group II2.582.261.665.060.85
Controls2.332.531.233.480.67
Red blood cells [106/μL]Group I5.064.844.146.680.59
Group II5.084.934.106.100.51
Controls4.794.794.045.280.34
Hemoglobin [g/dL]Group I14.0414.2011.6016.201.25
Group II14.5814.2012.7016.901.51
Controls13.6613.8511.7016.000.97
Platelets [103/μL]Group I274.392629953482.35
Group II278.82282.5020338249.52
Controls291.69289.5022140050.05
Lymphocytes T CD3+ [%]Study group72.7174.0258.9683.705.70
Group I73.0074.0258.9683.706.01
Group II72.3173.9462.7581.145.34
Controls68.1370.9452.1975.226.89
Lymphocytes T CD3+ [103/mm3]Study group2.0171.8510.5373.8600.740
Group I2.1161.9460.5373.6000.770
Group II1.8791.5981.1483.8600.670
Controls1.5961.7520.7832.4480.507
Lymphocytes B CD19+ [%]Study group14.6114.284.6430.765.23
Group I16.0215.484.6430.765.77
Group II12.6312.796.4320.533.64
Controls11.7610.555.2727.515.02
Lymphocytes B CD19+ [103/mm3]Study group0.4010.3330.1181.0500.200
Group I0.4540.4610.1181.0500.212
Group II0.3270.3090.1260.7400.150
Controls0.2710.2520.0920.5270.121
Lymphocytes T CD3+CD4+ [%]Study group41.0942.2728.8353.075.73
Group I40.9142.4128.8353.076.27
Group II41.3341.6430.3148.935.03
Controls37.3736.0728.5651.687.35
Lymphocytes T CD3+CD4+ [103/mm3]Study group1.1311.0430.3822.0900.420
Group I1.1821.1390.3822.0900.459
Group II1.0630.9470.6672.0800.360
Controls0.8770.9060.3591.3870.310
Lymphocytes T CD3+CD8+ [%]Study group27.3027.9115.3042.064.93
Group I28.0028.5617.1842.065.21
Group II26.3526.8115.3032.924.47
Controls24.9723.6019.0634.754.43
Lymphocytes T CD3+CD8+ [103/mm3]Study group0.7670.6840.1431.4700.320
Group I0.8250.8270.1431.4700.340
Group II0.6880.6400.3721.3500.270
Controls0.5870.5810.2850.9980.212
CD3+CD4+/CD3+CD8+ ratioStudy group1.571.460.803.100.46
Group I1.531.450.802.670.45
Group II1.631.520.973.100.46
Controls1.561.490.902.560.48
NK cells [%]Study group9.238.452.2522.214.99
Group I7.437.062.2514.073.49
Group II11.7711.252.6822.215.72
Controls13.3412.564.0522.625.47
NK cells [103/mm3]Study group0.2480.2300.0210.7200.140
Group I0.2140.1880.0210.5700.124
Group II0.2950.2560.0560.7200.160
Controls0.3090.2470.1100.6540.165
The level of significance of differences between the studied groups in the percentage and number of parameter.
ParameterStudy Group/ControlsGroup I/ControlsGroup II/ControlsGroup I/Group II
Lymphocytes T CD3+ [%]0.0090.0160.042NS
Lymphocytes T CD3+ [103/mm3]0.0360.019NSNS
Lymphocytes B CD19+ [%]NS0.016NS0.019
Lymphocytes B CD19+ [103/mm3]0.0150.003NS0.019
Lymphocytes T CD3+CD4+ [%]0.038NSNSNS
Lymphocytes T CD3+CD4+ [103/mm3]0.0280.022NSNS
Lymphocytes T CD3+CD8+ [%]NS0.015NSNS
Lymphocytes T CD3+CD8+ [103/mm3]0.0380.015NSNS
CD3+CD4+/CD3+CD8+ ratioNSNSNSNS
NK cells [%]0.007<0.001NS0.001
NK cells [103/mm3]NS0.035NS0.041
(NS—not significant).
Publisher’s Note: MDPI stays neutral with regard to jurisdictional claims in published maps and institutional affiliations.

