Article

Contribution of the Transcription Factors Sp1/Sp3 and AP-1 to Clusterin Gene Expression during Corneal Wound Healing of Tissue-Engineered Human Corneas

by
Christelle Gross
1,2,3,
Gaëtan Le-Bel
1,3,
Pascale Desjardins
1,2,3,
Manel Benhassine
1,2,3,
Lucie Germain
1,2,4 and
Sylvain L. Guérin
1,2,3,*
1
Centre Universitaire d’Ophtalmologie-Recherche (CUO-Recherche), Centre de Recherche du CHU de Québec, Axe Médecine Régénératrice, Hôpital du Saint-Sacrement, Québec, QC G1S 4L8, Canada
2
Centre de Recherche en Organogénèse Expérimentale de l’Université Laval/LOEX, Génie Tissulaire et Régénération, Centre de Recherche du CHU de Québec, Axe Médecine Régénératrice, Québec, QC G1V 0A6, Canada
3
Département d’Ophtalmologie, Faculté de Médecine, Université Laval, Québec, QC G1V 0A6, Canada
4
Département de Chirurgie, Faculté de Médecine, Université Laval, Québec, QC G1V 0A6, Canada
*
Author to whom correspondence should be addressed.
Int. J. Mol. Sci. 2021, 22(22), 12426; https://0-doi-org.brum.beds.ac.uk/10.3390/ijms222212426
Submission received: 5 October 2021 / Revised: 9 November 2021 / Accepted: 12 November 2021 / Published: 17 November 2021
(This article belongs to the Special Issue Biomaterials and Regenerative Medicine)

Abstract

:
In order to reduce the need for donor corneas, understanding of corneal wound healing and development of an entirely tissue-engineered human cornea (hTECs) is of prime importance. In this study, we exploited the hTEC to determine how deep wound healing affects the transcriptional pattern of corneal epithelial cells through microarray analyses. We demonstrated that the gene encoding clusterin (CLU) has its expression dramatically repressed during closure of hTEC wounds. Western blot analyses confirmed a strong reduction in the expression of the clusterin isoforms after corneal damage and suggest that repression of CLU gene expression might be a prerequisite to hTEC wound closure. Transfection with segments from the human CLU gene promoter revealed the presence of three regulatory regions: a basal promoter and two more distal negative regulatory regions. The basal promoter bears DNA binding sites for very potent transcription factors (TFs): Activator Protein-1 (AP-1) and Specificity protein-1 and 3 (Sp1/Sp3). By exploiting electrophoretic mobility shift assays (EMSA), we demonstrated that AP-1 and Sp1/Sp3 have their DNA binding site overlapping with one another in the basal promoter of the CLU gene in hCECs. Interestingly, expression of both these TFs is reduced (at the protein level) during hTEC wound healing, thereby contributing to the extinction of CLU gene expression during that process. The results of this study contribute to a better understanding of the molecular mechanisms accounting for the repression of CLU gene expression during corneal wound healing.

1. Introduction

Visual acuity is directly correlated with the integrity of the anatomical structures of the eyes. One of these key components is the cornea, consisting of the outer layer of the eye. The cornea is a transparent structure, crucial for light refraction to the retina that accounts for three-quarters of the total eye refractive power. Hence, maintaining corneal transparency is of basic necessity; otherwise, visual acuity will be inevitably affected [1]. Moreover, its integrity is essential because it also constitutes the first barrier of the ocular surface against pathogen infections [1]. However, because of this specific localization, it is the first structure altered by thermic, chemical or mechanical damages. According to the first global report on vision launched in 2019 by the World Health Organization (WHO), at least 2.2 billion people worldwide suffer from a vision impairment or blindness. Of these, corneal opacities consecutive to corneal damages represent the fifth cause of visual deficiency with 4.2 million patients. In North America, the incidence of corneal wounds accounts for 37% of all visual deficiency and 23% of ocular consultation, which makes it a large proportion of all visual disabilities [2].
Corneal repair and regeneration mainly depend on the limbal stem cells located at the junction between the corneal and conjunctival epithelium. Indeed, a compromised limbal niche is a key factor of the injury’s severity, the prognostic of healing being poor when more than 50% of the limbal area is damaged [3]. Furthermore, the loss of stem cells can lead to the limbal stem cell deficiency syndrome that also causes a partial or complete opacification of the cornea [4]. Corneal barrier rupture can also frequently cause infection [5]. If not treated rapidly and properly, pathogens can penetrate into the cornea and cause damages to the subjacent tissues [6]. The consequences of such corneal damages are dramatic and can lead to the complete loss of vision [7]. According to the severity of the trauma, actual treatments, which aim to improve epithelial healing and/or reduce inflammation, may not be satisfactory. In some cases, a corneal transplantation or eye enucleation may even be required [8]. However, the growing popularity of refractive surgeries renders donor corneas unusable, thus reducing the number of available grafts. In order to reduce the need for donor corneas, understanding of corneal wound healing and development of an entirely tissue-engineered human cornea (hTECs) is of prime importance. We succeeded in producing two-layer hTECs (epithelium and stroma) made up of primary cultured cells grown on a naturally secreted extracellular matrix that show characteristics very similar to those of the native cornea, including the expression of the epithelial barrier marker ZO-1, the differentiation marker keratins K3/K12, the corneal integrins αvβ6 and α2β1 and integrin subunits β4, α3 and α6 and the subepithelial basement membrane and stromal components laminin V, collagen types I, IV, V and VII, to name a few [9,10,11,12,13]. Over the last 20 years, we used this substitute to study the mechanistic of wound healing [2,9,11,14,15,16,17,18]. The dynamic of wound closure was found to be very similar between the hTEC and the native cornea [11]. Because of these similarities, the hTEC represents an outstanding model that we can exploit to study in detail the cellular and molecular mechanisms of corneal wound healing.
Corneal wound healing is a complex event involving many processes, such as cell death, proliferation, migration, adhesion and differentiation [19]. During each of these steps, genes and enzymes expression are altered to allow proper wound closure [11]. In this context, clusterin (CLU), an extracellular chaperone [20], is a target of interest, as it is involved in multiple physiological processes including apoptotic cell death [21,22], cell adhesion [23], migration [24] and proliferation [25] and tissue remodeling [26], to name a few. CLU-overexpression is associated with different pathologic contexts (aging, cancer tumorigenesis and chemoresistance, neurodegeneration, cardiovascular diseases) including eye pathologies (Fuch’s Dystrophies, age-related macular degeneration and amyloid plaques of corneal dystrophy) [27,28,29,30,31,32,33]. However, while the CLU-mediated signaling pathways in the eye [34] are beginning to be clarified [33,35,36], the molecular basis of its gene expression remains unclear. Few reports identified multiple binding sites for a variety of transcription factors (TFs) along the CLU gene promoter, including activator Protein 1 (AP-1), Specificity Protein 1 (Sp1), Nuclear Factor 1 (NFI), Signal Transducers and Activators of Transcription (STAT), MYCN Proto-oncogene and Heat Shock Factor (HSF), to name a few [37,38]. Although a handful of them reported the characterization of the regulatory sequences that are critical to ensure proper transcription of the CLU gene [39,40,41,42,43,44,45,46], none have ever investigated their contribution to human wound healing.
Human CLU is a gene located on the reverse strand of chromosome 8. The CLU gene is organized in nine exons and generates a transcript of approximatively 2 kb [47]. It is ubiquitously expressed and encodes a glycosylated and secreted protein of approximatively 75–80 kDa (sCLU). The human CLU gene encodes three main transcripts: isoform 1, which is the most abundant transcript variant (accession number GenBank NM_001831.2); isoform 2 (accession number GenBank NR_038335); and isoform 3 (accession number GenBank NR_045494.1) [37,48]. All variants are composed of a unique exon 1 that probably originates from two alternative starting sites, and share the remaining exons 2–9 sequence [37]. In the early stages of maturation, CLU mRNA is translated into an unfolded precursor protein. Then, the precursor is directed to the endoplasmic reticulum and Golgi apparatus, where it is subjected to glycosylation and proteolytic cleavage into α and β subunits (of 40 kDa each and called cCLU). The α and β chains are reassembled by disulfide bonds, leading to a mature heterodimeric protein of 75–80 kDa (sCLU) [49]. More recently, an alternative messenger RNA was found [50]. Authors have identified a new form of CLU isoform 1 lacking Exon 2 that results in the production of a shorter non-glycosylated and non-secreted 55–60 kDa CLU protein (nuclear-nCLU). CLU has been associated to contradictory cellular functions, such as cell survival and apoptosis. These apparently ambiguous functions appear to be attributed to both sCLU, which has pro-survival and tumorigenic functions, and nCLU, which exhibits a pro-apoptotic activity [28,50,51].
In the present study, we exploited the hTEC as a model to better understand the molecular mechanisms regulating CLU gene expression during corneal wound healing. We demonstrated that CLU gene expression was severely repressed during hTEC wound healing and that both positive and negative regulatory elements that contribute to its transcription in hCECs are present in both the basal promoter and 5′-flanking sequence of the CLU gene. Furthermore, both the positive, ubiquitous TFs Sp1 and Sp3 (Sp1/Sp3), and AP-1, whose protein expression was also found to decrease in wounded hTECs (with the exception of Sp3), were shown to contribute to CLU gene transcription by interacting within its basal promoter in vitro.

2. Results

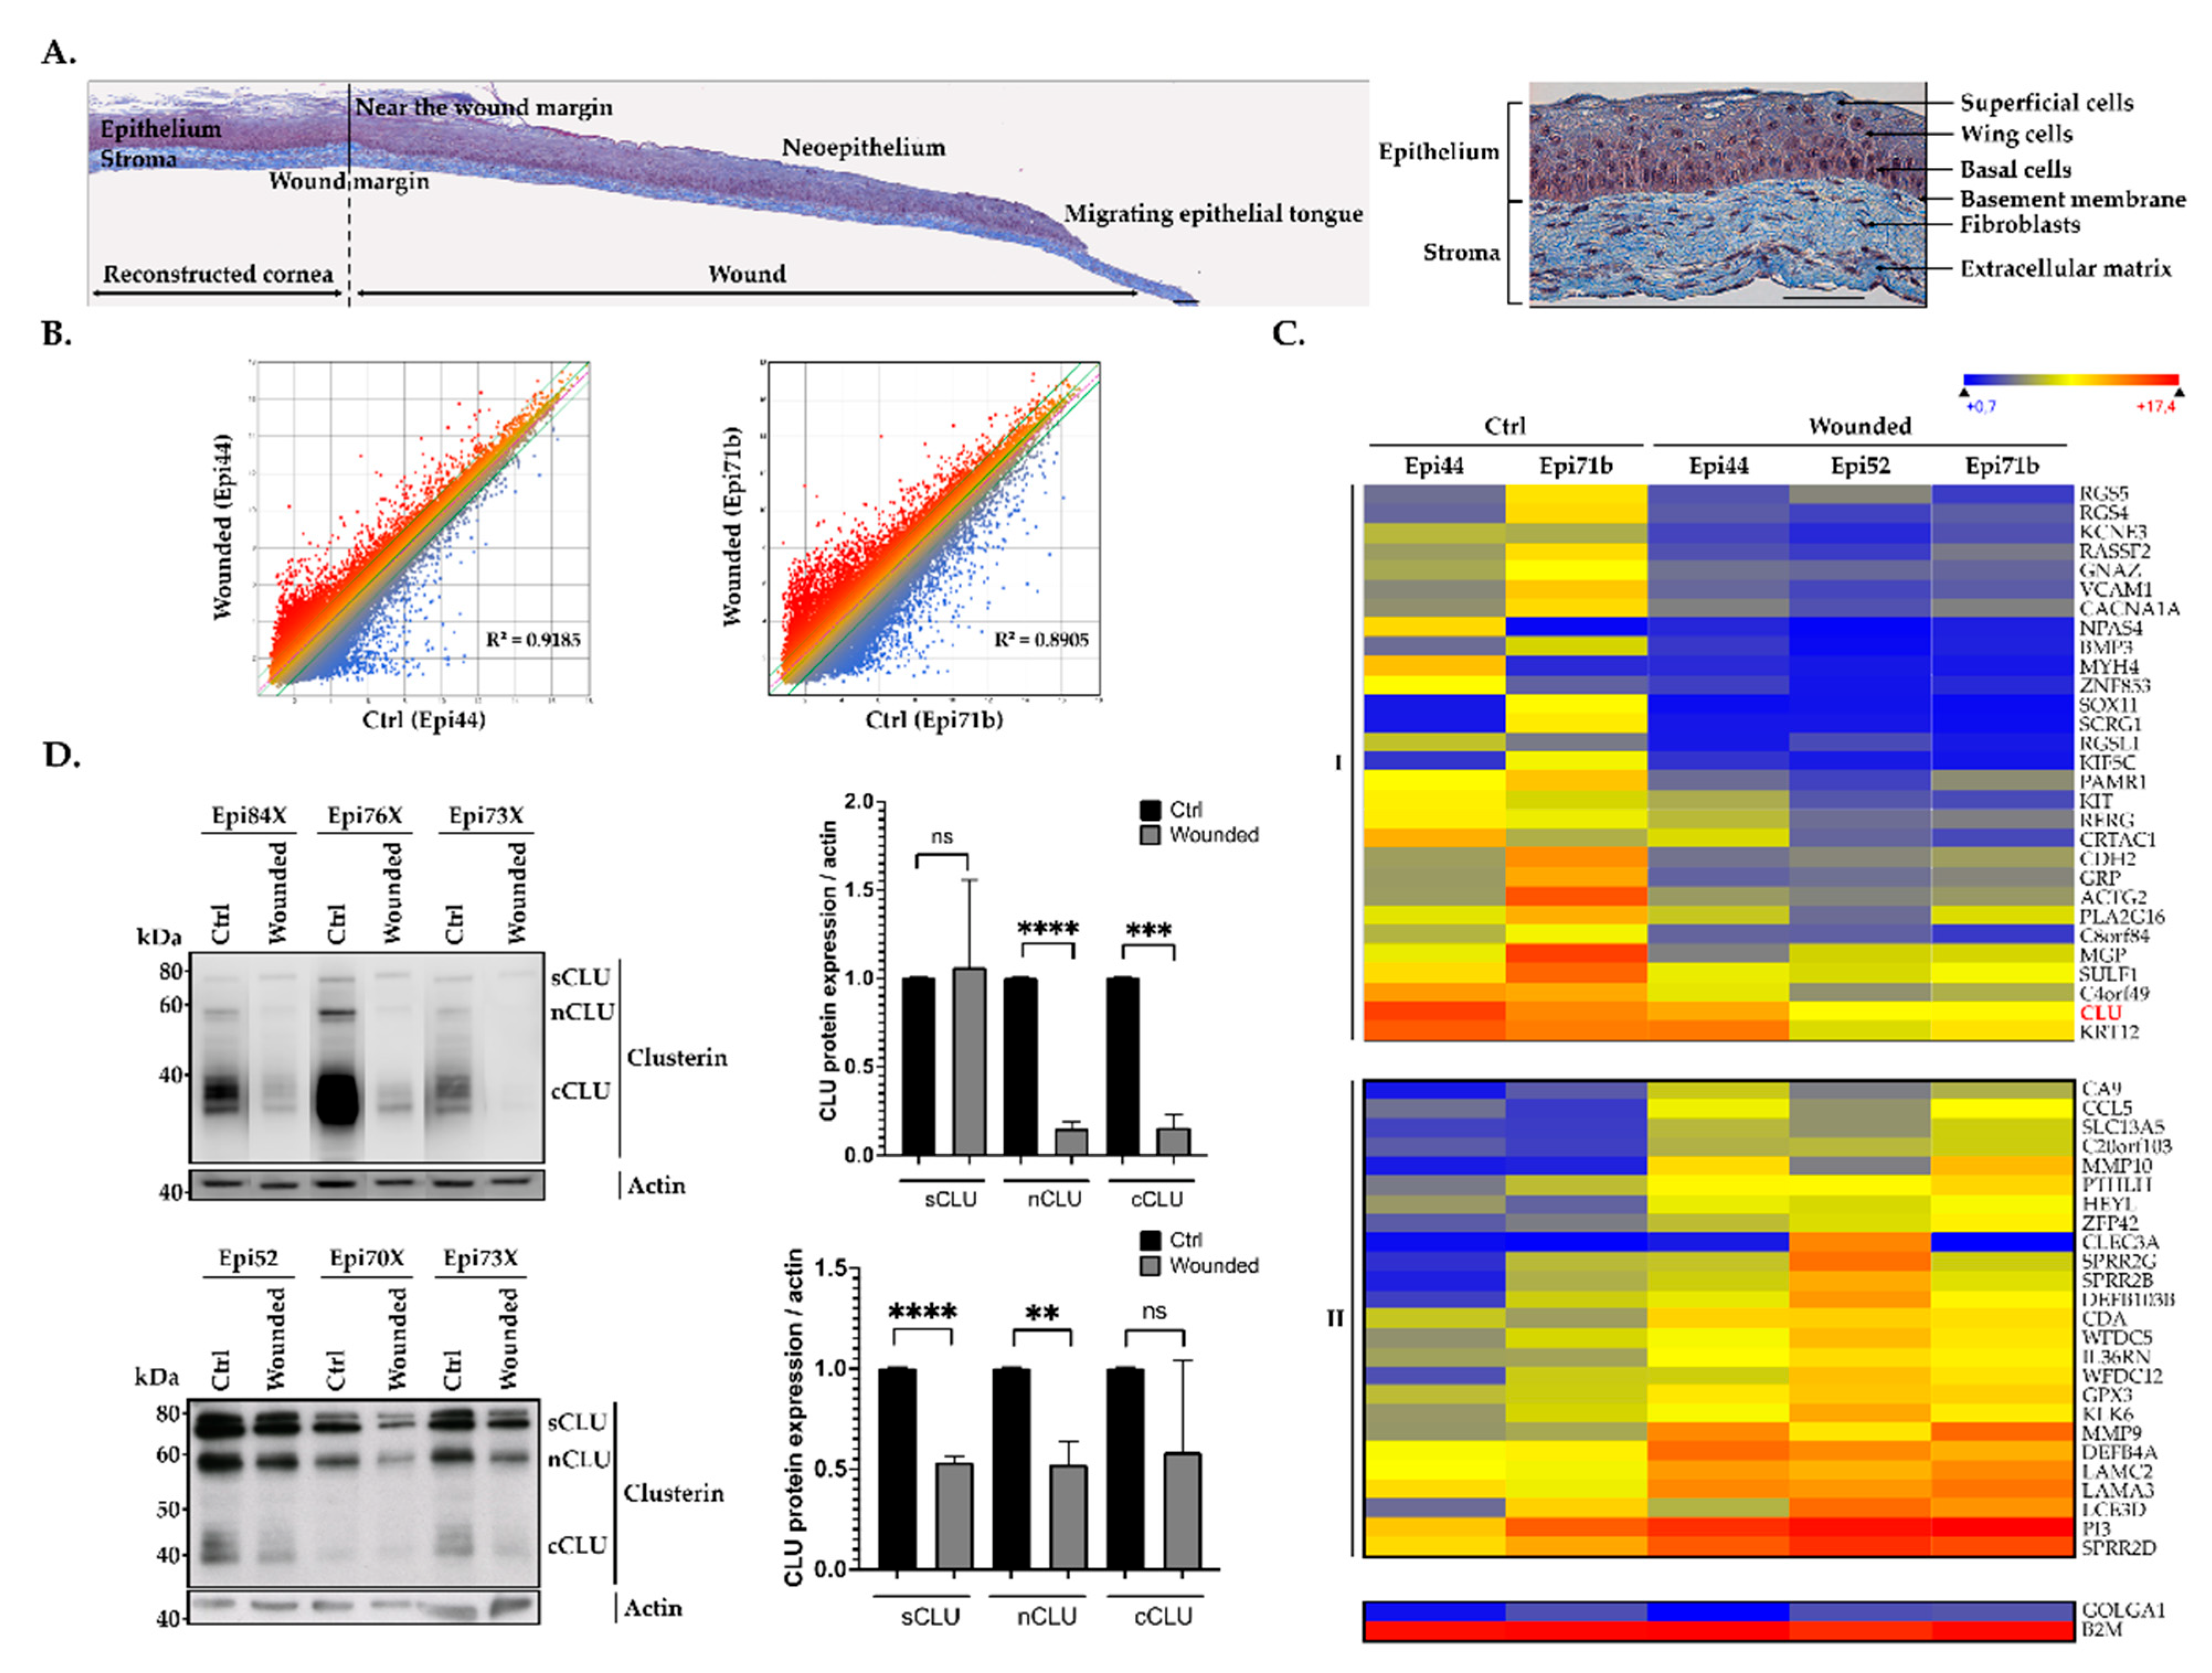
2.1. hTECs Wound Healing Alters CLU Gene Expression in Human Corneal Epithelial Cells

Biopsies from central areas of both wounded and unwounded (used as negative controls) hTECs were used to extract total RNA in order to conduct gene profiling analyses on microarrays. A scatter plot analysis of the 60,000 different transcripts contained on the arrays provided evidence that hCECs from the central area of wounded hTECs have a distinctive pattern of expressed genes from that yielded by unwounded hTECs, as revealed by the dispersion of the normalized signals that appear as a cloud of dots in Figure 1A, and the slope of the regression curve (R2 = 0.9185 for Epi 44 and R2 = 0.8905 for Epi 71b). Analysis for all the genes showing a two-fold or more expression variation unique to hCECs from the central areas of wounded corneas paired with those from unwounded hTECs was then generated. A total of 2754 genes fitted into that category of differentially regulated genes when hCECs from the central area are compared between wounded and unwounded hTECs. We next examined the data files from the microarrays to sort out genes whose expression was the most deregulated in hCECs between the central areas of the wounded corneas and their relative unwounded substitutes. The 54 most deregulated genes were classified according to their variation during wound healing and arbitrarily named class I and II. As shown in Figure 1B, expression of the genes identified as class I was dramatically reduced in the central wound (Wounded) compared to their normal level in the unwounded hTECs (Ctrl). On the other hand, genes from class II seek their expression strongly increased in the central wound.
Among the 54 genes identified above in Figure 1B, that encoding clusterin (CLU) was among the most strongly expressed in control hTECs, whereas its expression is dramatically reduced in the central area of wounded hTECs. Indeed, the CLU average miroarray linear signals drops from 18,624 in unwounded hTECs to only 1146 in wounded hTECs (corresponding to a 16-fold repression). Consistent with these results, CLU is known to be involved in multiple physiological mechanisms linked to wound healing processes (including apoptosis, cell adhesion, migration and proliferation, tissue remodeling, etc.) [21,22,23,24,25,26]. We then examined whether the repression in CLU gene expression observed in microarray also translates into a corresponding reduction at the protein level. As shown in Figure 1C, the variations in CLU gene expression observed in the microarray were also validated at the protein level by western blot analyses. All CLU isoforms (sCLU, cCLU and nCLU protein) were expressed in hTECs and hCECs prior to wounding (top and bottom panels, respectively). However, expression of both nCLU and cCLU was dramatically reduced in the wounded hTECs, whereas the reduction was less important in hCECs. No change in sCLU expression could be observed in the hTEC, whereas it was reduced by 50% in hCECs.

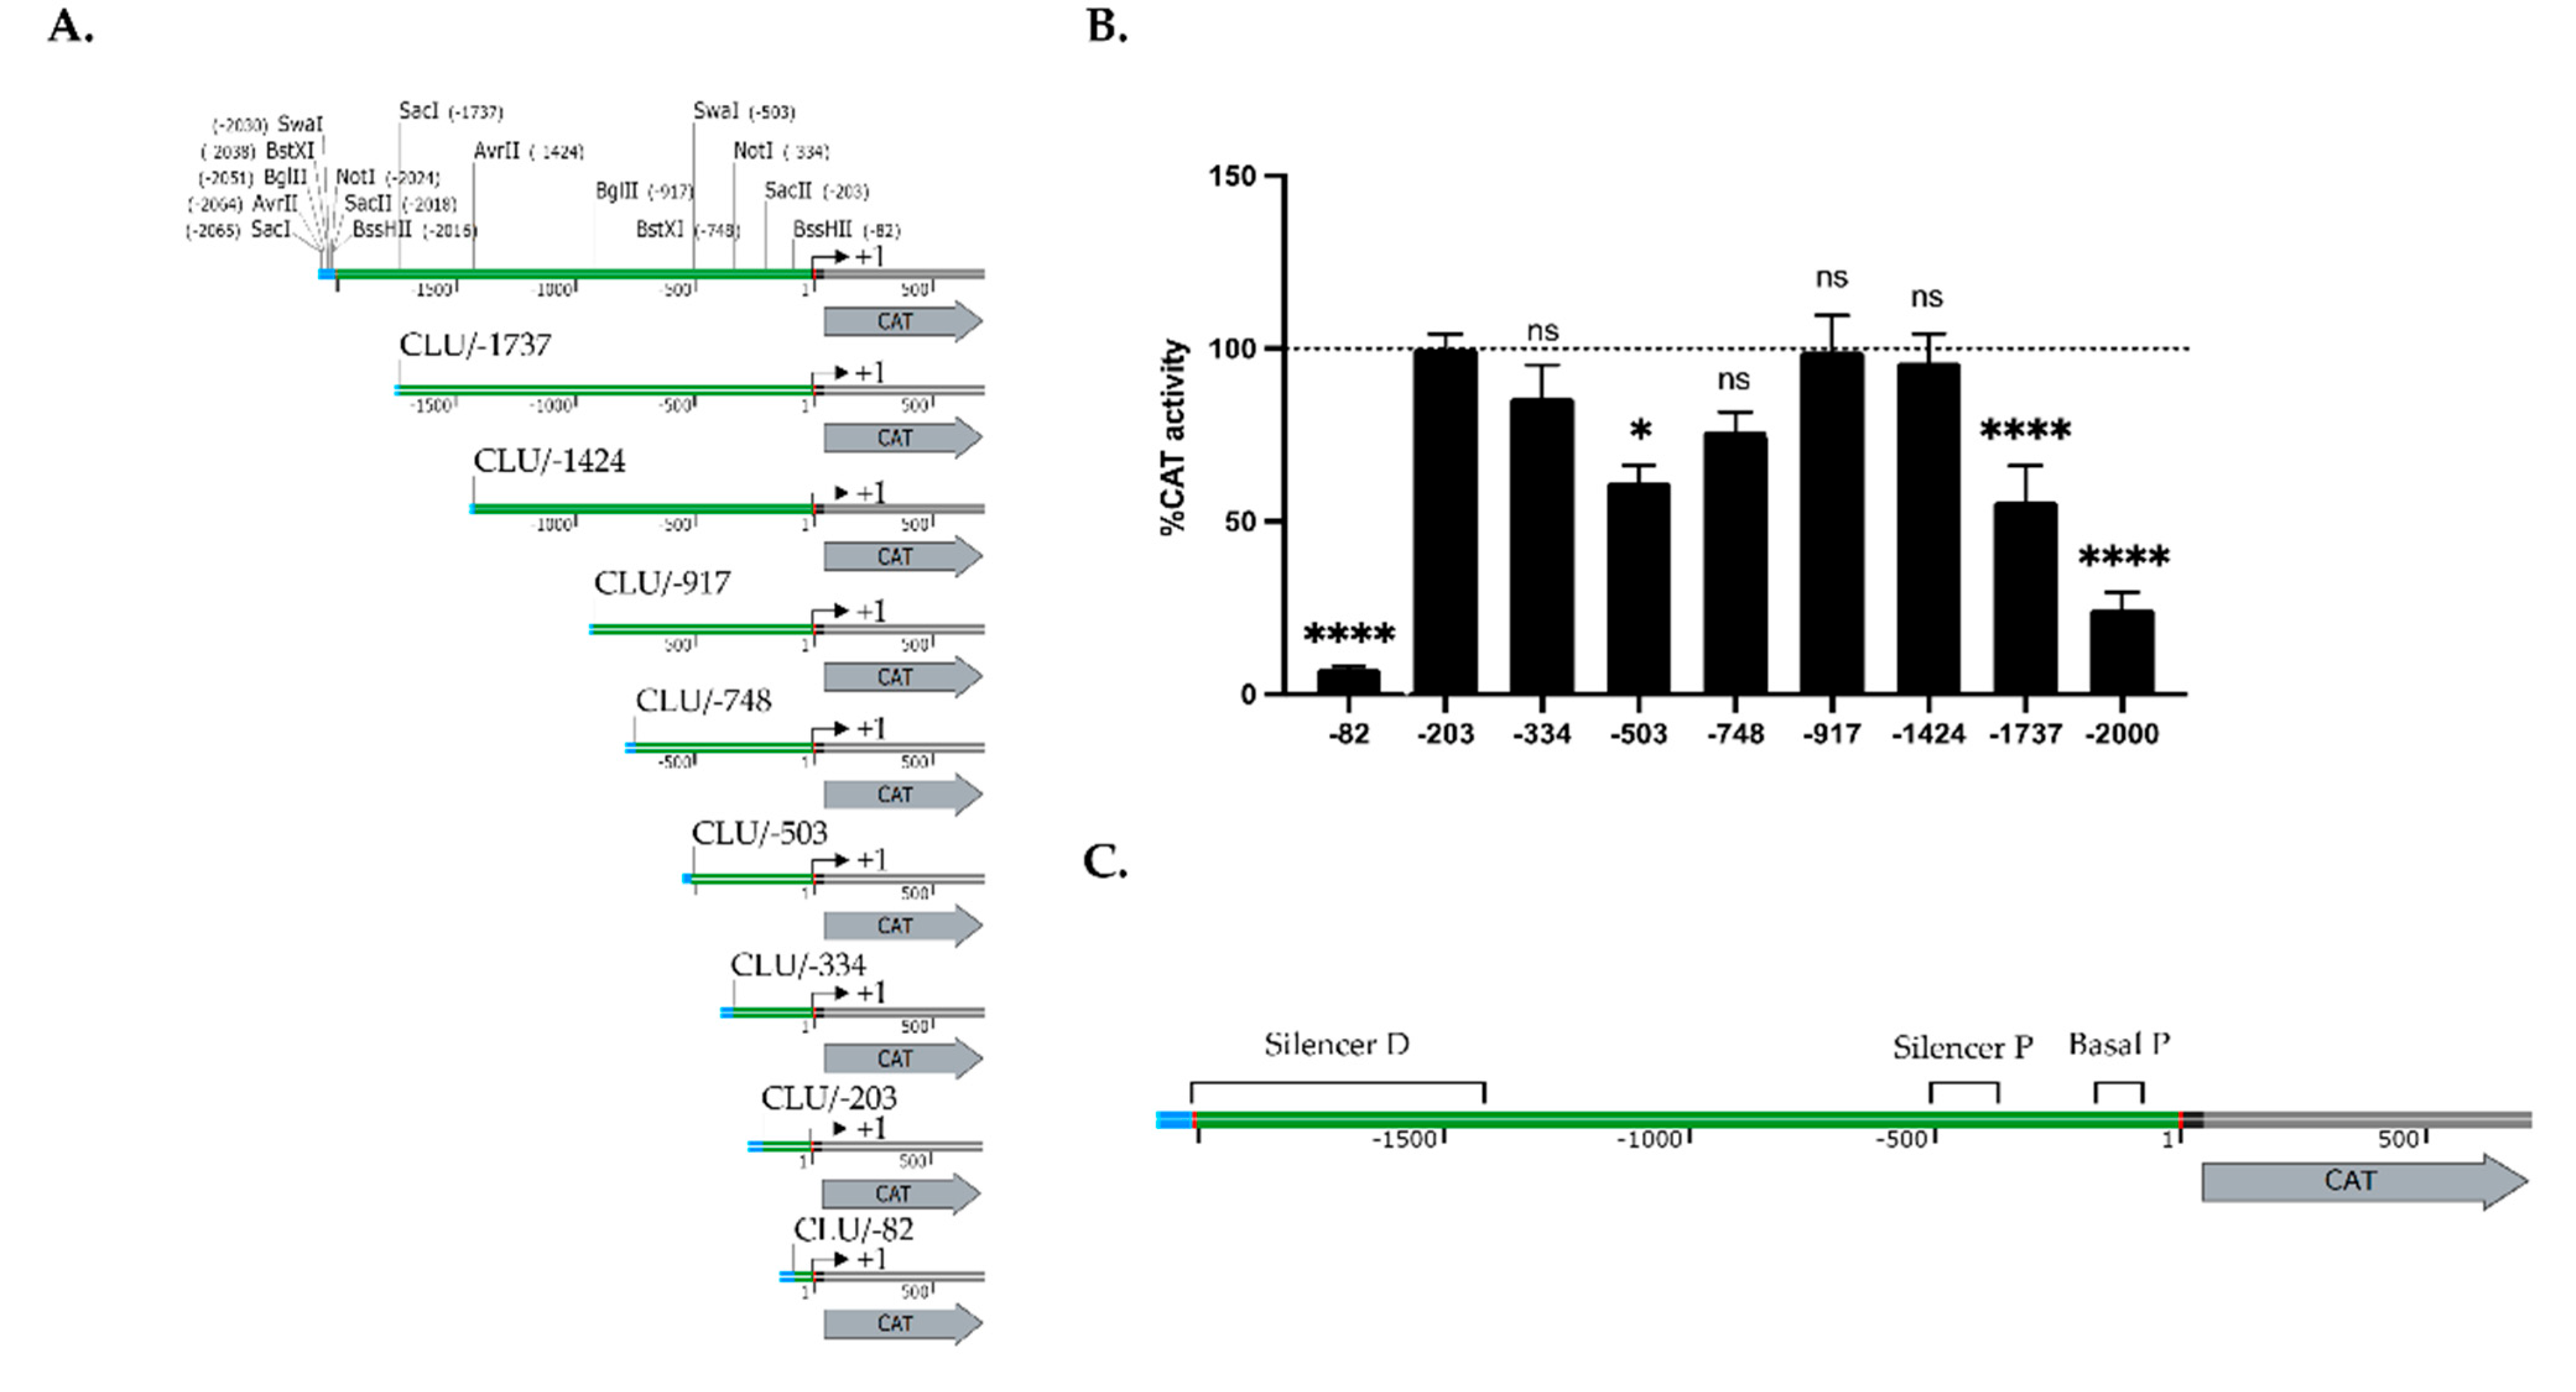
2.2. CLU Gene Transcription Is Modulated by Both Positive and Negative Regulatory Elements

In order to investigate further the mechanism by which CLU gene expression is regulated during wound healing, we cloned different DNA fragments from the human CLU gene promoter and 5′-flanking region upstream of the CAT reporter gene and transfected the resulting plasmid constructs into hCECs (Figure 2A).
The plasmid CLU/-203 that contains the CLU promoter sequence from 3′ position +1 to 5′ position -203 relative to the putative mRNA start site [37] yielded an easily detectable CAT activity upon transfection of HCECs (Figure 2B). However, deletion of the CLU promoter to position -82 (in plasmid CLU/-82) nearly abolished CAT activity relative to the level directed by the CLU/-203 construct (14-fold repression). In contrast, extending the CLU promoter by 131 bp to position -334 (in CLU/-334) had no influence.
Extenting further the CLU promoter to position -503 (in CLU/-503) resulted in a modest repression (1.6-fold repression) of the CAT activity compared to those of CLU/-203, which is gradually relieved upon transfection of the plasmid CLU/-748 (1.3-fold repression) and CLU/-917 (no repression). Again, extending further the CLU promoter to position -1424 (CLU/-1424) had no impact on CAT activity, whereas transfection of either CLU/-1737 or CLU/-2000 caused a progressive repression of CAT activity (1.8- and 4.1-fold repression, respectively). Collectively, these results indicate that transcription of the CLU gene is under the control of two negative silencer elements: a strong one, located between positions -1424/-2000 and refered to as the distal silencer (Silencer D; Figure 2C), and a weaker one, located between positions -334/-748 and designated as the proximal silencer (Silencer P; Figure 2C). They also suggest that regulatory elements required to ensure basal expression of the CLU gene are present between positions -82 and -203 (designated as the basal promoter (P).

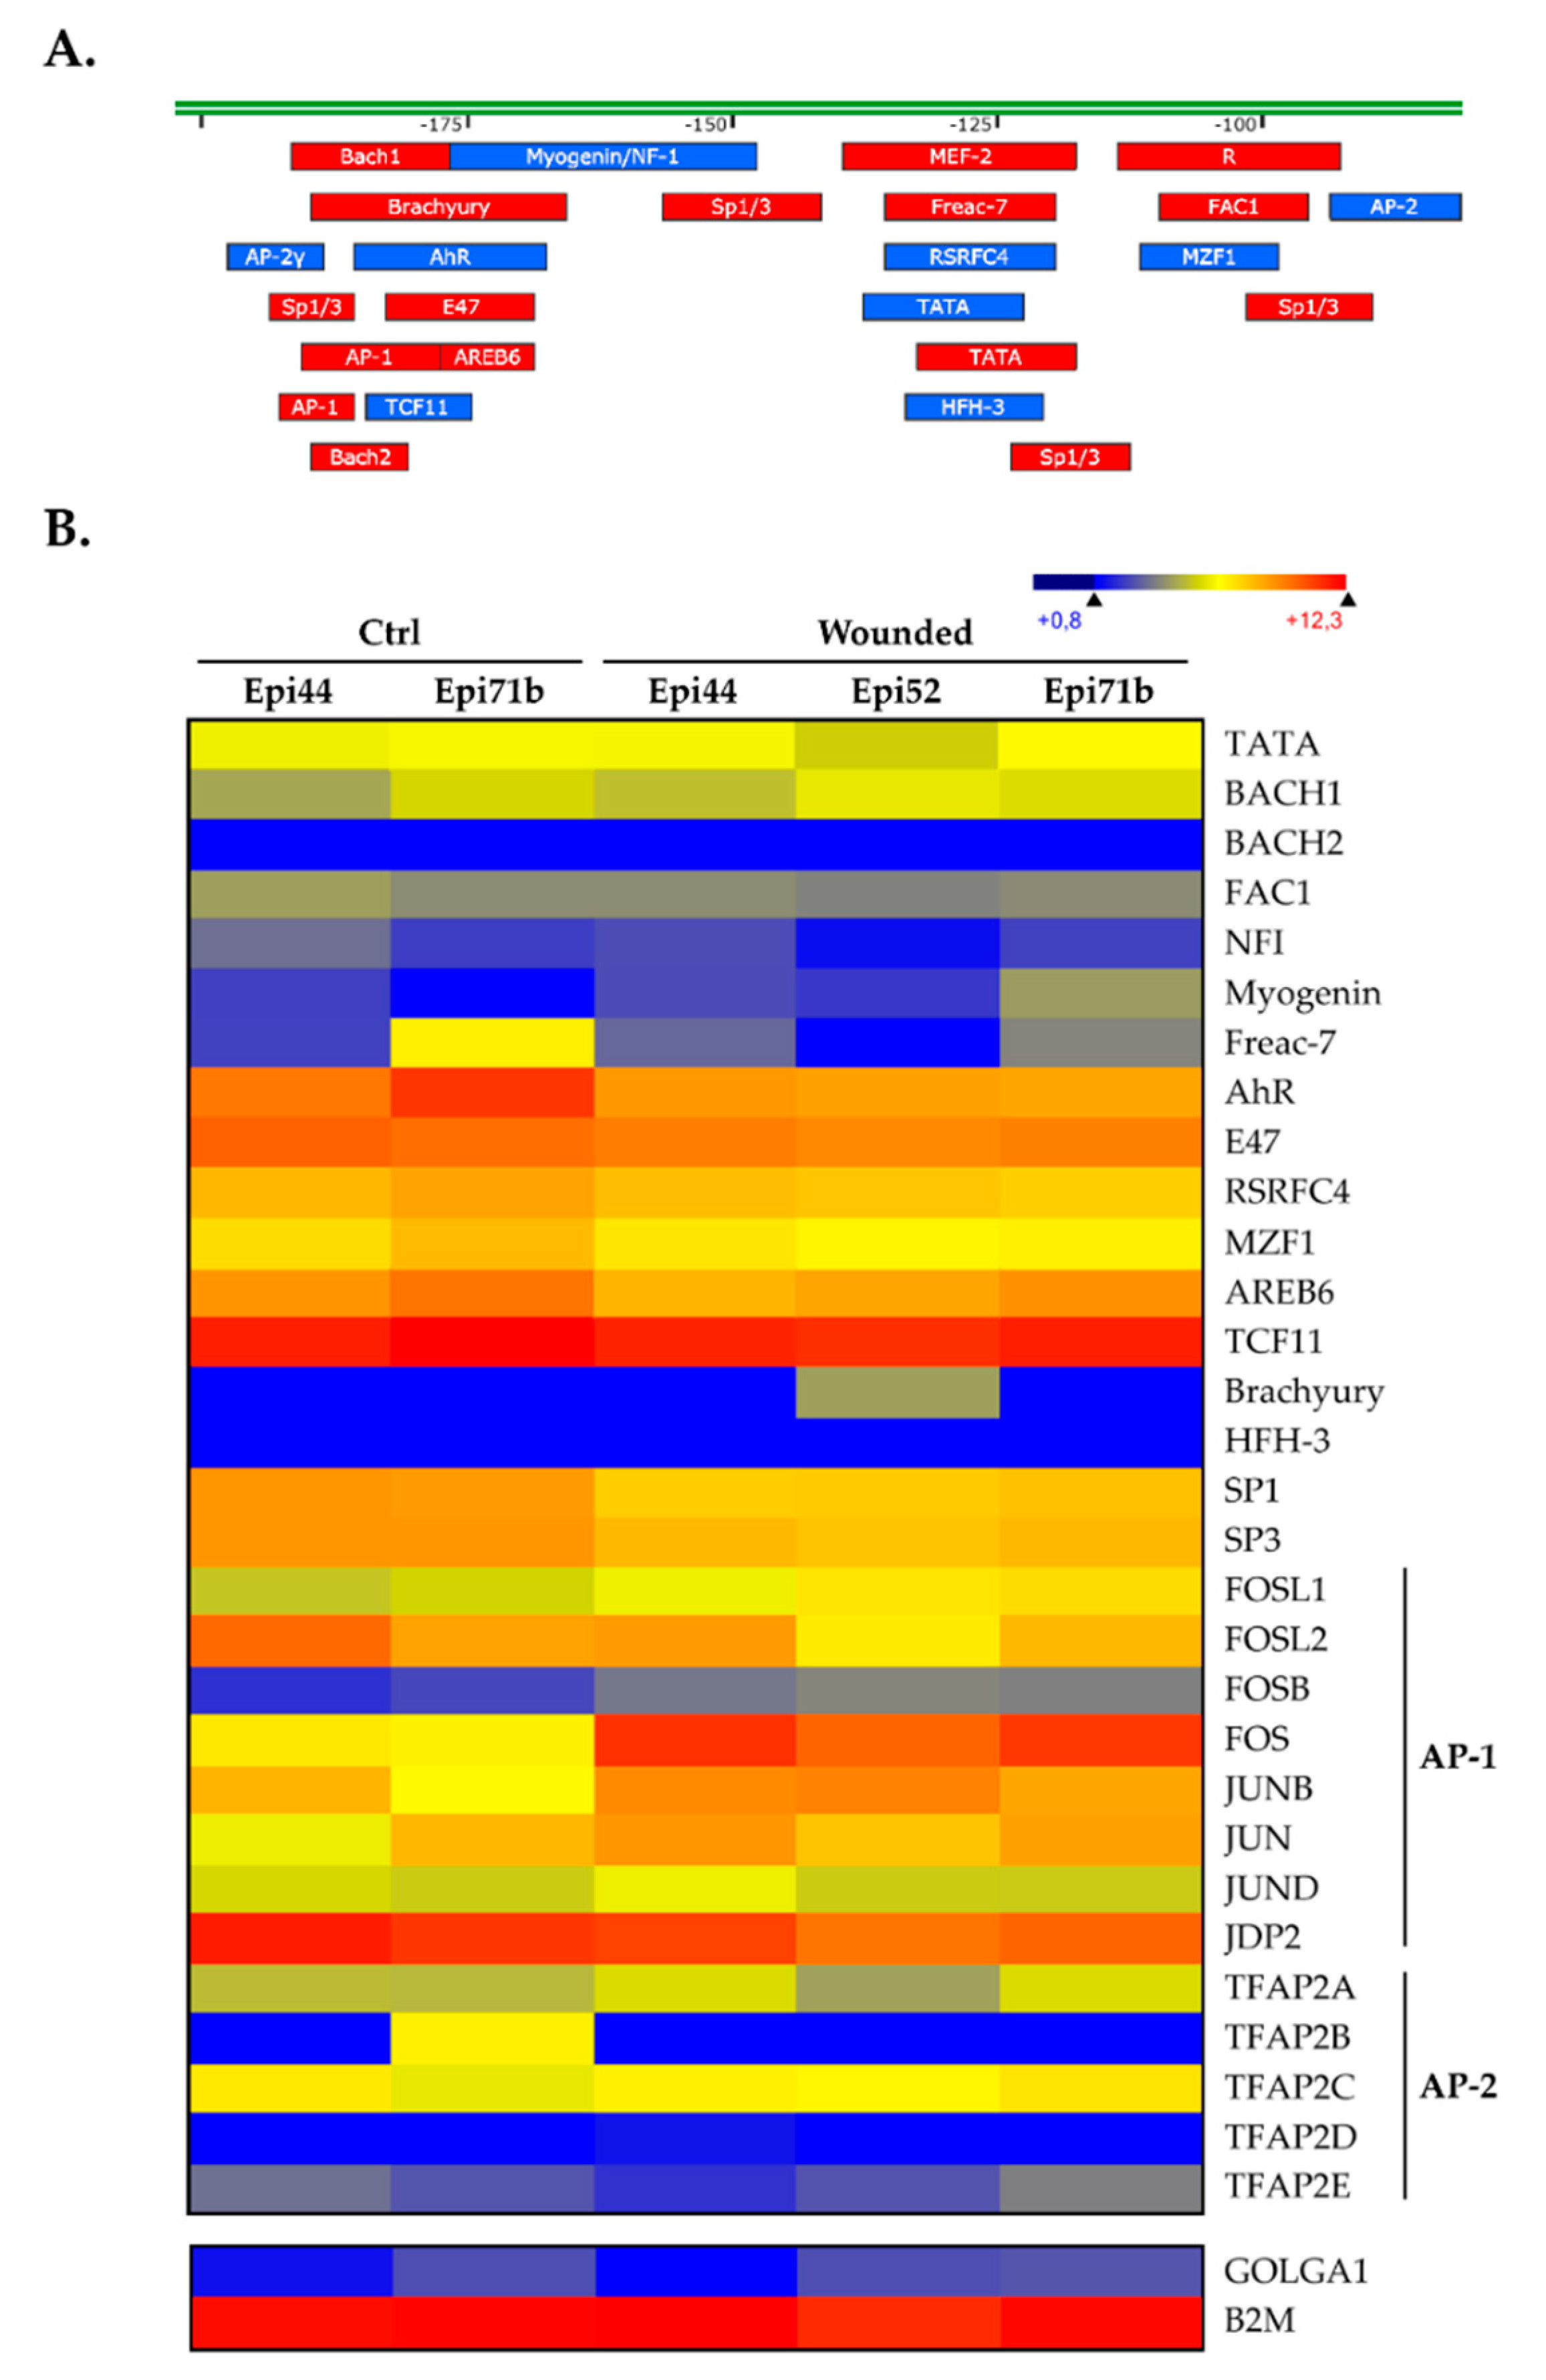
2.3. Analysis of the Transcription Factors Binding to the CLU Basal Promoter in HCECs

We then subjected the 2 Kbp segment from the CLU gene upstream regulatory sequence to a search with the TFSEARCH program, a tool that can identify putative DNA target sequences for most transcription factors (TFs). To be consistent with the transfection results shown in Figure 2C, we focused our attention toward the -82/-203 regulatory element, as its presence is absolutely required to ensure basal CLU promoter function. Interestingly, a particularly high number of putative target sites for two TFs families were identified in this promoter region of only 131 pb: 4 sites for Specificity protein1 and 3 (Sp1/Sp3), two closely related TFs that recognize the same target site in DNA, and one site for Activator Protein-1 (AP-1) (Figure 3A). These two TFs families have been consistently reported to function as activators of gene expression [52,53,54]. We next examined the pattern of expression for these TFs in the hTECs by searching the microarray data files used for generating the data appearing in Figure 1. As shown in Figure 3B, all of these TFs (including the AP-1 constituting subunits c-Jun (JUNC), b-Jun (JUNB), d-Jun (JUND), c-Fos (FOSC), FOS-like 1 and 2 (FOSL1 and FOSL2) and FosB (FOSB)) are easily detectable in hTECs. A significant increase in the expression of many of them (FOSL1, FOSB, FOSC and JUNB) was observed in our wounded hTECs compared to the expression observed in the unwounded, control hTECs. Interestingly, only the TFs Sp1 and Sp3 had their transcription reduced in wounded hTECs.

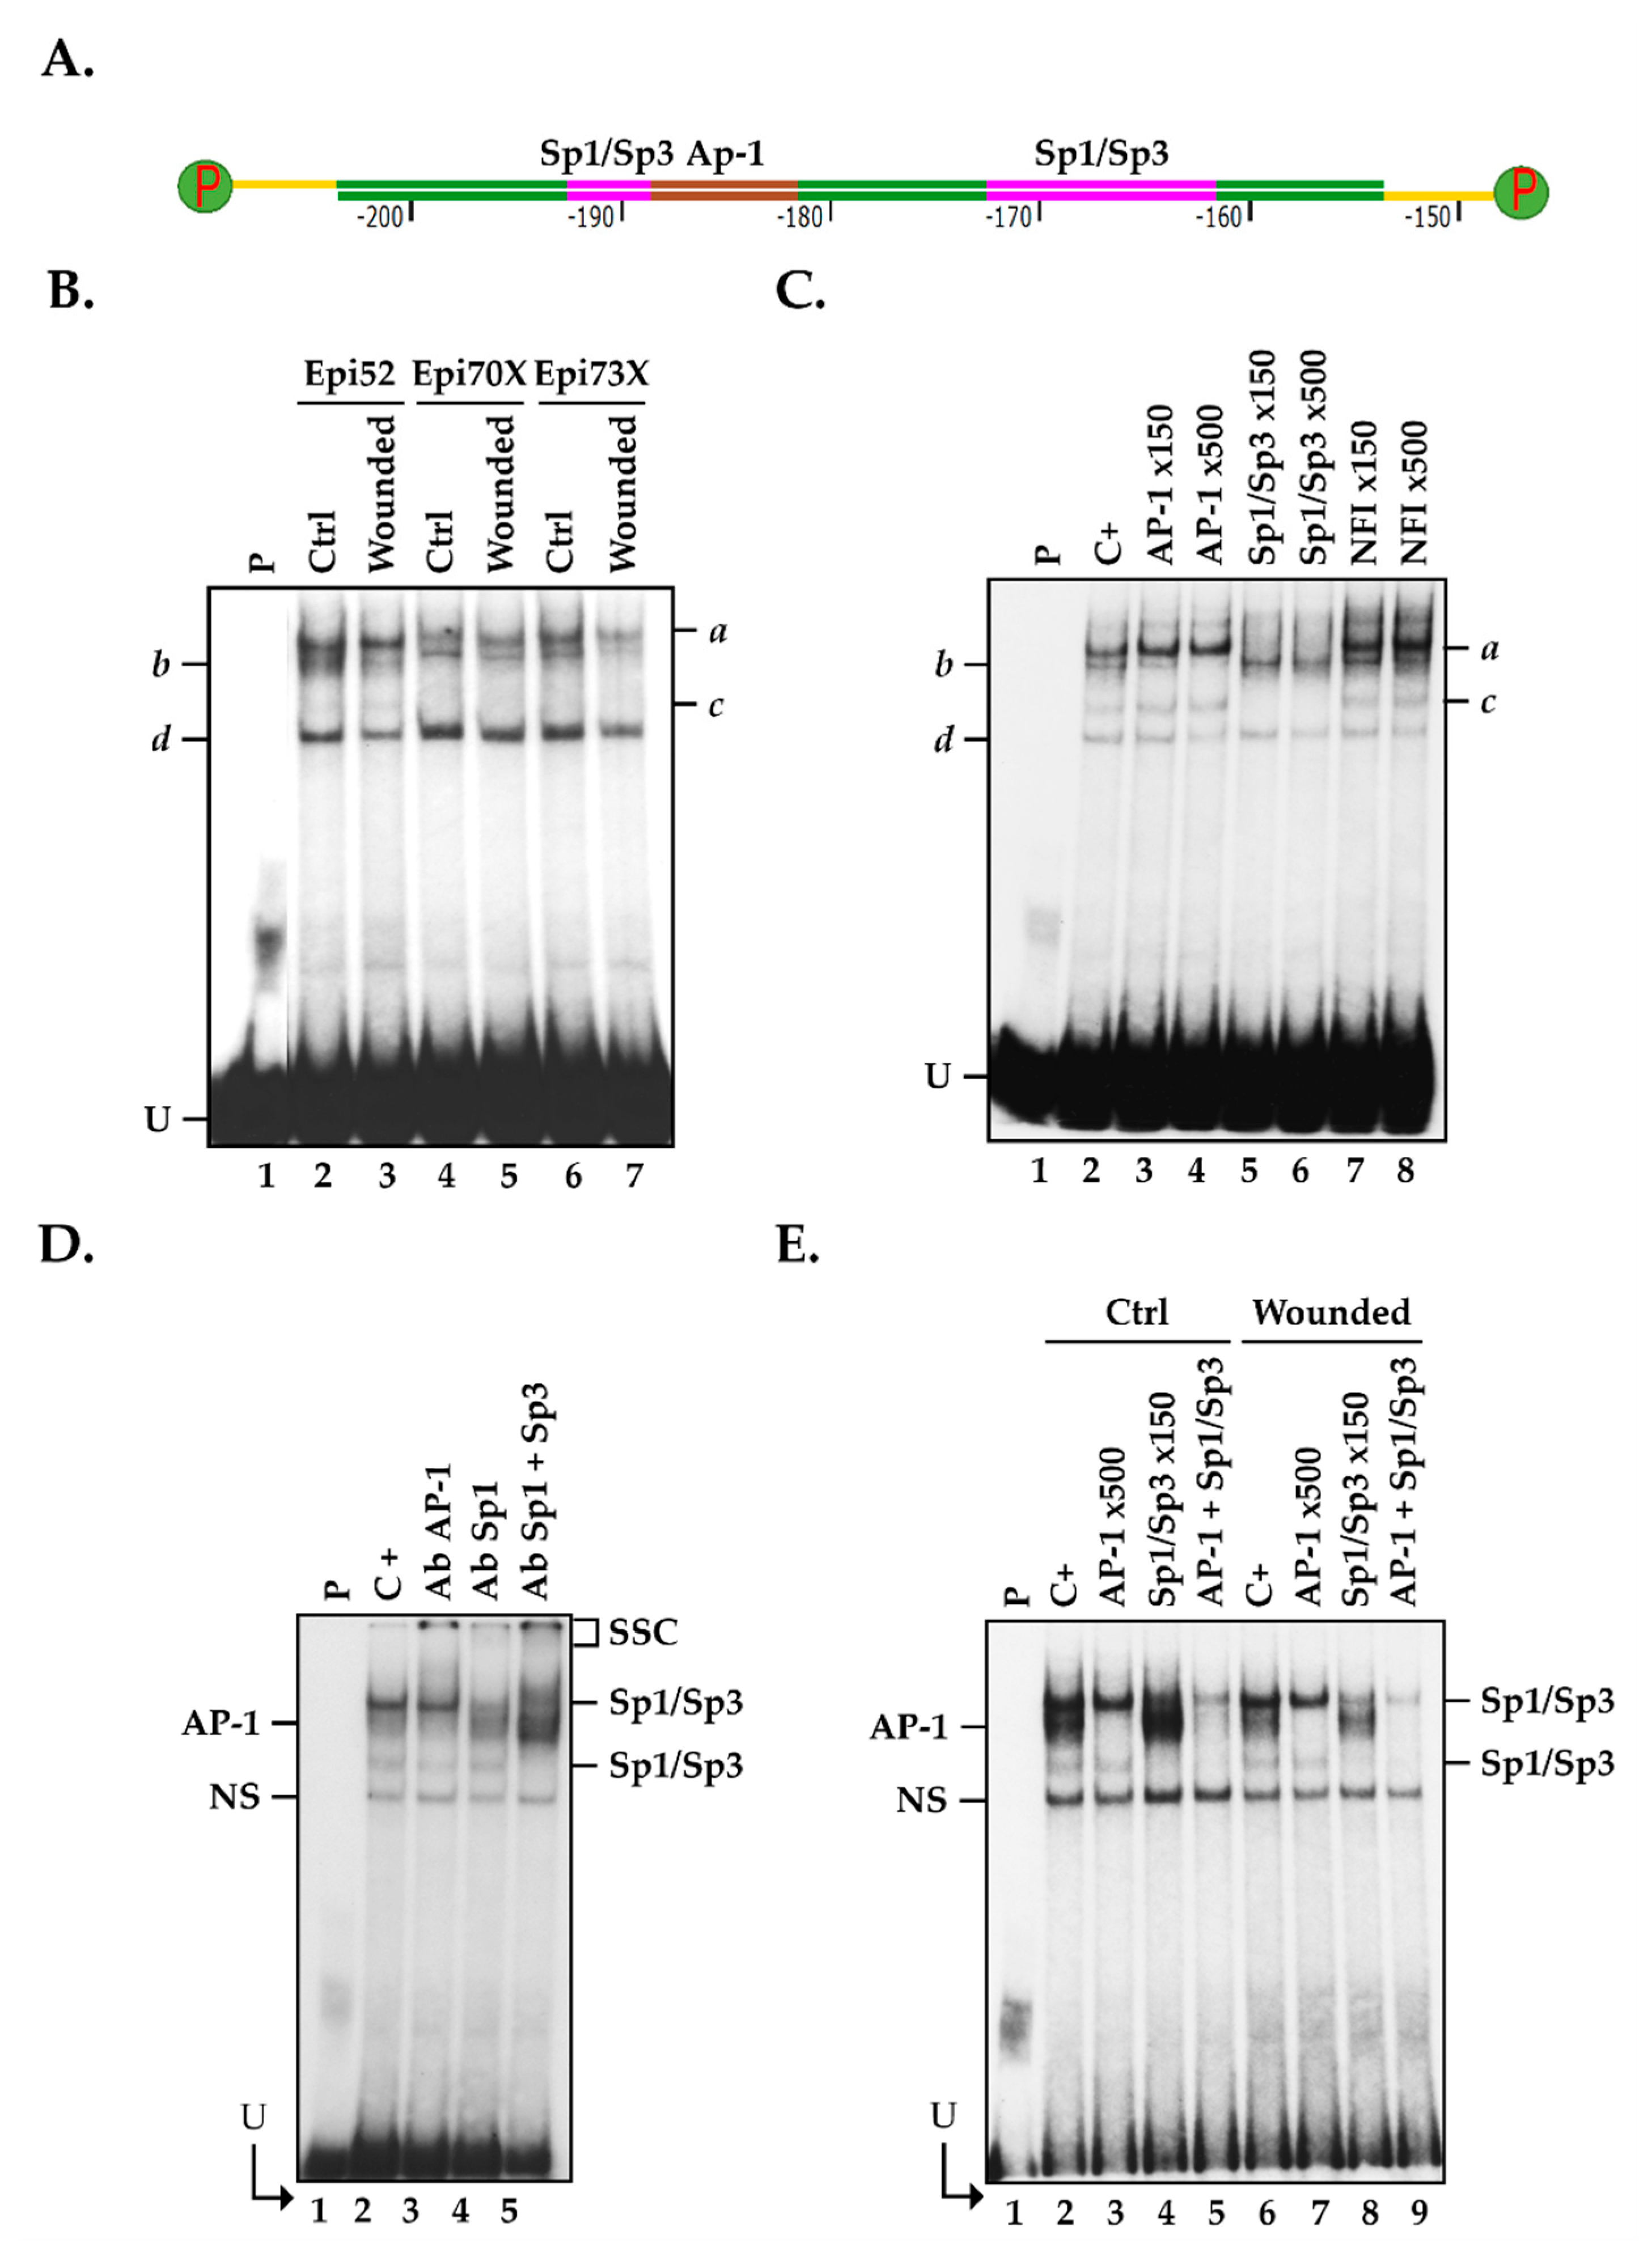
2.4. Members from the AP1 and Sp1 Families Bind to the CLU Basal Promoter in hCECs

The -82/-203 basal promoter segment bears DNA binding sites for very potent transcriptional activators: AP-1 and Sp1/Sp3 (identified along the CLU promoter in Figure 3A). To assess whether AP-1 and Sp1/Sp3 can indeed bind to the CLU promoter in vitro, nuclear extracts were prepared from three populations of hCECs (hCECs-52, hCECs-70X and hCECs-73X) and used in electrophoretic mobility shift assay (EMSA). To that purpose, we 5′end-labeled a 50 bp, double-stranded oligonucleotide bearing the CLU gene promoter sequence from positions -153 to -203 (CLU -203/-153) that also bears both the AP-1 and Sp1/Sp3 putative target sites (Figure 4A), and incubated this labeled probe with nuclear proteins from all populations of hCECs. Separation of the reaction mixtures on EMSA revealed the formation of four DNA-protein complexes on gel (a to d; Figure 4B). Although equal amounts of nuclear proteins (15 μg) were used for the assay, the extract isolated from wounded hCECs (Wounded) yielded weaker DNA-protein signals on gel (Figure 4B). Addition of either a 150- or 500-fold molar excess of an unlabeled, double-stranded oligonucleotide bearing the high affinity prototypical DNA binding site for AP-1 entirely eliminated formation of complex b (when a 500-fold excess is used), whereas a similar unlabeled oligomer bearing the high affinity binding site for Sp1/Sp3 entirely prevented that of complexes a and c (Figure 4C). On the other hand, a similar oligomer bearing the high affinity target site for the unrelated Nuclear Factor I (NFI) transcription factor did not alter the formation of any of these complexes, even when used at a 500-fold molar excess. These results demonstrate that the TFs AP-1 and Sp1/Sp3 are constituents of complex b and both complexes a and c, respectively. The significant reduction in the formation of both the AP-1 and Sp1/Sp3 complexes combined to the formation of new, slow-migrating supershifted complexes (SSC) upon addition of a polyclonal antibody that recognizes AP-1 (lane 3), Sp1 (lane 4), or the combination of both Sp1 and Sp3 (lane 5), provided evidence that formation of complexes b and a/c resulted from the recognition of the CLU-203/-/53 labeled probe by AP-1 and Sp1/Sp3, respectively (Figure 4D). Formation of complex d results from the recognition of the labeled probe by non-specific DNA binding proteins, as is often observed in EMSA [17,18,52,53,54,55,56,57].
We next examined whether formation of both the AP-1 and Sp1/Sp3 complexes was altered in scratch-wounded relative to unwounded hCECs grown as monoloyers. As shown in Figure 4E, addition of the unlabeled Sp1/Sp3 oligonucleotide indeed reduced binding of Sp1 but also caused an increased recognition of the labeled probe by AP-1 when nuclear proteins from unwounded hCECs were used (compare lane 2 with lane 4) but not those from scratch-wounded hCECs (compare lane 6 with lane 8). On the other hand, formation of the Sp1/Sp3 complexes was not affected when AP-1 was totally prevented from interacting with the labeled probe by the addition of the AP-1 unlabeled competitor, irrespective of the conditions used (wounded or unwounded hCECs; compare lane 2 with lane 3 and lane 6 with lane 7). Furthermore, incubation of nuclear extracts with both the unlabeled AP-1 and Sp1/Sp3 oligonucleotides almost entirely prevented formation of their respective DNA-protein complex in EMSA (compare lane 2 with lane 5, and lane 6 with lane 9). Interestingly, there is a marked decrease in AP-1 DNA binding when hCECs are wounded, relative to unwounded cells, irrespective of whether Sp1 is prevented from interacting with its target site (by competing with the unlabeled Sp1 oligomer; compare lanes 4 and 8) or not (compare lane 2 and 6), despite that identical amounts of nuclear proteins were used in EMSA. These results, therefore, suggest that Sp1/Sp3 competes with AP-1 for the recognition of the CLU gene promoter and that Sp1/Sp3 has a stronger binding affinity to its CLU target site than AP-1 does in HCECs.

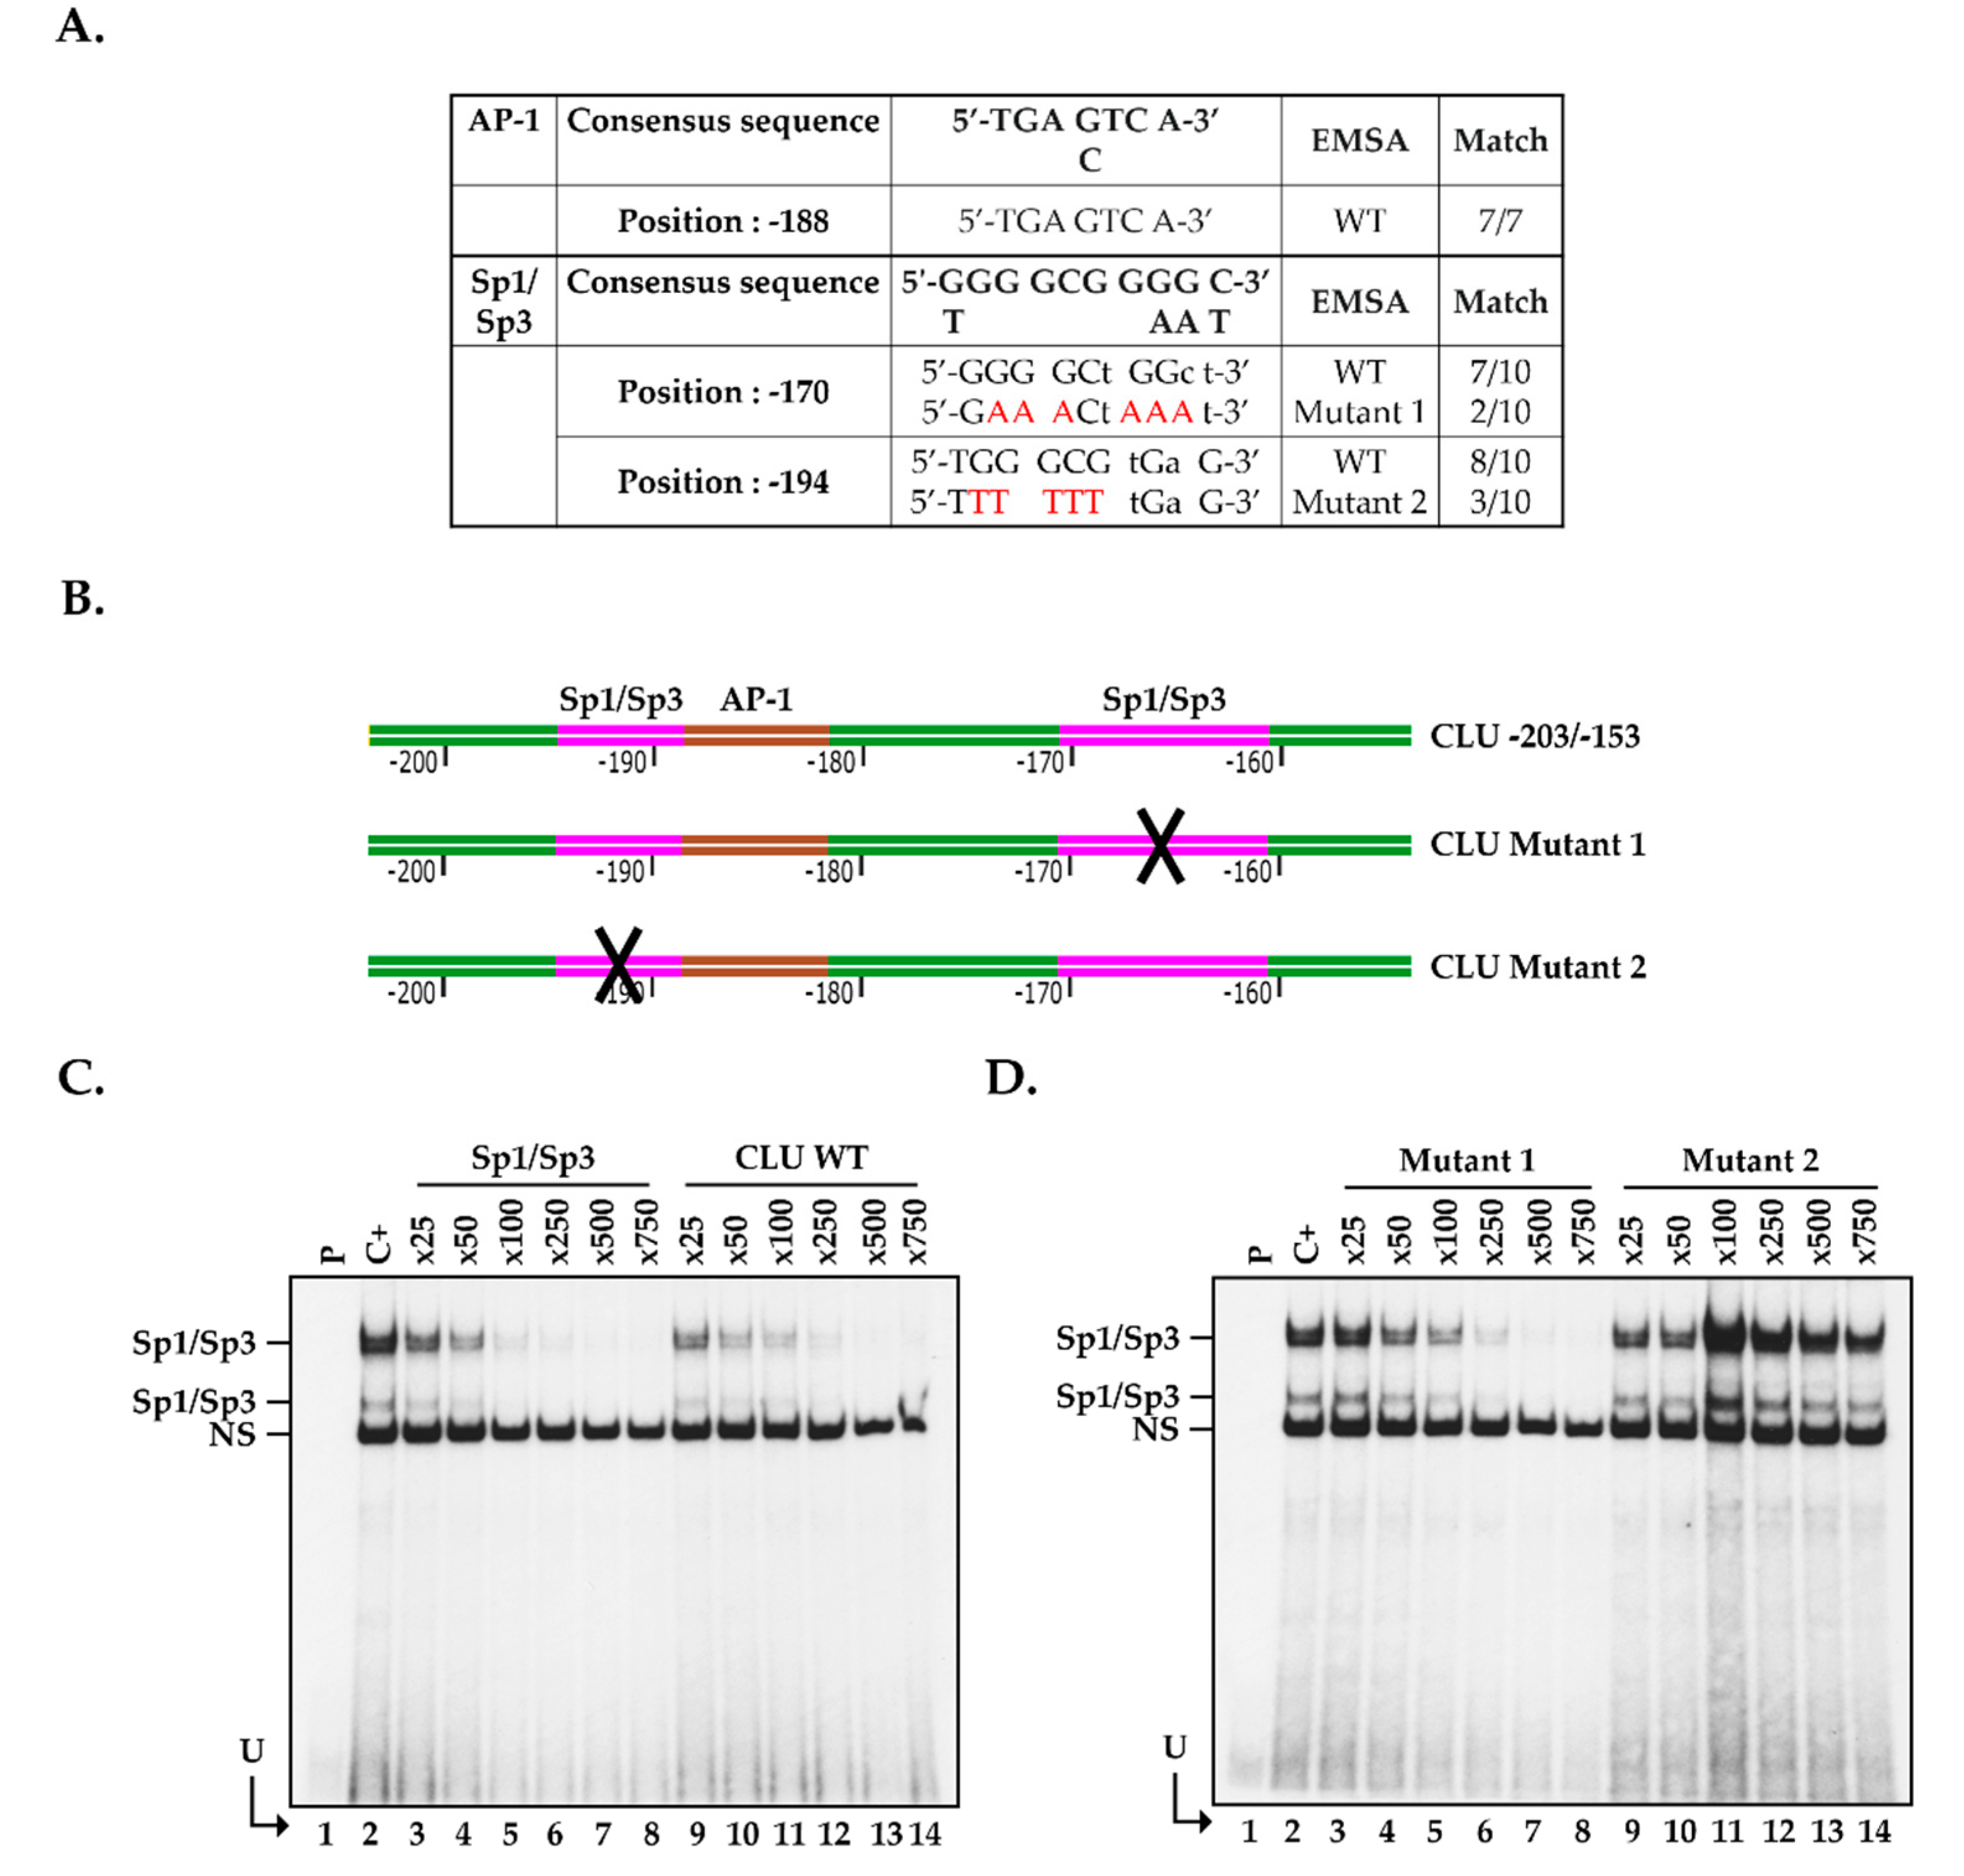
2.5. Positioning of the Functional Sp1/Sp3 Binding Site in the CLU Promoter In Vitro

The -203/-153 segment from the CLU basal promoter bears two putative Sp1/Sp3 target sites (located at positions -194 and -170 relative to the CLU mRNA start site). The -194 Sp1/Sp3 binding site is, therefore, located very close to the AP-1 target site (located at position -188) and shares 8 nucleotides out of the 10 with those typically found in the prototypical Sp1/Sp3 target site (Figure 5A). In order to determine which of the -194 or -170 Sp1/Sp3 sequence indeed binds this TF, we generated double-stranded oligonucleotides in which most of the G residues from both the -194 and -170 Sp1/Sp3 target sites were replaced by Ts (Figure 5A,B) and used them as unlabeled competitors in EMSA. To that purpose, and to avoid any interference from AP-1, we 5′end-labeled a 25 pb oligomer bearing only the high affinity, Sp1/Sp3 prototypical target site (Supplementary Table S1) and used it as the labeled probe in EMSA. As shown in Figure 5C, incubation of this labeled probe with nuclear proteins from control hCECs yielded the formation of the typical Sp1/Sp3 DNA-protein complexes in EMSA (lane 2) [52,53,54,55,56,57]. As expected, the addition of increasing amounts (25- to 750-fold molar excesses; lanes 3 to 8) of the unlabeled high-affinity Sp1/Sp3 oligomer very efficiently competed for the formation of the Sp1/Sp3 complexes on gel, a 500-fold molar excess of the unlabeled competitor (lane 7) being sufficient to entirely prevent their formation. As shown in Figure 5C (lanes 9 to 14), competing with identical amounts of the CLU -203/-153 oligomer that bears both the CLU putative Sp1/Sp3 and AP-1 sites proved as efficient as the prototypical Sp1/Sp3 oligomer to compete for the formation of the Sp1/Sp3 complexes in EMSA. Interestingly, the addition of 50- to 750-fold molar excesses of the CLU oligomer that bears mutations in the -170 Sp1 site (CLU Mutant 1; Figure 5D, lanes 3 to 8) was also as effective, as both the high affinity Sp1 and CLU-203/-153 oligomers to compete for the formation of the Sp1/Sp3 complexes. On the other hand, the oligomer bearing the mutated -194 Sp1/Sp3 binding site was totally unable to compete for the formation of these complexes (CLU/Mutant 2; Figure 5D, lanes 9–14). These results clearly identify the -194/-185 segment of the CLU promoter as the preferred target site for Sp1/Sp3. They also demonstrate that AP-1 and Sp1/Sp3 share overlapping binding sites on the CLU gene basal promoter, which is consistent with the observations shown in Figure 4C.

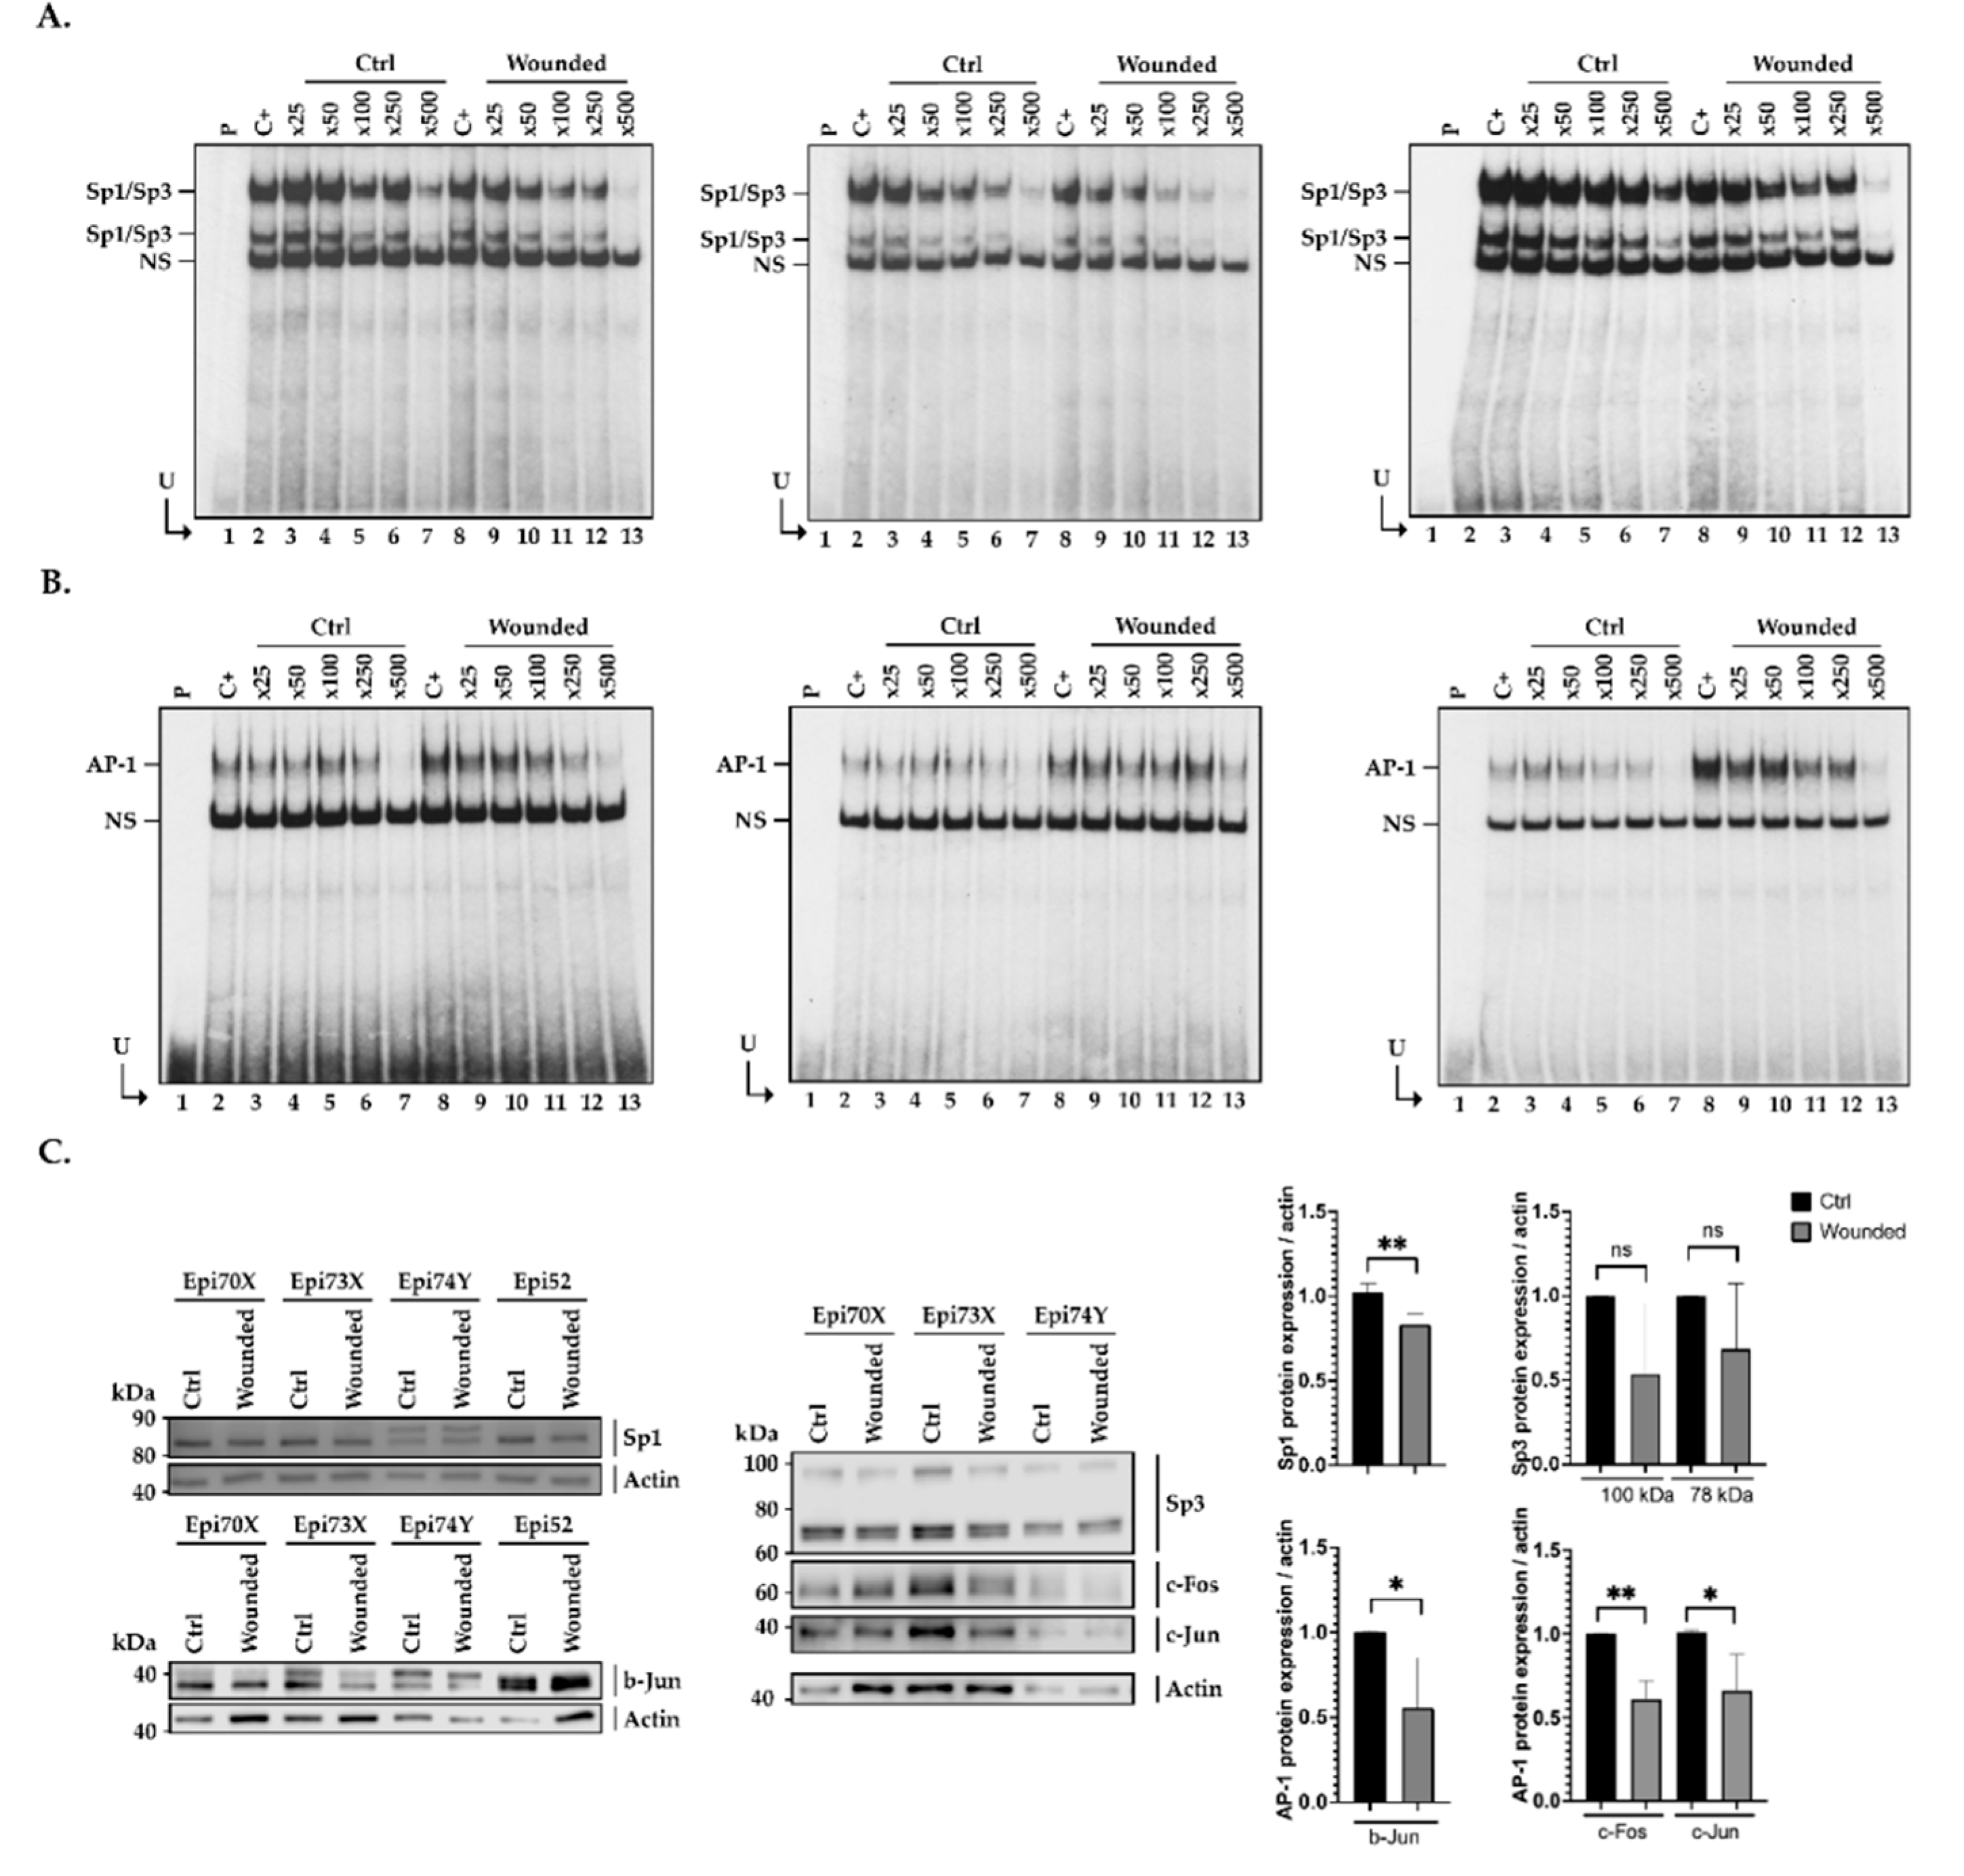
2.6. Influence of Cell Damage on the Binding of Sp1/Sp3 to the CLU Promoter in hCECs

Examination of Figure 4 revealed a weaker formation of the Sp1/Sp3, but especially of the AP-1 complex in wounded hCECs compared to the control condition when the CLU-203/-153 oligomer is used as the labeled probe in EMSA. We again exploited the EMSA to determine whether the Sp1/Sp3 affinity for its prototypical sequence is influenced by a context of injury. To achieve this goal, nuclear proteins isolated from control (Ctrl) or scratch-wounded (Wounded) hCECs were incubated with the Sp1/Sp3 or AP-1 high affinity labeled probes, either alone (C+) or in the presence of increasing amounts of unlabeled competitors (Sp1/Sp3, CLU-203/-153 or CLU/Mutant 2) and the formation of DNA-protein complexes monitored by EMSA. Incubation of nuclear proteins from control (Ctrl) and damaged (Wounded) hCECs with either the Sp1/Sp3 (Figure 6A) or AP-1-labeled probe (Figure 6B) yielded to the formation of the typical Sp1 and AP-1 complexes, respectively (lanes 2 and 8 of each gel). In both cases, the addition of increasing amounts of unlabeled TFs specific oligonucleotides (respectively Sp1/Sp3 in the left panel of Figure 6A and AP-1 in the left panel of Figure 6B) progressively prevented the formation of both TF DNA-protein complexes to reach almost complete disapearence when a 500-fold molar excess of competitor is used. Similarly, both Sp1/Sp3 and AP-1 were efficiently competed by increasing molar excesses of unlabeled CLU-203/-153 (middle panels in Figure 6A,B for Sp1/Sp3 and AP-1-labeled probes, respectively). As observed in Figure 5D, the CLU/mutant 2 unlabeled oligomer was inefficient at competing the Sp1/Sp3 complex formation in the control condition (Ctrl) (lanes 2 to 7, right panel in Figure 6A), whereas it was very effective at competing for the formation of the AP-1 complex (lanes 2 to 7, right panel in Figure 6B). Interestingly, in each acquisition with the Sp1/Sp3-labeled probe (Figure 6A), we observed a stronger, more intense signal for the DNA-protein complexes in the control (Ctrl) than in the injured condition (Wounded). Indeed, the addition of a 500-fold molar excess of the unlabeled Sp1/Sp3 (left panel, Figure 6A) or CLU-203/-153 oligomers (middle panel, Figure 6A) entirely prevented the formation of the TFs complexes in the wounded but not the control condition (compare lane 7 and 13). In contrast, the AP-1-labeled probe clearly yielded weaker formation of the AP-1 complexes in the control condition compared to damaged cells (Figure 6B). Indeed, the addition of a 500-fold molar excess of either unlabeled AP-1 (left panel) or CLU-203/-153 (middle panel) completely inhibited formation of the AP-1 complex in the control condition, whereas it is still present (although reduced) in the wounded condition (compare lane 7 and 13). As the CLU/mutant 2 oligomer bears a mutated Sp1/Sp3 site but has an intact AP-1 site, it competed (right panel) as efficiently as the high affinity AP-1 competitor (left panel) for the binding of this TF. In addition, one can clearly appreciate the much stronger binding of AP-1 to the labeled probe when equal amounts of nuclear proteins from wounded hCECs are used relative to those from control cells (compare lanes 2 to 7 with lanes 8 to 13).
We next monitored the expression of both Sp1/Sp3 and AP-1 at the protein level by Western blot in nuclear extracts prepared from both unwounded and scratch-wounded hCECs using antibodies specific to both Sp1 and Sp3, and the c-Fos, c-Jun and b-Jun AP-1 isoforms. As shown in Figure 3B, the mRNA transcripts encoding all these TFs are expressed in hCECs. Surprinsingly, although c-Fos, c-Jun and b-Jun mRNA expression is increased after hTECs injury (Figure 3B), expression of these proteins is, on the other hand, reduced under this cell culture condition, therefore suggesting that the steady-state level of the AP-1 isoforms is likely subjected to post-translational regulation (Figure 6C). On the other hand, and as observed for their corresponding mRNA transcripts, expression of both the Sp1 and Sp3 proteins is reduced in wounded hCECs (Figure 3B).

3. Discussion

Due to its anatomical localization, the cornea is the first structure of the eye to be altered by external (chemical, thermal, biological or physical) aggressions. In the most severe cases, a medical treatment with anti-inflammatory and/or pro-healing substances is not sufficient and corneal transplantation or eye enucleation may even be required. In 2012, it was estimated that 12.7 million people were waiting for a corneal transplantation worldwide. Unfortunately, only 185,000 corneal transplantations could be performed in the world that same year, covering the needs of a mere 1 in 70 patients [58]. Therefore, in order to reduce the needs for donor corneas, the use of an entirely tissue-engineered human cornea (hTECs) that can be used as a model to study the mechanisms of wound healing is of prime importance, as it may help develop alternative solutions to the need of graftable, donor corneas. Over the last 20 years, we succeeded in producing a human tissue-engineering corneal substitute (hTEC), which, besides being devoid of any synthetic materials, exhibits a well-developed stratified epithelium made up of 5–7 layers of untransformed human corneal epithelial cells (hCECs) and a stroma. Because of these similarities with the native cornea, our hTEC represents an outstanding model that we can exploit to study in detail the cellular and molecular mechanisms of corneal wound healing as a prerequisite to further studies in animals [9,11].
In the present study, we identified the CLU gene as among the most severely deregulated genes during wound healing of hTECs. Western blot analyses carried out both on hCECs (2D model) and hTECs (3D model) present similar trends, with the reduction being more significant in the hTECs. Considering the predominant role of the ECM during corneal repair and that some links have been established between CLU and ECM components [59,60,61], these results are not that surprising. CLU involvement in cell adhesion, migration and proliferation is now broadly accepted, but the molecular basis of its regulation remains elusive. Indeed, CLU negatively regulates fibronectin and type I collagen expression [59]. Therefore, its down-regulation following hTEC injury is consistent with the well-known fibronectin increase that occurs early during the healing process [62,63]. MMP expression is also profoundly altered in response to the changes in the ECM composition (such as a reduction of fibronectin) that occurs during corneal wound healing [64]. Our gene-profiling analyses revealed that MMP-9 and MMP-10 are among the 54 most differentially expressed genes with a robust increase of their expression in the wounded condition (Figure 1B). Interestingly, clusterin has been reported to interact with MMP-9 to inhibit MMP-9-mediated breakdown of the tight junctions between human epithelial cells [60]. Therefore, the decreased clusterin expression observed in the wounded area correlates with the increased expression of MMP-9 and MMP-10 (Figure 1B), which is also consistent with both the proper ECM remodeling and cell migration that takes place in order to regenerate the corneal layer. On the other hand, collagen facilitates CLU gene expression [65]. Again, the reduction of collagen expression that typically occurs early during corneal wound healing [62] is consistent with the decreased expression of clusterin, as demonstrated in our study, and suggests a possible regulatory feedback loop between ECM components and CLU expression.
Transfection analyses revealed that one positive and two negative (a strong and a moderate one) regulatory regions are present along the CLU gene promoter and 5′-flanking region (Figure 2C). Among reports identifying TF binding sites along the CLU gene promoter [37,38], only a few characterized the regulatory sequences needed to ensure proper transcription of the CLU gene [39,40,41,42,43,44,45,46]. However, none of them have been done in the context of human wound healing of the cornea. The proximal element identified in our study (-82/-203) bears target sites for TBP (TATA-binding protein), AP-1 and both the Sp1 and Sp3 family members (Figure 3A), which we are very familiar with [11,17,18,53,66]. We demonstrated that CLU gene transcription was indeed ensured in part by the binding of the TFs Sp1/Sp3 and AP-1 to overlapping target sites within the basal promoter segment CLU -203/-153. While AP-1 has a stronger regulatory influence than Sp1/Sp3, these latter, however, have a clearly greater affinity for their target site than AP-1. Interestingly, both Sp1/Sp3 expression (Figure 6C) and DNA binding (Figure 6A) to the CLU basal promoter were decreased in context of injury. This result is consistent with the regulation of CLU expression observed on microarrays (Figure 1B) and western blot analysis (Figure 1C) during wound healing when one considers that Sp1/Sp3 is a well-known transcriptional activator. The fact that TFs expression was evaluated in nuclear extracts obtained from hCECs and not in hTECs must be taken into consideration. According to the previous observations that showed a more robust CLU regulation after wounding in hTECs compared to hCECs, it is, therefore, not surprising that the impact of Sp1/Sp3, but also AP-1, on CLU gene expression was also relatively moderate in hCECs. Our results demonstrated that AP-1 binds to the CLU -203/-153 region (Figure 6B) without distinguishing the AP-1 subunits involved in this complex formation. Surprisingly, while microarray (Figure 3B) and EMSA analysis revealed a greater binding of the AP-1 subunit on DNA in wounded cells (Figure 6B), protein analysis revealed a decrease in c-Fos, b-Jun and c-Jun expression (Figure 6C), which can be explained by three mains hypotheses. First, Jun proteins can associate between each other to form homo- and hetero-dimers, whereas Fos proteins can only heterodimerize. Heterodimers, such as c-Jun/c-Fos, are more stable and have a greater transcriptional activity [67,68]. Thus, the dimerization partners of Jun subunits impact on its role in gene activation and cell cycle regulation [69,70]. Jun and Fos families positively regulate cell proliferation, whereas b-Jun inhibits proliferation. This effect of b-Jun is probably mediated by its ability to dimerize with c-Fos, the b-Jun/c-Fos heterodimer often being reported to repress gene transcription [71,72,73]. According to our gene profiling analysis (Figure 3B), important changes in the pattern of AP-1 subunit gene expression occurs between unwounded and wounded hTECs. Indeed, expression of JUN (c-Jun), FOS (c-Fos) but most particularly JUNB (b-Jun) is considerably increased in the context of wound healing. The EMSA analysis also revealed an increase of AP-1 complexes formation in the context of an injury (Figure 6B). Therefore, it is most likely that wounded and unwounded hTECs could express AP-1 proteins made up of different constituting subunits that then reorganized (with the disappearance of b-Jun, c-Jun and c-Fos subunits heterodimers) upon complete closure of the wounds. Regarding their function, this imbalance during wound healing could reduce the transactivator potential of AP-1, which is consistent with the decrease in the CLU gene expression we observed.
The fact that expression of the AP-1 subunits c-Fos, b-Jun and c-Jun at the protein level (all reduced in wounded hCECs) does not correlate with their corresponding mRNA expression at the transcriptional level (which are abundantly expressed in hTECs) is not unusual, as such discrepancies between expression of a specific gene at the mRNA and protein levels are common. It is well-known that AP-1 TFs are subjected to a variety of post-translational modifications, such as protein phosphorylation, glycosylation or ubiquitinylation, which can alter their activity, stability, localization and DNA-binding properties [74,75,76,77,78,79], and may, therefore, contribute to the differences observed in wounded cells (Figure 6B). C-Fos, c-Jun and FOSL2 have all been reported to be degraded by the proteasome [78,79]. Interestingly, c-Fos is degraded by the proteasome independently of its own ubiquitination level [75], whereas c-Jun is only degraded in an ubiquitin-dependent manner [77]. Recent evidences also suggest that the c-Jun/c-Fos dimer can be degraded through the SUMO pathway [76]. Alternatively, it is well-known that the protein product of some genes negatively regulates their own transcription through a negative feedback loop mechanism that often involves a specific microRNA (miRNA) [80].
Finally, we demonstrated that the CLU -203/-153 promoter segment preferentially binds Sp1/Sp3 rather than AP-1. In the context of healing, Sp1/Sp3 is decreased while AP-1 is increased (Figure 6A,B). These results can be the consequence of modifications in the TFs affinity for the CLU promoter and can be explained by the expression of a wound healing-dependent AP-1 co-activator that would facilitate the recruitment of AP-1 to the CLU promoter. Indeed, AP-1-dependent gene expression is regulated by a combination of various AP-1 activators, general or basal transcription initiation factors and associated cofactors. Basal transcription by RNA polymerase II requires at least six general transcription initiation factors: TFIIA (Transcription Factor IIA), TFIIB, TFIID, TFIIE, TFIIF and TFIIH. AP-1, in particular its c-Fos-constituting isoform, has been shown to interact with both TBP (TATA binding protein) and TFIIB [81]. However, this transcriptional activation is relatively weak and needs additional transcriptional coactivators to be enhanced. Three types of proteins are among the best characterized AP-1 co-activators: CBP (CREB-binding protein), JAB1 (Jun activation domain-binding protein 1) and alpha-NAC (Nascent polypeptide associated complex And Coactivator alpha). Functional assays using transient transfection confirmed that CBP stimulates the activity of c-Jun, b-Jun and v-Jun in vivo [82], but also c-Fos [83]. Although Jun coactivation by CBP requires phosphorylation events [84], interaction of JAB1 with Jun does not require phosphorylation but remains subunit-dependent [85]. Alpha-NAC was also shown to potentiate the activity of the homodimeric c-Jun activator, while transcription mediated by the c-Fos/c-Jun heterodimer was unaffected [86]. More recently, a few more studies further identified novel AP-1 co-activators. For instance, the dimeric RACO-1 protein was identified as a c-Jun coactivator, and both YAP (Yes-associated protein) and TAZ (Transcriptional activator with PDZ domain) proteins as b-Jun co-activators required for transcriptional activation by AP-1 [87,88]. As both YAP and TAZ were recently found to be key mediators of the wound healing and tissue regeneration responses to tissue damage [89], it would prove particularly interesting to determine whether both these proteins are expressed in the hTEC and if their expression is affected by wound healing in this biological model.
Most DNA target sites identified in the distal silencer (-1424/-2000) by the TFSEARCH analysis have been reported to bind TFs such as AREB6, ARP-1, Bach1 and Evi1 (Supplementary Table S2), which have been reported to function as transcriptional repressors [90,91,92,93,94,95]. Therefore, the repressive action of these TFs, once they have bound to their target sites in the CLU silencer, may, at least in part, contribute to the differential expression observed for the CLU gene in our hTEC model. To support this idea, we searched our microarray data files to define whether these TFs are expressed in our tissue-engineered model. Although each of them is expressed in our hTECs, no significant variation in the expression of these TFs between unwounded and wounded hTECs was observed (Supplementary Figure S1). Further studies will be required in order to demonstrate the binding of some of these negative TFs to the CLU distal silencer and whether they indeed contribute to the repression of CLU gene expression during hTEC wound healing.

4. Materials and Methods

This study was conducted in accordance with our institution’s guidelines and the Declaration of Helsinki. The protocols were approved by the CHU de Québec—Université Laval hospital and Université Laval Committee for the Protection of Human Subjects (DR-002-955 / Modification F1-47318).

4.1. Cell Culture—Human Epithelial Cells (hCECs)

Human corneal epithelial cells (hCECs) were isolated from the limbal area of normal eyes (obtained from the Banque d’Yeux Nationale of the Centre Universitaire d’Ophtalmologie; CHU de Québec, Hôpital du Saint-Sacrement, Québec, QC, Canada) of 52-, 70-, 73- and 74-year-old donors as previously reported [9,16,55]. hCECs (seeded at 5 × 10⁵ cells/T75 flask) were cultured with a feeder layer of irradiated human fibroblasts (iHFLs). iHFLs were isolated from the foreskin of a 10-day-old donor and cultured in DH medium (Dulbecco-Vogt modification of Eagle’s medium with Ham’s F12 at a 3:1 ratio) with supplements (5% Fetal Clone II serum, 5 μg/mL insulin, 0.4 μg/mL hydrocortisone, 10 ng/mL epidermal growth factor, 10−10 mol/L isoproterenol, 100 μg/mL Penicilin, and 25 μg/mL Gentamycin) at 4.5 × 10⁵ cells/T75 flask, as recently described [96]. All cells were grown under 8% CO2 at 37 °C and culture medium was changed three times a week [9]. At each passage, cell number was counted with a Beckman Coulter. hCEC-52, hCEC-70X, hCEC-73X and hCEC-74Y (5 × 10⁵ cells) were each plated in duplicates (for total proteins extraction) or quadruplicate (for nuclear proteins extraction) with iHFLs (4.5 × 10⁵ cells) in 100 cm2 tissue-culture dishes in complete DH medium. When cells reached confluence, eight scratches (four horizontal and four vertical) were created in the center of the plate using a P1000 pipet tip (Sarstedt, Nümbrecht, Germany). Wound closure was monitored and cells were then harvested to proceed immediately to extraction of the nuclear proteins.

4.2. Human Tissue-Engineered Cornea (hTEC)

hTECs were produced according to the self-assembly approach [9,13,16]. Human corneal fibroblasts were isolated from the stromal portion of a cornea (from a 26-day-old donor), left after dispase digestion and removal of both the endothelium and epithelium and primary cultured and sub-cultured as previously reported [9,16]. Human skin fibroblasts were obtained from the dermal portion of adult breast skin and were cultured as described previously [9,97]. Briefly, corneal and dermal fibroblasts were seeded and cultured in fibroblast growth medium (Dulbecco modified Eagle medium—DMEM—supplemented with 10% fetal calf serum, 25 µg/mL Gentamycin and 100 µg/mL Penicillin) and prompted to lay down their own ECM by the further addition of 50 mg/mL ascorbic acid (Sigma, Oakville, ON, Canada) for 28–35 days, as previously described [9,13,15]. After peeling from the flasks, two tissue sheets were superimposed to form a reconstructed stroma and were cultured for another week so that they could adhere to each other. Then, human corneal epithelial cells (hCECs) were seeded on the surface of the reconstructed stroma and cultured in submerged conditions in complete epithelial cell medium (DH medium) supplemented with ascorbic acid. After 7 days, reconstructed tissues were fed an EGF-free epithelial cell medium and were raised at the air-liquid interface for 7 days to induce epithelial differentiation. Reconstructed partial thickness corneas produced by the self-assembly approach were then wounded using an 8-mm biopsy punch. After wounding, the tissue-engineered corneas were placed over two supplementary fibroblast sheets to allow reepithelialization over a natural matrix. Wound closure was then examined macroscopically every 24 h for 4 days following the initial damage by observing the ring of reepithelialization that progressed toward the wound center using a Zeiss Imager.Z2 microscope (Zeiss Canada Ltd., North York, ON, Canada) equipped with a numeric CCD camera (AxioCam MRm; Zeiss). All experiments were repeated four times. Epithelial tissues from the central area of both wounded and unwounded (used as negative controls) hTECs were harvested 4 days post-wounding to collect proteins required for western blot analyses.

4.3. Gene Expression Profiling

Microarray analyses were conducted by the gene profiling service of the CUO-Recherche (Québec, QC, Canada), as done previously [11]. As biological replicates, total RNA was obtained from three different populations of HCECs (44, 52 and 71 years old). Total RNA was isolated from the epithelial cells isolated from the central area of both wounded and unwounded (used as negative controls) hTECs using the RNeasy Mini Kit (QIAGEN,Toronto, ON, Canada) and its quality determined (2100 bioanalyzer, Agilent Technologies, Mississauga, ON, Canada) as recently described [11]. Because corneal fibroblasts are much less abundant (36.2+/−1.0%) than epithelial cells (63.9+/−0.9%) in the hTECs and as they are trapped in the stromal collagen matrix and not mitotically active, they will not significantly contribute to the total RNAs isolated, as nearly all of it will originate from the epithelial cells. Labeling of cyanine 3-CTP labeled targets, their hybridization on a G4851A SurePrint G3 Human GE 8 × 60Karray slide (Agilent Technologies) and data acquisition and analyses were all done as previously reported [11] (GSE #75336). All data generated from the arrays were also analyzed by robust multi-array analysis (RMA) for background correction of the raw values. They were then transformed in Log2 base and quantile normalized before a linear model was fitted to the normalized data to obtain an expression measure for each probe set on each array. Scatter plots and heat maps were generated using the ArrayStar V4.1(DNASTAR, Madison, WI, USA) software. All microarray data presented in this study comply with the Minimum Information About a Microarray Experiment (MIAME) requirements (GEO# GSE75336; https://0-www-ncbi-nlm-nih-gov.brum.beds.ac.uk/geo/query/acc.cgi?acc=GSE75336; last accessed date: 15 November 2021).

4.4. Western Blot Analyses

Extraction of proteins from both wounded and unwounded hTECs and hCECs was performed in TGNT lysis buffer and protein concentration evaluated by the Bradford procedure and further validated following Coomassie Blue staining of SDS-polyacrylamide fractionated nuclear proteins. Western blots were conducted as described [54] using the following primary antibodies: rabbit polyclonal antibodies against CLU (1:500; Santa Cruz Biotechnology, Dallas, TX, USA; detects endogenous levels of sCLU, nCLU and cCLU), Sp1 (1:250; Abcam Inc., Toronto, ON, Canada), Sp3 (1:1000; Santa Cruz Biotechnology), c-Fos (1:1000; Santa Cruz Biotechnology), b-Jun (1:200; Santa Cruz Biotechnology), c-Jun (1:1000; Santa Cruz Biotechnology), actin (1:40,000; Santa Cruz Biotechnology) and a peroxidase-conjugated AffiniPure Goat secondary antibody against mouse and rabbit IgG (1:2500; Jackson Immuno Research Laboratories, Baltimore, PA, USA). Blots on CLU were realized using total proteins while those for the evaluation of transcription factors (Sp1, Sp3, cFos, b-Jun and cJun) were obtained with the same nuclear extracts as those used for EMSA. The labeling was revealed using a ECL Detection Kit (Amersham, Baie d’Urfé, QC, Canada) as described [52,57]. Measurement of the densitometric intensity of the protein bands was determined and normalized to that of the corresponding actin band with the Image Studio Lite software (Image Studio Lite version 5.2.5, LI-COR Biosciences, Lincoln, NE, USA).

4.5. Plasmid Constructs and Oligonucleotides

The details regarding the production of the different recombinant plasmids used in this study are provided in the Supplementary Materials. The double-stranded oligonucleotides used either as labeled probes or unlabeled competitors in the EMSAs were chemically synthesized using a Biosearch 8700 apparatus (Integrated DNA Technologies, Inc., Coralville, WA, USA). Their DNA sequences are listed in Supplementary Table S1.

4.6. Transient Transfection and CAT (Chloramphenicol Acetyl Transferase) Assays

All CLU/CAT recombinant plasmids were transiently transfected into primary cultured hCECs (hCEC-52, hCEC-70X and hCEC-73X plated in triplicates) grown to sub-confluence (70% coverage of the culture plate) into 6-well tissue-cultured plates using the Viafect Transfection Regent (Promega North America, Madison, WI, USA). Each tissue-cultured well received 1.5 μg of the test plasmid and 0.5 μg of the hGH-encoding plasmid PXGH5. All cells were harvested 48 h following transfection and CAT activities were determined and normalized to both the hGH secreted in the medium and total proteins, as previously described [98].

4.7. Preparation of Nuclear Extracts and Electrophoretic Mobility Shift Assays (EMSA)

hCECs (hCEC-52, hCEC-70X, hCEC-73X) at passages 3 to 4 were seeded in the presence of iHFL at 5 × 10⁵ cells/cm2 in 100 cm2 tissue-culture dishes and grown for four days at 37 °C. When cells reached near-confluence (which corresponds to 90% coverage of the culture dishes), 10 scratches (five horizontal and five vertical) were created using a P1000 pipet tip (Sartsted, Nümbrecht, Germany). As a negative control, hCECs at the same passages were also seeded without scratches. Nuclear extracts were then prepared from all cultured cells, dialyzed and kept frozen in small aliquots at −80 °C until they were used for EMSAs as previously described [56,99]. Briefly, EMSAs were carried out by incubating nuclear proteins with either a 5′32P-end-labeled, 50 bp DNA fragment bearing most of the CLU proximal activator region from position -203 (SacII site) to -153 relative to the CLU mRNA start site and designated CLU-203/-153, or a 5′32P-end-labeled oligomers bearing the high affinity recognition sequence for the transcription factors AP-1 or Sp1/Sp3. Approximately 8 × 10⁴ cpm labeled probe was incubated with 15 µg nuclear proteins in the presence of 0.5 μg of poly(dI:dC) (AmershamBiosciences, Piscataway, NJ, USA) and 50 mM KCl in buffer D [10 mM Hepes pH 7.9, 10% v/v glycerol, 0.1 mM EDTA, 0.5 mM DTT (dithiothreitol; Sigma-Aldrich Canada, Oakville, ON, Canada) and 0.25 mM phenylmethylsulfonyl fluoride (PMSF; Sigma-Aldrich Canada)]. DNA–protein complexes were next separated by gel electrophoresis through 6% non-denaturing, native polyacrylamide gels run against Tris-glycine buffer (50 mM Tris, 2.5 mM EDTA, 0.4 M glycine) at 120 V or 110 V (as specified in the Figure legends) for 6.5 h, 4 °C. The position of the DNA–protein complexes was then revealed upon autoradiography of the dried gels at −80 °C. When specified in the legend of each figure, synthetic double-stranded oligonucleotides bearing the recognition sequence for known transcription factors (AP-1 or Sp1/Sp3), or that of either the wild type or mutated CLU-203/-153 50 bp DNA fragment (Supplementary Table S1), were added as unlabeled competitors (150- to 500-fold molar excesses) during the assay. Super-shift experiments were conducted by incubating 15 μg nuclear proteins from hCECs in the presence of 1 µg of a polyclonal antibody raised against AP-1 (cFos–sc 166,940 and cJun–sc44X, Santa Cruz Biotechnology, Dallas, TX, USA), Sp1 (Ab13370–Abcam Inc.) or Sp3 (sc-644; Santa Cruz Biotechnology, Dallas, TX, USA).

4.8. Statistical Analyses

Student’s t-test was performed for comparison of the groups for quantification of the western blot signals shown in Figure 1D and Figure 6C. Differences were considered to be statistically significant at p < 0.05. After a first t-test analysis, and when this one is significant, a comparison of means was also performed by an ANOVA test (Tukey) using GraphPad PRISM software (GraphPad Software Inc., La Jolla, CA, USA) for the analysis of the transfection data presented in Figure 2B. All data are also expressed as mean ± SD.

5. Conclusions

In this study, we demonstrated that the expression of clusterin is dramatically repressed (at both the gene and protein levels) during closure of hTEC wounds. This reduced expression of CLU gene transcription was found to be mediated, at least in part, by alteration in both the expression and DNA binding of the transcription factors AP-1 and Sp1/Sp3, which we demonstrated to bind overlapping target sites in the basal promoter of the human CLU gene.

Supplementary Materials

Author Contributions

Conceptualization, S.L.G., L.G. and C.G.; methodology, M.B., C.G. and G.L.-B.; formal analysis, C.G.; writing—original draft preparation, C.G.; writing—review and editing, P.D., S.L.G., L.G., C.G., M.B. and G.L.-B.; supervision, S.L.G. and L.G.; project administration, S.L.G.; funding acquisition, S.L.G. All authors have read and agreed to the published version of the manuscript.

Funding

This research was funded by the Canadian Institutes for Health Research (CIHR), grant FDN-143213 (S.L.G.).

Institutional Review Board Statement

This study was conducted according to the guidelines of the Declaration of Helsinki, and approved by the Institutional Review Board (or Ethics Committee) of “CHU de Québec” (ethic code: DR-002-955, protocol renewal approved on 31 January 2020).

Informed Consent Statement

Not applicable.

Data Availability Statement

All microarray data presented in this study can be accessed at NCBI Gene Expression Omnibus (GEO# GSE75336; https://0-www-ncbi-nlm-nih-gov.brum.beds.ac.uk/geo/query/acc.cgi?acc=GSE75336, last accessed date: 15 November 2021).

Acknowledgments

The authors would like to thank the Tissue and Gene Therapy Network–ThéCell (a thematic network supported by the FRQS). The Banque d’yeux Nationale is partly supported by the Réseau de Recherche en Santé de la Vision from the FRQS. P.D. and M.B. are supported by a studentship from the CIHR and FRSQ, respectively. L.G. is the recipient of a Tier 1 Canada Research Chair in Stem Cell and Tissue Engineering from CIHR.

Conflicts of Interest

The authors declare no conflict of interest.

References

  1. Eghrari, A.O.; Riazuddin, S.A.; Gottsch, J.D. Overview of the Cornea: Structure, Function, and Development. Prog. Mol. Biol. Transl. Sci. 2015, 134, 7–23. [Google Scholar] [CrossRef] [PubMed]
  2. Germain, L.; Carrier, P.; Auger, F.A.; Salesse, C.; Guerin, S.L. Can we produce a human corneal equivalent by tissue engineering? Prog. Retin. Eye Res. 2000, 19, 497–527. [Google Scholar] [CrossRef]
  3. Gupta, N.; Kalaivani, M.; Tandon, R. Comparison of prognostic value of Roper Hall and Dua classification systems in acute ocular burns. Br. J. Ophthalmol. 2011, 95, 194–198. [Google Scholar] [CrossRef] [PubMed]
  4. Daniels, J.T.; Dart, J.K.; Tuft, S.J.; Khaw, P.T. Corneal stem cells in review. Wound Repair Regen. 2001, 9, 483–494. [Google Scholar] [CrossRef] [PubMed]
  5. Vemuganti, G.K.; Murthy, S.I.; Das, S. Update on pathologic diagnosis of corneal infections and inflammations. Middle East Afr. J. Ophthalmol. 2011, 18, 277–284. [Google Scholar] [CrossRef]
  6. Hong, J.W.; Liu, J.J.; Lee, J.S.; Mohan, R.R.; Mohan, R.R.; Woods, D.J.; He, Y.G.; Wilson, S.E. Proinflammatory chemokine induction in keratocytes and inflammatory cell infiltration into the cornea. Investig. Ophthalmol. Vis. Sci. 2001, 42, 2795–2803. [Google Scholar]
  7. Dua, H.S.; Azuara-Blanco, A. Autologous limbal transplantation in patients with unilateral corneal stem cell deficiency. Br. J. Ophthalmol. 2000, 84, 273–278. [Google Scholar] [CrossRef] [Green Version]
  8. Kang, B.S.; Kim, M.K.; Wee, W.R.; Oh, J.Y. Infectious Keratitis in Limbal Stem Cell Deficiency: Stevens-Johnson Syndrome Versus Chemical Burn. Cornea 2016, 35, 51–55. [Google Scholar] [CrossRef]
  9. Carrier, P.; Deschambeault, A.; Talbot, M.V.; Giasson, C.J.; Auger, F.O.A.; GuéRin, S.L.; Germain, L. Characterization of Wound Reepithelialization Using a New Human Tissue-Engineered Corneal Wound Healing Model. Investig. Opthalmology Vis. Sci. 2008, 49, 1376. [Google Scholar] [CrossRef]
  10. Couture, C.; Desjardins, P.; Zaniolo, K.; Germain, L.; Guerin, S.L. Enhanced wound healing of tissue-engineered human corneas through altered phosphorylation of the CREB and AKT signal transduction pathways. Acta Biomater. 2018, 73, 312–325. [Google Scholar] [CrossRef]
  11. Couture, C.; Zaniolo, K.; Carrier, P.; Lake, J.; Patenaude, J.; Germain, L.; Guerin, S.L. The tissue-engineered human cornea as a model to study expression of matrix metalloproteinases during corneal wound healing. Biomaterials 2016, 78, 86–101. [Google Scholar] [CrossRef]
  12. Guerin, L.P.; Le-Bel, G.; Desjardins, P.; Couture, C.; Gillard, E.; Boisselier, E.; Bazin, R.; Germain, L.; Guerin, S.L. The Human Tissue-Engineered Cornea (hTEC): Recent Progress. Int. J. Mol. Sci. 2021, 22, 1291. [Google Scholar] [CrossRef]
  13. Proulx, S.; d’Arc Uwamaliya, J.; Carrier, P.; Deschambeault, A.; Audet, C.; Giasson, C.J.; Guerin, S.L.; Auger, F.A.; Germain, L. Reconstruction of a human cornea by the self-assembly approach of tissue engineering using the three native cell types. Mol. Vis. 2010, 16, 2192–2201. [Google Scholar]
  14. Zaniolo, K.; Carrier, P.; Guerin, S.L.; Auger, F.A.; Germain, L. A tissue-engineered corneal wound healing model for the characterization of reepithelialization. Methods Mol. Biol. 2013, 1037, 59–78. [Google Scholar] [CrossRef]
  15. Carrier, P.; Deschambeault, A.; Audet, C.; Talbot, M.V.; Gauvin, R.; Giasson, C.J.; Auger, F.O.A.; GuéRin, S.L.; Germain, L. Impact of Cell Source on Human Cornea Reconstructed by Tissue Engineering. Investig. Opthalmology Vis. Sci. 2009, 50, 2645. [Google Scholar] [CrossRef] [Green Version]
  16. Germain, L.; Auger, F.A.; Grandbois, E.; Guignard, R.; Giasson, M.; Boisjoly, H.; Guerin, S.L. Reconstructed human cornea produced in vitro by tissue engineering. Pathobiology 1999, 67, 140–147. [Google Scholar] [CrossRef]
  17. Lake, J.; Zaniolo, K.; Gaudreault, M.; Carrier, P.; Deschambault, A.; Bazin, R.; Germain, L.; Salesse, C.; Guerin, S.L. Expression of the α5 integrin gene in corneal epithelial cells cultured on tissue-engineered human extracellular matrices. Biomaterials 2013, 34, 6367–6376. [Google Scholar] [CrossRef]
  18. Lake, J.; Zaniolo, K.; Gingras, M.E.; Couture, C.; Salesse, C.; Guerin, S.L. Functional Impact of Collagens on the Activity Directed by the Promoter of the α5 Integrin Subunit Gene in Corneal Epithelial Cells. Investig. Ophthalmol. Vis. Sci. 2015, 56, 6217–6232. [Google Scholar] [CrossRef] [Green Version]
  19. Liu, C.Y.; Kao, W.W. Corneal Epithelial Wound Healing. Prog. Mol. Biol. Transl. Sci. 2015, 134, 61–71. [Google Scholar] [CrossRef]
  20. Humphreys, D.T.; Carver, J.A.; Easterbrook-Smith, S.B.; Wilson, M.R. Clusterin has chaperone-like activity similar to that of small heat shock proteins. J. Biol. Chem. 1999, 274, 6875–6881. [Google Scholar] [CrossRef] [Green Version]
  21. Trougakos, I.P.; Lourda, M.; Antonelou, M.H.; Kletsas, D.; Gorgoulis, V.G.; Papassideri, I.S.; Zou, Y.; Margaritis, L.H.; Boothman, D.A.; Gonos, E.S. Intracellular clusterin inhibits mitochondrial apoptosis by suppressing p53-activating stress signals and stabilizing the cytosolic Ku70-Bax protein complex. Clin. Cancer Res. 2009, 15, 48–59. [Google Scholar] [CrossRef] [Green Version]
  22. Kim, N.; Yoo, J.C.; Han, J.Y.; Hwang, E.M.; Kim, Y.S.; Jeong, E.Y.; Sun, C.H.; Yi, G.S.; Roh, G.S.; Kim, H.J.; et al. Human nuclear clusterin mediates apoptosis by interacting with Bcl-XL through C-terminal coiled coil domain. J. Cell Physiol. 2012, 227, 1157–1167. [Google Scholar] [CrossRef]
  23. Silkensen, J.R.; Skubitz, K.M.; Skubitz, A.P.; Chmielewski, D.H.; Manivel, J.C.; Dvergsten, J.A.; Rosenberg, M.E. Clusterin promotes the aggregation and adhesion of renal porcine epithelial cells. J. Clin. Investig. 1995, 96, 2646–2653. [Google Scholar] [CrossRef] [Green Version]
  24. Millis, A.J.; Luciani, M.; McCue, H.M.; Rosenberg, M.E.; Moulson, C.L. Clusterin regulates vascular smooth muscle cell nodule formation and migration. J. Cell Physiol. 2001, 186, 210–219. [Google Scholar] [CrossRef]
  25. Shin, Y.J.; Kang, S.W.; Jeong, S.Y.; Shim, Y.J.; Kim, Y.H.; Kim, B.M.; Kee, S.H.; Park, J.J.; Park, I.S.; Min, B.H. Clusterin enhances proliferation of primary astrocytes through extracellular signal-regulated kinase activation. Neuroreport 2006, 17, 1871–1875. [Google Scholar] [CrossRef]
  26. Bettuzzi, S.; Scorcioni, F.; Astancolle, S.; Davalli, P.; Scaltriti, M.; Corti, A. Clusterin (SGP-2) transient overexpression decreases proliferation rate of SV40-immortalized human prostate epithelial cells by slowing down cell cycle progression. Oncogene 2002, 21, 4328–4334. [Google Scholar] [CrossRef] [Green Version]
  27. Trougakos, I.P.; Gonos, E.S. Clusterin/apolipoprotein J in human aging and cancer. Int. J. Biochem. Cell Biol. 2002, 34, 1430–1448. [Google Scholar] [CrossRef]
  28. Shannan, B.; Seifert, M.; Leskov, K.; Willis, J.; Boothman, D.; Tilgen, W.; Reichrath, J. Challenge and promise: Roles for clusterin in pathogenesis, progression and therapy of cancer. Cell Death Differ. 2006, 13, 12–19. [Google Scholar] [CrossRef]
  29. Park, S.; Mathis, K.W.; Lee, I.K. The physiological roles of apolipoprotein J/clusterin in metabolic and cardiovascular diseases. Rev. Endocr. Metab. Disord. 2014, 15, 45–53. [Google Scholar] [CrossRef]
  30. Jurkunas, U.V.; Bitar, M.S.; Rawe, I.; Harris, D.L.; Colby, K.; Joyce, N.C. Increased clusterin expression in Fuchs’ endothelial dystrophy. Investig. Ophthalmol. Vis. Sci. 2008, 49, 2946–2955. [Google Scholar] [CrossRef] [Green Version]
  31. Nishida, K.; Quantock, A.J.; Dota, A.; Choi-Miura, N.H.; Kinoshita, S. Apolipoproteins J and E co-localise with amyloid in gelatinous drop-like and lattice type I corneal dystrophies. Br. J. Ophthalmol. 1999, 83, 1178–1182. [Google Scholar] [CrossRef] [PubMed] [Green Version]
  32. Koltai, T. Clusterin: A key player in cancer chemoresistance and its inhibition. OncoTargets Ther. 2014, 7, 447–456. [Google Scholar] [CrossRef] [PubMed] [Green Version]
  33. Kim, J.H.; Kim, J.H.; Jun, H.O.; Yu, Y.S.; Min, B.H.; Park, K.H.; Kim, K.W. Protective effect of clusterin from oxidative stress-induced apoptosis in human retinal pigment epithelial cells. Investig. Ophthalmol. Vis. Sci. 2010, 51, 561–566. [Google Scholar] [CrossRef] [PubMed]
  34. Wong, P.; Kutty, R.K.; Darrow, R.M.; Shivaram, S.; Kutty, G.; Fletcher, R.T.; Wiggert, B.; Chader, G.; Organisciak, D.T. Changes in clusterin expression associated with light-induced retinal damage in rats. Biochem. Cell Biol. 1994, 72, 499–503. [Google Scholar] [CrossRef]
  35. Vargas, A.; Kim, H.S.; Baral, E.; Yu, W.Q.; Craft, C.M.; Lee, E.J. Protective effect of clusterin on rod photoreceptor in rat model of retinitis pigmentosa. PLoS ONE 2017, 12, e0182389. [Google Scholar] [CrossRef] [Green Version]
  36. Ricci, F.; Pucci, S.; Sesti, F.; Missiroli, F.; Cerulli, L.; Spagnoli, L.G. Modulation of Ku70/80, clusterin/ApoJ isoforms and Bax expression in indocyanine-green-mediated photo-oxidative cell damage. Ophthalmic Res. 2007, 39, 164–173. [Google Scholar] [CrossRef]
  37. Bonacini, M.; Coletta, M.; Ramazzina, I.; Naponelli, V.; Modernelli, A.; Davalli, P.; Bettuzzi, S.; Rizzi, F. Distinct promoters, subjected to epigenetic regulation, drive the expression of two clusterin mRNAs in prostate cancer cells. Biochim. Biophys. Acta 2015, 1849, 44–54. [Google Scholar] [CrossRef]
  38. Cervellera, M.; Raschella, G.; Santilli, G.; Tanno, B.; Ventura, A.; Mancini, C.; Sevignani, C.; Calabretta, B.; Sala, A. Direct transactivation of the anti-apoptotic gene apolipoprotein J (clusterin) by B-MYB. J. Biol. Chem. 2000, 275, 21055–21060. [Google Scholar] [CrossRef] [Green Version]
  39. Jin, G.; Howe, P.H. Regulation of Clusterin Gene Expression by Transforming Growth Factor β. J. Biol. Chem. 1997, 272, 26620–26626. [Google Scholar] [CrossRef] [Green Version]
  40. Jin, G.; Howe, P.H. Transforming growth factor beta regulates clusterin gene expression via modulation of transcription factor c-Fos. Eur. J. Biochem. 1999, 263, 534–542. [Google Scholar] [CrossRef]
  41. Shiota, M.; Zardan, A.; Takeuchi, A.; Kumano, M.; Beraldi, E.; Naito, S.; Zoubeidi, A.; Gleave, M.E. Clusterin mediates TGF-beta-induced epithelial-mesenchymal transition and metastasis via Twist1 in prostate cancer cells. Cancer Res. 2012, 72, 5261–5272. [Google Scholar] [CrossRef] [Green Version]
  42. Shiota, M.; Zoubeidi, A.; Kumano, M.; Beraldi, E.; Naito, S.; Nelson, C.C.; Sorensen, P.H.; Gleave, M.E. Clusterin is a critical downstream mediator of stress-induced YB-1 transactivation in prostate cancer. Mol. Cancer Res. 2011, 9, 1755–1766. [Google Scholar] [CrossRef] [Green Version]
  43. Gutacker, C.; Klock, G.; Diel, P.; Koch-Brandt, C. Nerve growth factor and epidermal growth factor stimulate clusterin gene expression in PC12 cells. Biochem. J. 1999, 339 Pt 3, 759–766. [Google Scholar] [CrossRef]
  44. Park, J.; Park, S.Y.; Shin, E.; Lee, S.H.; Kim, Y.S.; Lee, D.H.; Roh, G.S.; Kim, H.J.; Kang, S.S.; Cho, G.J.; et al. Hypoxia inducible factor-1α directly regulates nuclear clusterin transcription by interacting with hypoxia response elements in the clusterin promoter. Mol. Cells 2014, 37, 178–186. [Google Scholar] [CrossRef] [Green Version]
  45. Herault, Y.; Chatelain, G.; Brun, G.; Michel, D. V-src-induced-transcription of the avian clusterin gene. Nucleic Acids Res. 1992, 20, 6377–6383. [Google Scholar] [CrossRef] [Green Version]
  46. Michel, D.; Chatelain, G.; North, S.; Brun, G. Stress-induced transcription of the clusterin/apoJ gene. Biochem. J. 1997, 328 Pt 1, 45–50. [Google Scholar] [CrossRef] [Green Version]
  47. Wong, P.; Taillefer, D.; Lakins, J.; Pineault, J.; Chader, G.; Tenniswood, M. Molecular characterization of human TRPM-2/clusterin, a gene associated with sperm maturation, apoptosis and neurodegeneration. Eur. J. Biochem. 1994, 221, 917–925. [Google Scholar] [CrossRef]
  48. Andersen, C.L.; Schepeler, T.; Thorsen, K.; Birkenkamp-Demtroder, K.; Mansilla, F.; Aaltonen, L.A.; Laurberg, S.; Orntoft, T.F. Clusterin expression in normal mucosa and colorectal cancer. Mol. Cell Proteom. 2007, 6, 1039–1048. [Google Scholar] [CrossRef] [Green Version]
  49. Prochnow, H.; Gollan, R.; Rohne, P.; Hassemer, M.; Koch-Brandt, C.; Baiersdorfer, M. Non-secreted clusterin isoforms are translated in rare amounts from distinct human mRNA variants and do not affect Bax-mediated apoptosis or the NF-kappaB signaling pathway. PLoS ONE 2013, 8, e75303. [Google Scholar] [CrossRef]
  50. Leskov, K.S.; Klokov, D.Y.; Li, J.; Kinsella, T.J.; Boothman, D.A. Synthesis and functional analyses of nuclear clusterin, a cell death protein. J. Biol. Chem. 2003, 278, 11590–11600. [Google Scholar] [CrossRef] [Green Version]
  51. Shi, H.; Deng, J.H.; Wang, Z.; Cao, K.Y.; Zhou, L.; Wan, H. Knockdown of clusterin inhibits the growth and migration of renal carcinoma cells and leads to differential gene expression. Mol. Med. Rep. 2013, 8, 35–40. [Google Scholar] [CrossRef] [Green Version]
  52. Gingras, M.-E.; Larouche, K.; Larouche, N.; Leclerc, S.; Salesse, C.; Guérin, S.L. Regulation of the integrin subunit α5 gene promoter by the transcription factors Sp1/Sp3 is influenced by the cell density in rabbit corneal epithelial cells. Investig. Ophthalmol. Vis. Sci. 2003, 44, 3742–3755. [Google Scholar] [CrossRef] [Green Version]
  53. Gingras, M.E.; Masson-Gadais, B.; Zaniolo, K.; Leclerc, S.; Drouin, R.; Germain, L.; Guerin, S.L. Differential binding of the transcription factors Sp1, AP-1, and NFI to the promoter of the human α5 integrin gene dictates its transcriptional activity. Investig. Ophthalmol. Vis. Sci. 2009, 50, 57–67. [Google Scholar] [CrossRef]
  54. Larouche, K.; Leclerc, S.; Salesse, C.; Guérin, S.L. Expression of the α5 Integrin Subunit Gene Promoter Is Positively Regulated by the Extracellular Matrix Component Fibronectin through the Transcription Factor Sp1 in Corneal Epithelial Cells in Vitro. J. Biol. Chem. 2000, 275, 39182–39192. [Google Scholar] [CrossRef] [Green Version]
  55. Gaudreault, M.; Carrier, P.; Larouche, K.; Leclerc, S.; Giasson, M.; Germain, L.; Guerin, S.L. Influence of sp1/sp3 expression on corneal epithelial cells proliferation and differentiation properties in reconstructed tissues. Investig. Ophthalmol. Vis. Sci. 2003, 44, 1447–1457. [Google Scholar] [CrossRef] [Green Version]
  56. Gaudreault, M.; Gingras, M.-E.; Lessard, M.; Leclerc, S.; Guérin, S.L. Electrophoretic Mobility Shift Assays for the Analysis of DNA-Protein Interactions. In DNA-Protein Interactions; Humana Press: Totowa, NJ, USA, 2009; pp. 15–35. [Google Scholar] [CrossRef]
  57. Gaudreault, M.; Vigneault, F.O.; Leclerc, S.; Guérin, S.L. Laminin Reduces Expression of the Human α6 Integrin Subunit Gene by Altering the Level of the Transcription Factors Sp1 and Sp3. Investig. Opthalmol. Vis. Sci. 2007, 48, 3490. [Google Scholar] [CrossRef] [Green Version]
  58. Gain, P.; Jullienne, R.; He, Z.; Aldossary, M.; Acquart, S.; Cognasse, F.; Thuret, G. Global Survey of Corneal Transplantation and Eye Banking. JAMA Ophthalmol. 2016, 134, 167–173. [Google Scholar] [CrossRef] [Green Version]
  59. Jung, G.S.; Kim, M.K.; Jung, Y.A.; Kim, H.S.; Park, I.S.; Min, B.H.; Lee, K.U.; Kim, J.G.; Park, K.G.; Lee, I.K. Clusterin attenuates the development of renal fibrosis. J. Am. Soc. Nephrol. 2012, 23, 73–85. [Google Scholar] [CrossRef] [PubMed] [Green Version]
  60. Jeong, S.; Ledee, D.R.; Gordon, G.M.; Itakura, T.; Patel, N.; Martin, A.; Fini, M.E. Interaction of clusterin and matrix metalloproteinase-9 and its implication for epithelial homeostasis and inflammation. Am. J. Pathol. 2012, 180, 2028–2039. [Google Scholar] [CrossRef] [Green Version]
  61. Chen, D.; Wang, Y.; Zhang, K.; Jiao, X.; Yan, B.; Liang, J. Antisense oligonucleotide against clusterin regulates human hepatocellular carcinoma invasion through transcriptional regulation of matrix metalloproteinase-2 and E-cadherin. Int. J. Mol. Sci. 2012, 13, 10594–10607. [Google Scholar] [CrossRef] [Green Version]
  62. Nishida, T.; Tanaka, T. Extracellular matrix and growth factors in corneal wound healing. Curr. Opin. Ophthalmol. 1996, 7, 2–11. [Google Scholar] [CrossRef] [PubMed]
  63. Ljubimov, A.V.; Saghizadeh, M. Progress in corneal wound healing. Prog. Retin. Eye Res. 2015, 49, 17–45. [Google Scholar] [CrossRef] [PubMed] [Green Version]
  64. Al-Hazmi, N.; Thomas, G.J.; Speight, P.M.; Whawell, S.A. The 120 kDa cell-binding fragment of fibronectin up-regulates migration of αvβ6-expressing cells by increasing matrix metalloproteinase-2 and -9 secretion. Eur. J. Oral Sci. 2007, 115, 454–458. [Google Scholar] [CrossRef] [PubMed]
  65. Thomas-Salgar, S.; Millis, A.J. Clusterin expression in differentiating smooth muscle cells. J. Biol. Chem. 1994, 269, 17879–17885. [Google Scholar] [CrossRef]
  66. Landreville, S.; Vigneault, F.; Bergeron, M.A.; Leclerc, S.; Gaudreault, M.; Morcos, M.; Mouriaux, F.; Salesse, C.; Guerin, S.L. Suppression of α5 gene expression is closely related to the tumorigenic properties of uveal melanoma cell lines. Pigment Cell Melanoma Res. 2011, 24, 643–655. [Google Scholar] [CrossRef]
  67. Halazonetis, T.D.; Georgopoulos, K.; Greenberg, M.E.; Leder, P. c-Jun dimerizes with itself and with c-Fos, forming complexes of different DNA binding affinities. Cell 1988, 55, 917–924. [Google Scholar] [CrossRef]
  68. O’Shea, E.K.; Rutkowski, R.; Kim, P.S. Mechanism of specificity in the Fos-Jun oncoprotein heterodimer. Cell 1992, 68, 699–708. [Google Scholar] [CrossRef]
  69. Bakiri, L.; Matsuo, K.; Wisniewska, M.; Wagner, E.F.; Yaniv, M. Promoter specificity and biological activity of tethered AP-1 dimers. Mol. Cell. Biol. 2002, 22, 4952–4964. [Google Scholar] [CrossRef] [Green Version]
  70. Grondin, B.; Lefrancois, M.; Tremblay, M.; Saint-Denis, M.; Haman, A.; Waga, K.; Bedard, A.; Tenen, D.G.; Hoang, T. c-Jun homodimers can function as a context-specific coactivator. Mol. Cell. Biol. 2007, 27, 2919–2933. [Google Scholar] [CrossRef] [Green Version]
  71. Chiu, R.; Angel, P.; Karin, M. Jun-B differs in its biological properties from, and is a negative regulator of, c-Jun. Cell 1989, 59, 979–986. [Google Scholar] [CrossRef]
  72. Vartanian, R.; Masri, J.; Martin, J.; Cloninger, C.; Holmes, B.; Artinian, N.; Funk, A.; Ruegg, T.; Gera, J. AP-1 regulates cyclin D1 and c-MYC transcription in an AKT-dependent manner in response to mTOR inhibition: Role of AIP4/Itch-mediated JUNB degradation. Mol. Cancer Res. 2011, 9, 115–130. [Google Scholar] [CrossRef] [Green Version]
  73. Rylski, M.; Amborska, R.; Zybura, K.; Michaluk, P.; Bielinska, B.; Konopacki, F.A.; Wilczynski, G.M.; Kaczmarek, L. JunB is a repressor of MMP-9 transcription in depolarized rat brain neurons. Mol. Cell. Neurosci. 2009, 40, 98–110. [Google Scholar] [CrossRef]
  74. Fuchs, S.Y.; Dolan, L.; Davis, R.J.; Ronai, Z. Phosphorylation-dependent targeting of c-Jun ubiquitination by Jun N-kinase. Oncogene 1996, 13, 1531–1535. [Google Scholar]
  75. Bossis, G.; Ferrara, P.; Acquaviva, C.; Jariel-Encontre, I.; Piechaczyk, M. c-Fos proto-oncoprotein is degraded by the proteasome independently of its own ubiquitinylation in vivo. Mol. Cell. Biol. 2003, 23, 7425–7436. [Google Scholar] [CrossRef] [Green Version]
  76. Bossis, G.; Malnou, C.E.; Farras, R.; Andermarcher, E.; Hipskind, R.; Rodriguez, M.; Schmidt, D.; Muller, S.; Jariel-Encontre, I.; Piechaczyk, M. Down-regulation of c-Fos/c-Jun AP-1 dimer activity by sumoylation. Mol. Cell. Biol. 2005, 25, 6964–6979. [Google Scholar] [CrossRef] [Green Version]
  77. Treier, M.; Staszewski, L.M.; Bohmann, D. Ubiquitin-dependent c-Jun degradation in vivo is mediated by the delta domain. Cell 1994, 78, 787–798. [Google Scholar] [CrossRef]
  78. Cuevas, B.D.; Uhlik, M.T.; Garrington, T.P.; Johnson, G.L. MEKK1 regulates the AP-1 dimer repertoire via control of JunB transcription and Fra-2 protein stability. Oncogene 2005, 24, 801–809. [Google Scholar] [CrossRef] [Green Version]
  79. Salvat, C.; Jariel-Encontre, I.; Acquaviva, C.; Omura, S.; Piechaczyk, M. Differential directing of c-Fos and c-Jun proteins to the proteasome in serum-stimulated mouse embryo fibroblasts. Oncogene 1998, 17, 327–337. [Google Scholar] [CrossRef] [Green Version]
  80. Liu, J.J.; Lin, X.J.; Yang, X.J.; Zhou, L.; He, S.; Zhuang, S.M.; Yang, J. A novel AP-1/miR-101 regulatory feedback loop and its implication in the migration and invasion of hepatoma cells. Nucleic Acids Res. 2014, 42, 12041–12051. [Google Scholar] [CrossRef] [Green Version]
  81. Franklin, C.C.; McCulloch, A.V.; Kraft, A.S. In vitro association between the Jun protein family and the general transcription factors, TBP and TFIIB. Biochem. J. 1995, 305 Pt 3, 967–974. [Google Scholar] [CrossRef] [Green Version]
  82. Lee, J.S.; See, R.H.; Deng, T.; Shi, Y. Adenovirus E1A downregulates cJun- and JunB-mediated transcription by targeting their coactivator p300. Mol. Cell. Biol. 1996, 16, 4312–4326. [Google Scholar] [CrossRef] [Green Version]
  83. Canettieri, G.; Coni, S.; Della Guardia, M.; Nocerino, V.; Antonucci, L.; Di Magno, L.; Screaton, R.; Screpanti, I.; Giannini, G.; Gulino, A. The coactivator CRTC1 promotes cell proliferation and transformation via AP-1. Proc. Natl. Acad. Sci. USA 2009, 106, 1445–1450. [Google Scholar] [CrossRef] [Green Version]
  84. Arias, J.; Alberts, A.S.; Brindle, P.; Claret, F.X.; Smeal, T.; Karin, M.; Feramisco, J.; Montminy, M. Activation of cAMP and mitogen responsive genes relies on a common nuclear factor. Nature 1994, 370, 226–229. [Google Scholar] [CrossRef]
  85. Claret, F.X.; Hibi, M.; Dhut, S.; Toda, T.; Karin, M. A new group of conserved coactivators that increase the specificity of AP-1 transcription factors. Nature 1996, 383, 453–457. [Google Scholar] [CrossRef] [PubMed]
  86. Moreau, A.; Yotov, W.V.; Glorieux, F.H.; St-Arnaud, R. Bone-specific expression of the alpha chain of the nascent polypeptide-associated complex, a coactivator potentiating c-Jun-mediated transcription. Mol. Cell. Biol. 1998, 18, 1312–1321. [Google Scholar] [CrossRef] [PubMed] [Green Version]
  87. Davies, C.C.; Chakraborty, A.; Diefenbacher, M.E.; Skehel, M.; Behrens, A. Arginine methylation of the c-Jun coactivator RACO-1 is required for c-Jun/AP-1 activation. EMBO J. 2013, 32, 1556–1567. [Google Scholar] [CrossRef] [PubMed]
  88. He, L.; Pratt, H.; Gao, M.; Wei, F.; Weng, Z.; Struhl, K. YAP and TAZ are transcriptional co-activators of AP-1 proteins and STAT3 during breast cellular transformation. eLife 2021, 10. [Google Scholar] [CrossRef]
  89. Thompson, B.J. YAP/TAZ: Drivers of Tumor Growth, Metastasis, and Resistance to Therapy. Bioessays 2020, 42, e1900162. [Google Scholar] [CrossRef] [Green Version]
  90. Ikeda, K.; Halle, J.P.; Stelzer, G.; Meisterernst, M.; Kawakami, K. Involvement of negative cofactor NC2 in active repression by zinc finger-homeodomain transcription factor AREB6. Mol. Cell. Biol. 1998, 18, 10–18. [Google Scholar] [CrossRef] [Green Version]
  91. Kang, S.; Spann, N.J.; Hui, T.Y.; Davis, R.A. ARP-1/COUP-TF II determines hepatoma phenotype by acting as both a transcriptional repressor of microsomal triglyceride transfer protein and an inducer of CYP7A1. J. Biol. Chem. 2003, 278, 30478–30486. [Google Scholar] [CrossRef] [Green Version]
  92. Liang, B.; Wang, J. EVI1 in Leukemia and Solid Tumors. Cancers 2020, 12, 2667. [Google Scholar] [CrossRef]
  93. Suzuki, K.; Matsumoto, M.; Katoh, Y.; Liu, L.; Ochiai, K.; Aizawa, Y.; Nagatomi, R.; Okuno, H.; Itoi, E.; Igarashi, K. Bach1 promotes muscle regeneration through repressing Smad-mediated inhibition of myoblast differentiation. PLoS ONE 2020, 15, e0236781. [Google Scholar] [CrossRef]
  94. Wilson, M.; Tsakraklides, V.; Tran, M.; Xiao, Y.Y.; Zhang, Y.; Perkins, A.S. EVI1 Interferes with Myeloid Maturation via Transcriptional Repression of Cebpa, via Binding to Two Far Downstream Regulatory Elements. J. Biol. Chem. 2016, 291, 13591–13607. [Google Scholar] [CrossRef] [Green Version]
  95. Yusoff, F.M.; Maruhashi, T.; Kawano, K.I.; Nakashima, A.; Chayama, K.; Tashiro, S.; Igarashi, K.; Higashi, Y. Bach1 plays an important role in angiogenesis through regulation of oxidative stress. Microvasc. Res. 2021, 134, 104126. [Google Scholar] [CrossRef]
  96. Bisson, F.; Rochefort, É.; Lavoie, A.; Larouche, D.; Zaniolo, K.; Simard-Bisson, C.; Damour, O.; Auger, F.; Guérin, S.; Germain, L. Irradiated Human Dermal Fibroblasts Are as Efficient as Mouse Fibroblasts as a Feeder Layer to Improve Human Epidermal Cell Culture Lifespan. Int. J. Mol. Sci. 2013, 14, 4684–4704. [Google Scholar] [CrossRef]
  97. Laplante, A.F.; Germain, L.; Auger, F.A.; Moulin, V. Mechanisms of wound reepithelialization: Hints from a tissue-engineered reconstructed skin to long-standing questions. FASEB J. 2001, 15, 2377–2389. [Google Scholar] [CrossRef] [Green Version]
  98. Pothier, F.; Ouellet, M.; Julien, J.P.; Guérin, S.L. An improved CAT assay for promoter analysis in either transgenic mice or tissue culture cells. DNA Cell Biol. 1992, 11. [Google Scholar] [CrossRef]
  99. Zaniolo, K.; Desnoyers, S.; Leclerc, S.; Guérin, S.L. Regulation of poly(ADP-ribose) polymerase-1 (PARP-1) gene expression through the post-translational modification of Sp1: A nuclear target protein of PARP-1. BMC Mol. Biol. 2007, 8, 96. [Google Scholar] [CrossRef] [Green Version]
Figure 1. Gene expression patterns in response to corneal damage. (A) Composite images showing a complete histological (Masson’s Trichrome staining cells are pink and collagen is blue) view of wounded HTECs (with Epi52) at 4 days following corneal damage (left panel) and unwounded hTECs as a control (right panel). The wound margin created by the biopsy punch and the various elements which composed hTECs are indicated. Scale bar: 50 μm. (B) Scatter plot of log2 of signal intensity from 60,000 different targets covering the entire human transcriptome of cells isolated from the central area of wounded hTECs (in the y-axis) plotted against cells from unwounded hTECs (in the x-axis) and assembled using either Epi44 (left panel) or Epi71b (right panel) hCECs. (C) Heatmap representation of the 54 most deregulated genes expressed by centrally wounded relative to unwounded (negative control) hTECs. The color scale used to display the log2 expression level values is determined by the Hierarchical clustering algorithm of the Euclidian metric distance between genes. Genes indicated in dark blue correspond to those whose expression is very low, whereas highly expressed genes are shown in orange/red. Microarray data for the housekeeping genes β2-microglobulin (B2M) and golgin subfamily A member 1 (GOLGA1) that are expressed respectively to very high and low levels in all types of cells are also shown. (D) Western blot (left panel) and quantification analysis (right panel) of CLU protein isoforms either in hTECs (top panel) or in human epithelial corneal cells (bottom panel). Actin is also shown as an internal control. **: Values considered to be statistically significant from those obtained with the control (Ctrl) protein extract (p value < 0.001). ***: Values statistically significant from those obtained with the control (Ctrl) protein extract (p value < 0.001). ****: Values statistically significant from those obtained with the control (Ctrl) protein extract (p value < 0.0001). ns: Values considered to be statistically non-significant.
Ijms 22 12426 g001
Figure 2. Transfection of the CLU gene promoter in human corneal epithelial cells. (A) Representation of the CLU/CAT recombinant plasmids used for transfection analyses. Numbers indicate the 5′ position relative to the CLU theoretical mRNA start site (indicated by a curved arrow). (B) CAT activities measured following transfection of the CLU/CAT constructs shown in panel (A) in human corneal epithelial cells. CAT activity is expressed relative to the level directed by CLU/-203 construct. Values considered to be statistically significant from those obtained with the CLU/-203 construct are indicated (* and ****: p values < 0.05 and < 0.0001, respectively). ns: Values considered to be statistically non-significant. (C) Schematic representation of the basal promoter (basal P) and both the proximal and distal silencers along the CLU promoter and 5′-flanking sequence, based on the transfection results from the panel (B).
Ijms 22 12426 g002
Figure 3. Putative transcription factor binding sites along the CLU promoter sequence. (A) Schematic representation of the human CLU promoter -82/-203 segment along which the presumed transcription factor binding sites. TF target sites identified on the DNA top strand are indicated in red, whereas those indicated in blue are located on the bottom strand. (B) Heatmap representation of the transcriptional profiles of all the TFs expressed by hTECs for which a putative target site was identified in panel (A). Microarray data for B2M and GOLGA1 are also shown as controls.
Ijms 22 12426 g003
Figure 4. Expression and binding of the TFs AP-1 and Sp1/Sp3 to the CLU basal promoter region using nuclear extracts from hCECs. (A) Schematic representation of the 50 bp segment from the human CLU promoter (-153 to -203) used as a labeled probe in EMSA that also bears putative binding sites for AP-1 (from -188 to -182 (brown)) and Sp1/Sp3 (from positions -194 to -186 and -170 to -161 (pink)). (B) Nuclear proteins (15 µg) prepared from three different populations of hCECs (Epi52, Epi70X and Epi73X) were incubated with the CLU-labeled probe and formation of DNA-protein complexes monitored by EMSA. (C) Nuclear proteins from unwounded hCECs (Epi 70X) were incubated with the CLU-labeled probe either alone (C+) or in the presence of a 150- or 500-fold molar excess of unlabeled competitor oligomers bearing the high affinity recognition target site for AP-1, Sp1/Sp3 or NFI. (D) HCECs nuclear proteins (Epi70X) were incubated with the CLU-labeled probe either alone (negative control: C+) or with antibodies that can recognize the c-Fos or c-Jun AP-1 isoforms (Ab AP-1), or Sp1 and/or Sp3 prior to separation of the DNA-protein complexes by EMSA. SSC: supershifted complexes formed upon addition of the antibodies. (E) Nuclear proteins from unwounded (Ctrl) or scratch-wounded (Wounded) hCECs (Epi 52) were incubated with the CLU probe either alone (C+) or in the presence of either a 150- or 500-fold molar excess of unlabeled competitor oligomers bearing the target site for either AP-1 or Sp1/Sp3. The positions of both the AP-1 and Sp1/Sp3 DNA-protein complexes are indicated. P: labeled probe without added proteins; U: free probe; N.S.: non-specific complex.
Ijms 22 12426 g004
Figure 5. Sp1/Sp3 binding sites in the -203/-153 CLU promoter segment. (A) DNA sequence of the AP-1 and Sp1/Sp3 target sites from the CLU promoter identified at position -170, -188 and -194, respectively, aligned with their corresponding prototypical sequence. The nucleotides preserved between the CLU TF sites and their consensus sequences are shown in capital letters along with those selected for site-directed mutation (in red). (B) Schematic representation of the -203/-153 CLU promoter segment used in EMSA, and its derivatives that bear mutations into either the -170 (CLU Mutant 1) or the -194 (CLU Mutant 2) Sp1 site (the mutated site is indicated by an ‘X’). (C) Nuclear proteins (15 µg) from control hCECs (Epi 70x) were incubated with the Sp1/Sp3-labeled probe bearing the consensus sequence for the Sp1/Sp3 TFs either alone (C+) or in the presence of increasing molar excesses (25 to 750-fold) of unlabeled CLU-203/-153, or of competitors bearing the target site for Sp1/Sp3 and run at 110V for 6.5 h. P: labeled probe without added proteins, U: free probe. (D) Same as in panel (C), except that the Sp1/Sp3-labeled probe was incubated either alone (C+) or in the presence of the unlabeled CLU Mutant 1 or CLU Mutant 2 oligomers.
Ijms 22 12426 g005
Figure 6. Sp1/3 and AP-1 binding after hCECs damages. (A) Nuclear protein (15 µg) from control (Ctrl) and damaged (Wounded) hCECs (Epi 70x) were incubated with either the Sp1/Sp3 (panel A) or the AP-1 (panel B) labeled probe bearing the consensus sequence for the TFs Sp1/Sp3 and AP-1 TFs, respectively, either alone (C+) or in the presence of increasing molar excess (25 to 750-fold) of unlabeled competitor oligonucleotides. P: labeled probe without added proteins, U: free probe. Unlabeled competitor oligonucleotides used in the two left panels (A,B) bears the specific target site for the TFs Sp1/Sp3 (A) or AP-1 (B). Central panels are the same as in left panels except that DNA-protein complexes were competed with unlabeled CLU -203/-153 while the complexes in the right panel are competing with CLU Mutant 2. (C) Western blot (left and middle panels) and quantification analysis (right panel) of the AP-1 (c-Fos, c-Jun and b-Jun isoforms) and Sp1/Sp3 TFs expression in hCECs nuclear extract (Epi52, Epi70X, Epi73X, Epi 74Y). Actin expression was monitored as a normalization control. *: Values considered to be statistically significant from those obtained with the control (Ctrl) protein extract (p value < 0.05). **: Values considered to be statistically significant from those obtained with the control (Ctrl) protein extract (p value < 0.01). ns: Values considered to be statistically non-significant.
Ijms 22 12426 g006
Publisher’s Note: MDPI stays neutral with regard to jurisdictional claims in published maps and institutional affiliations.

