
Inhibitory Effects of Pinostilbene on Adipogenesis in 3T3-L1 Adipocytes: A Study of Possible Mechanisms

Jeju Inside Agency & Cosmetic Science Center, Department of Chemistry and Cosmetics, Jeju National University, Jeju 63243, Korea
*
Author to whom correspondence should be addressed.
Int. J. Mol. Sci. 2021, 22(24), 13446; https://0-doi-org.brum.beds.ac.uk/10.3390/ijms222413446
Submission received: 13 November 2021
/
Revised: 11 December 2021
/
Accepted: 12 December 2021
/
Published: 14 December 2021
(This article belongs to the Special Issue Natural and Synthetic Compounds for Management, Prevention and Treatment of Obesity)
Abstract
:Resveratrol is a phytoalexin with multiple bioactive properties, including antioxidative, neuroprotective, cardioprotective, and anticancer effects. However, resveratrol exhibits structural instability in response to UV irradiation, alkaline pH, and oxygen exposure. Thus, resveratrol derivatives have attracted considerable research interest. In this study, we aimed to evaluate the anti-adipogenic effects of pinostilbene hydrate (PH), a methylated resveratrol derivative, in 3T3-L1 cells. We also evaluated the mechanisms underlying the effects of PH on adipogenesis in 3T3-L1 adipocytes. Oil Red O staining, lipid accumulation assay, and triglyceride (TG) content assay revealed that PH significantly inhibited lipid and TG accumulation without cytotoxicity. In addition, we determined that PH decreased the expression of adipogenesis-related transcription factors, such as PPARγ, C/EBPα, SREBP-1c, and FABP4, and the phosphorylation of MAPK and protein kinase B (AKT). Moreover, PH attenuated the expression of CREB and C/EBPβ, while increasing the phosphorylation of AMPK and ACC, and decreasing the expression of fatty acid synthase and FABP4. Based on these results, we suggest that PH suppresses adipogenesis in 3T3-L1 cells via the activation of the AMPK signaling pathway and the inhibition of the MAPK and AKT insulin-dependent signaling pathways.
1. Introduction
Obesity is caused by the accumulation of excess calories in the body when the energy gained via the consumption of high-calorie foods exceeds its utilization [1]. If this energy imbalance continues, most of the excess energy is converted to triglycerides via fatty acids and accumulates in adipocytes, resulting in weight gain [2,3]. Early stages of obesity are characterized by an increase in adipocyte size (hypertrophy), whereas the later stages are marked by an increase in the number of adipocytes (hyperplasia) [4,5]. Hypertrophy and hyperplasia result in an abnormal increase in the levels of hormones and cytokines secreted from adipose tissue, leading to pathological conditions such as type 2 diabetes, hypertension, hyperlipidemia, cardiovascular disease, and cancer [6,7,8].
Adipose tissue, commonly known as body fat, is composed of adipocytes, which are formed by the differentiation of preadipocytes through the process of adipogenesis and store excess energy in the form of triglycerides [9]. Furthermore, when there is an energy deficit in the body, adipose tissue releases triglycerides, which are stored in adipocytes in the form of glycerol and fatty acids, to supply energy [10]. In addition to this energy storage function, adipose tissue plays a role in various biological processes, such as the immune response and glucose and lipid metabolism, and serves as an endocrine organ by secreting various hormones such as adiponectin, leptin, and adipsin [11,12,13,14,15,16]. Therefore, adipose tissue is highly important for maintaining physiological homeostasis.
Adipogenesis is an important process in adipocyte formation and lipid accumulation, and the major transcription factors regulating this process are CCAAT/enhancer-binding protein alpha (C/EBPα), peroxisome proliferator-activated receptor gamma (PPARγ), sterol response element-binding protein-1c (SREBP-1c), fatty acid synthase (FAS), and fatty acid-binding protein 4 (FABP4) [17,18]. C/EBPα and PPARγ are essential for the differentiation of precursor cells into mature adipocytes, and PPARγ is capable of promoting adipogenesis in cells lacking C/EBP expression. SREBP is a supplementary regulator of adipogenesis and plays a role in regulating lipid metabolism and FAS expression. These transcription factors regulate the synthesis of fatty acids and triglycerides during adipogenesis, and FAS and FABP4 also affect the later stage of adipocyte differentiation and are responsible for adipocyte formation [19,20,21].
The mitogen-activated protein kinase (MAPK) and protein kinase B (AKT)-related insulin signaling pathways are known to activate adipogenesis in adipocytes. Phosphorylation of members of the AKT and MAPK family, extracellular signal-regulated kinase (ERK), and p38 is independently induced by insulin [22]. Phospho-AKT activates SREBP-1c and subsequently regulates PPARγ activation [23,24]. Moreover, AKT stimulates the phosphorylation of cAMP response element-binding protein (CREB). Phospho-CREB induces the activation of C/EBPβ to increase the transcriptional activity of C/EBPα and PPARγ and ultimately induces adipocyte differentiation [25,26,27]. Additionally, phosphorylation of ERK and p38 leads to the activation of C/EBPα and PPARγ [28,29].
Recent research has revealed that AMP-activated protein kinase (AMPK) controls energy recognition and homeostasis in the body, playing an important role in carbohydrate and fat metabolism. AMPK is activated to maintain energy homeostasis when intracellular energy levels decrease due to metabolic stress or exercise, and abnormal AMPK expression is strongly associated with metabolic and cardiovascular diseases, and cancer [30]. AMPK plays an important role in the regulation of adipogenic metabolism by mediating the synthesis and degradation of fatty acids. AMPK is a member of the serine/threonine kinase and forms a heterotrimeric complex with one catalytic α subunit and two regulatory β and γ subunits [31]. This kinase is activated by phosphorylation of threonine 172, which is located in the catalytic domain of the α subunit. Activation of AMPK inhibits the synthesis of malonyl-CoA from acetyl-CoA through acetyl-CoA carboxylase (ACC) inactivation by phosphorylation and ultimately suppresses lipogenesis by inhibiting the expression of SREBP-1c, FABP4, and FAS [32,33].
Resveratrol (3,5,4′-trihydroxy-trans-stilbene) is a polyphenolic compound and a phytoalexin found in peanuts or red grapes and has been widely studied for its bioactive properties, such as its anti-inflammatory, antioxidative, neuroprotective, cardioprotective, and anticancer effects [34,35,36,37,38,39]. In addition, it has been determined that resveratrol exerts its inhibitory effect on adipogenesis by decreasing lipid accumulation in and proliferation of various cell lines [40]. However, UV expression, extreme pH conditions, and oxygen exposure make the structure of resveratrol unstable, resulting in reduced bioavailability and bioactivity. Therefore, many recent studies have focused on the bioactivity of resveratrol derivatives containing a methoxy group instead of a hydroxyl group [41,42,43,44].
Among the methylated derivatives of resveratrol, pterostilbene is being actively studied. Resveratrol and pterostilbene have many similar bioactivities, such as antioxidative [45], anti-inflammatory [46], anti-obesity [47,48,49], anticancer [50,51], and neuroprotective activities [52,53,54,55]. However, comparative studies of these two compounds have shown that the biological activities and oral bioavailability of pterostilbene are normally superior to those of resveratrol [45,46,50,51]. In metabolic studies, it was reported that pinostilbene is the major metabolite of pterostilbene, which is produced by the gut microbiota demethylase in the mouse colon [56]. In addition, pinostilbene was found to be more stable than resveratrol under conditions simulating the colon environment, using human fecal microbiota [57]. Moreover, pterostilbene showed similar inhibitory effects on the growth of human colon cancer cells [58].
Pinostilbene (3,4′-dihydroxy-5-methoxystilbene) is a methylated resveratrol derivative, the bioactivity of which has been studied. Pinostilbene hydrate (PH) has exhibited strong neuroprotective activity in SH-SY5Y cells [44], anticancer effects in LNCaP cancer cells [59], anti-metastatic effects in human oral cancer cells [60], anti-melanogenic effects in B16F10 and human epidermal melanocytes [61], and anti-oxidative and tyrosinase inhibitory activities [62]. However, the inhibitory effects of PH on adipogenesis and the mechanisms underlying these effects have not yet been investigated. Therefore, in this study, we verified the anti-adipogenic effects of PH in 3T3-L1 adipocytes and examined possible molecular mechanisms.
2. Results
2.1. Toxicity of PH toward 3T3-L1 Adipocytes
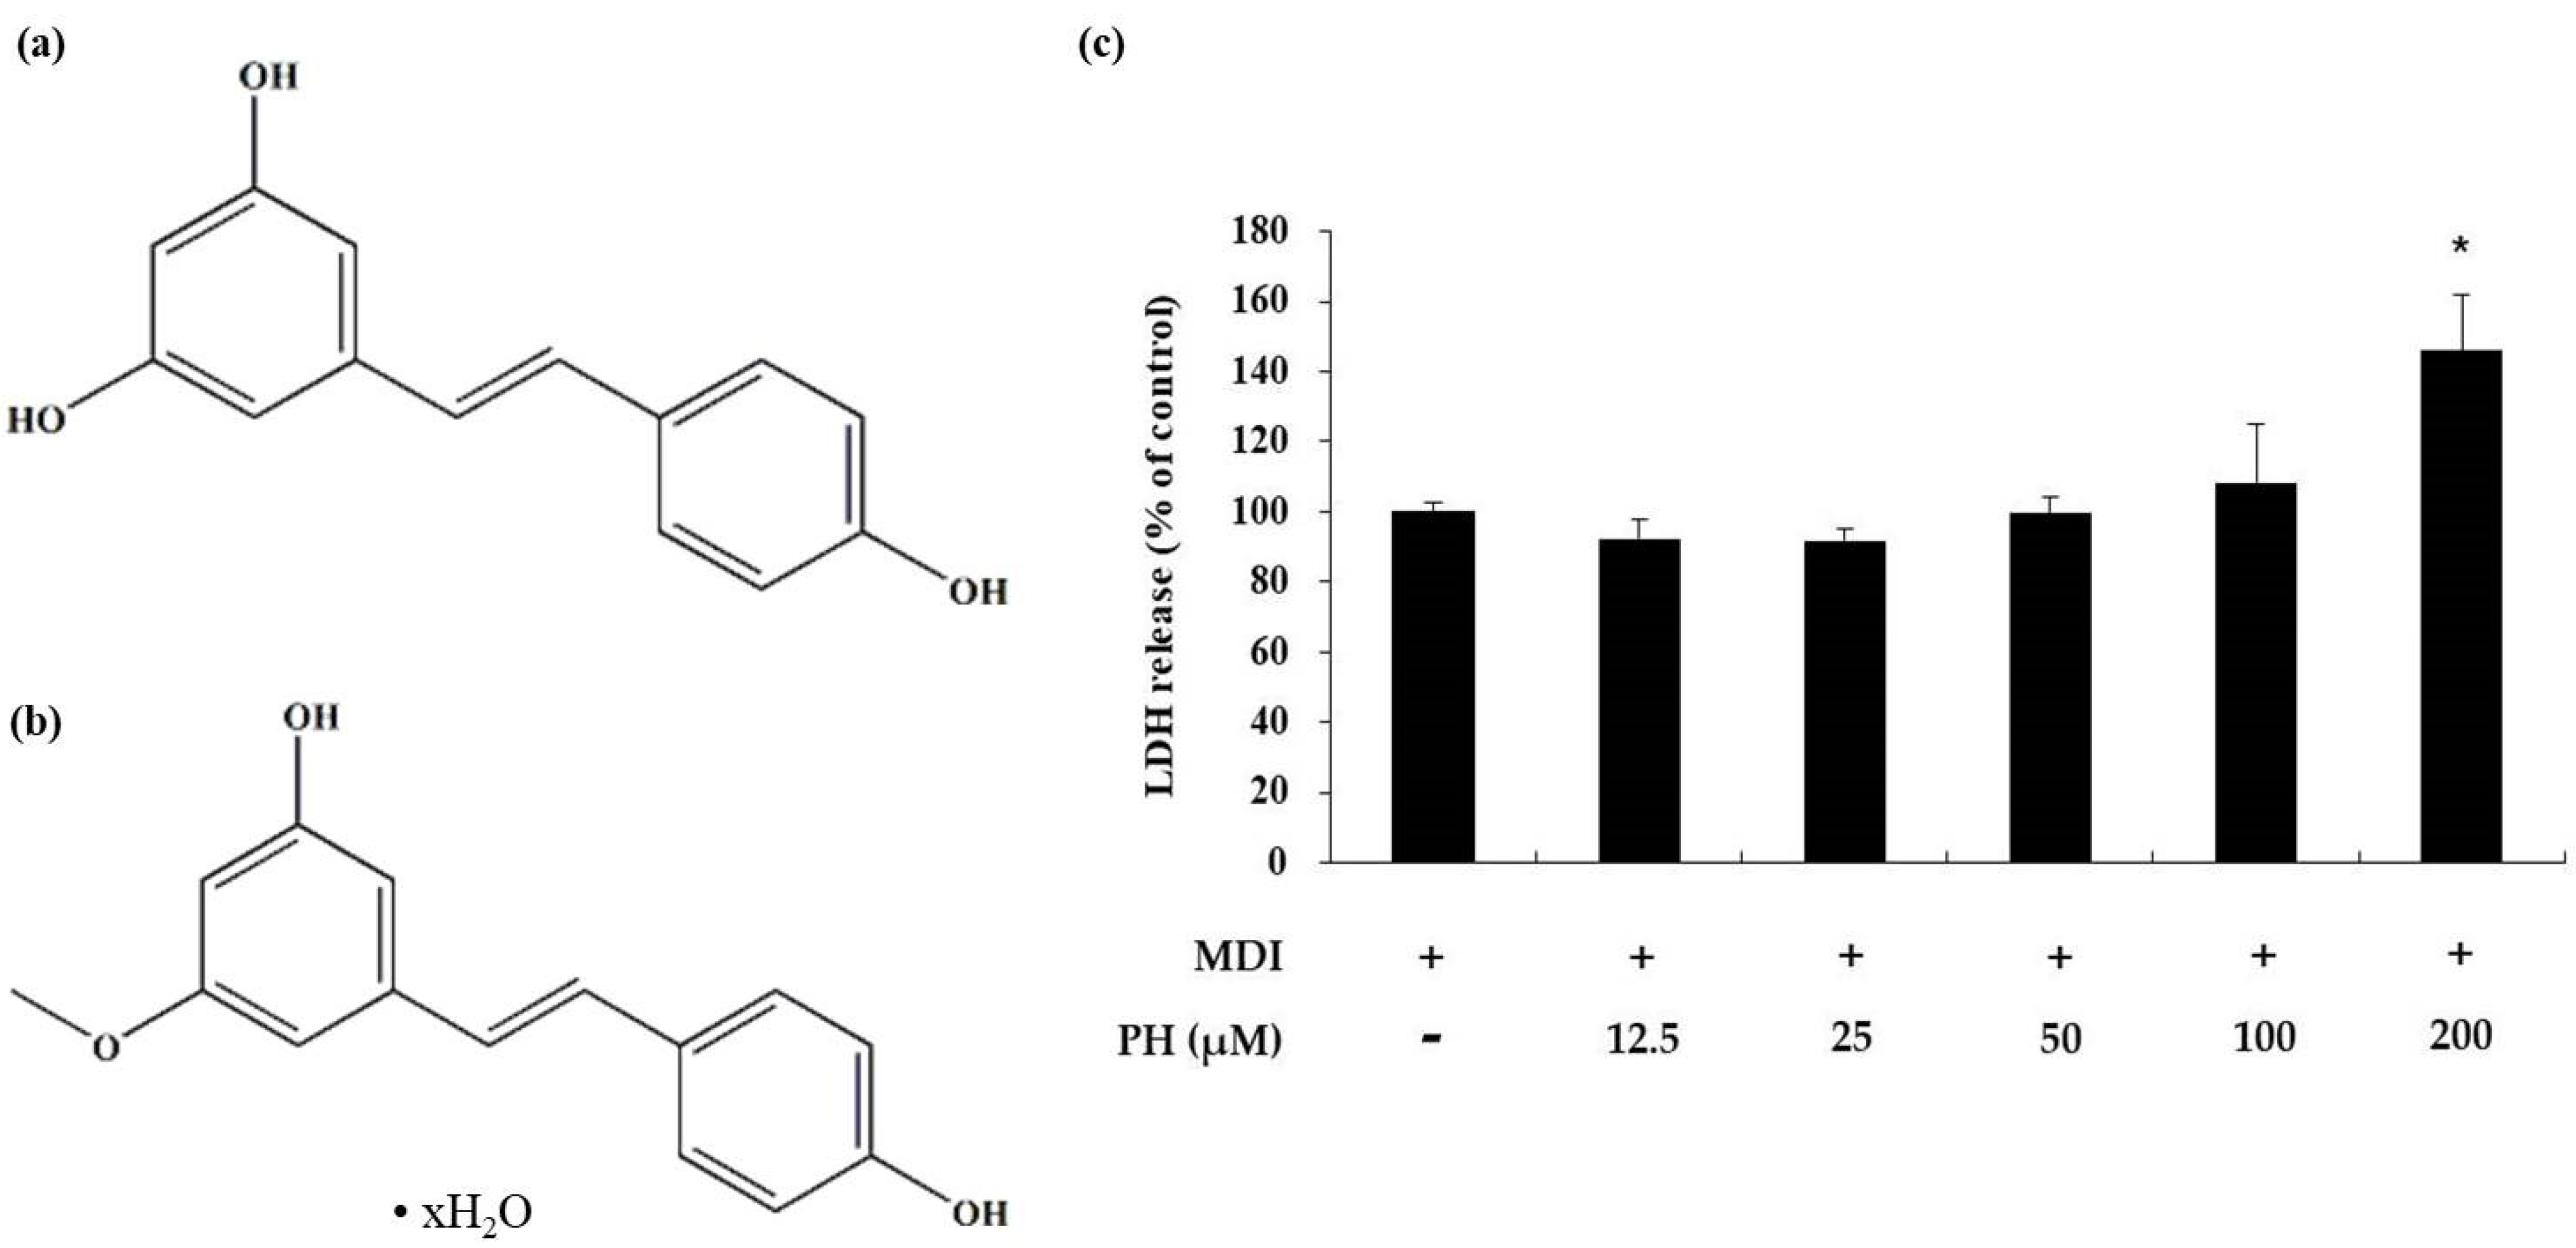
To determine the toxicity of PH toward 3T3-L1 adipocytes, a lactate dehydrogenase (LDH) assay was performed, where the LDH released into the medium was quantified 48 h after differentiation. There was no significant difference in the LDH content in the medium compared with that in the control cells following treatment with 12.5, 25, 50, and 100 μM PH. However, the LDH content in the medium increased by 46% compared with that in control cells following treatment with 200 μM PH (Figure 1c). Based on this result, PH was confirmed to be cytotoxic at 200 μM, and further experiments were performed using 12.5, 25, 50, and 100 μM PH.
2.2. Effect of PH on Lipid Accumulation and Triglyceride Content in 3T3-L1 Adipocytes
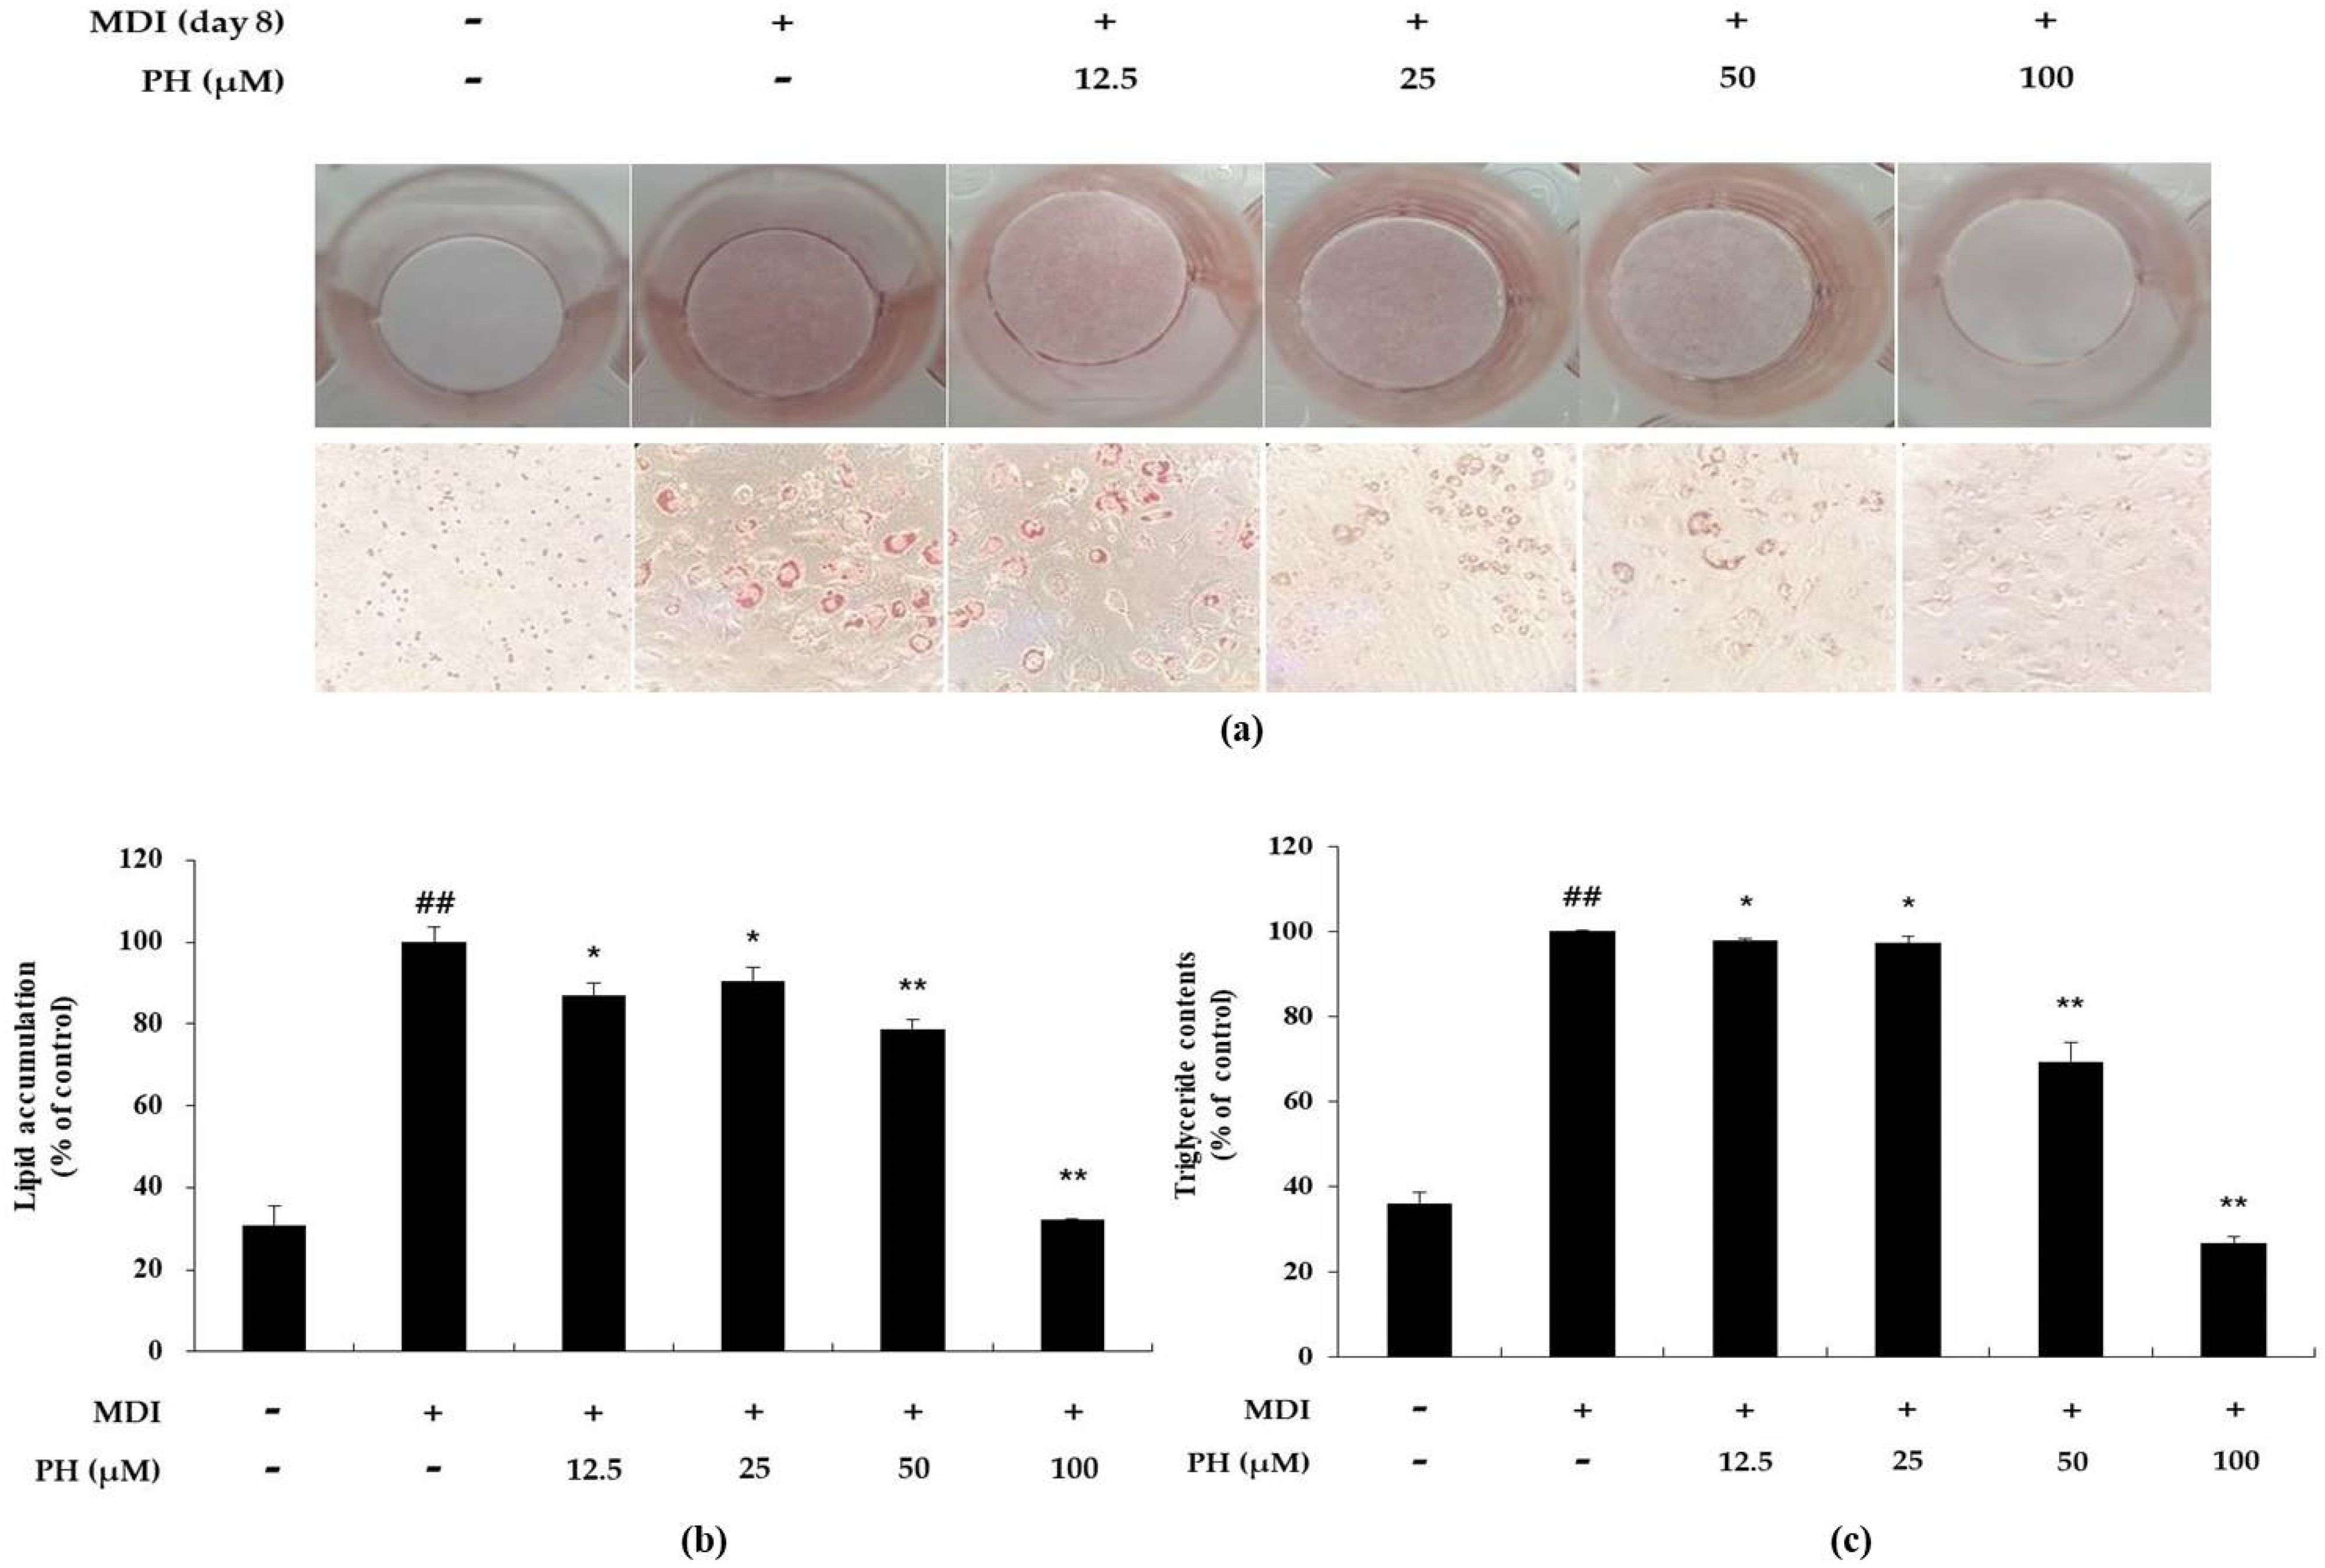
Lipid accumulation was measured and visually confirmed using the Oil Red O (ORO) staining assay. In the present study, to determine whether PH affects the inhibition of lipid accumulation, differentiation was induced in 3T3-L1 cells using a differentiation medium containing various concentrations of PH for 8 days, following which the ORO staining assay was performed. Lipid accumulation was markedly higher (3.2-fold) in differentiation-induced adipocytes than in untreated control cells. However, PH decreased lipid accumulation by 13.2%, 9.4%, 21.3%, and 67.9% at 12.5, 25, 50, and 100 μM, respectively, during adipocyte differentiation (Figure 2b). A triglyceride (TG) content test was performed to determine whether PH also reduced TG content in mature adipocytes. TG content was markedly higher in mature adipocytes, whereas it was reduced by 2.2%, 3.1%, 31.4%, and 72.6% in the presence of PH 12.5, 25, 50, and 100 μM, respectively, compared with that in mature adipocytes (Figure 2c).
2.3. Effect of PH on the Expression of Adipogenesis-Related Transcription Factors
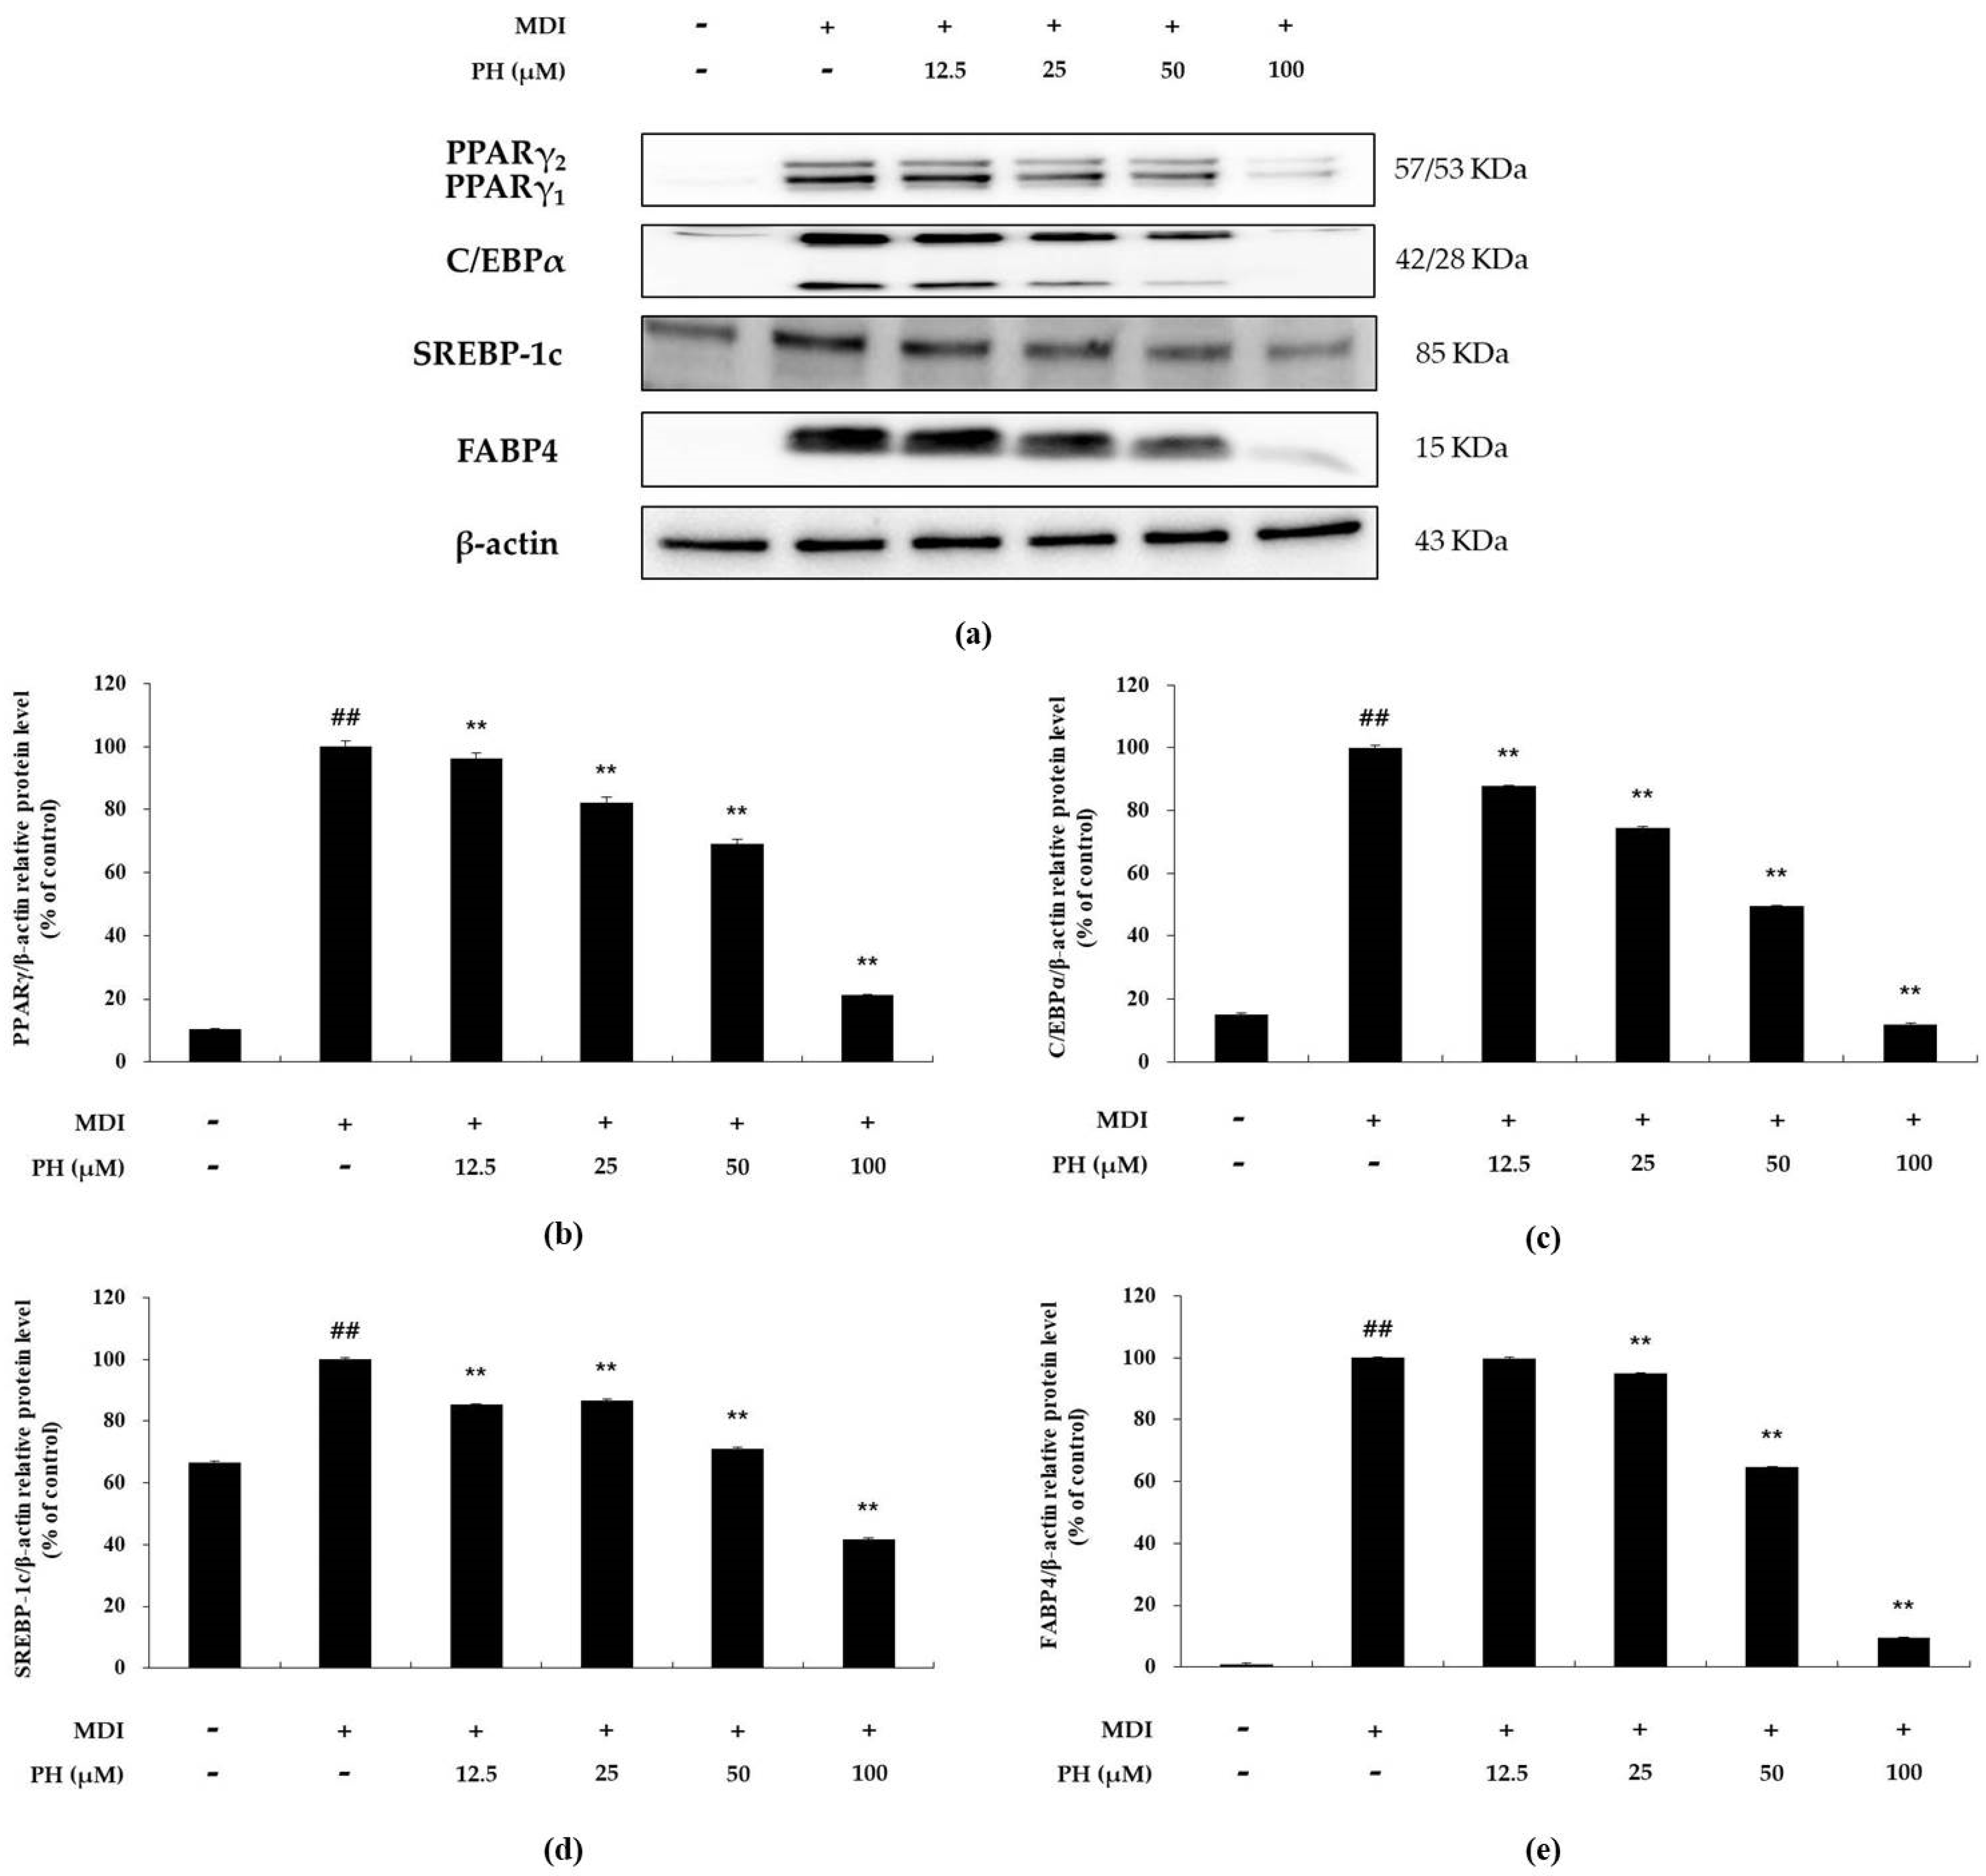
To examine the effect of PH on the expression of adipogenesis-related transcription factors in differentiated 3T3-L1 adipocytes over 6 days, Western blot analysis was performed. The expression of these transcription factors, including PPARγ, C/EBPα, SREBP-1c, and FABP4, was higher in differentiating adipocytes than in untreated control cells. However, the protein levels of these adipogenic regulators were reduced after treatment with the indicated concentrations of PH (Figure 3).
2.4. Effect of PH on the Phosphorylation of MAPK
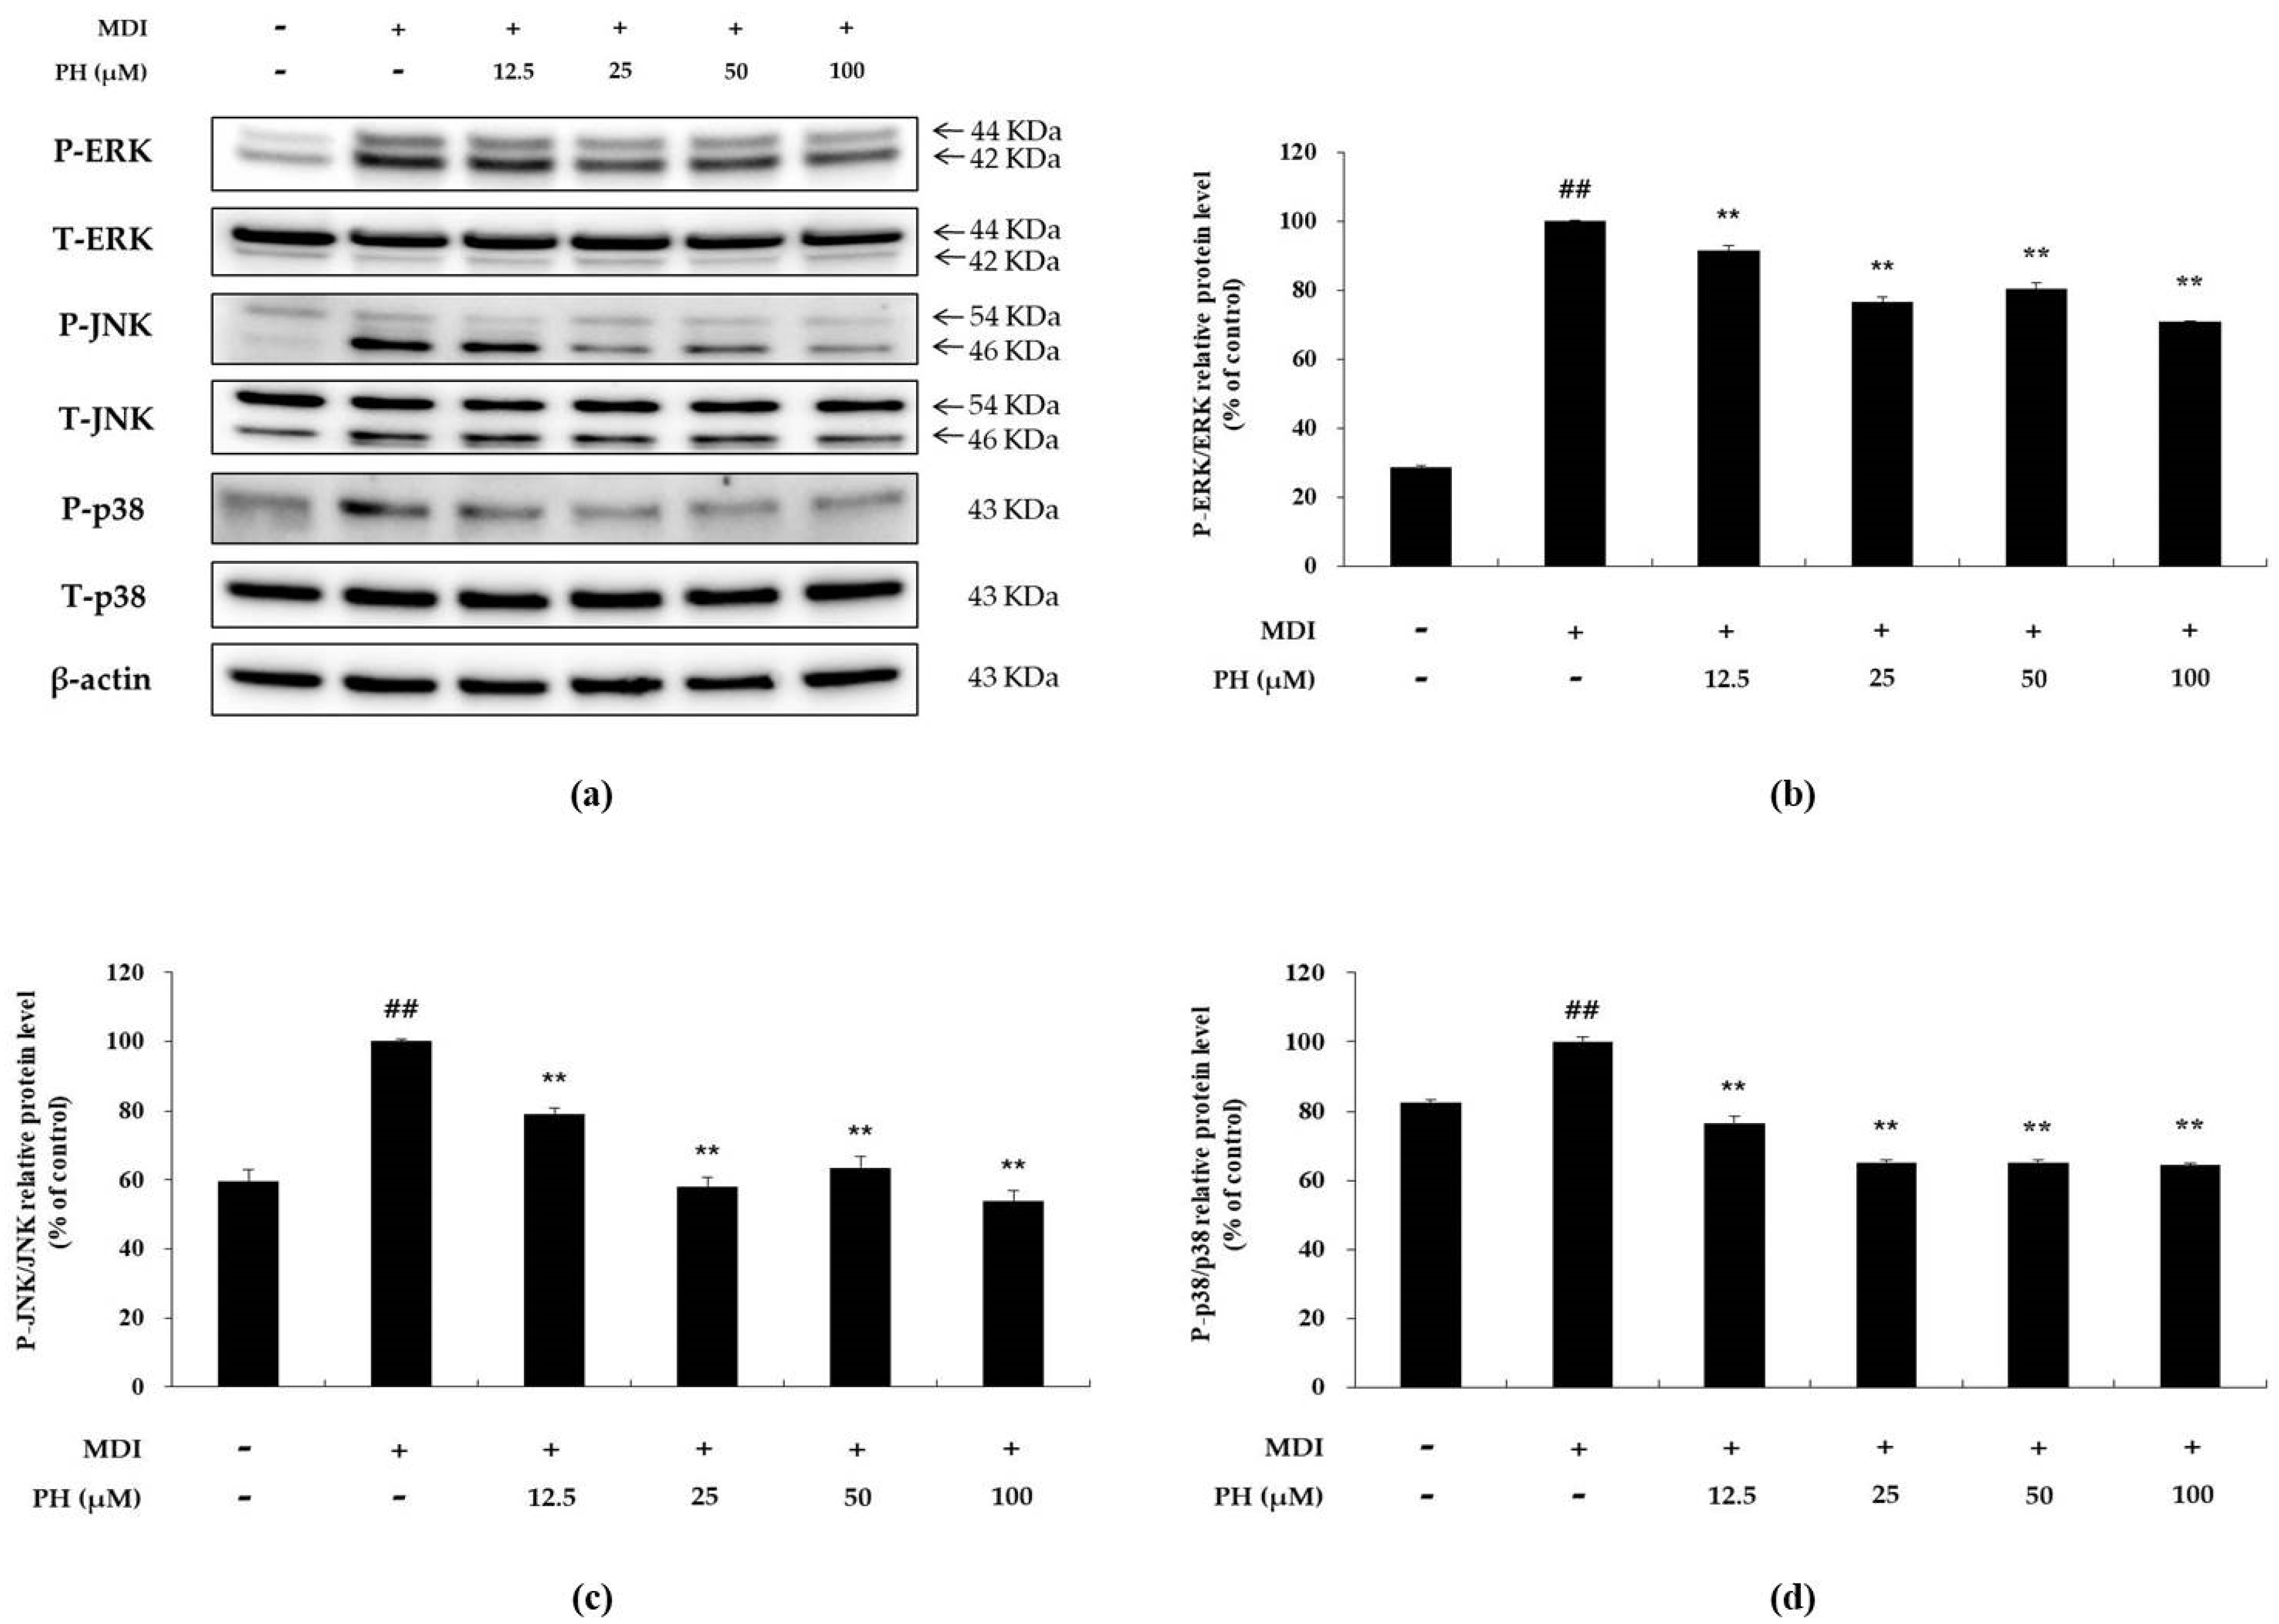
Western blot analysis was performed to determine whether PH inhibits the phosphorylation of ERK (P-ERK), JNK (P-JNK), and p38 (P-p38) in differentiation-induced 3T3-L1 cells. P-ERK, P-JNK, and P-p38 were upregulated in the differentiation-induced cell control compared with their expression in the untreated control. In contrast, these levels were reduced in the PH-treated group compared with those in the differentiation-induced cell control group (Figure 4). Thus, the results indicate that PH attenuates adipogenesis via the inhibition of MAPK phosphorylation in the MAPK signaling pathway.
2.5. Effect of PH on the AKT-Related Signaling Pathways
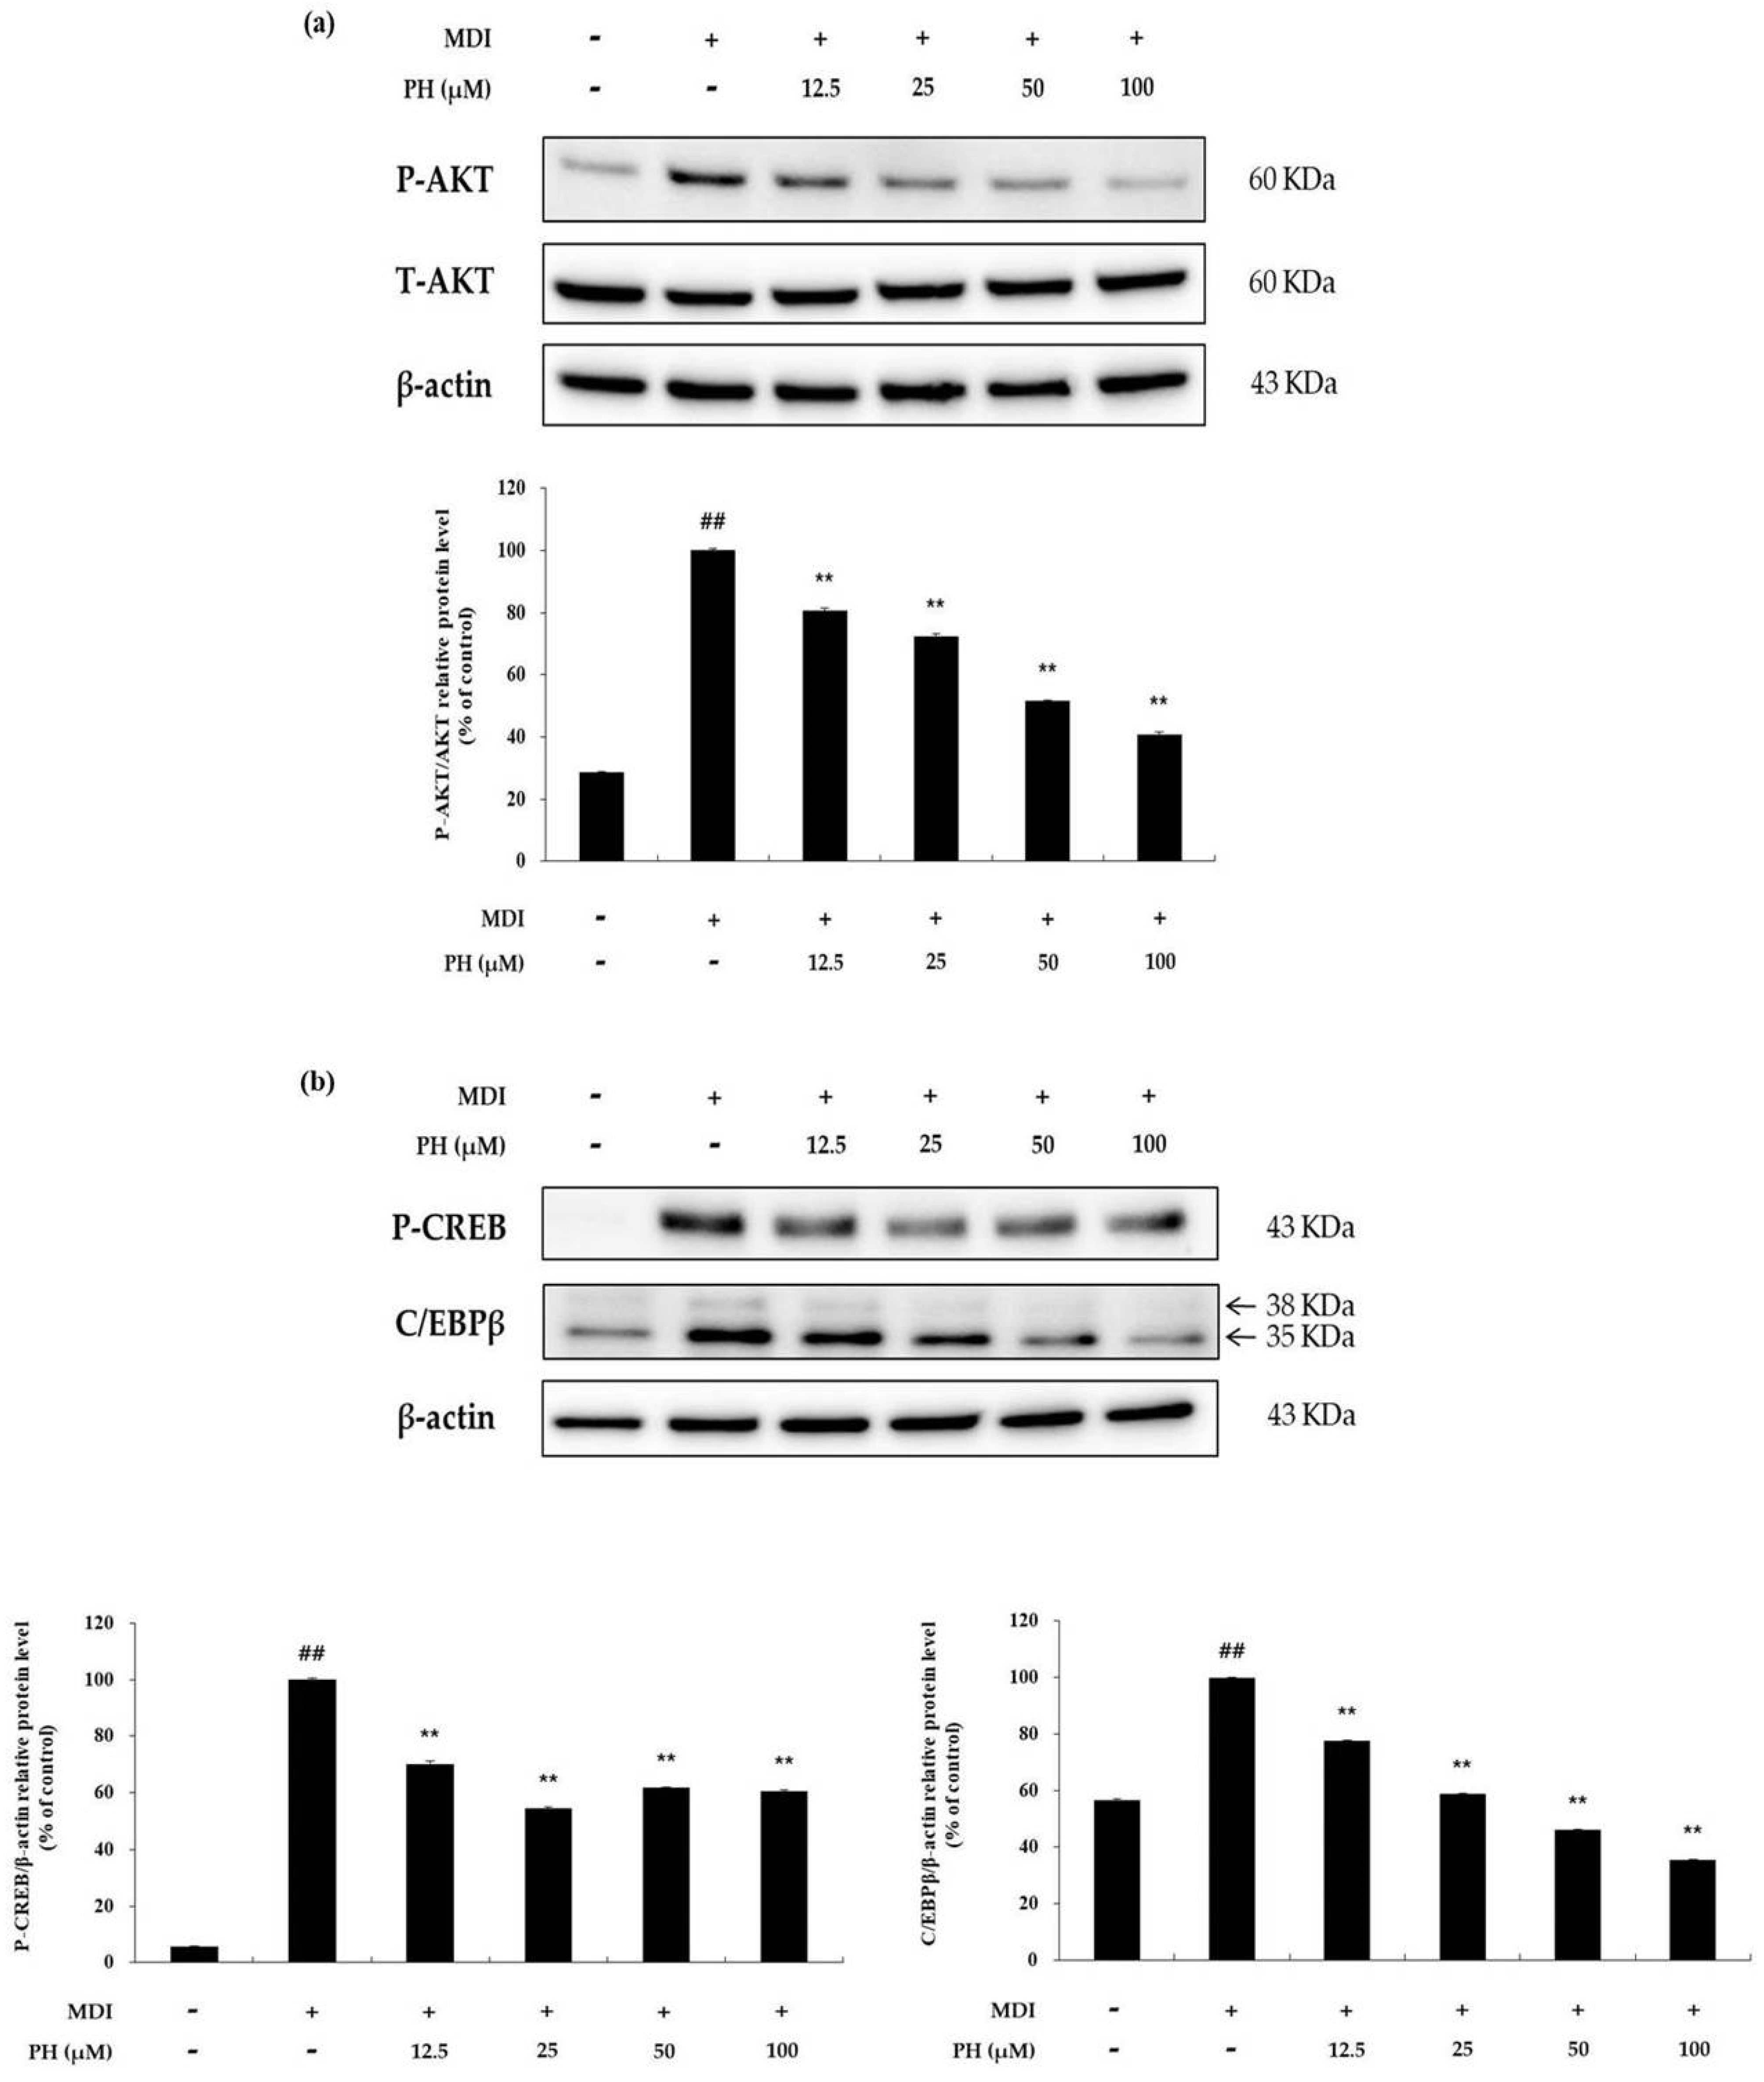
To confirm the effect of PH on the phosphorylation of AKT, the level of P-AKT protein was determined using Western blot analysis. As shown in Figure 5a, P-AKT was markedly higher in the differentiation-induced cell control than in the untreated control, whereas it was significantly decreased by PH treatment in a concentration-dependent manner. P-AKT affects the expression of CREB phosphorylation (P-CREB) and C/EBPβ, which are adipogenesis-related factors. The results showed that P-CREB and C/EBPβ protein expression was reduced by PH treatment compared with that in the differentiation-induced cell control (Figure 5b).
2.6. Effect of PH on the AMPK Signaling Pathway
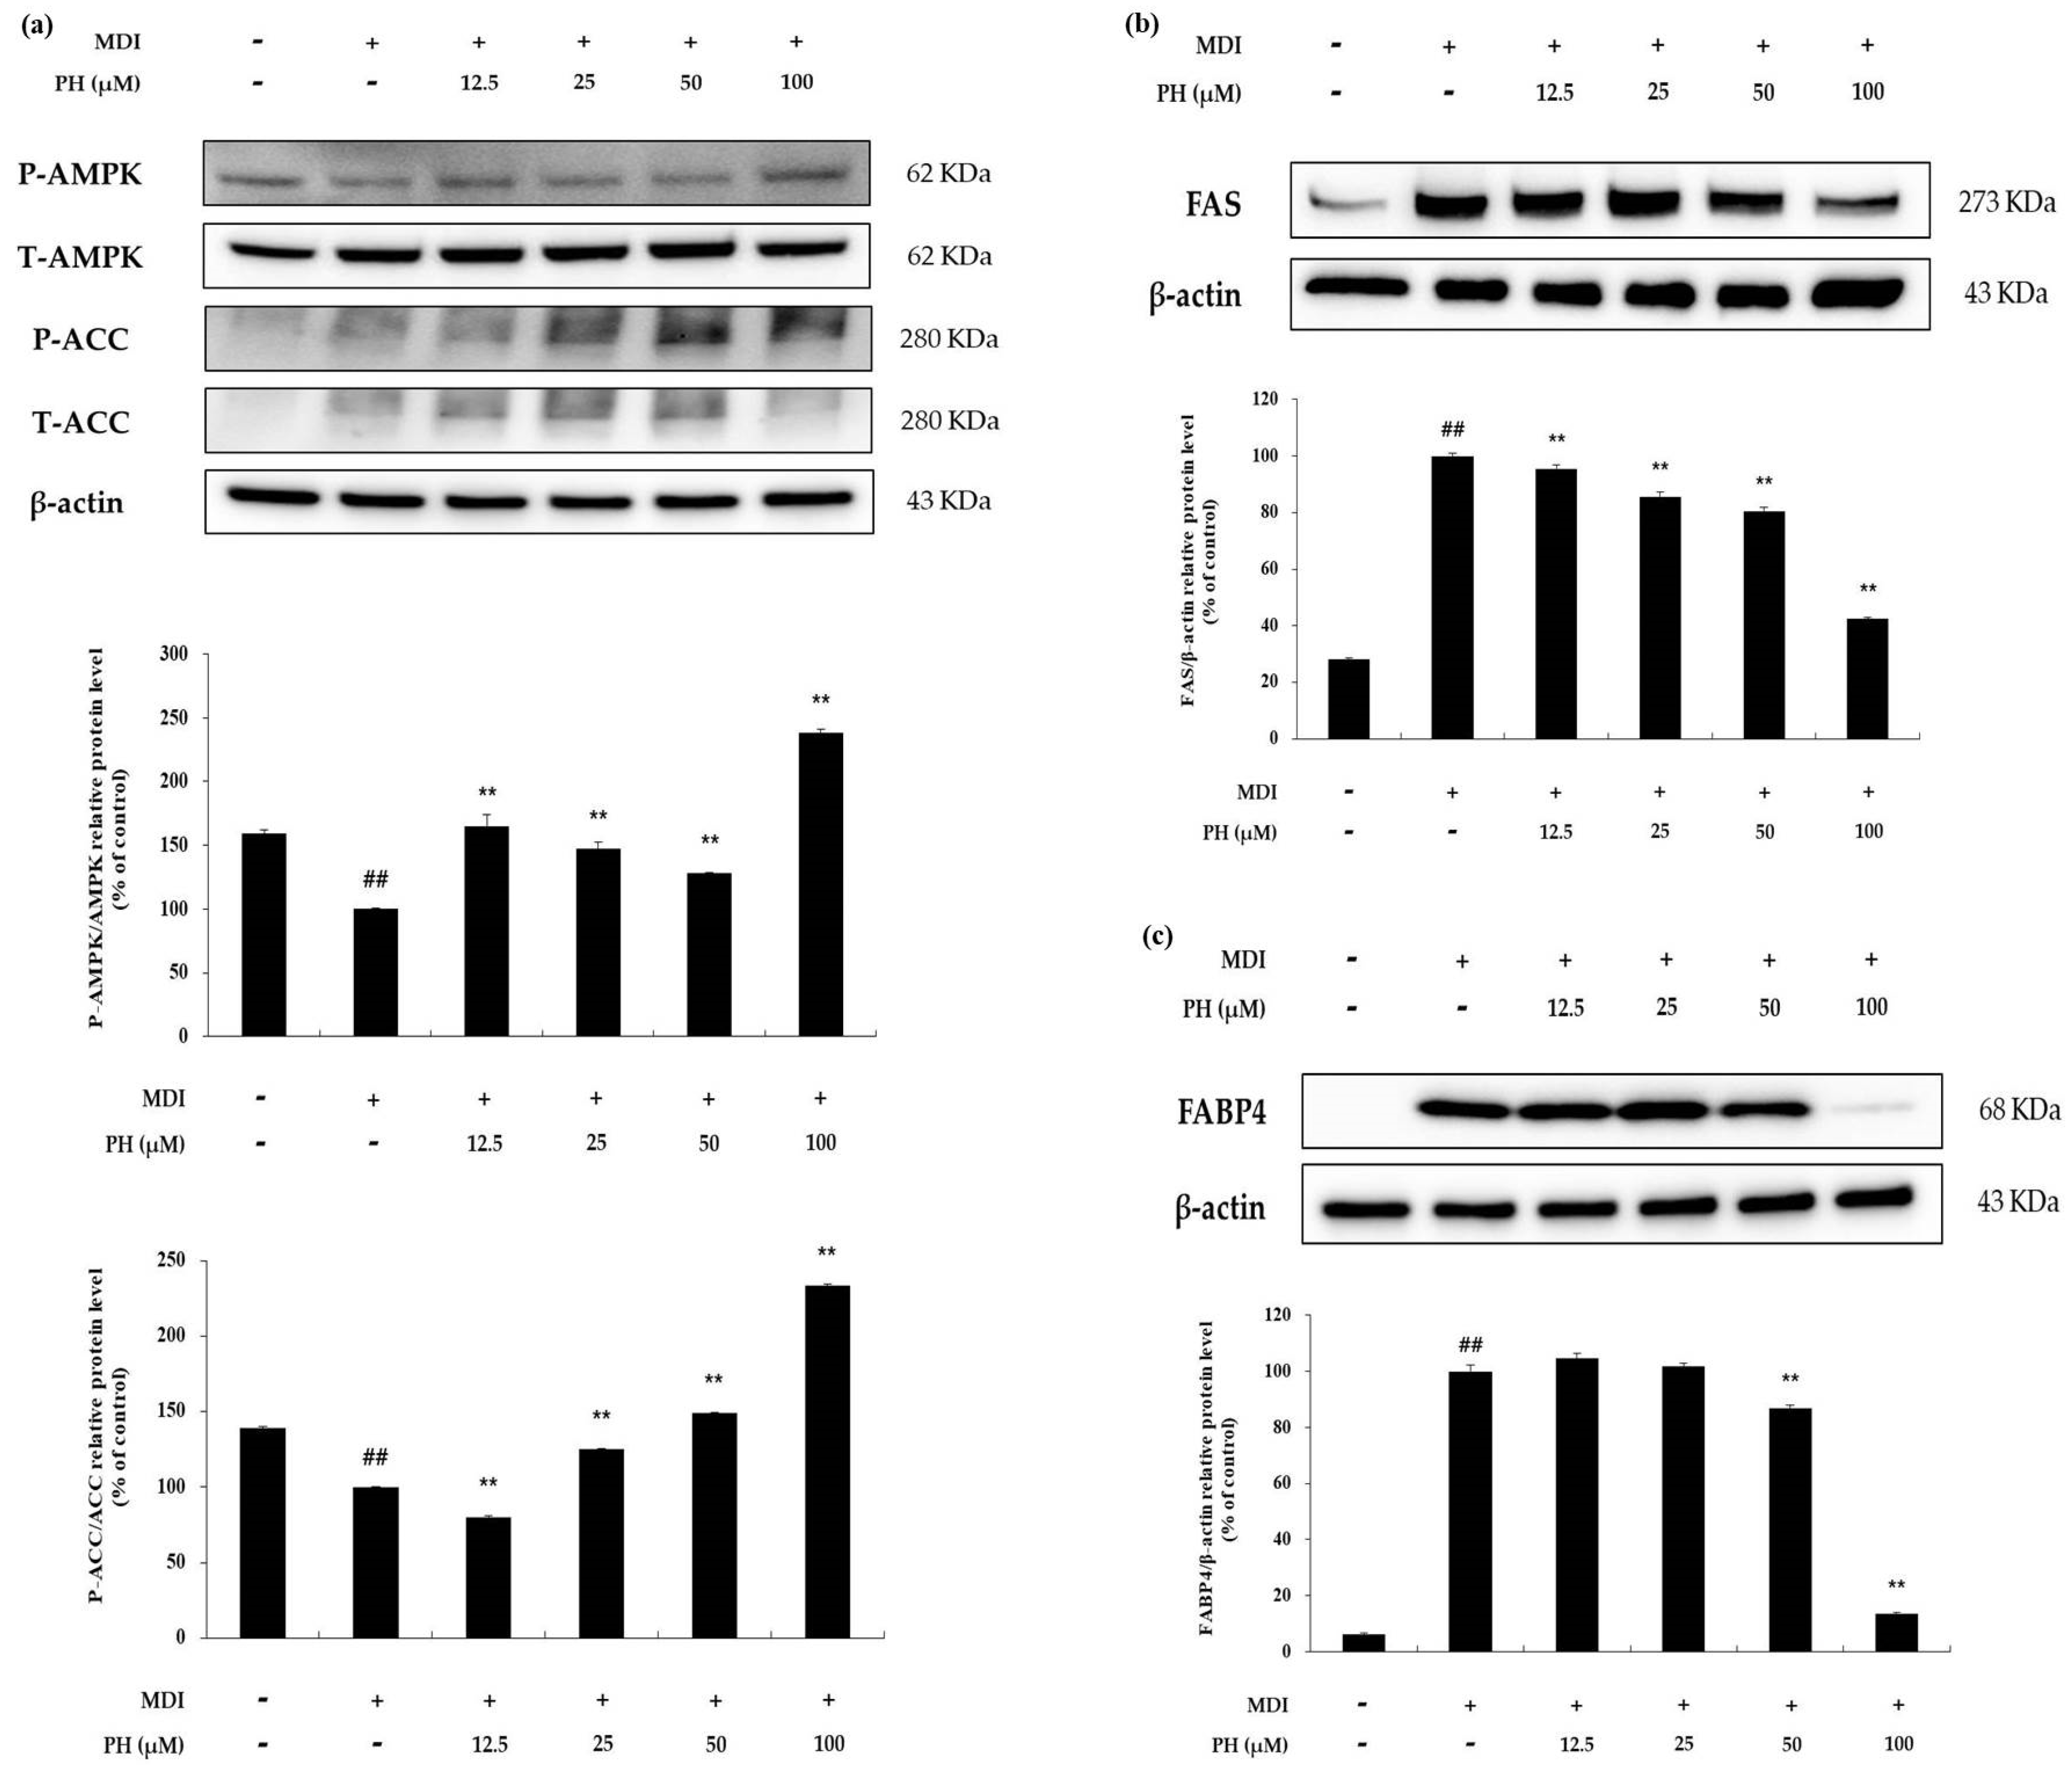
To determine the effect of PH on AMP-activated protein kinase (AMPK) activation, the phosphorylation of AMPK (P-AMPK) and ACC (P-ACC) was detected using Western blot analysis. As shown in Figure 6a, P-AMPK and P-ACC were increased by PH treatment compared with the differentiation-induced cell control. In particular, P-AMPK and P-ACC protein levels were increased by 2.4-fold and 2.3-fold, respectively, after treatment with 100 μM PH. To evaluate the effect of these increases, 3T3-L1 cells were differentiated for 8 days and the expression of lipogenesis-related proteins was determined. The protein expression of FAS and FABP4 was reduced by PH treatment (Figure 6b). These results suggest that PH inhibits lipogenesis in differentiated 3T3-L1 cells by activating the AMPK signaling pathway.
3. Discussion
Adipose tissue plays an important role in maintaining homeostasis in the body through the secretion of various endocrine hormones and cytokines, as well as via energy storage and metabolism [4,5]. Therefore, an increase in adipocyte size (hypertrophy) and their excessive production (hyperplasia) as a result of obesity affect body homeostasis and eventually lead to complications, such as type 2 diabetes, hypertension, hyperlipidemia, cardiovascular disease, and cancer [6,7,8]. Therefore, identifying substances that modulate adipogenesis and studying their mechanisms of action is a possible therapeutic strategy in the treatment of obesity.
Stilbenoid is a polyphenol compound that naturally occurs in various plant species, possesses the basic skeleton of the stilbene structure (C6–C2–C6), and exists in various forms as a derivative of resveratrol [40]. Its bioactive properties include anti-inflammatory, antioxidative, neuroprotective, cardioprotective, anticancer, and anti-obesity effects [34,35,36,37,38,39]. However, the bioavailability and bioactivity of resveratrol are reduced owing to its instability in the environment (sensitivity to UVR, oxygen, alkaline pH, and high temperatures). Therefore, many resveratrol derivatives, especially methylated compounds, have been widely studied [41,42,43,44].
This mechanistic study focused on the anti-adipogenic effects of pinostilbene. The signaling pathways blocked by PH in 3T3-L1 adipocytes were also elucidated. The results showed that PH effectively attenuated adipogenesis in 3T3-L1 adipocytes. To determine the effects of PH on adipogenesis, lipid accumulation and TG content were analyzed using ORO staining and a TG quantification assay kit. In addition, Western blotting was performed to confirm the expression of adipogenesis-related transcription factors, and the signaling pathways involved were elucidated.
LDH is a stable enzyme that exists in the cytoplasm and cannot normally pass through the cell membrane. It is released into the medium when the cell membrane is damaged or during cell death [63]. Therefore, LDH release assays were performed to confirm the non-cytotoxic concentrations of PH; the results showed no toxicity at 12.5, 25, 50, and 100 μM concentrations of PH (Figure 1c). Mature adipocytes form lipid droplets due to the accumulation of lipids, including triglycerides [64]. As shown in Figure 2, treatment with PH led to the inhibition of lipid accumulation and TG content on day 8. These results suggest that PH is associated with the inhibition of adipogenesis through the inhibition of lipid accumulation and TG production at non-cytotoxic concentrations.
According to recent studies, adipogenesis is regulated by key transcription factors, such as C/EBPα, PPARγ, SREBP-1c, FAS, and FABP4 [17,18]. Our analysis of the effects of PH revealed that the protein expression of these transcription factors decreased with increasing concentrations of PH (Figure 3).
A mechanism study was performed to determine whether the activation of any of the several adipogenesis-related mechanisms is inhibited by PH, and, if so, which one. The MAPK signaling pathway is activated by various extracellular stimuli to induce various intracellular responses through phosphorylation of specific sites, and its components include ERK, JNK, and p38. Recent studies have reported that the activation of the MAPK family affects preadipocyte differentiation in the early stages of adipogenesis [28,29]. The MAPK family member ERK plays an important role in cell proliferation and differentiation during adipogenesis. Activated ERK induces the differentiation of preadipocytes into adipocytes by inducing an increase in the expression of the adipogenic transcription factors C/EBPα, C/EBPβ, and PPARγ. [22,28,29]. In addition, p38 MAPK promotes cell differentiation in the early stages of adipogenesis [65,66]. Moreover, JNK MAPK is suggested to be both a negative and positive regulator of adipocyte differentiation [67]. In this study, we showed that phosphorylation of ERK, JNK, and p38 MAPK was decreased by PH treatment (Figure 4). Previous studies have reported that the AKT-dependent signaling pathway is associated with adipogenesis. CREB phosphorylation by P-AKT induces the activation of C/EBPβ in the nucleus, which then upregulates C/EBPα and PPARγ expression, resulting in adipogenesis [68]. In our study, PH significantly decreased the phosphorylation of AKT and showed a tendency to suppress P-CREB and C/EBPβ protein expression (Figure 5). Based on these results, it is suggested that PH suppresses downstream protein activity by inhibiting the phosphorylation of MAPK and AKT, and downregulates the expression of adipogenesis-related transcription factors, ultimately suppressing adipogenesis.
AMP-activated protein kinase (AMPK) regulates energy metabolism through the synthesis and degradation of fatty acids in the body and maintains energy homeostasis. AMPK is activated by phosphorylation at Thr172. Phosphorylated AMPK leads to acetyl-CoA carboxylase (ACC) inactivation, resulting in the attenuation of lipogenesis via the suppression of SREBP-1c, FABP4, and FAS protein expression during adipogenesis [69,70,71,72]. As a result, AMPK and ACC phosphorylation increased upon PH treatment. In addition, the phosphorylation of AMPK and ACC was markedly increased upon treatment with the highest concentration of PH (100 µM, Figure 6a). Moreover, we examined whether the AMPK pathway affects the expression of FAS and FABP4, which are involved in lipogenesis in the late stage of adipogenesis. The results showed that lipogenesis-related protein expression was decreased by PH treatment, suggesting that PH inhibits lipogenesis in mature adipocytes via the AMPK signaling pathway.
Recently, metabolic and pharmacokinetic studies to assess bioavailability have been conducted to confirm not only the biological activities of a specific substance but also its applicability in vivo and, possibly, in humans [73]. These studies may show different results depending on the species, administration route, dose, and pattern [73,74]. It has been reported that the pharmacokinetic profiles of resveratrol and pinostilbene are unfavorable [75,76]. The bioavailability of resveratrol was confirmed through well-established studies on metabolism and pharmacokinetics in rodents (mice and rats), dogs, and humans [43,73]. However, the bioavailability of pinostilbene was suggested through the study of pharmacokinetics in Sprague–Dawley rats [75]. Although pinostilbene is unfavorable in pharmacokinetic studies, metabolic studies have reported that it is a major metabolite of intestinal microbiota pterostilbene and is more stable than resveratrol [56,57]. Therefore, various mammalian and human experiments are required to obtain accurate results on the bioavailability of pinostilbene.
Recent studies have reported that pinostilbene and pterostilbene have similar bioactivities, including anticancer [50,51,58], antioxidant [45,61], and neuroprotective activities [44,52,53,54,55]. The in vivo and in vitro anti-obesity effects of pterostilbene have been previously studied [47,48,49]. However, this study is the first to evaluate the inhibitory effect of pinostilbene on adipogenesis in 3T3-L1 cells. These comparative studies of pterostilbene and its metabolite pinostilbene will play an important role in understanding the pharmacological effects of pterostilbene in in vivo metabolism.
In summary, we showed that PH inhibits lipid and triglyceride accumulation in mature adipocytes. Our mechanistic studies supported a model wherein PH downregulates adipogenesis and lipogenesis by regulating the expression of adipogenesis-related factors via the MAPK and AKT-dependent insulin signaling, and the AMPK signaling pathway. These findings suggest that PH may be used in the prevention of obesity and as a potential therapeutic agent for obesity-related metabolic disorders. However, for direct in vivo application, more studies on bioavailability are needed, and whether PH directly affects adipose tissue through absorption in the intestine should be confirmed.
4. Materials and Methods
4.1. Chemicals and Reagents
PH, dimethyl sulfoxide (DMSO), and the protease inhibitor cocktail were obtained from Sigma-Aldrich (St. Louis, MO, USA). Dulbecco’s Modified Eagle’s Medium (DMEM), fetal bovine serum (FBS), penicillin/streptomycin (P/S), and trypsin–ethylenediaminetetraacetic acid (T/E) were purchased from Thermo Fisher Scientific (Waltham, MA, USA). Bovine calf serum (B/S) was obtained from Gibco™ (Grand Island, MD, USA). Tris-buffered saline (TBS), phosphate-buffered saline (PBS), enhanced chemiluminescence (ECL) kits, and radioimmunoprecipitation assay (RIPA) buffer were obtained from Biosesang (Seongnam, Gyeonggi-do, Korea). Lactate dehydrogenase (LDH), the cytotoxicity assay kit, and the triglyceride quantification assay kit were purchased from DoGenBio (Guro-gu, Seoul, Korea). The 2X Laemmli sample buffer was obtained from Bio-Rad (Hercules, CA, USA). Primary antibodies against FABP4, FAS, C/EBPα, C/EBPβ, PPARγ, phosphor-Ser133-CREB, phospho-Thr172-AMPK, total-AMPK, phosphor-Ser79-ACC, total-ACC, phosphor-Thr180/Tyr182-p38, total-p38, phospho-Thr183/Tyr185-SAPK/JNK, total-JNK, phospho-Thr202/Tyr204-p44/42/ERK, total-ERK, phospho-Ser473-AKT, total-AKT, and β-actin were obtained from Cell Signaling Technology (Danvers, MA, USA). Antibodies against sterol regulatory element-binding protein-1c (SREBP-1c) were obtained from BD Biosciences (San Jose, CA, USA). Protein levels were quantified and graphed using the ImageJ software (NIH, Bethesda, MD, USA). All reagents used were of analytical grade.
4.2. Cell Culture
3T3-L1 preadipocytes were obtained from the American Type Culture Collection (Rockville, MD, USA). The cells were maintained in DMEM containing 10% bovine calf serum and 1% penicillin/streptomycin at 37 °C under 95% air and 5% CO2. The culture medium was replaced every alternate day until 70–80% confluence was reached, and cells were sub-cultured every 3–4 days.
4.3. Adipocyte Differentiation
3T3-L1 preadipocytes were seeded into 24-well plates at a density of 5 × 10⁴ cells/well in B/S medium (DMEM, 10% B/S, 1% P/S) and maintained for 2 days after reaching 100% confluency. After 2 days of confluence (day 0), 3T3-L1 preadipocyte differentiation was induced by MDI differentiation medium containing DMEM, 1% P/S, 10% FBS, 0.5 mM 3-isobutyl-1-methylxanthine (IBMX), 1 μM dexamethasone (DEX), and 10 μg/mL insulin for an additional 2 days. On day 2, cells were incubated in fresh differentiation medium containing DMEM, 1% P/S, 10% FBS, and 10 μg/mL insulin for another 2 days. The cells were then maintained in post-differentiation medium (DMEM, 10% FBS, 1% P/S), which was replaced with fresh medium every 2 days until day 8. PH (12.5, 25, 50, and 100 μM) was added to the cells along with differentiation medium until differentiation was complete.
4.4. Measurement of Cell Cytotoxicity
3T3-L1 preadipocytes were seeded in 24-well plates and incubated until post-confluence. Subsequently, the cells were treated with PH (12.5, 25, 50, 100, and 200 μM) along with MDI differentiation medium (DMEM, 1% P/S, 10% FBS, 0.5 mM IBMX, 1 μM, and 10 μg/mL insulin) for 48 h. After incubation, the culture supernatant and LDH activity in the extracellular medium were quantified using the EZ-LDH assay kit to evaluate cytotoxicity in accordance with the manufacturer’s instructions. The culture medium was used as a volume control (blank), and the absorbance of each well was determined at 450 nm using a spectrophotometer.
4.5. Oil Red O Staining and Triglyceride Analysis
When lipid droplets are formed through adipocyte differentiation, the amount of lipid accumulation can be measured by the ORO staining assay. The cells in 24-well plates were gently washed twice with PBS and fixed with 10% formalin for at least 30 min. Subsequently, the fixed cells were washed gently with deionized water and treated with the prepared ORO working solution, which was added to each well. The cells were then stained for 30 min at 25 °C. The employed ORO working solution was obtained by diluting a twice-filtered ORO stock solution (2-propanol containing 0.5% Oil Red O) with deionized water in a 6:4 ratio. After staining, the staining solution was removed, washed with deionized water, and incubated in PBS. Images of the stained lipid droplets were observed and photographed under a microscope. To quantify the lipid accumulation, 2-propanol (300 μL) was added to each well and incubated in a shaker for 30 min. The absorbance of each well was measured at 540 nm using a spectrophotometer. TG content was measured and quantified using the EZ-TG quantification assay kit (DoGenBio, Guro-gu, Seoul, Korea) in accordance with the manufacturer’s instructions. The lipid and triglyceride contents were analyzed using adipocytes, the differentiation of which was induced from day 0 to 8.
4.6. Western Blot Analysis
3T3-L1 preadipocytes were seeded in 6-well plates and incubated until post-confluence. Thereafter, the cells were treated with PH (12.5, 25, 50, and 100 μM) and MDI differentiation medium (DMEM, 1% P/S, 10% FBS, 0.5 mM IBMX, 1 μM, and 10 μg/mL insulin), and then differentiated for different times to check the expression of various target proteins. The cells in each well were washed with cold PBS and lysed in 200 μL of RIPA buffer containing 1% protease inhibitor cocktail, 150 mM sodium chloride, 1% Triton X-100, 1% sodium deoxycholate, 0.1% SDS, 50 mM Tris-HCl, pH 7.5, and 2 mM EDTA. The cell extract solution was vortexed and centrifuged at 11,000× g to collect the supernatant. The protein level of the supernatant was quantified with a BCA kit, and an equal amount of protein (15–30 μg) was used to prepare each Western loading sample. The Western blot samples were heated for 5 min and cooled on ice. Equal amounts of proteins in each Western blot sample were separated using 6–12% sodium dodecyl sulfate-polyacrylamide gels and transferred to a polyvinylidene difluoride membrane using a Trans-blot Turbo (Bio-Rad, Hercules, CA, USA). The protein-transferred membrane was blocked for 1 h at 25 °C using 5% skim milk in TBST (20 mM Tris base, 137 mM NaCl, pH 7.6, and 0.1% Tween-20), washed six times with TBST each time for 10 min, and subsequently incubated overnight at 4 °C with primary antibodies (1:1000). The membrane was then washed six times with TBST and incubated with secondary antibodies (1:1000) at 25 °C for 1 h, followed by six washes with TBST. The secondary antibody binding the target protein was detected using an ECL kit.
4.7. Statistical Analysis
All experiments were carried out in triplicate, and the results are expressed as the mean ± SD. Differences between the control and treatment groups were evaluated by one-way analysis of variance (ANOVA) using GraphPad Prism. The significance value was determined: * p < 0.05, ** p < 0.01 versus MDI alone, ## p < 0.01 versus untreated cell control.
Author Contributions
All authors contributed significantly to this study. Y.C.C. and C.-G.H. designed the research; Y.C.C. performed the research; Y.C.C. and C.-G.H. analyzed the data; Y.C.C. and C.-G.H. wrote the paper; Y.C.C. and C.-G.H. reviewed and edited the paper. All authors have read and agreed to the published version of the manuscript.
Funding
This research was supported by the 2021 Excellent Research Project for each stage of growth funded by Jeju National University.
Institutional Review Board Statement
Not applicable.
Informed Consent Statement
Not applicable.
Data Availability Statement
The data presented in this study are available on request from the corresponding author.
Conflicts of Interest
The authors declare no conflict of interest.
References
- Carneiro, I.P.; Elliott, S.; Siervo, M.; Padwal, R.; Bertoli, S.; Battezzati, A.; Prado, C.M. Is Obesity Associated with Altered Energy Expenditure? Adv. Nutr. 2016, 7, 476–487. [Google Scholar] [CrossRef] [Green Version]
- Rosen, E.D.; Spiegelman, B.M. Molecular Regulation of Adipogenesis. Annu. Rev. Cell Dev. Biol. 2000, 16, 145–171. [Google Scholar] [CrossRef]
- van Dam, A.D.; Boon, M.R.; Berbée, J.F.; Rensen, P.C.; van Harmelen, V. Targeting white, brown and perivascular adipose tissue in atherosclerosis development. Eur. J. Pharmacol. 2017, 816, 82–92. [Google Scholar] [CrossRef] [PubMed]
- Jo, J.; Gavrilova, O.; Pack, S.; Jou, W.; Mullen, S.; Sumner, A.E.; Cushman, S.W.; Periwal, V. Hypertrophy and/or Hyperplasia: Dynamics of Adipose Tissue Growth. PLoS Comput. Biol. 2009, 5, e1000324. [Google Scholar] [CrossRef]
- Zhang, J.; Tang, H.; Deng, R.; Wang, N.; Zhang, Y.; Wang, Y.; Liu, Y.; Li, F.; Wang, X.; Zhou, L. Berberine Suppresses Adipocyte Differentiation via Decreasing CREB Transcriptional Activity. PLoS ONE 2015, 10, e0125667. [Google Scholar] [CrossRef]
- Guh, D.P.; Zhang, W.; Bansback, N.; Amarsi, Z.; Birmingham, C.L.; Anis, A.H. The incidence of co-morbidities related to obesity and overweight: A systematic review and meta-analysis. BMC Public Health 2009, 9, 1–20. [Google Scholar] [CrossRef] [PubMed] [Green Version]
- Wickelgren, I. Obesity: How Big a Problem? Science 1998, 280, 1364–1367. [Google Scholar] [CrossRef] [PubMed]
- Kang, J.G.; Park, C.-Y. Anti-Obesity Drugs: A Review about Their Effects and Safety. Diabetes Metab. J. 2012, 36, 13–25. [Google Scholar] [CrossRef] [Green Version]
- Morrison, R.F.; Farmer, S.R. Insights into the transcriptional control of adipocyte differentiation. J. Cell Biochem. 1999, 75, 59–67. [Google Scholar] [CrossRef]
- Ahmadian, M.; Duncan, R.; Jaworski, K.; Sarkadi-Nagy, E.; Sul, H.S. Triacylglycerol metabolism in adipose tissue. Futur. Lipidol. 2007, 2, 229–237. [Google Scholar] [CrossRef] [Green Version]
- Coelho, M.; Oliveira, T.; Fernandes, R. Biochemistry of adipose tissue: An endocrine organ. Arch. Med. Sci. 2013, 9, 191–200. [Google Scholar] [CrossRef] [Green Version]
- Trzeciak-Ryczek, A.; Tokarz-Deptuła, B.; Niedźwiedzka-Rystwej, P.; Deptula, W. Adipose tissue—Component of the immune system. Centr. Eur. J. Immunol. 2011, 36, 95–99. [Google Scholar]
- Costa, J.V.; Duarte, J.S. Adipose tissue and adipokines. Acta Med. Port. 2006, 19, 251–256. [Google Scholar]
- Fonseca-Alaniz, M.H.; Takada, J.; Alonso-Vale, M.I.; Lima, F.B. The adipose tissue as a regulatory center of the metabolism. Arq. Bras. Endocrinol. Metabol. 2006, 50, 216–229. [Google Scholar] [CrossRef] [Green Version]
- Kiess, W.; Petzold, S.; Töpfer, M.; Garten, A.; Blüher, S.; Kapellen, T.; Körner, A.; Kratzsch, J. Adipocytes and adipose tissue. Best Pr. Res. Clin. Endocrinol. Metab. 2008, 22, 135–153. [Google Scholar] [CrossRef]
- Laclaustra, M.; Corella, D.; Ordovas, J.M. Metabolic syndrome pathophysiology: The role of adipose tissue. Nutr. Metab. Cardiovasc. Dis. 2007, 17, 125–139. [Google Scholar] [CrossRef] [PubMed] [Green Version]
- Bernlohr, D.; Bolanowski, M.; Kelly, T.J.; Lane, M.D. Evidence for an increase in transcription of specific mRNAs during differentiation of 3T3-L1 preadipocytes. J. Biol. Chem. 1985, 260, 5563–5567. [Google Scholar] [CrossRef]
- Green, H.; Kehinde, O. Spontaneous heritable changes leading to increased adipose conversion in 3T3 cells. Cell 1976, 7, 105–113. [Google Scholar] [CrossRef]
- Tontonoz, P.; Hu, E.; Spiegelman, B.M. Stimulation of adipogenesis in fibroblasts by PPARγ2, a lipid-activated transcription factor. Cell 1994, 79, 1147–1156. [Google Scholar] [CrossRef]
- Huang, B.; Yuan, H.D.; Kim, D.Y.; Quan, H.Y.; Chung, S.H. Cinnamaldehyde Prevents Adipocyte Differentiation and Adipogenesis via Regulation of Peroxisome Proliferator-Activated Receptor-γ (PPARγ) and AMP-Activated Protein Kinase (AMPK) Pathways. J. Agric. Food Chem. 2011, 59, 3666–3673. [Google Scholar] [CrossRef] [PubMed]
- Hsu, C.-L.; Lin, Y.-J.; Ho, C.-T.; Yen, G.-C. Inhibitory effects of garcinol and pterostilbene on cell proliferation and adipogenesis in 3T3-L1 cells. Food Funct. 2011, 3, 49–57. [Google Scholar] [CrossRef]
- Mayer, C.M.; Belsham, D.D. Insulin directly regulates NPY and AgRP gene expression via the MAPK MEK/ERK signal transduction pathway in mHypoE-46 hypothalamic neurons. Mol. Cell. Endocrinol. 2009, 307, 99–108. [Google Scholar] [CrossRef]
- Zhang, H.H.; Huang, J.; Düvel, K.; Boback, B.; Wu, S.; Squillace, R.M.; Wu, C.-L.; Manning, B.D. Insulin Stimulates Adipogenesis through the Akt-TSC2-mTORC1 Pathway. PLoS ONE 2009, 4, e6189. [Google Scholar] [CrossRef] [PubMed]
- Kim, J.B.; Wright, H.M.; Wright, M.; Spiegelman, B.M. ADD1/SREBP1 activates PPAR through the production of endogenous ligand. Proc. Natl. Acad. Sci. USA 1998, 95, 4333–4337. [Google Scholar] [CrossRef] [Green Version]
- Liu, G.-S.; Chan, E.C.; Higuchi, M.; Dusting, G.J.; Jiang, F. Redox Mechanisms in Regulation of Adipocyte Differentiation: Beyond a General Stress Response. Cells 2012, 1, 976–993. [Google Scholar] [CrossRef] [PubMed] [Green Version]
- Zhang, J.; Klemm, D.J.; Vinson, C.; Lane, M.D. Role of CREB in Transcriptional Regulation of CCAAT/Enhancer-binding Protein β Gene during Adipogenesis. J. Biol. Chem. 2004, 279, 4471–4478. [Google Scholar] [CrossRef] [Green Version]
- Clarke, S.L.; Robinson, C.E.; Gimble, J.M. CAAT/Enhancer Binding Proteins Directly Modulate Transcription from the Peroxisome Proliferator- Activated Receptor γ2 Promoter. Biochem. Biophys. Res. Commun. 1997, 240, 99–103. [Google Scholar] [CrossRef]
- Wang, F.; Tong, Q. SIRT2 Suppresses Adipocyte Differentiation by Deacetylating FOXO1 and Enhancing FOXO1’s Repressive Interaction with PPARγ. Mol. Biol. Cell 2009, 20, 801–808. [Google Scholar] [CrossRef] [PubMed] [Green Version]
- Kim, G.-S.; Park, H.J.; Woo, J.-H.; Kim, M.-K.; Koh, P.-O.; Min, W.; Ko, Y.-G.; Kim, C.-H.; Won, C.-K.; Cho, J.-H. Citrus aurantium flavonoids inhibit adipogenesis through the Akt signaling pathway in 3T3-L1 cells. BMC Complement. Altern. Med. 2012, 12, 1–10. [Google Scholar] [CrossRef] [Green Version]
- Towler, M.C.; Hardie, G. AMP-Activated Protein Kinase in Metabolic Control and Insulin Signaling. Circ. Res. 2007, 100, 328–341. [Google Scholar] [CrossRef]
- Carling, D. The AMP-activated protein kinase cascade–a unifying system for energy control. Trends Biochem. Sci. 2004, 29, 18–24. [Google Scholar] [CrossRef]
- Woods, A.; Azzout-Marniche, D.; Foretz, M.; Stein, S.C.; Lemarchand, P.; Ferré, P.; Foufelle, F.; Carling, D. Characterization of the Role of AMP-Activated Protein Kinase in the Regulation of Glucose-Activated Gene Expression Using Constitutively Active and Dominant Negative Forms of the Kinase. Mol. Cell. Biol. 2000, 20, 6704–6711. [Google Scholar] [CrossRef] [PubMed] [Green Version]
- Foretz, M.; Carling, D.; Guichard, C.; Ferré, P.; Foufelle, F. AMP-activated Protein Kinase Inhibits the Glucose-activated Expression of Fatty Acid Synthase Gene in Rat Hepatocytes. J. Biol. Chem. 1998, 273, 14767–14771. [Google Scholar] [CrossRef] [PubMed] [Green Version]
- Shrotriya, S.; Agarwal, R.; Sclafani, R.A. A Perspective on Chemoprevention by Resveratrol in Head and Neck Squamous Cell Carcinoma. Biol. Basis Alcohol Induc. Cancer 2014, 815, 333–348. [Google Scholar] [CrossRef]
- Varoni, E.M.; Lo Faro, A.F.; Sharifi-Rad, J.; Iriti, M. Anticancer Molecular Mechanisms of Resveratrol. Front. Nutr. 2016, 3, 8. [Google Scholar] [CrossRef] [PubMed] [Green Version]
- Buhrmann, C.; Shayan, P.; Kraehe, P.; Popper, B.; Goel, A.; Shakibaei, M. Resveratrol induces chemosensitization to 5-fluorouracil through up-regulation of intercellular junctions, Epithelial-to-mesenchymal transition and apoptosis in colorectal cancer. Biochem. Pharmacol. 2015, 98, 51–68. [Google Scholar] [CrossRef]
- Ma, L.; Li, W.; Wang, R.; Nan, Y.; Wang, Q.; Liu, W.; Jin, F. Resveratrol enhanced anticancer effects of cisplatin on non-small cell lung cancer cell lines by inducing mitochondrial dysfunction and cell apoptosis. Int. J. Oncol. 2015, 47, 1460–1468. [Google Scholar] [CrossRef] [Green Version]
- Frémont, L. Biological effects of resveratrol. Life Sci. 2000, 66, 663–673. [Google Scholar] [CrossRef]
- Lin, F.-Y.; Hsieh, Y.-H.; Yang, S.-F.; Chen, C.-T.; Tang, C.-H.; Chou, M.-Y.; Chuang, Y.-T.; Lin, C.-W.; Chen, M.-K. Resveratrol suppresses TPA-induced matrix metalloproteinase-9 expression through the inhibition of MAPK pathways in oral cancer cells. J. Oral Pathol. Med. 2014, 44, 699–706. [Google Scholar] [CrossRef]
- Akinwumi, B.C.; Bordun, K.-A.M.; Anderson, H.D. Biological Activities of Stilbenoids. Int. J. Mol. Sci. 2018, 19, 792. [Google Scholar] [CrossRef] [Green Version]
- Wen, W.; Lowe, G.; Roberts, C.M.; Finlay, J.; Han, E.S.; Glackin, C.A.; Dellinger, T.H. Pterostilbene Suppresses Ovarian Cancer Growth via Induction of Apoptosis and Blockade of Cell Cycle Progression Involving Inhibition of the STAT3 Pathway. Int. J. Mol. Sci. 2018, 19, 1983. [Google Scholar] [CrossRef] [PubMed] [Green Version]
- Mikstacka, R.; Przybylska, D.; Rimando, A.M.; Baer-Dubowska, W. Inhibition of human recombinant cytochromes P450 CYP1A1 and CYP1B1 bytrans-resveratrol methyl ethers. Mol. Nutr. Food Res. 2007, 51, 517–524. [Google Scholar] [CrossRef]
- Walle, T.; Hsieh, F.; DeLegge, M.H.; Oatis, J.E., Jr.; Walle, U.K. High absorption but very low bioavailability of oral resveratrol in humans. Drug Metab. Dispos. 2004, 32, 1377–1382. [Google Scholar] [CrossRef] [Green Version]
- Chao, J.; Li, H.; Cheng, K.-W.; Yu, M.-S.; Chang, R.C.-C.; Wang, M. Protective effects of pinostilbene, a resveratrol methylated derivative, against 6-hydroxydopamine-induced neurotoxicity in SH-SY5Y cells. J. Nutr. Biochem. 2010, 21, 482–489. [Google Scholar] [CrossRef]
- Chiou, Y.-S.; Tsai, M.-L.; Nagabhushanam, K.; Wang, Y.-J.; Wu, C.-H.; Ho, C.-T.; Pan, M.-H. Pterostilbene Is More Potent than Resveratrol in Preventing Azoxymethane (AOM)-Induced Colon Tumorigenesis via Activation of the NF-E2-Related Factor 2 (Nrf2)-Mediated Antioxidant Signaling Pathway. J. Agric. Food Chem. 2011, 59, 2725–2733. [Google Scholar] [CrossRef]
- Paul, S.; Rimando, A.M.; Lee, H.J.; Ji, Y.; Reddy, B.S.; Suh, N. Anti-inflammatory Action of Pterostilbene Is Mediated through the p38 Mitogen-Activated Protein Kinase Pathway in Colon Cancer Cells. Cancer Prev. Res. 2009, 2, 650–657. [Google Scholar] [CrossRef] [PubMed] [Green Version]
- Kim, S.; Jin, Y.; Choi, Y.; Park, T. Resveratrol exerts anti-obesity effects via mechanisms involving down-regulation of adipogenic and inflammatory processes in mice. Biochem. Pharmacol. 2011, 81, 1343–1351. [Google Scholar] [CrossRef]
- Aguirre, L.; Fernández-Quintela, A.; Arias, N.; Portillo, M.D.P. Resveratrol: Anti-Obesity Mechanisms of Action. Molecules 2014, 19, 18632–18655. [Google Scholar] [CrossRef] [Green Version]
- Chang, C.-C.; Lin, K.-Y.; Peng, K.-Y.; Day, Y.-J.; Hung, L.-M. Resveratrol exerts anti-obesity effects in high-fat diet obese mice and displays differential dosage effects on cytotoxicity, differentiation, and lipolysis in 3T3-L1 cells. Endocr. J. 2016, 63, 169–178. [Google Scholar] [CrossRef] [PubMed] [Green Version]
- Nutakul, W.; Sobers, H.S.; Qiu, P.; Dong, P.; Decker, E.A.; McClements, D.J.; Xiao, H. Inhibitory Effects of Resveratrol and Pterostilbene on Human Colon Cancer Cells: A Side-by-Side Comparison. J. Agric. Food Chem. 2011, 59, 10964–10970. [Google Scholar] [CrossRef] [Green Version]
- Paul, S.; DeCastro, A.J.; Lee, H.J.; Smolarek, A.K.; So, J.Y.; Simi, B.; Wang, C.X.; Zhou, R.; Rimando, A.M.; Suh, N. Dietary intake of pterostilbene, a constituent of blueberries, inhibits the -catenin/p65 downstream signaling pathway and colon carcinogenesis in rats. Carcinogenesis 2010, 31, 1272–1278. [Google Scholar] [CrossRef]
- Richard, T.; Pawlus, A.D.; Iglésias, M.-L.; Pedrot, E.; Waffo-Teguo, P.; Mérillon, J.-M.; Monti, J.-P. Neuroprotective properties of resveratrol and derivatives. Ann. N. Y. Acad. Sci. 2011, 1215, 103–108. [Google Scholar] [CrossRef] [PubMed]
- Bastianetto, S.; Zheng, W.-H.; Quirion, R. Neuroprotective abilities of resveratrol and other red wine constituents against nitric oxide-related toxicity in cultured hippocampal neurons. Br. J. Pharmacol. 2000, 131, 711–720. [Google Scholar] [CrossRef] [PubMed] [Green Version]
- Jin, F.; Wu, Q.; Lu, Y.-F.; Gong, Q.-H.; Shi, J.-S. Neuroprotective effect of resveratrol on 6-OHDA-induced Parkinson’s disease in rats. Eur. J. Pharmacol. 2008, 600, 78–82. [Google Scholar] [CrossRef] [PubMed]
- Ateş, A.; Çayli, S.; Altinoz, E.; Gurses, I.; Yucel, N.; Sener, M.; Kocak, A.; Yologlu, S. Neuroprotection by resveratrol against traumatic brain injury in rats. Mol. Cell. Biochem. 2007, 294, 137–144. [Google Scholar] [CrossRef]
- Selma, M.V.; Espiín, J.C.; Tomás-Barberán, F.A. Interaction between Phenolics and Gut Microbiota: Role in Human Health. J. Agric. Food Chem. 2009, 57, 6485–6501. [Google Scholar] [CrossRef]
- Jarosova, V.; Vesely, O.; Marsik, P.; Jaimes, J.D.; Smejkal, K.; Kloucek, P.; Havlík, J. Metabolism of Stilbenoids by Human Faecal Microbiota. Molecules 2019, 24, 1155. [Google Scholar] [CrossRef] [PubMed] [Green Version]
- Sun, Y.; Wu, X.; Cai, X.; Song, M.; Zheng, J.; Pan, C.; Qiu, P.; Zhang, L.; Zhou, S.; Tang, Z.; et al. Identification of pinostilbene as a major colonic metabolite of pterostilbene and its inhibitory effects on colon cancer cells. Mol. Nutr. Food Res. 2016, 60, 1924–1932. [Google Scholar] [CrossRef]
- Wang, T.T.Y.; Schoene, N.W.; Kim, Y.S.; Mizuno, C.S.; Rimando, A.M. Differential effects of resveratrol and its naturally occurring methylether analogs on cell cycle and apoptosis in human androgen-responsive LNCaP cancer cells. Mol. Nutr. Food Res. 2010, 54, 335–344. [Google Scholar] [CrossRef]
- Hsieh, M.-J.; Chin, M.-C.; Lin, C.-C.; His, Y.-T.; Lo, Y.-S.; Chuang, Y.-C.; Chen, M.-K. Pinostilbene Hydrate Suppresses Human Oral Cancer Cell Metastasis by Downregulation of Matrix Metalloproteinase-2 Through the Mitogen-Activated Protein Kinase Signaling Pathway. Cell. Physiol. Biochem. 2018, 50, 911–923. [Google Scholar] [CrossRef]
- Chung, Y.C.; Hyun, C.-G. Inhibitory Effects of Pinostilbene Hydrate on Melanogenesis in B16F10 Melanoma Cells via ERK and p38 Signaling Pathways. Int. J. Mol. Sci. 2020, 21, 4732. [Google Scholar] [CrossRef] [PubMed]
- Uesugi, D.; Hamada, H.; Shimoda, K.; Kubota, N.; Ozaki, S.-I.; Nagatani, N. Synthesis, oxygen radical absorbance capacity, and tyrosinase inhibitory activity of glycosides of resveratrol, pterostilbene, and pinostilbene. Biosci. Biotechnol. Biochem. 2017, 81, 226–230. [Google Scholar] [CrossRef] [Green Version]
- Smith, S.M.; Wunder, M.B.; Norris, D.A.; Shellman, Y.G. A Simple Protocol for Using a LDH-Based Cytotoxicity Assay to Assess the Effects of Death and Growth Inhibition at the Same Time. PLoS ONE 2011, 6, e26908. [Google Scholar] [CrossRef] [PubMed]
- Kang, S.U.; Kim, H.J.; Kim, D.H.; Han, C.H.; Lee, Y.S.; Kim, C.-H. Nonthermal plasma treated solution inhibits adipocyte differentiation and lipogenesis in 3T3-L1 preadipocytes via ER stress signal suppression. Sci. Rep. 2018, 8, 2277. [Google Scholar] [CrossRef] [Green Version]
- Engelman, J.A.; Berg, A.H.; Lewis, R.Y.; Lin, A.; Lisanti, M.P.; Scherer, P.E. Constitutively Active Mitogen-activated Protein Kinase Kinase 6 (MKK6) or Salicylate Induces Spontaneous 3T3-L1 Adipogenesis. J. Biol. Chem. 1999, 274, 35630–35638. [Google Scholar] [CrossRef] [PubMed] [Green Version]
- Guru, A.; Issac, P.K.; Velayutham, M.; Saraswathi, N.T.; Arshad, A.; Arockiaraj, J. Molecular mechanism of down-regulating adipogenic transcription factors in 3T3-L1 adipocyte cells by bioactive anti-adipogenic compounds. Mol. Biol. Rep. 2020, 48, 743–761. [Google Scholar] [CrossRef] [PubMed]
- Qi, R.; Liu, H.; Wang, Q.; Wang, J.; Yang, F.; Long, D.; Huang, J. Expressions and Regulatory Effects of P38/ERK/JNK Mapks in the Adipogenic Trans-Differentiation of C2C12 Myoblasts. Cell. Physiol. Biochem. 2017, 44, 2467–2475. [Google Scholar] [CrossRef] [Green Version]
- Son, Y.H.; Ka, S.; Kim, A.Y.; Kim, J.B. Regulation of Adipocyte Differentiation via MicroRNAs. Endocrinol. Metab. 2014, 29, 122–135. [Google Scholar] [CrossRef] [PubMed] [Green Version]
- Hardie, D.G.; Ross, F.A.; Hawley, S.A. AMPK: A nutrient and energy sensor that maintains energy homeostasis. Nat. Rev. Mol. Cell Biol. 2012, 13, 251–262. [Google Scholar] [CrossRef] [Green Version]
- Herzig, S.; Shaw, R.J. AMPK: Guardian of metabolism and mitochondrial homeostasis. Nat. Rev. Mol. Cell Biol. 2018, 19, 121–135. [Google Scholar] [CrossRef] [Green Version]
- Day, E.A.; Ford, R.J.; Steinberg, G.R. AMPK as a Therapeutic Target for Treating Metabolic Diseases. Trends Endocrinol. Metab. 2017, 28, 545–560. [Google Scholar] [CrossRef] [PubMed]
- Laurent, G.; German, N.J.; Saha, A.; de Boer, V.; Davies, M.; Koves, T.; Dephoure, N.; Fischer, F.; Boanca, G.; Vaitheesvaran, B.; et al. SIRT4 Coordinates the Balance between Lipid Synthesis and Catabolism by Repressing Malonyl CoA Decarboxylase. Mol. Cell 2013, 50, 686–698. [Google Scholar] [CrossRef] [PubMed] [Green Version]
- Wang, P.; Sang, S. Metabolism and pharmacokinetics of resveratrol and pterostilbene. BioFactors 2018, 44, 16–25. [Google Scholar] [CrossRef]
- Jeon, J.-H.; Kang, B.; Lee, S.; Jin, S.; Choi, M.-K.; Song, I.-S. Pharmacokinetics and Intestinal Metabolism of Compound K in Rats and Mice. Pharmaceutics 2020, 12, 129. [Google Scholar] [CrossRef] [PubMed] [Green Version]
- Chen, W.; Yeo, S.C.M.; Chuang, X.F.; Lin, H.-S. Determination of pinostilbene in rat plasma by LC–MS/MS: Application to a pharmacokinetic study. J. Pharm. Biomed. Anal. 2016, 120, 316–321. [Google Scholar] [CrossRef]
- Chen, W.; Yeo, S.C.M.; Elhennawy, M.G.A.A.; Lin, H.-S. Oxyresveratrol: A bioavailable dietary polyphenol. J. Funct. Foods 2016, 22, 122–131. [Google Scholar] [CrossRef]
Figure 1.
Effects of PH on cytotoxicity in 3T3-L1 adipocytes. The chemical structure of (a) resveratrol and (b) pinostilbene hydrate. Adipocyte differentiation was induced in post-confluent cells using IBMX/DEX/insulin (MDI) differentiation medium, and the cells were treated with the indicated concentrations of PH for 48 h. (c) Cytotoxicity was measured using the LDH assay. LDH release is expressed as percentages relative to the control group (MDI treated only). All values are presented as the mean ± standard deviation. (n = 3 per group). * indicates significantly different versus MDI alone (p < 0.05).

Figure 2.
Effect of PH on lipid accumulation and triglyceride content in 3T3-L1 adipocytes. Adipocyte differentiation was induced in post-confluent cells using MDI differentiation medium, and the cells were treated with the indicated concentrations of PH for 8 days. (a) Differentiated adipocytes were stained using Oil Red O on day 8 and the cells were visualized by microscopy with 100× magnification. (b) The stained lipid droplets were dissolved using 2-propanol and measured using a spectrophotometer to quantify lipid accumulation. (c) The reduction in TG content was quantified using the EZ-triglyceride quantification assay kit. Lipid accumulation and TG content are expressed as percentages relative to the control group treated with MDI alone. All values are presented as the mean ± standard deviation. (n = 3 per group). * p < 0.05, ** p < 0.01 indicate significant differences versus the MDI-only control. ## p < 0.01 indicates significant differences versus an untreated control.

Figure 3.
Effect of PH on the expression of adipogenesis-related transcription factors. Adipocyte differentiation was induced in post-confluent cells using MDI differentiation medium and treated with the indicated concentrations of PH for 6 days. (a) Western blot of PPARγ, C/EBPα, SREBP-1c, FABP4, and β-actin in 3T3-L1 adipocytes. The relative protein levels of (b) PPARγ/β-actin, (c) C/EBPα/β-actin, (d) SREBP-1c/β-actin, and (e) FABP4/β-actin are presented as the mean ± standard deviation of three independent measurements using the ImageJ program. The results in the relative protein levels are expressed as percentages relative to the control group treated with MDI alone. ** p < 0.01 indicates significant differences versus the MDI-only control. ## p < 0.01 indicates significant differences versus an untreated control.

Figure 4.
Effect of PH on the phosphorylation of MAPK. Adipocyte differentiation was induced in post-confluent cells using MDI differentiation medium, and the cells were treated with indicated concentrations of PH for 30 min. (a) The Western blot result of P-ERK/ERK, P-JNK/JNK, P-p38/p38, and β-actin in 3T3-L1 adipocytes. The relative protein levels of (b) P-ERK/ERK, (c) P-JNK/JNK, and (d) P-p38/p38 are presented as the mean ± standard deviation of three independent measurements using the ImageJ program. The results of the relative protein levels are expressed as percentages relative to the control cells treated with MDI alone. ** p < 0.01 indicates significant differences versus the MDI-only control. ## p < 0.01 indicates significant differences versus an untreated control.

Figure 5.
Effect of PH on the AKT-related signaling pathways. Adipocyte differentiation was induced in post-confluent cells using MDI differentiation medium, and the cells were treated with indicated concentrations of PH for 30 min (AKT) and 2 h (P-CREB, C/EBPβ). (a) Results of Western blotting and protein levels of P-AKT/AKT and β-actin. (b) Results of Western blotting and protein levels of P-CREB, C/EBPβ, and β-actin in 3T3-L1 adipocytes. The relative protein levels of P-AKT/AKT, P-CREB/β-actin, and C/EBPβ/β-actin are presented as the mean ± standard deviation of three independent measurements using the ImageJ program. The results in the relative protein levels are expressed as percentages relative to the control cells treated with MDI alone. ** p < 0.01 indicates significant differences versus the MDI-only control. ## p < 0.01 indicates significant differences versus an untreated control.

Figure 6.
Effect of PH on the AMPK signaling pathway. Adipocyte differentiation was induced in post-confluent cells using MDI differentiation medium, followed by treatment with the indicated concentrations of PH for 6 days (AMPK, ACC) and 8 days (FAS, FABP4). (a) Results of the Western blotting analysis and the protein levels of P-AMPK/AMPK, P-ACC/ACC, and β-actin. (b) Results of the Western blotting analysis and the protein levels of FAS and β-actin in 3T3-L1 adipocytes. (c) Results of the Western blotting analysis and the protein levels of FABP4 and β-actin in 3T3-L1 adipocytes. The relative protein levels of P-AMPK/AMPK, P-ACC/ACC, FAS/β-actin, and FABP4/β-actin are presented as the mean ± standard deviation of three independent measurements using the ImageJ program. The relative protein levels are expressed as percentages relative to the protein levels of control cells treated with MDI alone. ** p < 0.01 indicates significant differences versus the MDI-only control. ## p < 0.01 indicates significant differences versus an untreated control.

Publisher’s Note: MDPI stays neutral with regard to jurisdictional claims in published maps and institutional affiliations. |
© 2021 by the authors. Licensee MDPI, Basel, Switzerland. This article is an open access article distributed under the terms and conditions of the Creative Commons Attribution (CC BY) license (https://creativecommons.org/licenses/by/4.0/).
Share and Cite
MDPI and ACS Style
Chung, Y.C.; Hyun, C.-G. Inhibitory Effects of Pinostilbene on Adipogenesis in 3T3-L1 Adipocytes: A Study of Possible Mechanisms. Int. J. Mol. Sci. 2021, 22, 13446. https://0-doi-org.brum.beds.ac.uk/10.3390/ijms222413446
AMA Style
Chung YC, Hyun C-G. Inhibitory Effects of Pinostilbene on Adipogenesis in 3T3-L1 Adipocytes: A Study of Possible Mechanisms. International Journal of Molecular Sciences. 2021; 22(24):13446. https://0-doi-org.brum.beds.ac.uk/10.3390/ijms222413446
Chicago/Turabian StyleChung, You Chul, and Chang-Gu Hyun. 2021. "Inhibitory Effects of Pinostilbene on Adipogenesis in 3T3-L1 Adipocytes: A Study of Possible Mechanisms" International Journal of Molecular Sciences 22, no. 24: 13446. https://0-doi-org.brum.beds.ac.uk/10.3390/ijms222413446
Note that from the first issue of 2016, this journal uses article numbers instead of page numbers. See further details here.