Article

Morphological Characterization and Transcriptome Analysis of New Dwarf and Narrow-Leaf (dnl2) Mutant in Maize

1
National Engineer Laboratory of Crop Molecular Breeding, Institute of Crop Sciences, Chinese Academy of Agricultural Sciences, Beijing 100081, China
2
National Nanfan Research Institute (Sanya), Chinese Academy of Agricultural Sciences, Sanya 572024, China
*
Authors to whom correspondence should be addressed.
Int. J. Mol. Sci. 2022, 23(2), 795; https://0-doi-org.brum.beds.ac.uk/10.3390/ijms23020795
Submission received: 18 December 2021 / Revised: 6 January 2022 / Accepted: 7 January 2022 / Published: 12 January 2022
(This article belongs to the Special Issue Molecular Research in Maize)

Abstract

:
Lodging is the primary factor limiting high yield under a high plant density. However, an optimal plant height and leaf shape can effectively decrease the lodging risk. Here we studied an ethyl methanesulfonate (EMS)-induced dwarf and a narrow-leaf mutant, dnl2. Gene mapping indicated that the mutant was controlled by a gene located on chromosome nine. Phenotypic and cytological observations revealed that dnl2 showed inhibited cell growth, altered vascular bundle patterning, and disrupted secondary cell wall structure when compared with the wild-type, which could be the direct cause of the dwarf and narrow-leaf phenotype. The phytohormone levels, especially auxin and gibberellin, were significantly decreased in dnl2 compared to the wild-type plants. Transcriptome profiling of the internodes of the dnl2 mutant and wild-type revealed a large number of differentially expressed genes enriched in the cell wall biosynthesis, remodeling, and hormone biosynthesis and signaling pathways. Therefore, we suggest that crosstalk between hormones (the altered vascular bundle and secondary cell wall structure) may contribute to the dwarf and narrow-leaf phenotype by influencing cell growth. These results provide a foundation for DNL2 gene cloning and further elucidation of the molecular mechanism of the regulation of plant height and leaf shape in maize.

1. Introduction

Maize (Zea mays L.) is one of the most important cereal crops in the world. Studies have demonstrated that increasing the planting density is an essential approach in order to increase per-hectare yield potential in maize [1]. However, a higher planting density can aggravate the lodging risk through increased plant height, leaf area, basal internode elongation, and center of gravity [2,3]. Plant height and leaf shape are important plant architecture traits that are closely associated with the lodging resistance, photosynthesis, and grain yield of maize [4]. The use of varieties with moderate plant height can enhance lodging resistance and improve the harvest index. With the popularization of short stature varieties during the green revolution, the yield of rice and wheat has increased sharply since the 1960s [5]. Leaf shape parameters, such as leaf length, leaf width, and leaf area, are important components of leaf morphology that affect canopy structure, photosynthetic efficiency, and wind circulation under high planting density [6]. Smaller and narrower leaves decrease shading effects on the lower leaves, enhance photosynthetically active radiation utilization, and increase maize yield potential [7]. Therefore, understanding the genetic mechanisms of maize plant height and leaf shape are important for the breeding of density-tolerant maize varieties with high grain yield.
Phytohormones, such as gibberellins (GAs), auxins (IAAs), ethylene (ETH), and brassinosteroids (BRs), play important roles in determining plant architecture traits, including plant height, leaf morphology, tiller number, and grain size [8]. For plant height, the previously characterized genes in maize are largely associated with the biosynthesis and the signal transduction of phytohormones. GAs represent a large group of cyclic diterpene compounds that are essential for stem elongation and plant height control [9]. GA synthesis, or signaling mutants, show dwarf phenotypes. The maize dwarf mutants, anther ear1 (an1), dwarf1 (d1), d3, and d5, have been shown to influence a different step in the biosynthesis of the GAs and are sensitive to exogenous GA application [10,11,12,13]. Two GA-insensitive dwarf mutants D8 and D9 were identified with altered DELLA domains, which are negative regulators of gibberellin signaling [14,15]. Auxin is an important signaling compound that is vital for plant development and growth [16]. VT2 encodes grass-specific tryptophan aminotransferase, the mutation of which affects IAA synthesis and causes dwarfing in maize [17]. Brachytic2 and ZmPIN1a regulate internode elongation by mediating the polar auxin transport in maize [18,19]. The overexpression of ZmPIN1a resulted in reduced plant height, ear height, and increased maize yield under high-density cultivation conditions [20]. In addition to the plant hormones GAs and IAAs, other phytohormones, such as BRs and ETH, also modulate plant height. Mutants that are deficient in BR biosynthesis or signal transduction, such as maize na1, na2, brd1, and the BRASSINOSTEROID INSENSITIVE1 knockdown line, exhibit the dwarfism phenotype [21,22,23,24]. The altered C-terminus of ZmACS7, encoding 1-aminocyclopropane-1-carboxylic acid (ACC) synthase in ETH biosynthesis, causes a shorter stature and larger leaf angle in maize [25].
Leaf width is an important index of leaf size and is a quantitative trait that is controlled by multiple genes, including miRNA, transcription factors, and hormones [26]. Genes that are related to response factors, polar transport, and the synthesis of phytohormones are believed to be particularly important in the regulation of leaf development in rice [27]. NAL7 (NARROW LEAF 7), TDD1 (TRYPTOPHAN DEFICIENT DWARF MUTANT 1), and FIB (FISH BONE) are involved in auxin biosynthesis, and the reduced expression of these genes results in a narrow-leaf phenotype [28,29,30]. The auxin-deficient mutants, defective in NAL1 (NARROW LEAF 1), NAL2/3, NAL21, OsARF11, and OsARF19, which participate in auxin polar transport, distribution, and signaling, also display narrow leaves [31,32,33,34,35]. Some genes that are involved in the regulation of the gibberellin pathway, such as PLA1, PLA2, SLR1, OsOFP2, D1, and GID2, have been shown to be important in the regulation of leaf width [11,36,37,38,39]. In addition to hormones, the cellulose synthase-like (CSL) genes, which participate in hemicellulose synthesis, are important in the regulation of leaf morphology [40]. DNL1, which encodes cellulose synthase-like D4, functions in the M-phase to regulate cell proliferation, and the dnl1 mutant showed a distinct narrow-leaf phenotype in rice [41]. ZmCSLD1 is essential for plant cell division, and the Zmcsld1 mutant exhibited narrow-organ and warty phenotypes with reduced cell sizes and cell numbers [42]. It is notable that narrow-leaf mutants commonly exhibit reduced plant height, such as nal1-2, nal1-3, nal21, dnl1, dnl2, and dnl3, implying the overlapping regulatory mechanisms of leaf size and plant height development.
In this study, we obtained the dwarf and narrow-leaf mutant dnl2 by EMS mutagenesis. The plant height and the width of the leaves of dnl2 differed significantly from those of the wild-type. The gene affecting the dnl2 phenotype was located on chromosome nine. Based on the tested physiological and morphological indices, the vascular bundle patterning, secondary cell wall structure, and cell growth were altered in the leaves and internodes of dnl2 compared to the wild-type. Moreover, some plant endogenous hormones also changed significantly. The content of GA and IAA in dnl2 was significantly lower than that in the wild-type, while the content of ABA in dnl2 was significantly higher than that in the wild-type. Combined with RNA-seq analysis, these results indicated that the modification of cell wall biosynthesis, phytohormone biosynthesis, and signal transduction contributes to the dwarfing and narrow-leaf phenotype of dnl2 by influencing cell growth.

2. Results

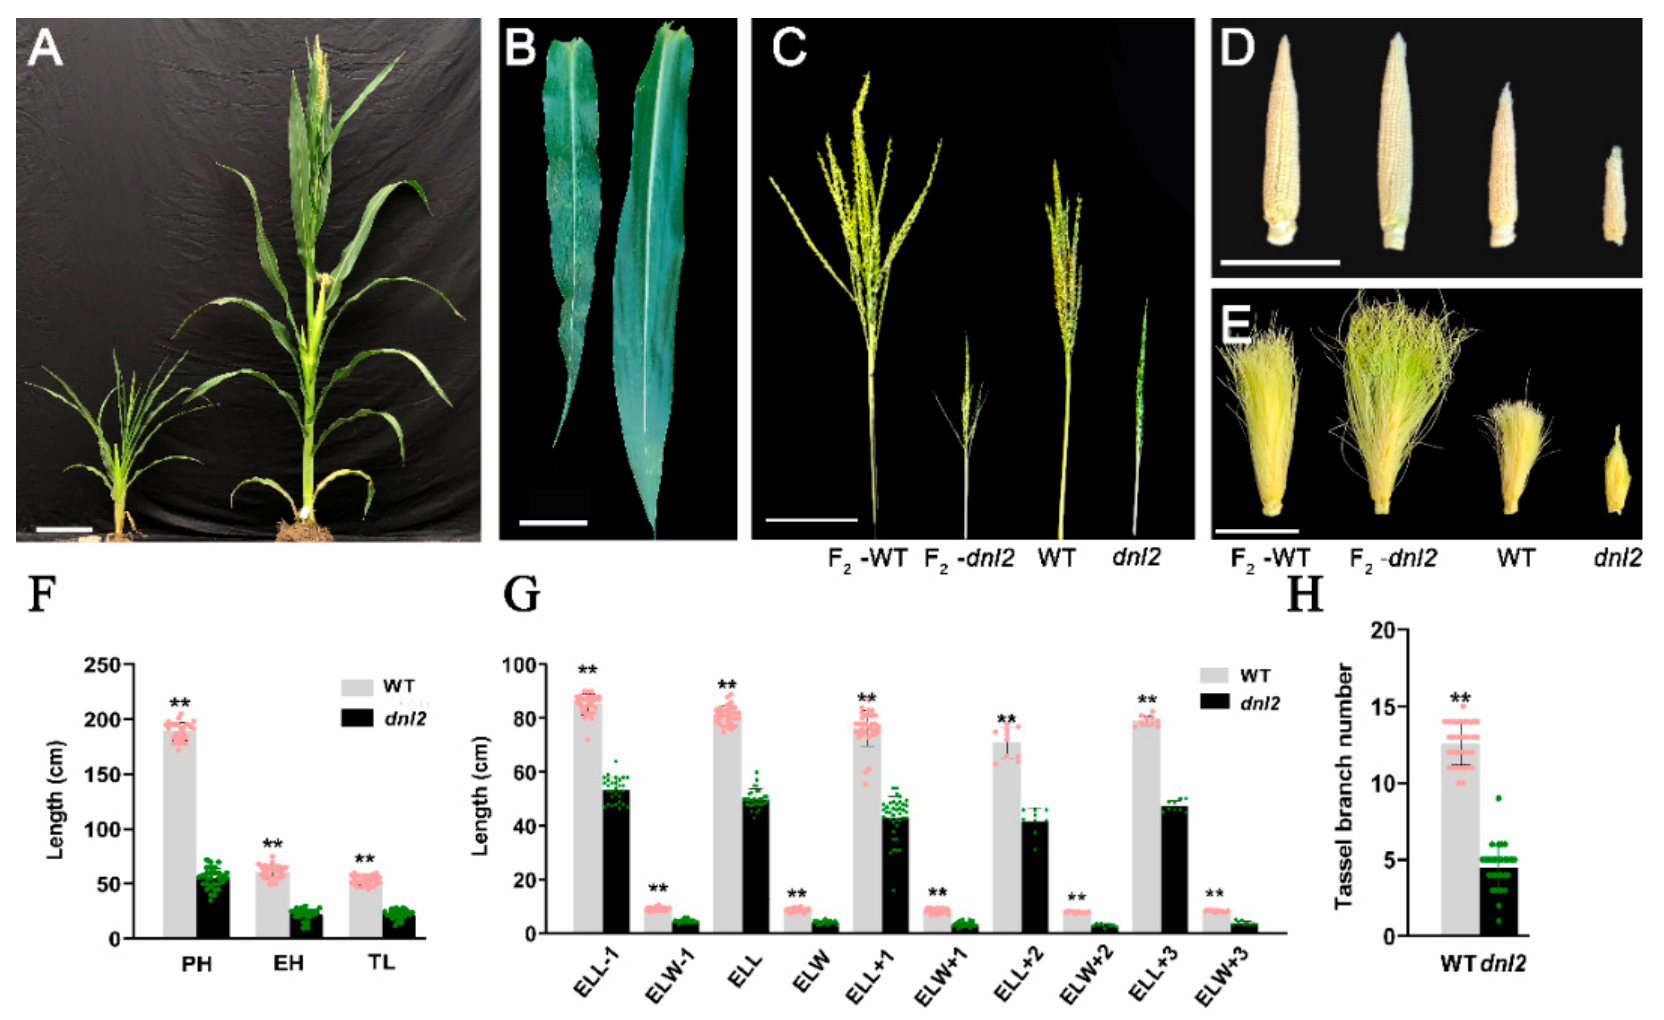
2.1. Pleiotropic Phenotype of the Maize dnl2 Mutant

The dnl2 mutant is a recessive dwarf and narrow-leaf mutant isolated from a maize EMS-mutagenized population. When compared with its wild-type plant ‘Zheng58’, the dnl2 mutant displayed pleiotropic developmental abnormalities, such as a short stature, narrowed and shortened leaves, and a degenerated tassel and ear (Figure 1A–E). Significant reductions in plant height and ear height were observed in the dnl2 mutant when compared to the wild-type, with 71% and 65% reductions observed at the mature stage, respectively (Figure 1A,F). We compared the internode number and length between the wild-type and the dnl2 mutant. Our results showed that the internode number of dnl2 was similar to that of the wild-type, while all of the internodes were significantly shortened (Figure 2). A gradual increase in the internode length difference from the bottom to the top of the plant was observed, and the internodes above the ear showed the most significant difference, with an 80.2–85.4% reduction between dnl2 and the wild-type. These results indicate that the dwarfing of dnl2 was attributed to inhibited internode elongation, but not to fewer internodes. The dnl2 mutant also had shorter and narrower leaves compared to the wild-type, and these leaf phenotypes were constantly observed in all of the leaves from the bottom to the top (Figure 1B). We measured the length and the width of the ear leaves, three leaves above the ear, and three leaves below the ear and observed a 37.3–41.6% reduction in leaf length and 49.5–62.7% reduction in leaf width in dnl2 (Figure 1G). Reproductive development was also impacted in the mutant. The tassel, which is the terminal inflorescence, had fewer branches, and the ears, which are inflorescence branches from the main shoot, frequently failed to form (Figure 1C–E,H).

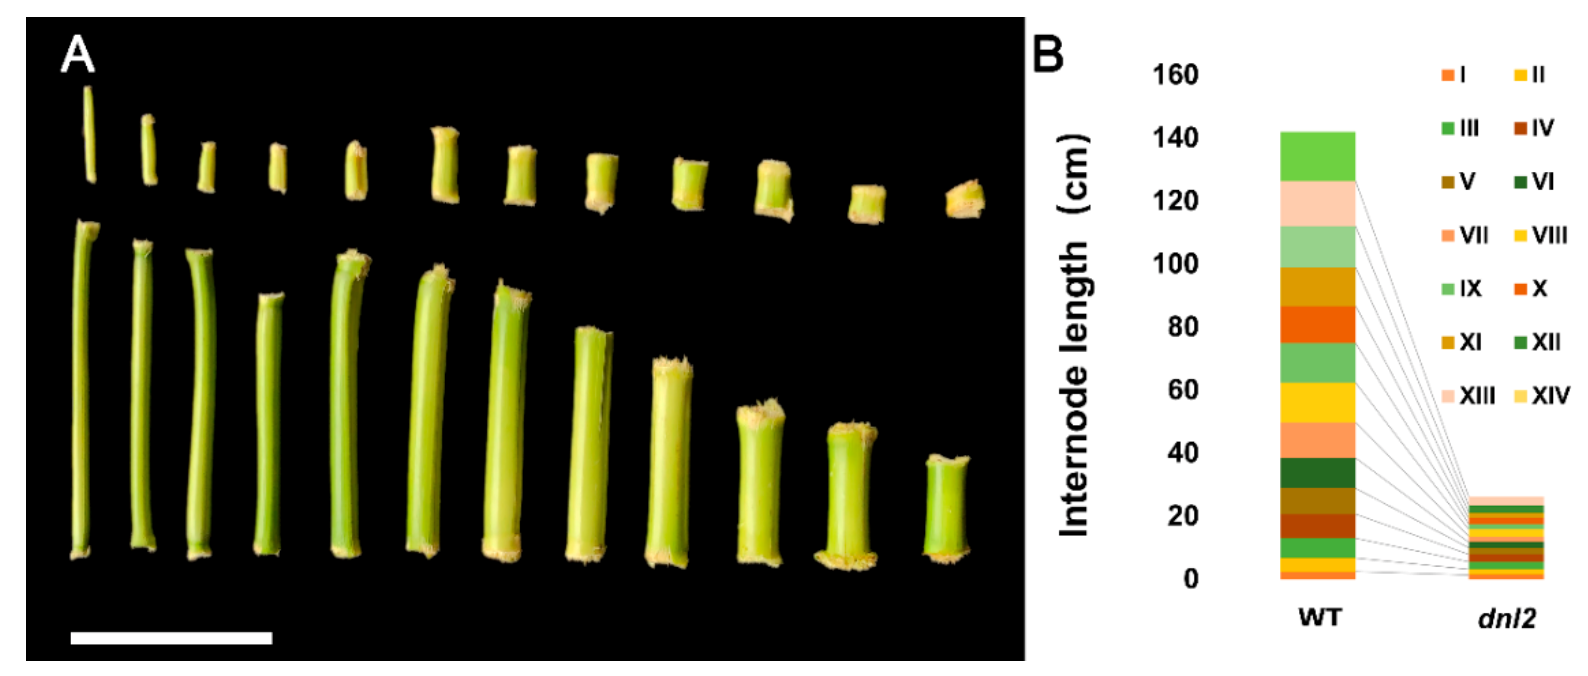
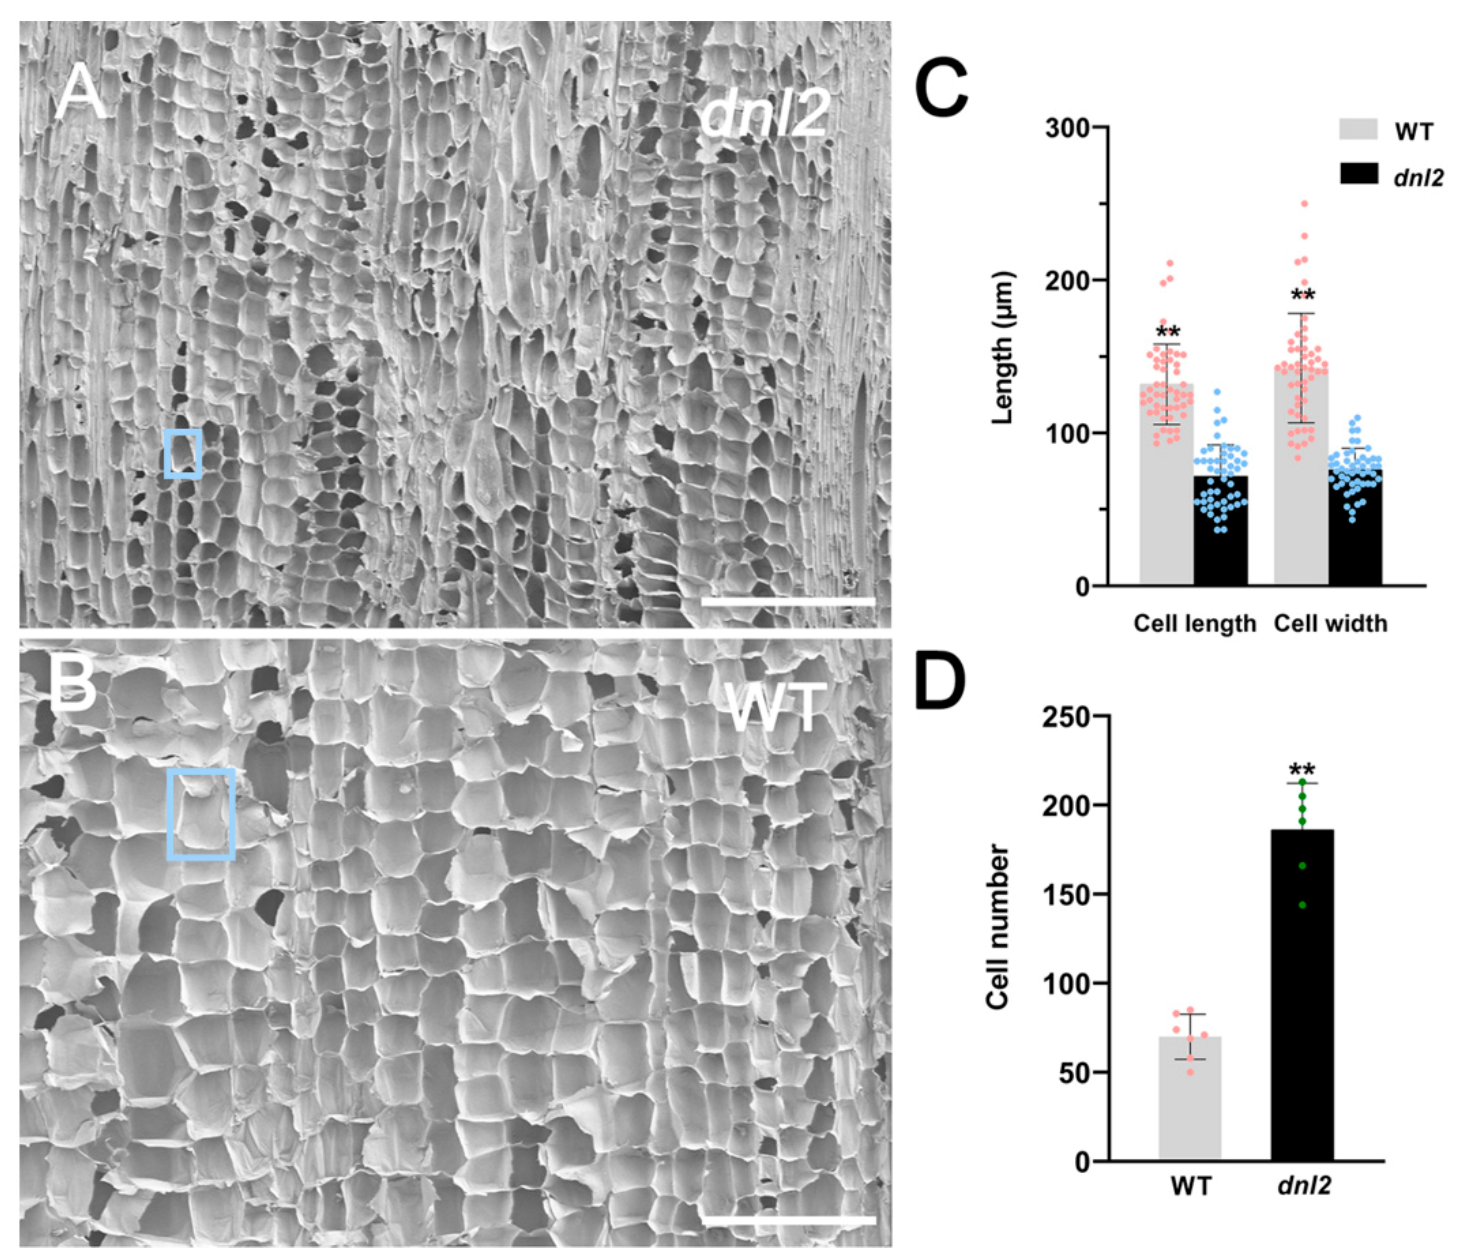
2.2. Inhibited Cell Growth and Altered Cell Wall Structure in dnl2 Internodes

In order to determine the reason for the dwarf phenotype, we examined the anatomical features of the seventh internodes of the wild-type and the dnl2 mutants at the 15-leaf stage through SEM. The transverse sections showed that the area of the vascular bundles near the cortex of the internode was significantly smaller in dnl2, reaching approximately 44.33%, compared to the wild-type (Figure 3A–C). The number of sclerenchyma cell layers around the vascular bundles were also found to be decreased in dnl2. The thickness of the cell walls of the sclerenchyma cells under the epidermis and surrounding xylem became thinner in dnl2, by 39.2% and 29.9%, respectively, compared to the wild-type, suggesting that the cell wall structure of dnl2 was altered (Figures S1 and S2). In addition, the diameter of the parenchymal cells in dnl2 were also significantly smaller than in the wild-type (Figure 3D). Further examination of the longitudinal sections of the internodes revealed that the parenchymal cells were irregularly arranged in dnl2, and the size of the cells was significantly reduced compared with the wild-type (Figure 4). The cell length and cell width of the parenchyma cells were significantly decreased by 45.5% and 46.7%, respectively, in the dnl2 mutant (Figure 4C), while the cell number per unit area was significantly increased by 166% (Figure 4D). Taken together, these results indicate that the reduced vascular bundles size, inhibited cell growth, and decreased thickness of the sclerenchyma cell walls may be the causes of the dwarf stature of the dnl2 mutant.

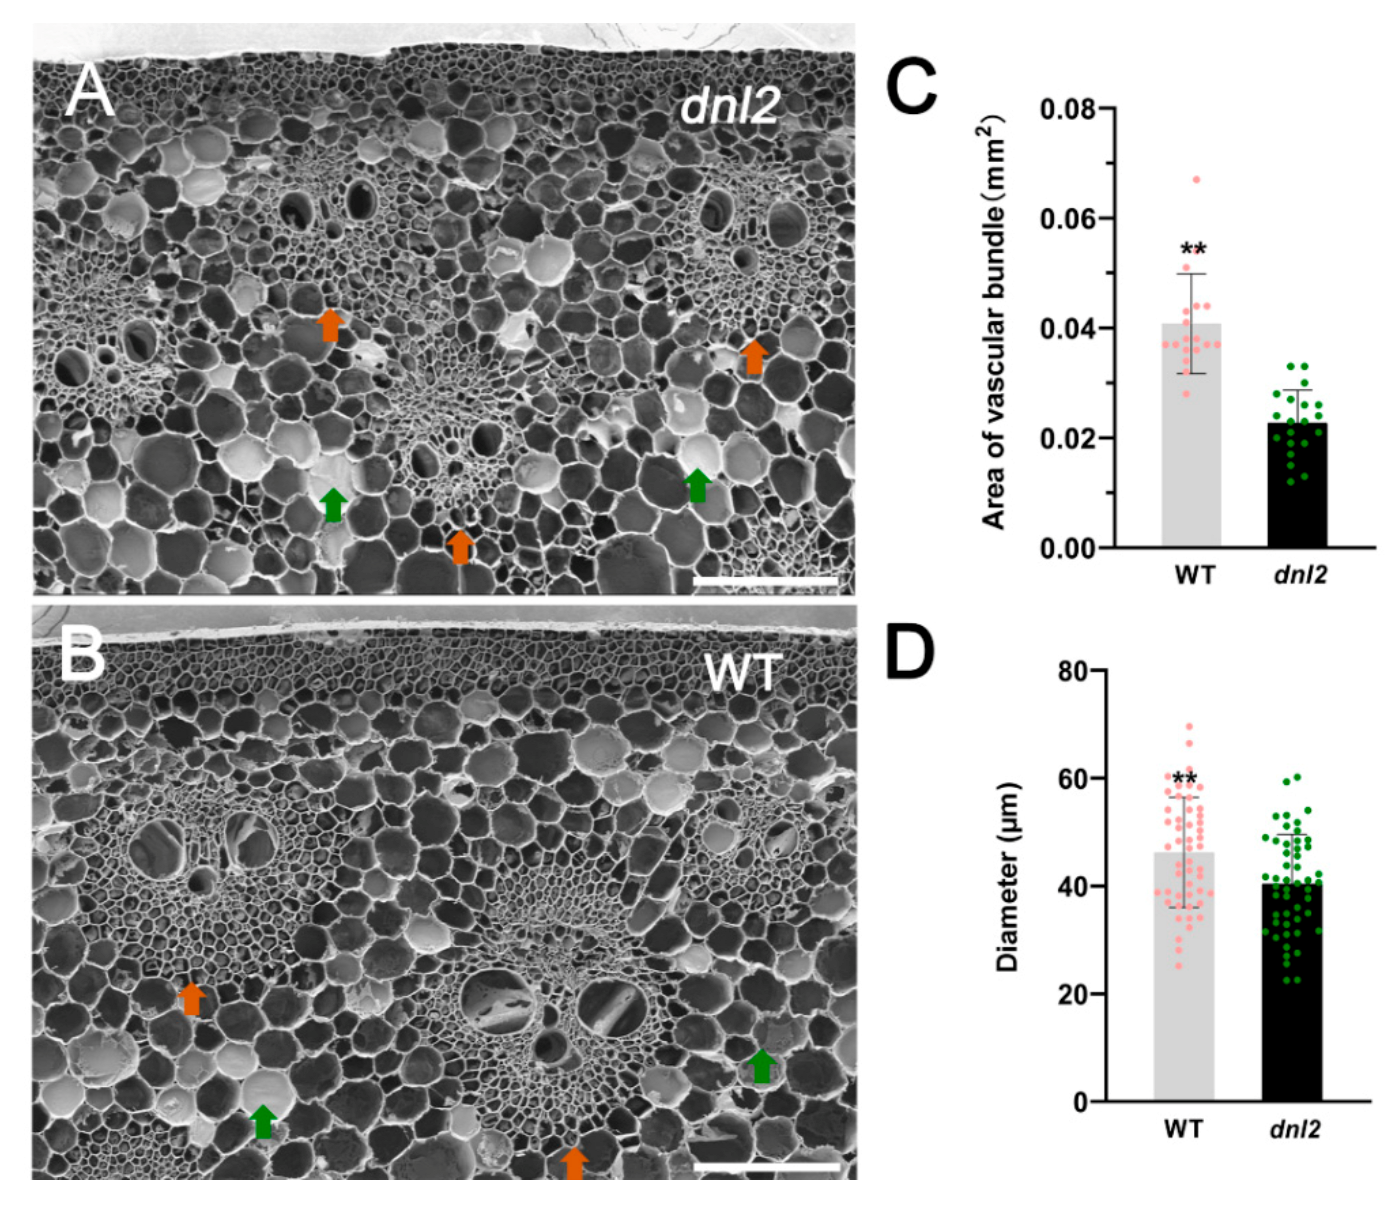
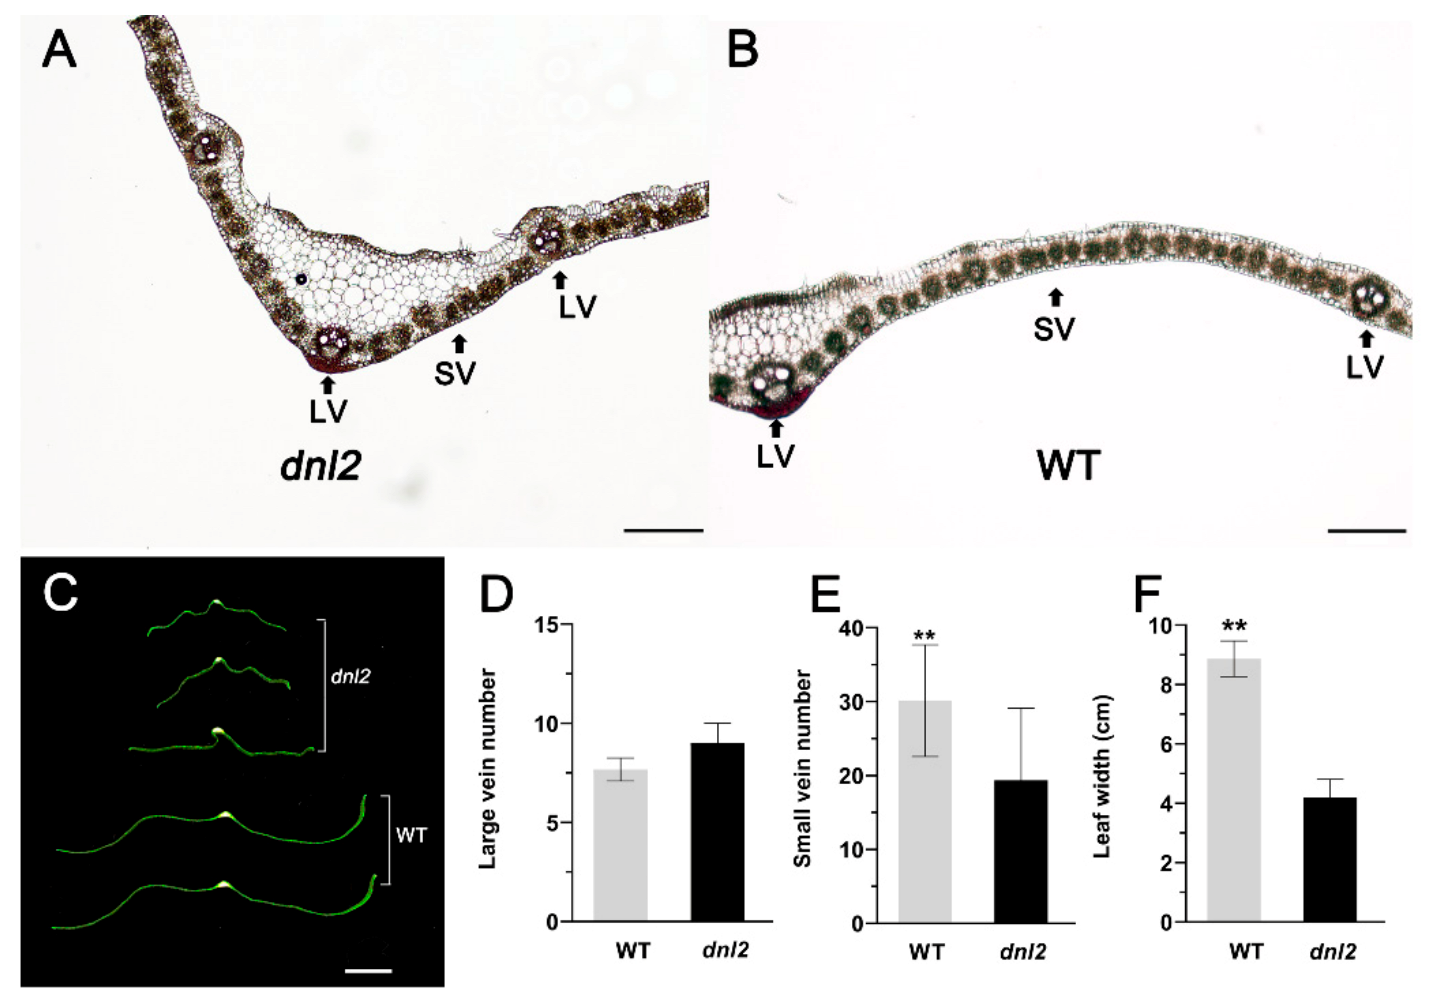
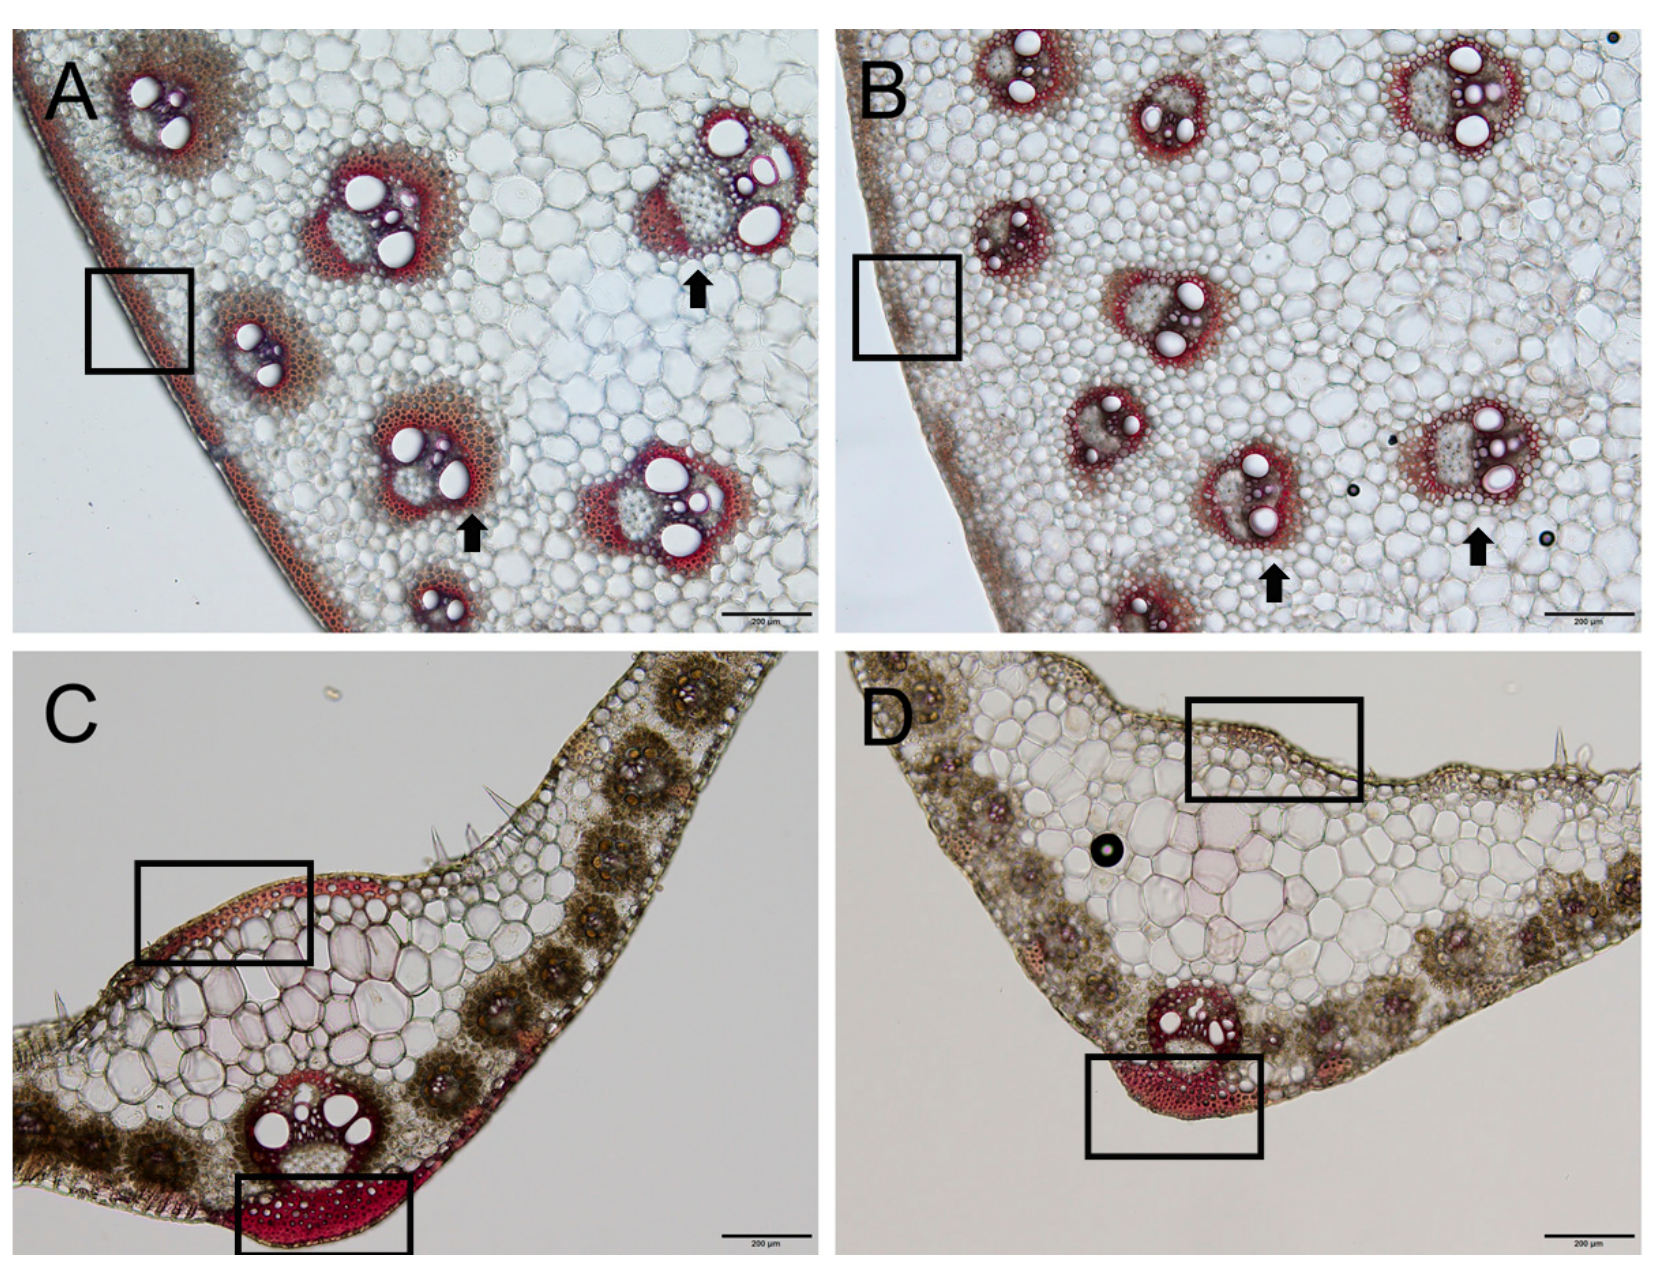
2.3. Narrowed Leaves and Altered Vascular Bundles Structure in dnl2

The structure of the vascular bundles and the number and size of the cells are the main cytological factors affecting the morphology of leaves [31,43]. In order to assess the cause of the reduction in leaf width, we observed the fourth matured leaves from the top of dnl2 and the wild-type plants under a microscope. The transverse sections of the leaves showed that the number of small veins between two adjacent large veins was significantly decreased by 35.7% in dnl2 compared to the wild-type, while the number of large veins in dnl2 was comparable to the wild-type (Figure 5). The relationship between leaf narrowing and the number and size of the epidermal cells was further studied by SEM. In dnl2, both the number and the width of the cells along the leaf-width direction were decreased by 15.13% and 17.6%, respectively, indicating that cell division and expansion in the mutant were affected (Figure S3). Therefore, the phenotype of dnl2 leaf narrowing was mainly affected by the decrease in the number of small vascular bundles and inhibited cell division and expansion.

2.4. The Cell Wall of the dnl2 Mutant Has Reduced Lignin Deposition

Thinner secondary cell walls can be caused by insufficient cellulose, xylan, and lignin deposition. Considering that the sclerenchyma cell walls were thinner in dnl2 than in the wild-type, we hypothesized that lignin accumulation in the sclerenchyma tissue would be greater in the wild-type than in dnl2. In order to test the hypothesis, we compared the deposition of lignin in the sclerenchyma tissues. The transections of dnl2 and wild-type internodes and leaves were treated with phloroglucinol–HCl, which is a lignin-specific indicator of secondary wall thickening and observed by microscopy. The staining of the cortex, the vascular tissue near the cortex of the internodes, and the leaves showed that the layer of sclerenchyma cells of dnl2 was significantly less than that of the wild-type (Figure 6A,B). Additionally, reduced lignification was observed in the sclerenchyma cells near the epidermis of the internodes and under the adaxial and the abaxial epidermis of the leaves (Figure 6C,D).

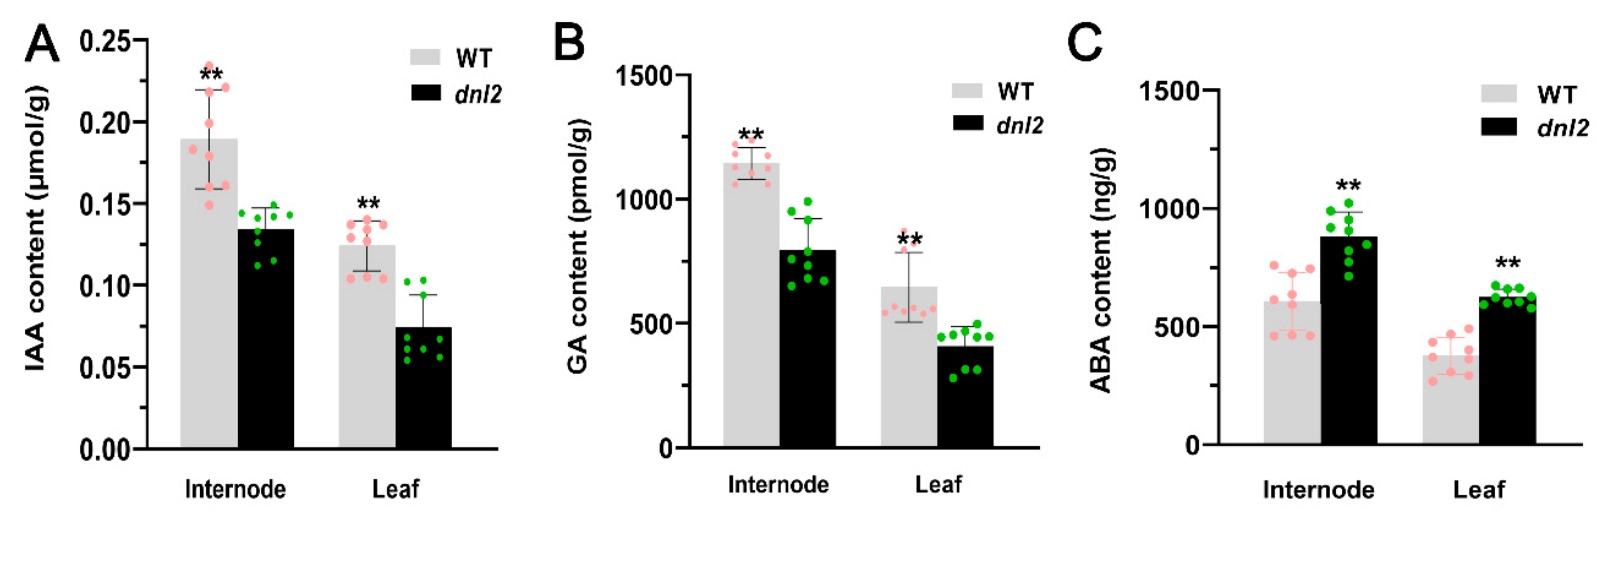
2.5. The Phytohormone Balance Was Altered in the dnl2 Mutant

Phytohormones are essential for controlling plant growth and development by regulating cell proliferation and expansion. Therefore, we measured the contents of endogenous phytohormones, including GA, IAA, and ABA, of the 11th internodes and the 15th expanded leaves from the wild-type and the dnl2 mutants at the V15 stage. The results showed that the contents of endogenous GA and IAA were significantly decreased in both the internodes and leaves of the dnl2 mutant relative to those of the wild-type, with GA reduced by 30.62–40.03%, and IAA reduced by 29.1–40.32%, respectively (Figure 7A,B). However, the level of endogenous ABA was significantly increased by 45.56–65.57% in dnl2 relative to the wild-type (Figure 7C). These results revealed that the phytohormone contents were disturbed in the dnl2 mutant.

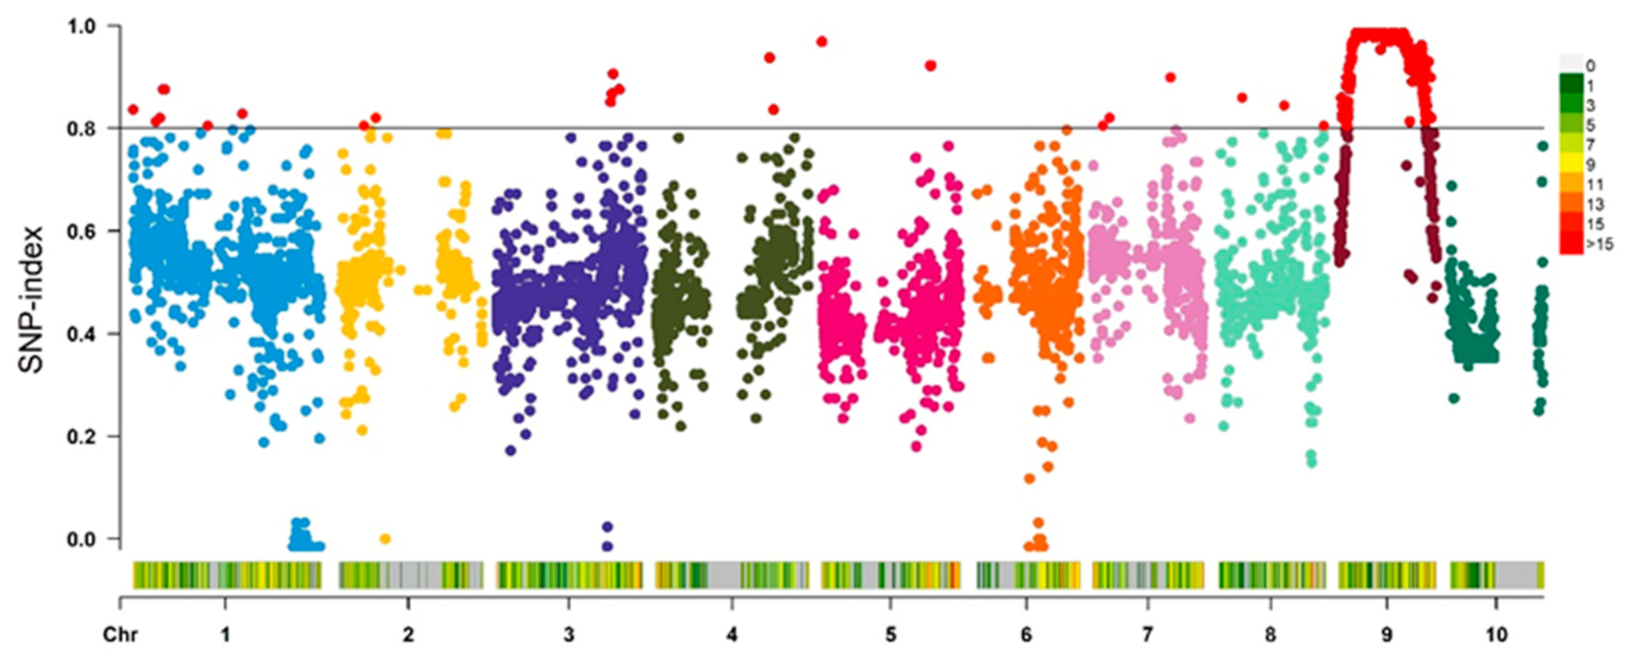
2.6. Genetic Analysis and Mapping of the dnl2 Mutant

In order to isolate dnl2, the heterozygous plant (+/dnl2) was crossed with the ‘Mo17’ inbred line to construct an F2 segregation population. A total of 64 dwarf plants were sampled for preliminary mapping, and the genotypes of the samples were analyzed by genotyping by target sequencing (GBTS) technology with a 20 K marker panel. After filtering, 7357 SNP markers were identified as polymorphic between the two parents, accounting for 36.3% of the total markers. The average number of SNP markers on each chromosome was 736, and the maximum number of SNP markers on chromosome one was 1298 (Figure S4). By analyzing the variation in the SNP-index corresponding to all polymorphic SNPs at the whole-genome level, it was found that the 26.9 M–76.1 M interval on chromosome nine may be linked to the target trait (Figure 8). In order to confirm the mapping region, four new insertion/deletion (INDEL) markers were further developed to genotype another F2 population (dwarf plants = 400), however, no new recombination was detected at this interval. Since the region is located near the centromere and the exchange frequency is low, a larger mapping population is needed to complete the fine-mapping of the DNL2 gene.

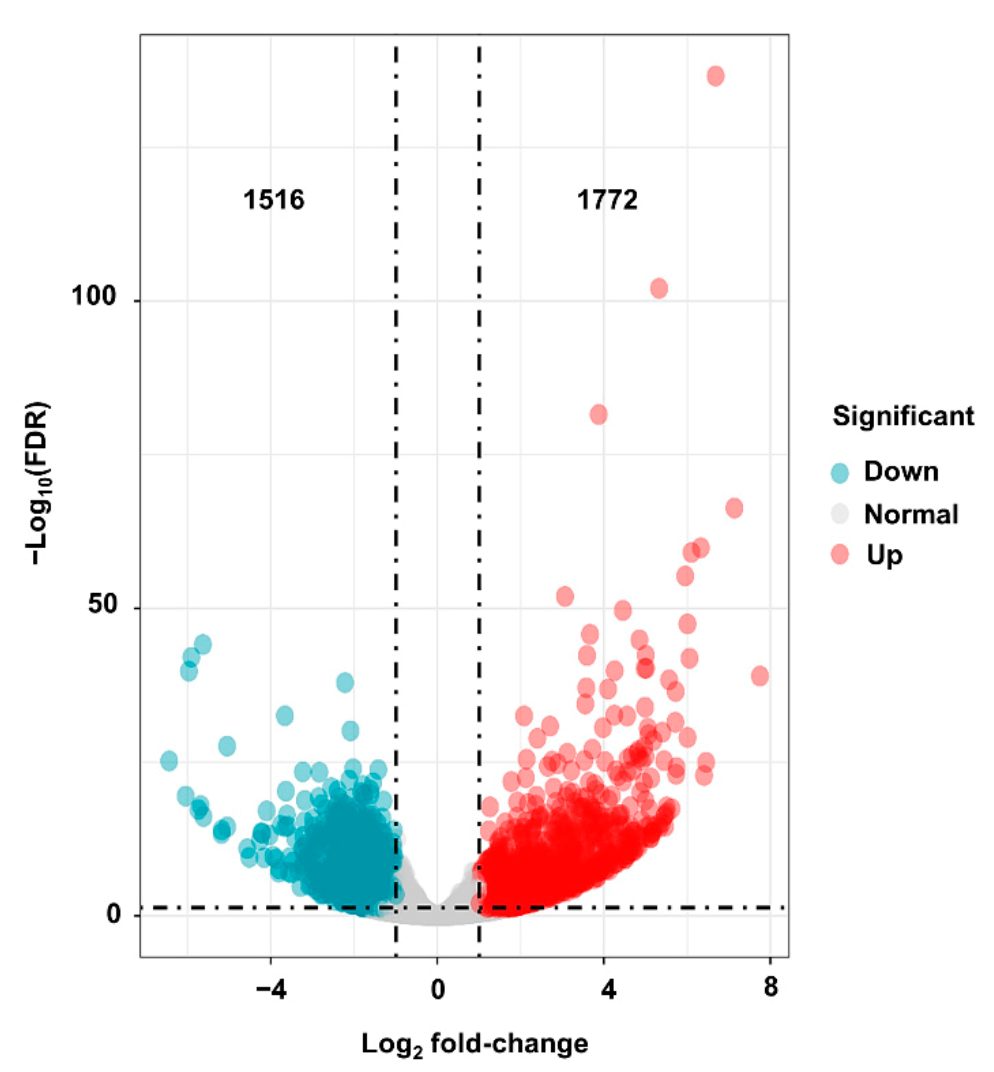
2.7. Genome-Wide Transcriptomic Analyses of dnl2 and Wild-Type Plants

In order to understand the transcriptome network underlying the phenotypic variations, high-throughput RNA-seq was performed for dnl2 and wild-type plants. After quality control and filtering from raw reads, more than 21 million clean reads were generated for each sample. Approximately 78.58–86.90% of the clean reads were uniquely mapped to the maize B73 reference genome (RefGen_v4) (Table S1). A total of 27,746 and 28,652 genes with an FPKM higher than 0.1 were expressed in the wild-type and dnl2, respectively. A total of 3288 DEGs were identified between dnl2 and the wild-type using the threshold FDR < 0.01 and at least a 2.0-fold expression change. Among them, 1772 genes were significantly up-regulated, and 1516 genes were significantly down-regulated, accounting for 53.89% and 46.11%, respectively, of all of the DEGs (Figure 9). The expression levels of some DEGs were evaluated by quantitative RT-PCR (qRT-PCR) in order to validate the RNA-seq data (Figure 10). Further observation of the top 10 significantly up- and down-regulated DEGs revealed that seven DEGs were annotated as cell wall-related proteins, including endo-13-beta-glucosidase, beta-galactosidase precursor, beta-D-xylosidase, polygalacturonase, and three glycosyl hydrolase family proteins, suggesting the important roles of cell wall regulation in dnl2 development (Table S2).
The GO terms and KEGG pathways were used to elucidate the functional annotations of the DEGs. The DEGs could be categorized into three main GO categories, as follows: biological process (BP), molecular function (MF), and cellular component (CC). The up-regulated DEGs were significantly overrepresented in 78 BP terms, 61 MF terms, and 19 CC terms (Figure 11A). The most significantly enriched GO terms mainly included the BP terms “protein metabolic process”, “defense response”, “hydrogen peroxide catabolic process”, and “response to wounding”; the MF terms “nucleic acid binding”, “transition metal ion binding”, and “tetrapyrrole binding”; and the CC terms “plasmodesma”, “membrane”, and “nucleolus”. For the down-regulated DEGs, 95 BP terms, 57 MF terms, and 30 CC terms were significantly enriched (Figure 11B). The “photosynthesis”, “protein-chromophore linkage”, “chlorophyll biosynthetic process”, “lignin biosynthetic process”, “xylan biosynthetic process”, and “reductive pentose-phosphate cycle” terms were the most enriched BP terms; “chlorophyll binding”, “iron-sulfur cluster binding”, and “serine-type peptidase activity” were the most enriched MF terms; and “chloroplast”, “thylakoid”, and “plastid” were the most enriched CC terms. Further KEGG enrichment analysis revealed that “ribosome biogenesis in eukaryotes”, “plant hormone signal transduction”, “benzoxazinoid biosynthesis”, “alanine, aspartate and glutamate metabolism”, and “limonene and pinene degradation” were the most overrepresented pathways in the up-regulated DEGs (Figure 12A), and “photosynthesis”, “photosynthesis-antenna proteins”, “carbon fixation in photosynthetic organisms”, “phenylalanine metabolism”, “flavonoid biosynthesis”, “porphyrin and chlorophyll metabolism”, “ubiquinone and other terpenoid-quinone biosynthesis”, “starch and sucrose metabolism”, and “carbon metabolism” were the most overrepresented pathways in the down-regulated DEGs (Figure 12B). These results indicated that the expression level of genes related to protein metabolic and hormone signaling, which were increased in the dnl2 mutant, and the expression level of genes related to photosynthesis and cell wall biosynthesis were suppressed.

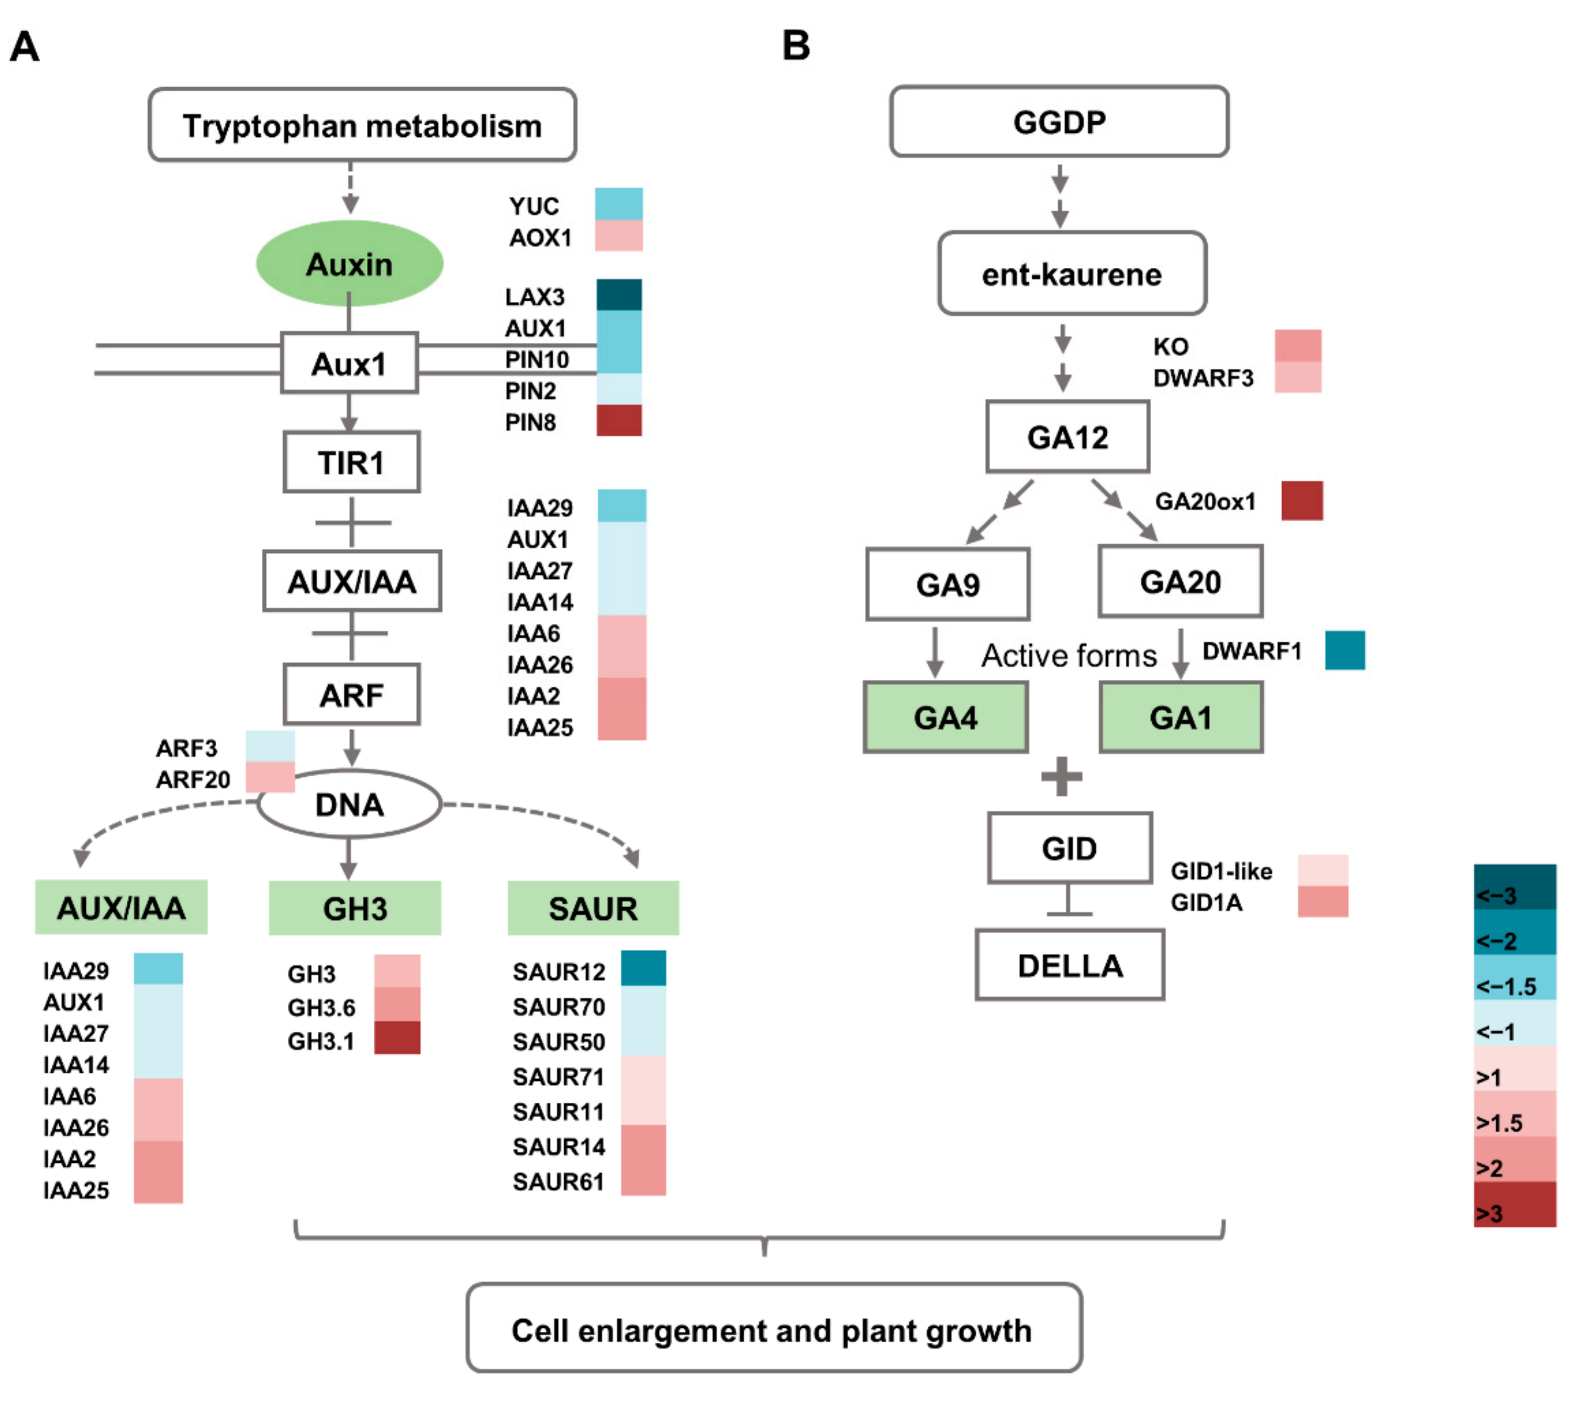
2.8. Altered Expression of Hormone Pathway-Related Genes in the dnl2 Mutant

Phytohormones play an important role in cell elongation and plant growth. In our RNA-seq results, more than 100 DEGs related to IAA, GA, ABA, ETH, BR, and jasmonic acid (JA) synthesis and signal transduction were identified. Notably, 35 genes involved in auxin biosynthesis and signaling were differentially expressed between dnl2 and the wild-type plants (Figure 13A and Table S3). For IAA biosynthesis, a flavin monooxygenase-like protein (Zm00001d018652, YUC), which catalyzes the last step of conversion from indole-3-pyruvate (IPyA) to IAA [44], was down-regulated by 2.75-fold in dnl2, while indole-3-acetaldehyde oxidase (Zm00001d013098, AOX2), which converts indole-3-acetaldehyde (IAD) into IAA [45], was up-regulated by 2.35-fold in dnl2. Auxin response gene families, mainly including seven Aux/IAA (auxin/indole acetic acid), three GH3 (Gretchen Hagen 3), seven SAUR (small auxin up RNA), three ARF (auxin response factor), and three PIN (polar auxin transport), exhibited altered expression levels in dnl2 [46,47]. Zm00001d010697 (GH3.6), Zm00001d039345 (GH3), and Zm00001d043244 (GH3.1) belong to the GH3 gene family, which participates in auxin homeostasis by catalyzing auxin conjugation and binding free IAA to amino acids [48], and their expression levels were increased by 2.8- to 28.6-fold in dnl2. Zm00001d053004 (AIC2) is an auxin transporter-like protein, and its expression level in dnl2 was decreased by 9.3-fold compared to the wild-type. The altered expression level of these genes may disturb IAA homeostasis in the dnl2 mutant.
Gibberellins are essential regulators of internode elongation and plant height. The DWARF1 (Zm00001d039634) encodes a gibberellin 3-oxidase, catalyzing the final step of bioactive GA synthesis [11]. In our RNA-seq analysis, DWARF1 was down-regulated by 6.43-fold in dnl2. The ent-kaurene oxidase (Zm00001d046342, KO), GA 20-oxidase (Zm00001d034898, GA20ox), and DWARF3 (Zm00001d045563) genes, which participate in the early steps of GA synthesis [12,13], were up-regulated by 2.8–to 10.5-fold in the dnl2 mutant. GA2-oxidase (Zm00001d017294, GA20ox1), catalyzing the deactivation of bioactive GA or its precursors [49], was up-regulated in the dnl2 mutant, which may have contributed to the decrease in endogenous GA content. As for the GA signal transduction, two GIBBERELLIN INSENSITIVE DWARF genes (Zm00001d010308, Zm00001d038165) encoding GA receptors were up-regulated in dnl2 (Figure 13B and Table S4).
Furthermore, genes related to ETH, ABA, CK, BR, and JA were also found to be differentially expressed between the dnl2 mutant and the wild-type plants (Table S5). Ethylene has been recognized as a growth inhibitor. We identified 25 ethylene-responsive transcription factors (AP2-EREBP), two reversion-to-ethylene sensitivity (RTE), and one ethylene insensitive three (EIN3) proteins exhibited increased expression levels in dnl2. Almost all of the genes related to ABA, CK, JA, and BR were up-regulated in dnl2 compared to the wild-type. The altered expression level of these genes may disturb hormone synthesis and signaling homeostasis in the dnl2 mutant, resulting in growth inhibition.

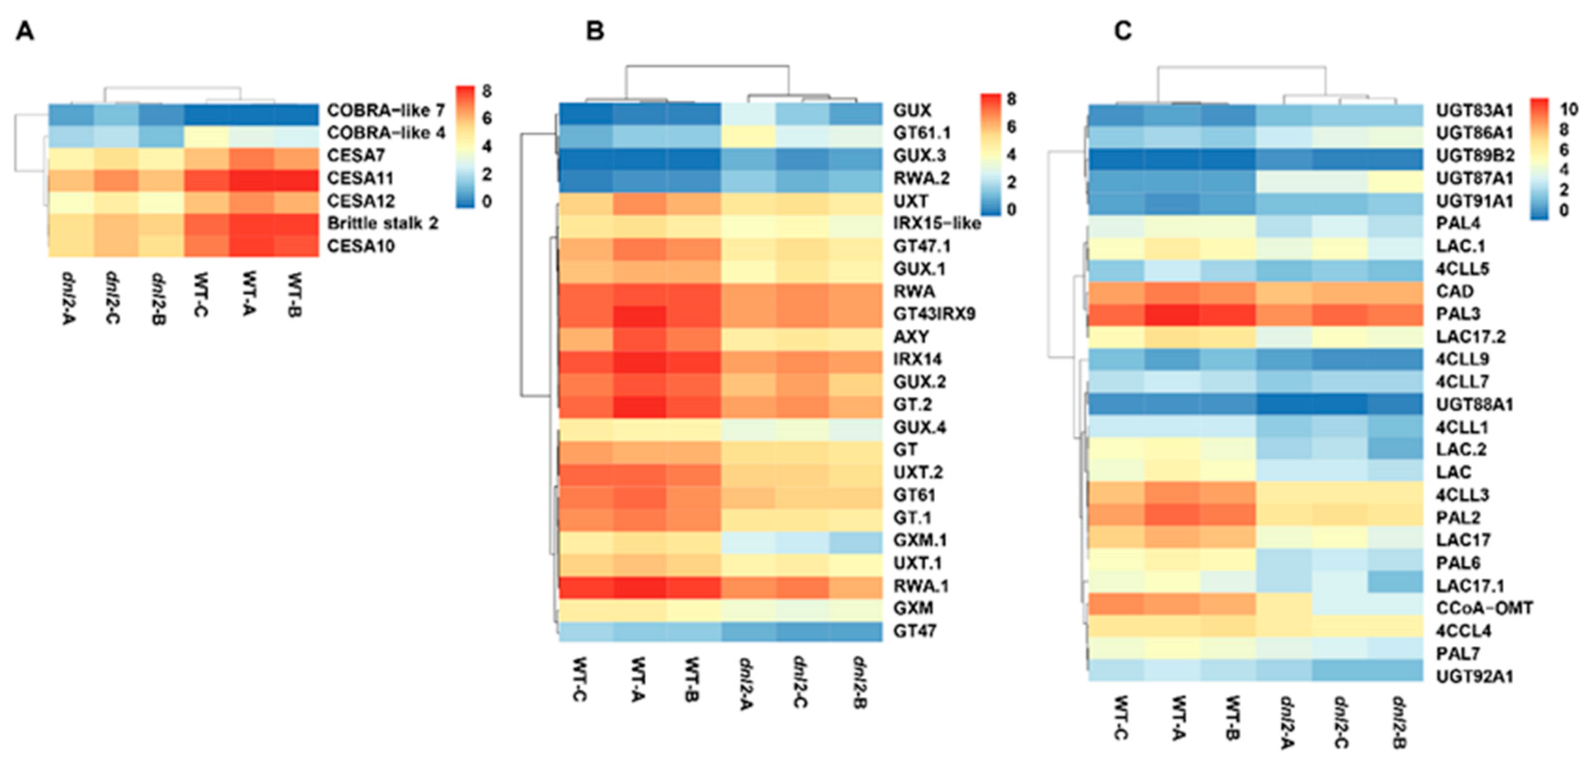
2.9. Altered Expression of Genes Associated with Cell Wall Development in the dnl2 Mutant

The plant cell wall not only provides mechanical strength and support, but also controls cell growth and differentiation. Since the secondary cell wall structure is altered in the dnl2 mutant, we evaluated the expression levels of DEGs related to cell wall deposition and remodeling. Our transcriptome analysis identified more than 130 DEGs related to cell wall synthesis, remolding, and signaling, and 66.7% of the DEGs were down-regulated in the dnl2 mutant compared to the wild-type plants. These DEGs were further divided into several classes according to the functional annotation, and most of them were classified as secondary cell wall-related.
Cellulose synthase (CesA) participates in cellulose synthesis during primary and secondary cell wall deposition. The maize genome contains at least 12 CesA genes, and CesA19 are believed to be involved in primary cell wall formation, while CesA1012 are involved in secondary wall deposition [50]. Our RNA-seq results revealed that four CesA genes, including CesA7 (Zm00001d005775), CesA10 (Zm00001d032776), CesA11 (Zm00001d043477), and CesA12 (Zm00001d020531), were all down-regulated in the dnl2 mutant. The Brittle stalk 2 (Zm00001d047276), and another COBRA-like protein (Zm00001d022082), which participate in the cellulose synthesis of the secondary cell wall [51], also exhibited decreased expression levels in dnl2 (Figure 14A and Table S6). Xylan is the second-most abundant polysaccharide in plant secondary walls [52]. Several enzymes have been implicated in xylan synthesis and substitution, such as glycosyl transferase (GTs) gene families, glucuronosyltransferase (GUXs), glucuronoxylan 4-O-methyltransferase (GXMs), and reduced wall acetylation (RWAS) [53]. Ten GTs, five GUXs, two GXMs, three UDP-xylose transporters (UXT), and three RWAs were identified to have altered expression levels in dnl2, and 80% of them were down-regulated, suggesting that xylan synthesis may be affected in the mutant. Zm00001d011959 and Zm00001d028980 are GT47 family genes, which are required for synthesizing the xylan backbone, and their expression level in dnl2 decreased by 2.5–3.7-fold compared to the wild-type. Zm00001d010976 and Zm00001d036543, which belong to the GT43 family and encode IRX9 and IRX14 respectively, were also down-regulated in dnl2 (Figure 14B and Table S7). Lignin is an abundant biopolymer of phenylpropanoid monomers and is critical for plant structure and strength [53]. In our study, the expression of five phenylalanine ammonia-lyase (PAL), six 4-coumarate-CoA ligase (4CL), six laccase (LAC), and one caffeoyl-CoA 3-O-methyltransferase (CCoA-OMT) genes involved in lignin biosynthesis were all decreased in dnl2 (Figure 14C and Table S8). In addition, the genes involved in pectin, hydroxyproline-rich glycoproteins (HRGPs), and APG protein synthesis, such as β-1, 4-galactosyltransferases, extensions (EXTs), and fasciclin-like arabinogalactan, were all down-regulated (Table S9). The decreased expression of these cell wall synthesis-related genes may greatly affect the cell wall structure in the dnl2 mutant, leading to stunted growth.
Growth begins with cell wall loosening [54]. During the elongation phase of cell growth, a number of enzymes and proteins, such as expansins (EXP), beta-glucosidase (BGL), xyloglucan endotransglycosylases/hydrolase (XETs/XTHs), and endo-(1,4)-β-d-glucanase (EG), are believed to mediate the wall loosening process [54], and 48 DEGs involved in this process were identified in our study (Table S10). Eight EXPANSIONS, which are primary agents in regulating cell wall enlargement, had changed expression levels in dnl2, five of which were down-regulated and three of which were up-regulated. Beta-glucosidase is a component of cellulose enzymes that is essential for the complete hydrolysis of cellulose into glucose [55]. Seventeen DEGs encoding beta-glucosidase were discovered in dnl2, and two of them were up-regulated by more than 128-fold compared to the wild-type. Furthermore, genes encoding endoglucanase, xyloglucan endotransglycosylases/hydrolase, β-xylanase, β-galactosidase, and β-D-xylosidase were also identified with altered expression levels in the mutant.

3. Discussion

The dnl2 mutant is a recessive mutant caused by EMS mutagenesis that displays various developmental defects, with a short stature and narrowed leaves being the two most obvious features. In this study, we combined phenotypic and cytological observations, physiological and biochemical analyses, and transcriptome sequencing in order to explore the possible regulation mechanism underlying the mutant phenotype of dnl2. Our results demonstrated that the vascular bundle patterning, cell wall structure, and cell growth were altered in dnl2 internodes and leaves compared with the wild-type plants, which could be the direct cause of the dwarf and narrow-leaf phenotype (Figure 3, Figure 4 and Figure 5). The phytohormone levels were also altered in dnl2, and the IAA and GA contents were particularly significantly decreased compared to the wild-type plants (Figure 7). Defects in phytohormone synthesis and response can significantly disturb cell division, cell expansion, and vascular development in dnl2. Genome-wide transcriptome profiling of the internodes of the dnl2 mutant and wild-type revealed a large number of DEGs enriched in the cell wall biosynthesis, remodeling, and hormone biosynthesis and signaling pathways. These results further elucidated the transcriptional regulation underling the mutant phenotype of dnl2.

3.1. Inhibited Cell Division and Expansion Result in the Dwarf and Narrow-Leaf Phenotypic of dnl2

Plant organ shape and size are precisely controlled by localized cell division and subsequent cell expansion during plant growth [56]. Extensive studies indicate that impaired mitosis, cell elongation, and expansion could result in a reduction in plant height, leaf area, and grain yield [57,58,59]. In rice, Dwarf1 (D1) encodes the α-subunit of the GTP-binding protein, which regulates cell division, promotes internode elongation, and influences plant height development [11]. The stemless dwarf 1 (STD1) encodes a phragmoplast-associated kinesin-related protein and has a fundamental role in cell division. The std1 mutant exhibited no differentiation of the node and internode organs, abnormal cell shapes, and a reduced cell division rate [60]. The Narrow leaf1 (NAL1) gene functions in cell division rather than cell elongation, and the nal1 mutant exhibited a dwarf and narrow-leaf phenotype with defective cell division [31]. In maize, Narrow Odd Dwarf (NOD) plays a cell-autonomous function. The nod mutants have smaller organs due to fewer and smaller cells [61]. In our study, the maize dnl2 mutant exhibited inhibited internode elongation and reduced leaf size. Internode elongation is driven by cell division in the intercalary meristem, followed by cell expansion in the elongation zone. A comparison of longitudinal sections taken from the dnl2 and wild-type internodes revealed that the parenchymal cells were irregularly shaped in dnl2, and both the cell length and width were significantly reduced compared to the wild-type (Figure 4), which suggested that cell elongation growth in the dnl2 internodes was suppressed. However, the cell number per unit was found to be significantly increased in dnl2, which could be an induced compensation phenomenon for the reduction in cell size. In the leaves, both the cell number and the cell width along the width direction of the leaf blade were decreased in dnl2 compared to the wild-type, while no significant change was observed in cell length (Figure 5). These results implied that the DNL2 gene has essential roles in cell proliferation and expansion. The reduced cell size and cell number are the major causes of the dwarf and narrow-leaf phenotype of dnl2.
Vascular bundle development is also an important determinant of plant height and leaf morphology. In rice, several mutants with reduced plant height and leaf width similar to that of dnl2 have been reported. Cross-section examination of the leaf blades of these mutants, such as nal1, nal7, nrl1, and tdd1, have demonstrated that narrow leaves mainly resulted from a defect in cell proliferation and a reduced number of vascular bundles [28,29,31,62]. In dnl2, altered vascular bundle patterning in the internodes and leaves was also observed. Compared with wild-type plants, the area of the vascular bundles was much smaller in the shortened internodes of dnl2 (Figure 3), and the number of small veins was significantly reduced in the leaves of dnl2 (Figure 5). The changed vascular bundle patterning in the internodes and leaves of dnl2 may be caused by either earlier defects in the recruitment of founder cells, or later defects in the differentiation of cells into vascular tissues, which suggested that the DNL2 gene was also crucial for determining vascular cell identity.

3.2. Altered Cell Wall Structure and Transcriptional Regulation Result in Defective Cell Growth in dnl2

Cell wall biosynthesis is important for regulating cell shape and size in the process of plant cell growth [63]. The change of vacuole turgor pressure is the main driving force in plant cell growth, and cell growth also depends on the synthesis and remodeling of cell wall polysaccharides [64]. In rice, the narrow leaf and dwarf1 (nd1) mutant exhibits significant growth inhibition due to suppressed cell division. Map-based cloning has revealed that the ND1 gene encodes OsCSLD4, which plays an important role in modifying the cell wall structure. The expression analysis revealed that OsCSLD4 is specifically expressed in M-phase cells in order to regulate cell proliferation [65]. ZmCSLD1 encodes an enzyme in cell wall biosynthesis and controls organ size by altering cell division. The inactivation of ZmCSLD1 also results in the narrow leaf and stunted phenotype mainly due to the decrease in cell number [42]. In our study, the thickness of the secondary cell wall of the vascular bundles in both the internodes and the leaves of dnl2 was significantly reduced compared to the wild-type (Figure 4 and Figure 5). The histochemical staining results also indicated reduced lignin deposition in the secondary cell wall of dnl2 (Figure 6). The altered cell wall structure may be related to the inhibited cell division and elongation.
During rapid cell growth, the development of new cell wall polymers relies on a large amount of cellulose and hemicellulose deposition, which is manipulated by the active expression of cell wall-related genes [66,67]. Transcriptome comparison between dnl2 and the wild-type showed that 66.7% of the 130 DEGs that are related to cell wall deposition and remodeling were down-regulated in dnl2 compared with the wild-type, especially the DEGs involved in secondary wall deposition (Figure 14). For example, CesA10, CesA11, CesA12, and Brittle stalk 2, which are abundant in the vascular bundles and are associated with secondary wall cellulose synthesis, were down-regulated by 2.2–7.2-fold (Figure 14A). Twenty DEGs belong to GTs, GUXs, GXMs, and RWAS families, which participate in xylan synthesis and substitution, were also down-regulated (Figure 14 B). Additionally, 21 DEGs related to lignin synthesis were down-regulated, such as two PALs (Zm00001d003016, Zm00001d003015), which are the key enzymes of the phenylpropanoid pathway and exhibited 6.2–7.1-fold decreased expression levels. CCoAOMT (Zm00001d052841), which is involved in an alternative methylation pathway of lignin biosynthesis, was also decreased in expression by 4.8-fold (Figure 14C). These expression changes explain the thinner secondary cell wall and decreased deposition of lignin around the vascular bundles and under the epidermis of dnl2 internodes and leaves.

3.3. Plant Hormones May Participate in the Regulation of Cell Growth and Vascular Patterning in dnl2

Plant growth and development are tightly regulated by phytohormones, such as auxin and gibberellin [68]. Auxin plays a pivotal role in regulating cell wall remodeling and overall cell growth [69]. Numerous mutants impaired in auxin synthesis or signaling exhibit overall dwarfism, defects in tropisms, and alterations in organ morphology [70]. In maize, loss-of-function of VANISHING TASSEL (VT2), which is a grass-specific IAA biosynthetic enzyme in the IPA pathway, shows shorter inflorescences and plant height due to defects in cell elongation [17]. The reduction in IAA levels gives rise to pleiotropic organ malformation together with a severe narrow-leaf phenotype in rice. The narrow leaf7 (nal7) mutant, which has a mutation in YUCCA8 (YUC8) that is involved in auxin synthesis, produces narrow and curly leaves throughout development [28]. NAL1 regulates the polar transport of auxin and modulates leaf size by affecting vein patterning and cell division [31]. Recent studies have shown that NAL2/3 not only regulates auxin distribution, but also has a negative feedback effect on gibberellin biosynthesis. It is suggested that NAL2/3 may regulate leaf size through the crosstalk between GA and auxin [32]. In both the nal1 and nal2/3 mutants, the number of small veins in the leaves is significantly reduced, whereas the number of large veins is only slightly reduced compared to the wild-type. In our study, dnl2 showed a significant decrease in the number of small veins compared with the wild-type plants. The GA and IAA contents were significantly decreased in both the internodes and the leaves of dnl2 relative to those of the wild-type (Figure 7). Therefore, we speculate that dnl2 has similar regulatory mechanisms as nal1 and nal2/3, caused by the crosstalk of IAA and GA. Our transcriptome results revealed that many genes involved in IAA and GA biosynthesis and signaling were differentially expressed between dnl2 and the wild-type plant (Figure 13). Flavin monooxygenase-like protein, which catalyzes the last step of conversion of IPyA to IAA, was down-regulated by 2.75-fold in dnl2. DWARF1, which encodes a gibberellin 3-oxidase that catalyzes the final step of bioactive GA synthesis, was also down-regulated by 6.43-fold in dnl2. Down-regulation of the expression of these genes could be the cause of the decreased IAA and GA contents in dnl2. Furthermore, auxin response gene families, such as Aux/IAA, GH3, SAUR, ARF, and PIN, and GA receptors exhibited altered expression in dnl2. Therefore, we hypothesized that the dwarfing mechanism of dnl2 is caused by the crosstalk between hormones, such as GA and IAA, which regulates the synthesis of the plant secondary cell wall, thus affecting the elongation of plant cells.

4. Materials and Methods

4.1. Plant Materials and Phenotypic Analysis

The pollen of the maize inbred line ‘Zheng58’ was collected and mutagenized with ethyl methanesulfonate (EMS), and the resulting pollen was applied to ‘Zheng58’ female ears to generate M1 progeny. A large number of M1 seeds were planted and self-pollinated to produce the M2 population, among which a dwarf and narrow-leaf mutant was identified and named dnl2. The dnl2 with stable inheritance was obtained by continuous selfing and screening. For phenotypic analysis, the dnl2 mutant and normal siblings (wild-type) of the same M5 family were used. All materials were single seeded and nursed with standard agricultural cultivation. The method of measuring plant height and ear height was from the ground to the tassel top, and from the ground to the top ear-bearing node, respectively. Leaf angle was the inclination between the internode and leaf blade midrib. The length of the leaves above the top ear was measured along the midrib, from the ligule to the tip, and the width was measured at the midpoint of the length. Analysis was performed on 10 individual plants for each genotype.

4.2. Gene Preliminary Mapping

Due to the poor fertility of the dnl2 mutant, the F1 population was obtained by crossing hybrid plants (+/dnl2) of the M4 progeny with the maize inbred line ‘Mo17‘. The F2 population obtained from F1 selfing was used for genetic analysis and gene mapping. Dwarf mutants were randomly selected from the F2 population, and the genomic DNA of 67 mutant plants and their parents was extracted using the CTAB method [71]. The genotypes were assessed via genotyping by target sequencing (GBTS) with a 20 K single nucleotide polymorphism (SNP) panel [72]. After removing the non-polymorphic and low-quality markers, the genotype frequencies (SNP-index) of each polymorphic SNP marker were calculated. The SNP index represents the frequencies of mutant alleles in the population. The closer the SNP-index is to 1, the closer linkage between the marker and the target gene [73].

4.3. Measurement of Endogenous Phytohormones

Endogenous GA, ABA, and IAA were measured using a plant enzyme-linked immunosorbent assay (ELISA) kit (Shanghai Enzyme-linked Biotechnology Co., Ltd., Shanghai, China) according to the producer’s instructions. In order to measure the concentration of GA3, ABA, and IAA, the 15th expanded leaves and the 11th internode of dnl2 and WT at the V15 stage were ground in liquid nitrogen. The GA3, ABA, and IAA ELISA kit includes a set of standard samples. The standard samples were assayed at the same time as the plant samples which allowed the operator to produce a standard curve of optical density (O.D.) versus GA3, ABA, and IAA concentration. The concentrations of GA3, ABA, and IAA in the samples were then determined by comparing the O.D. of the samples to the standard curve [74].

4.4. Histochemical Staining

The seventh internode from the bottom of the stem and the 15th leaf at the tasseling stage were sampled from dnl2 and the wild-type. Three biological replicates were assessed. The samples were embedded in 3% agar for the observation of cells and tissues via light microscopy. Transverse sections (100 μm) were produced using a vibratome (Leica VT 1000 S). Following staining with phloroglucinol HCl, the images were collected with an Olympus BX53 microscope under white light.

4.5. Scanning Electron Microscopy (SEM)

The seventh internodes and the 15th leaf of the wild-type and dnl2 plants at the V15 stage (15 expanded leaves) were used for SEM observations. The internodes and leaves were cut into 2-mm longitudinal and transverse sections and fixed in FAA (formalin: acetic acid: 70% ethanol, 1:1:18, v/v/v). The fixed material was dehydrated in an ethanol gradient series (70%, 80%, 95%, and 100% ethanol) and then treated with isoamyl acetate for 15 min twice to replace the remaining ethanol and subjected to critical point drying (Hitachi Regulus8100). The samples were then coated with Pt particles and analyzed under a scanning electron microscope SU8020 (Hitachi, Tokyo, Japan). ImageJ software was used to measure the size of the cell, the number of cells, and the area of the vascular bundles.

4.6. RNA-seq Library Construction and Sequencing

For RNA-seq analysis, the seventh internodes of the wild-type and mutant plants at the V15 stage were harvested and frozen in liquid nitrogen. Three biological replicates for each genotype and three pooled samples for each replicate were tested in this study. Total RNA was extracted with the Transzol UP kit (Beijing Transgen Biotechnology Co., Ltd., Beijing, China), and the RNA concentration, purity, and integrity were examined using advanced molecular biology equipment. A total amount of 1 μg qualified RNA per sample was used as input material for the RNA sample preparations. Based on the manufacturer’s instructions, sequencing libraries were generated using the NEBNext UltraTM RNA library prep kit for Illumina (New England Biolabs, Ipswich, MA, USA), and index codes were added to attribute sequences to each sample. The library quality was assessed on an Agilent Bioanalyzer 2100 system. The clustering of the index-coded samples was performed on a cBot cluster generation system using a TruSeq PE cluster kit v4-cBot-HS (Illumina, San Diego, CA, USA) according to the manufacturer’s instructions. After cluster generation, the library preparations were sequenced on an Illumina HiSeq2500, and 125 bp paired-end reads were generated.

4.7. Sequence Mapping, Expression Quantification, and Differential Expression Analysis

After removing reads containing adapters or poly-N and low-quality reads (q-value ≤ 10) from the raw data, the paired-end clean reads were aligned to the B73 reference genome (RefGen_v4) using the default parameters of HISAT2 software. The reference genome and gene model annotation files were downloaded from the genome website (http://ensembl.gramene.org/Zea_mays/Info/Index) [Accessed: 6 December 2020] directly. The read count numbers of fragments per kilobases per million reads (FPKM) were converted using Stringtie v2.1.0 software. The differential expression analysis between the wild-type and the dnl2 mutant was performed was performed using DESeq2. The resulting p-values were adjusted using the Benjamini and Hochberg’s approach for controlling the false discovery rate (FDR). Genes with Log2 fold-change (Log2FC) ≥ 1 (up-regulated) or Log2FC ≤ −1 (down-regulated) and FDR < 0.01 were considered as differentially expressed genes (DEGs).

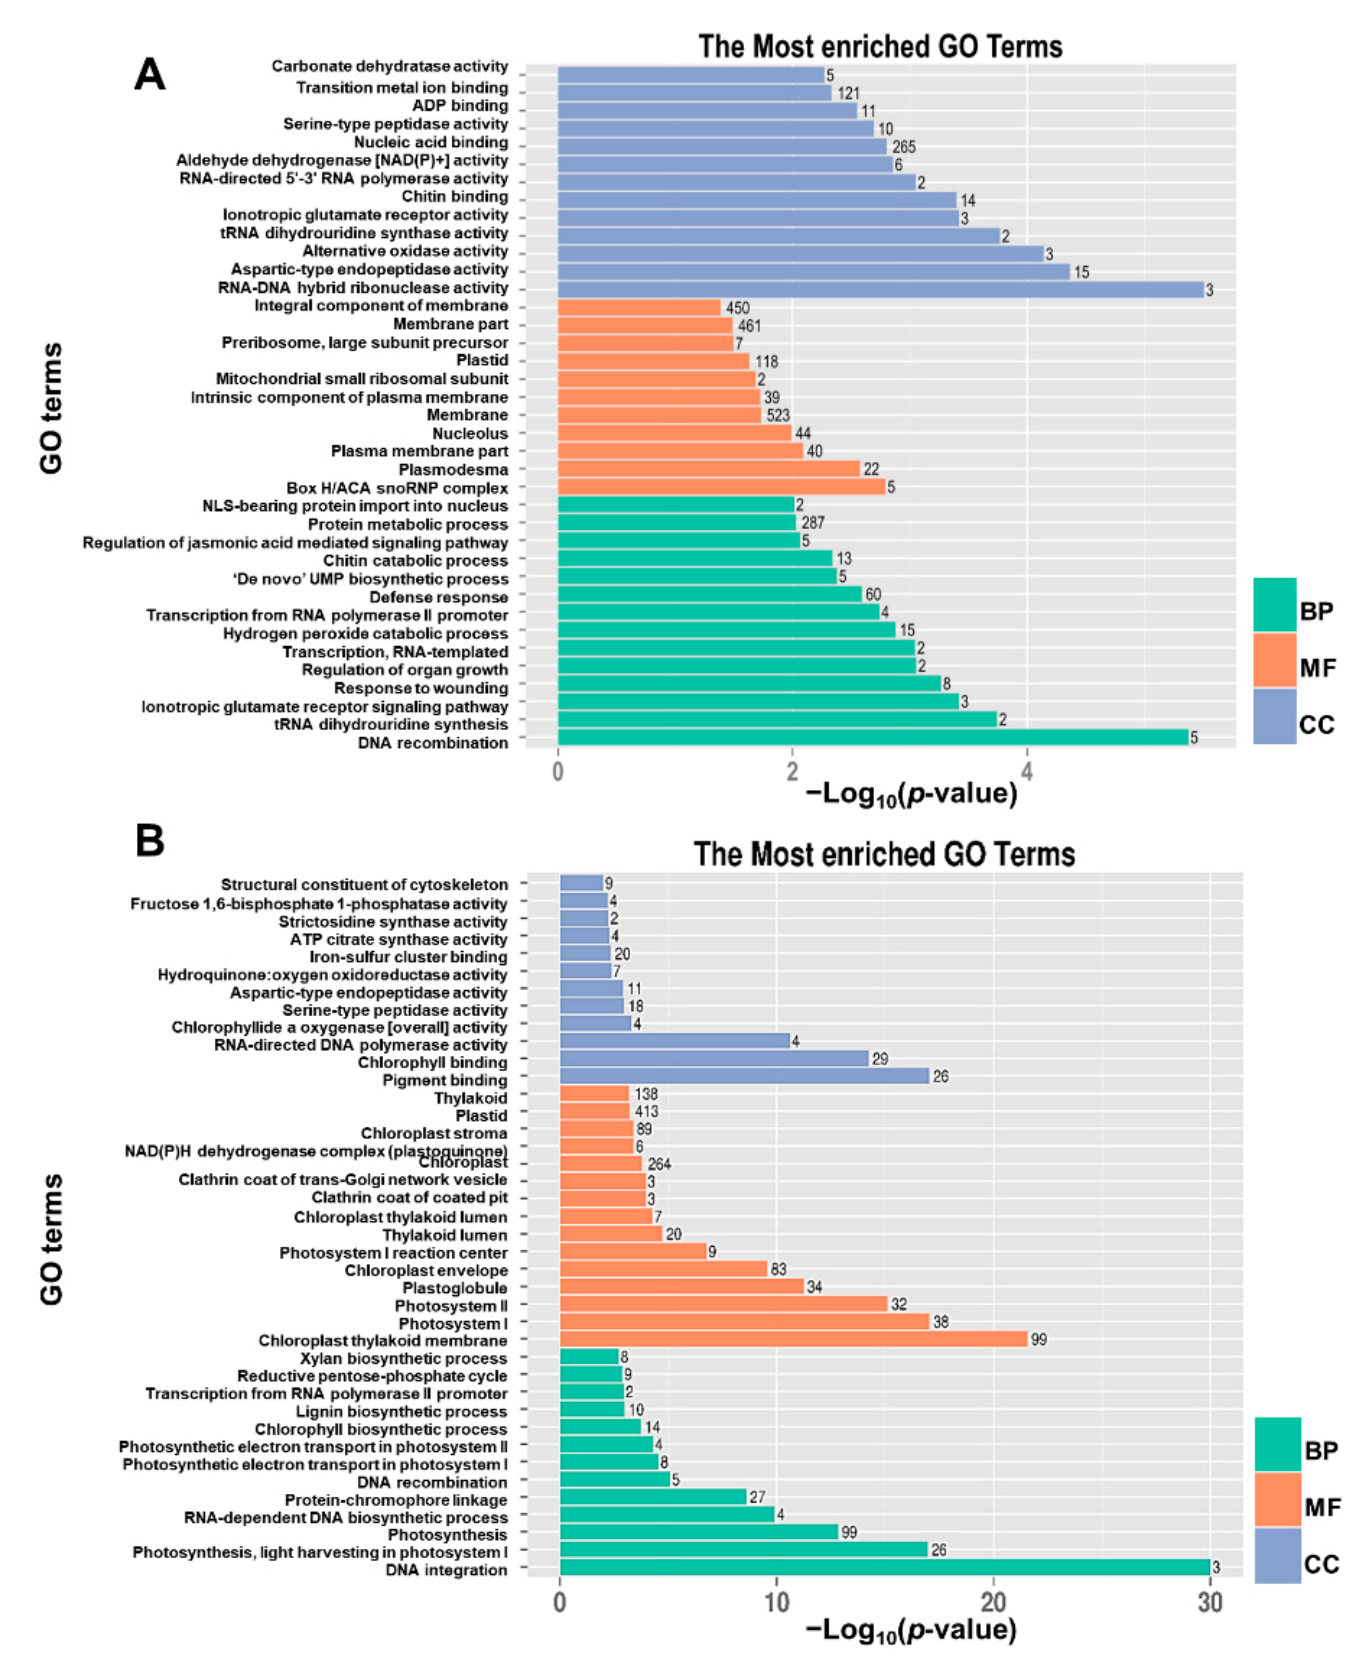
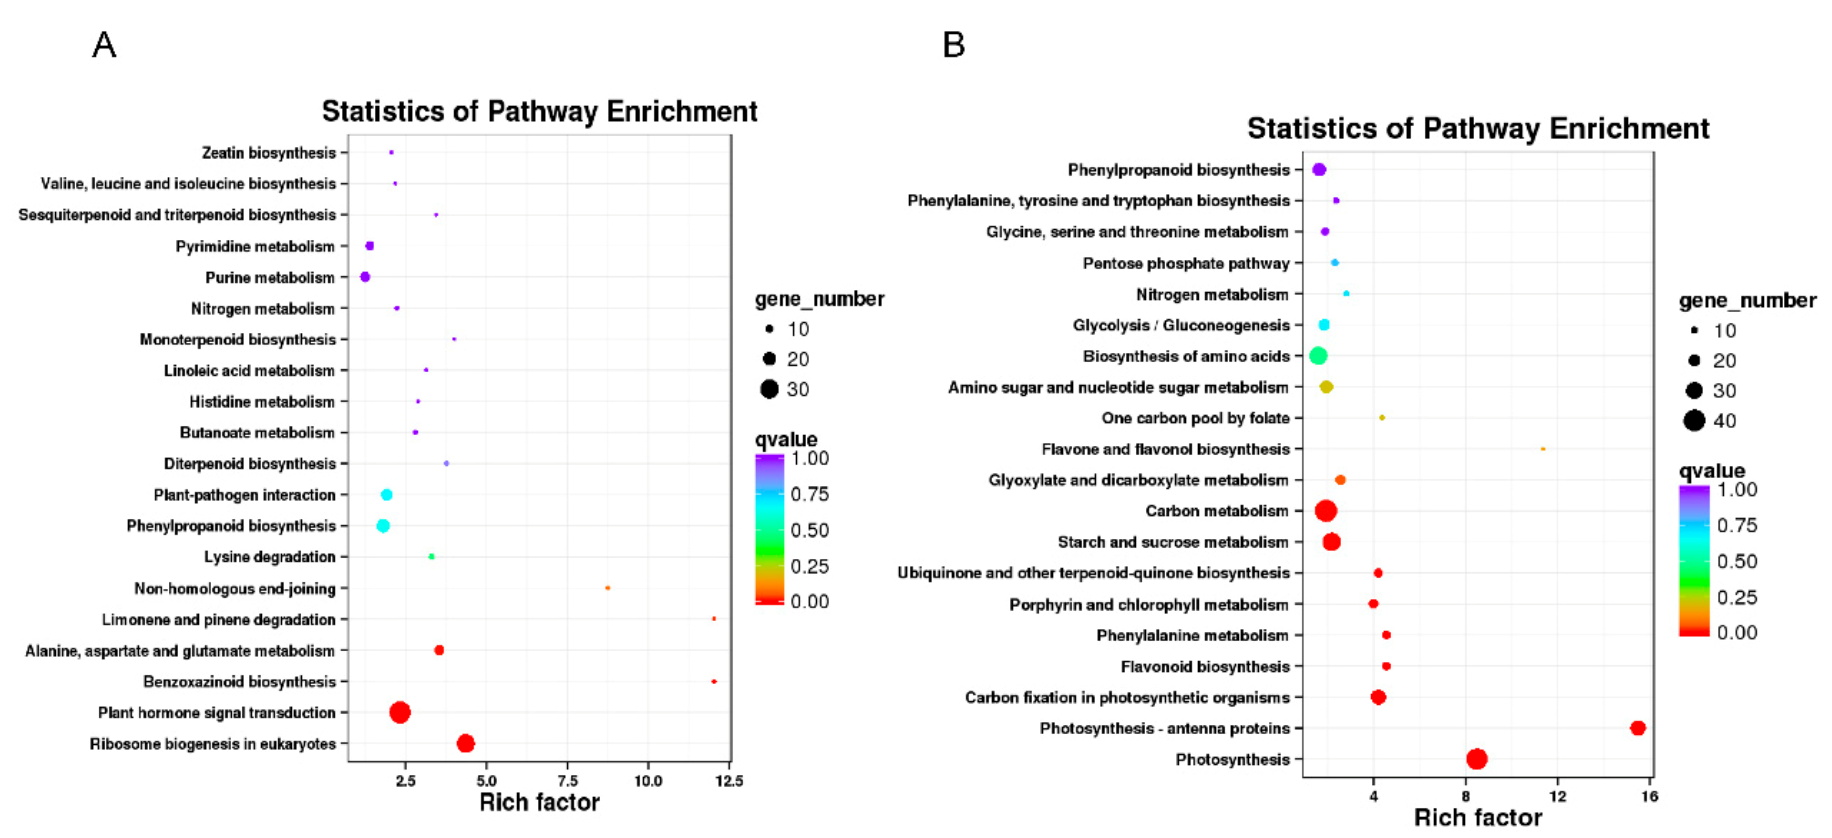
4.8. Gene Ontology (GO) and Pathway Enrichment Analysis

GO enrichment analysis of the DEGs was implemented using the GOseq R package and GO terms with corrected p-values < 0.05 were considered to be significantly enriched by DEGs. KOBAS software was used to test the statistical enrichment of DEGs in Kyoto Encyclopedia Genes and Genomes (KEGG) pathways.

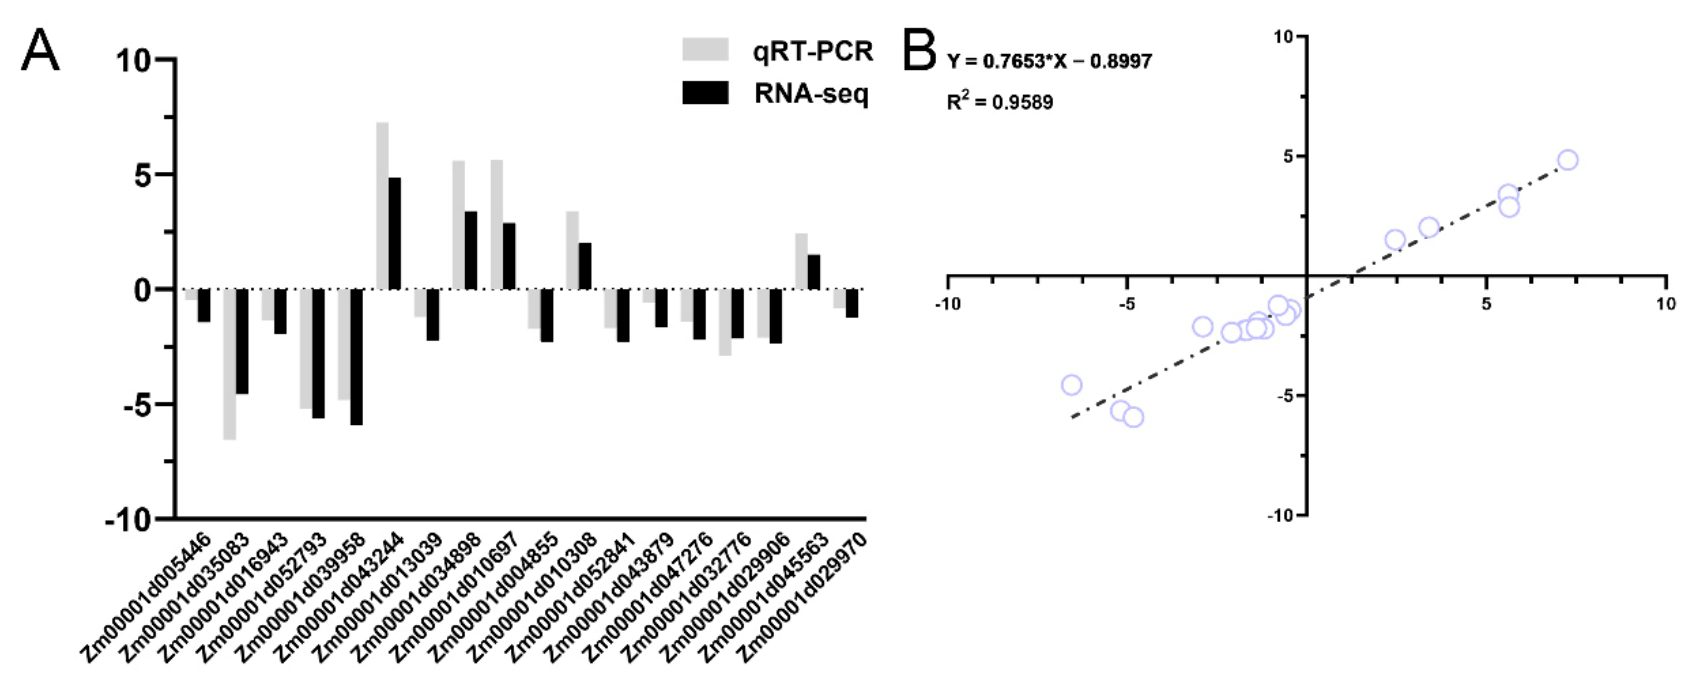
4.9. Quantitative Real-Time PCR (qRT-PCR) Validation of the DEGs

The expression levels of some DEGs were evaluated by qRT-PCR to validate the RNA-seq data. The specific primers for qRT-PCR are provided in Table S11, tubulin was used as an internal control in the qRT-PCR. The reaction was performed in a 96-well plate on a CFX96 real-time PCR detection system (Bio-Rad, Hercules, CA, USA) using TB Green II Premix Ex Taq (RR820A; TaKaRa Biotechnology Co., Ltd., Dalian, China) using the thermal cycling parameters (30 s at 95 °C, 40 cycles of 5 s at 95 °C and 30 s at 60 °C; dissociation curve: 65 °C to 95 °C, increment 0.5 °C, for 5 s). The relative expression level of the selected DEGs was calculated with the 2−ΔΔCT method [75]. The reaction was carried out using three biological replicates with three technical replicates.

5. Conclusions

In this study, we characterized a recessive maize mutant, dnl2, which exhibited short internodes, narrow leaves, and various developmental defects. Genetic analysis suggested the DNL2 was located near the centromere of chromosome nine. The phenotypic, cytological, and biochemical comparison between the dnl2 and the wild-type mutants revealed that the cell growth, vascular bundle patterning, cell wall structure, and phytohormone contents were altered in the internodes and leaves of dnl2, which were the main causes of the defective phenotype. The transcriptome analysis further proved that the crucial genes involved in cell wall development, phytohormone synthesis, and signaling were differentially expressed between the dnl2 and wild-type plants. Our study provides important clues for the further elucidation of the molecular mechanism of the regulation of plant height and leaf shape in maize.

Supplementary Materials

The following supporting information can be downloaded at: https://0-www-mdpi-com.brum.beds.ac.uk/article/10.3390/ijms23020795/s1.

Author Contributions

C.H., X.H. and H.W. designed the project. L.H., C.J., W.Z. and Y.W. conducted the field experiments. L.H. conducted the laboratory work and data analysis. X.H. and L.H. wrote the manuscript. C.H., Z.L., K.L. and X.L. revised the manuscript. All authors have read and agreed to the published version of the manuscript.

Funding

This research was supported by the Hainan Provincial Joint Project of Sanya Yazou Bay Science and Technology City, Grant No: 320LH043; National Natural Science Foundation of China, Grant No. 31500984; the Agricultural Science and Technology Innovation Program of CAAS, and National Engineering Laboratory for Crop Molecular Breeding.

Institutional Review Board Statement

Not applicable.

Informed Consent Statement

Not applicable.

Data Availability Statement

The data presented in this study are available in this article and Supplementary Materials.

Acknowledgments

We extend our appreciation to the anonymous reviewers for their valuable suggestions to help improve this article.

Conflicts of Interest

Authors declare that there are no conflict of interest.

References

  1. Duvick, D.N. Genetic Progress in yield of united states maize (Zea mays L.). Maydica 2005, 50, 193–202. [Google Scholar] [CrossRef]
  2. Baker, C.J.; Sterling, M.; Berry, P. A generalised model of crop lodging. J. Theor. Biol. 2014, 363, 1–12. [Google Scholar] [CrossRef] [PubMed]
  3. Ciampitti, I.A.; Vyn, T.J. Physiological perspectives of changes over time in maize yield dependency on nitrogen uptake and associated nitrogen efficiencies: A review. Field Crops Res. 2012, 133, 48–67. [Google Scholar] [CrossRef]
  4. Donald, C.M. The breeding of crop ideotypes. Euphytica 1968, 17, 385–403. [Google Scholar] [CrossRef]
  5. Hedden, P. The genes of the green revolution. Trends Genet. 2003, 19, 5–9. [Google Scholar] [CrossRef]
  6. Liu, R.; Meng, Q.; Zheng, F.; Kong, L.; Yuan, J.; Lubberstedt, T. Genetic mapping of QTL for maize leaf width combining RIL and IF2 populations. PLoS ONE 2017, 12, e0189441. [Google Scholar] [CrossRef] [Green Version]
  7. Guo, S.; Ku, L.; Qi, J.; Tian, Z.; Han, T.; Zhang, L.; Su, H.; Ren, Z.; Chen, Y. Genetic analysis and major quantitative trait locus mapping of leaf widths at different positions in multiple populations. PLoS ONE 2015, 10, e0119095. [Google Scholar] [CrossRef] [Green Version]
  8. Wang, B.; Smith, S.M.; Li, J. Genetic regulation of shoot architecture. Annu. Rev. Plant Biol. 2018, 69, 437–468. [Google Scholar] [CrossRef]
  9. Guardiola, J.L. Plant hormones. Physiology, biochemistry and molecular biology. Sci. Hortic. 1996, 66, 267–270. [Google Scholar] [CrossRef]
  10. Bensen, R.J.; Johal, G.S.; Crane, V.C.; Tossberg, J.T.; Schnable, P.S.; Meeley, R.B.; Briggs, S.P. Cloning and characterization of the maize An1 gene. Plant Cell 1995, 7, 75–84. [Google Scholar] [CrossRef]
  11. Chen, Y.; Hou, M.; Liu, L.; Wu, S.; Shen, Y.; Ishiyama, K.; Kobayashi, M.; McCarty, D.R.; Tan, B.C. The maize DWARF1 encodes a gibberellin 3-Oxidase and is dual localized to the nucleus and cytosol. Plant Physiol. 2014, 166, 2028–2039. [Google Scholar] [CrossRef] [Green Version]
  12. Winkler, R.G.; Helentjaris, T. The maize Dwarf3 gene encodes a cytochrome P450-mediated early step in gibberellin biosynthesis. Plant Cell 1995, 7, 1307–1317. [Google Scholar] [CrossRef] [Green Version]
  13. Fu, J.; Ren, F.; Lu, X.; Mao, H.; Xu, M.; Degenhardt, J.; Peters, R.J.; Wang, Q. A tandem array of ent-kaurene synthases in maize with roles in gibberellin and more specialized metabolism. Plant Physiol. 2016, 170, 742–751. [Google Scholar] [CrossRef] [Green Version]
  14. Fujioka, S.; Yamane, H.; Spray, C.R.; Katsumi, M.; Phinney, B.O.; Gaskin, P.; Macmillan, J.; Takahashi, N. The dominant non-gibberellin-responding dwarf mutant (D8) of maize accumulates native gibberellins. Proc. Natl. Acad. Sci. USA 1988, 85, 9031–9035. [Google Scholar] [CrossRef] [Green Version]
  15. Winkler, R.; Freeling, M. Physiological genetics of the dominant gibberellin-nonresponsive maize dwarfs, Dwarf8 and Dwarf9. Planta 1994, 193, 341–348. [Google Scholar] [CrossRef]
  16. Teale, W.D.; Paponov, I.A.; Palme, K. Auxin in action: Signalling, transport and the control of plant growth and development. Nat. Rev. Mol. Cell Biol. 2006, 7, 847–859. [Google Scholar] [CrossRef]
  17. Phillips, K.A.; Skirpan, A.L.; Liu, X.; Christensen, A.; Slewinski, T.L.; Hudson, C.; Barazesh, S.; Cohen, J.D.; Malcomber, S.; McSteen, P. vanishing tassel2 encodes a grass-specific tryptophan aminotransferase required for vegetative and reproductive development in maize. Plant Cell 2011, 23, 550–566. [Google Scholar] [CrossRef] [Green Version]
  18. Multani, D.S.; Briggs, S.P.; Chamberlin, M.A.; Blakeslee, J.J.; Murphy, A.S.; Johal, G.S. Loss of an MDR transporter in compact stalks of maize br2 and sorghum dw3 mutants. Science 2003, 302, 81–84. [Google Scholar] [CrossRef]
  19. Carraro, N.; Forestan, C.; Canova, S.; Traas, J.; Varotto, S. ZmPIN1a and ZmPIN1b encode two novel putative candidates for polar auxin transport and plant architecture determination of maize. Plant Physiol. 2006, 142, 254–264. [Google Scholar] [CrossRef] [Green Version]
  20. Li, Z.; Zhang, X.; Zhao, Y.; Li, Y.; Zhang, G.; Peng, Z.; Zhang, J. Enhancing auxin accumulation in maize root tips improves root growth and dwarfs plant height. Plant Biotechnol. J. 2018, 16, 86–99. [Google Scholar] [CrossRef]
  21. Hartwig, T.; Chuck, G.S.; Fujioka, S.; Klempien, A.; Weizbauer, R.; Potluri, D.P.; Choe, S.; Johal, G.S.; Schulz, B. Brassinosteroid control of sex determination in maize. Proc. Natl. Acad. Sci. USA 2011, 108, 19814–19819. [Google Scholar] [CrossRef] [Green Version]
  22. Best, N.B.; Hartwig, T.; Budka, J.; Fujioka, S.; Johal, G.; Schulz, B.; Dilkes, B.P. nana plant2 encodes a maize ortholog of the arabidopsis brassinosteroid biosynthesis gene DWARF1, identifying developmental interactions between brassinosteroids and gibberellins. Plant Physiol. 2016, 171, 2633–2647. [Google Scholar] [CrossRef] [Green Version]
  23. Makarevitch, I.; Thompson, A.; Muehlbauer, G.J.; Springer, N.M. Brd1 gene in maize encodes a brassinosteroid C-6 oxidase. PLoS ONE 2012, 7, e30798. [Google Scholar] [CrossRef]
  24. Kir, G.; Ye, H.; Nelissen, H.; Neelakandan, A.K.; Kusnandar, A.S.; Luo, A.; Inze, D.; Sylvester, A.W.; Yin, Y.; Becraft, P.W. RNA interference knockdown of BRASSINOSTEROID INSENSITIVE1 in maize reveals novel functions for brassinosteroid signaling in controlling plant architecture. Plant Physiol. 2015, 169, 826–839. [Google Scholar] [CrossRef] [Green Version]
  25. Li, H.; Wang, L.; Liu, M.; Dong, Z.; Li, Q.; Fei, S.; Xiang, H.; Liu, B.; Jin, W. Maize plant architecture is regulated by the ethylene biosynthetic gene ZmACS7. Plant Physiol. 2020, 183, 1184–1199. [Google Scholar] [CrossRef]
  26. Ali, S.; Khan, N.; Xie, L. Molecular and hormonal regulation of leaf morphogenesis in arabidopsis. Int. J. Mol. Sci. 2020, 21, 5132. [Google Scholar] [CrossRef]
  27. Chen, Y.; Dan, Z.; Gao, F.; Chen, P.; Fan, F.; Li, S. Rice GROWTH-REGULATING FACTOR7 modulates plant architecture through regulating GA and IAA metabolism. Plant Physiol. 2020, 184, 393–406. [Google Scholar] [CrossRef] [PubMed]
  28. Fujino, K.; Matsuda, Y.; Ozawa, K.; Nishimura, T.; Koshiba, T.; Fraaije, M.W.; Sekiguchi, H. NARROW LEAF 7 controls leaf shape mediated by auxin in rice. Mol. Genet. Genom. 2008, 279, 499–507. [Google Scholar] [CrossRef] [PubMed] [Green Version]
  29. Sazuka, T.; Kamiya, N.; Nishimura, T.; Ohmae, K.; Sato, Y.; Imamura, K.; Nagato, Y.; Koshiba, T.; Nagamura, Y.; Ashikari, M.; et al. A rice tryptophan deficient dwarf mutant, tdd1, contains a reduced level of indole acetic acid and develops abnormal flowers and organless embryos. Plant J. 2009, 60, 227–241. [Google Scholar] [CrossRef] [PubMed]
  30. Yoshikawa, T.; Ito, M.; Sumikura, T.; Nakayama, A.; Nishimura, T.; Kitano, H.; Yamaguchi, I.; Koshiba, T.; Hibara, K.; Nagato, Y.; et al. The rice FISH BONE gene encodes a tryptophan aminotransferase, which affects pleiotropic auxin-related processes. Plant J. 2014, 78, 927–936. [Google Scholar] [CrossRef]
  31. Qi, J.; Qian, Q.; Bu, Q.; Li, S.; Chen, Q.; Sun, J.; Liang, W.; Zhou, Y.; Chu, C.; Li, X.; et al. Mutation of the Rice Narrow leaf1 gene, which encodes a novel protein, affects vein patterning and polar auxin transport. Plant Physiol. 2008, 147, 1947–1959. [Google Scholar] [CrossRef] [Green Version]
  32. Cho, S.H.; Yoo, S.C.; Zhang, H.; Pandeya, D.; Koh, H.J.; Hwang, J.Y.; Kim, G.T.; Paek, N.C. The rice narrow leaf2 and narrow leaf3 loci encode WUSCHEL-related homeobox 3A (OsWOX3A) and function in leaf, spikelet, tiller and lateral root development. New Phytol. 2013, 198, 1071–1084. [Google Scholar] [CrossRef]
  33. Uzair, M.; Long, H.; Zafar, S.A.; Patil, S.B.; Chun, Y.; Li, L.; Fang, J.; Zhao, J.; Peng, L.; Yuan, S.; et al. Narrow Leaf21, encodingRibosomal protein RPS3A, controls leaf development in rice. Plant Physiol. 2021, 186, 497–518. [Google Scholar] [CrossRef]
  34. Zhang, S.; Wang, S.; Xu, Y.; Yu, C.; Shen, C.; Qian, Q.; Geisler, M.; Jiang, A.; Qi, Y. The auxin response factor, OsARF19, controls rice leaf angles through positively regulating OsGH3-5 and OsBRI1. Plant Cell Environ. 2015, 38, 638–654. [Google Scholar] [CrossRef] [Green Version]
  35. Sims, K.; Abedi-Samakush, F.; Szulc, N.; Macias Honti, M.G.; Mattsson, J. OsARF11 promotes growth, meristem, seed, and vein formation during rice plant development. Int. J. Mol. Sci. 2021, 22, 4089. [Google Scholar] [CrossRef]
  36. Mimura, M.; Nagato, Y.; Itoh, J. Rice PLASTOCHRON genes regulate leaf maturation downstream of the gibberellin signal transduction pathway. Planta 2012, 235, 1081–1089. [Google Scholar] [CrossRef]
  37. Ikeda, A.; Ueguchi-Tanaka, M.; Sonoda, Y.; Kitano, H.; Koshioka, M.; Futsuhara, Y.; Matsuoka, M.; Yamaguchi, J. slender rice, a constitutive gibberellin response mutant, is caused by a null mutation of the SLR1 gene, an ortholog of the height-regulating gene GAI/RGA/RHT/D8. Plant Cell 2001, 13, 999–1010. [Google Scholar] [CrossRef] [Green Version]
  38. Gomi, K.; Sasaki, A.; Itoh, H.; Ueguchi-Tanaka, M.; Ashikari, M.; Kitano, H.; Matsuoka, M. GID2, an F-box subunit of the SCF E3 complex, specifically interacts with phosphorylated SLR1 protein and regulates the gibberellin-dependent degradation of SLR1 in rice. Plant J. 2004, 37, 626–634. [Google Scholar] [CrossRef]
  39. Schmitz, A.J.; Begcy, K.; Sarath, G.; Walia, H. Rice Ovate Family Protein 2 (OFP2) alters hormonal homeostasis and vasculature development. Plant Sci. 2015, 241, 177–188. [Google Scholar] [CrossRef]
  40. Luan, W.; Liu, Y.; Zhang, F.; Song, Y.; Wang, Z.; Peng, Y.; Sun, Z. OsCD1 encodes a putative member of the cellulose synthase-like D sub-family and is essential for rice plant architecture and growth. Plant Biotechnol. J. 2011, 9, 513–524. [Google Scholar] [CrossRef]
  41. Ding, Z.; Lin, Z.; Li, Q.; Wu, H.; Xiang, C.; Wang, J. DNL1, encodes cellulose synthase-like D4, is a major QTL for plant height and leaf width in rice (Oryza sativa L.). Biochem. Biophys. Res. Commun. 2015, 457, 133–140. [Google Scholar] [CrossRef]
  42. Hunter, C.T.; Kirienko, D.H.; Sylvester, A.W.; Peter, G.F.; McCarty, D.R.; Koch, K.E. Cellulose Synthase-Like D1 is integral to normal cell division, expansion, and leaf development in maize. Plant Physiol. 2012, 158, 708–724. [Google Scholar] [CrossRef] [Green Version]
  43. Li, W.; Wu, C.; Hu, G.; Xing, L.; Qian, W.; Si, H.; Sun, Z.; Wang, X.; Fu, Y.; Liu, W. Characterization and fine mapping of a novel rice narrow leaf mutant nal9. J. Integr. Plant Biol. 2013, 55, 1016–1025. [Google Scholar] [CrossRef]
  44. Cao, X.; Yang, H.; Shang, C.; Ma, S.; Liu, L.; Cheng, J. The roles of auxin biosynthesis YUCCA gene family in plants. Int. J. Mol. Sci. 2019, 20, 6343–6362. [Google Scholar] [CrossRef] [Green Version]
  45. Tivendale, N.D.; Ross, J.J.; Cohen, J.D. The shifting paradigms of auxin biosynthesis. Trends Plant Sci. 2014, 19, 44–51. [Google Scholar] [CrossRef]
  46. Abel, S.; Theologis, A. Early genes and auxin action. Plant Physiol. 1996, 111, 9–11. [Google Scholar] [CrossRef]
  47. Chen, Y.; Hao, X.; Cao, J. Small auxin upregulated RNA (SAUR) gene family in maize: Identification, evolution, and its phylogenetic comparison with Arabidopsis, rice, and sorghum. J. Integr. Plant Biol. 2014, 56, 133–150. [Google Scholar] [CrossRef]
  48. Staswick, P.E.; Serban, B.; Rowe, M.; Tiryaki, I.; Maldonado, M.T.; Maldonado, M.C.; Suza, W. Characterization of an arabidopsis enzyme family that conjugates amino acids to indole-3-acetic acid. Plant Cell 2005, 17, 616–627. [Google Scholar] [CrossRef] [Green Version]
  49. Wuddineh, W.A.; Stewart, C.N., Jr.; Mazarei, M.; Zhang, J.; Poovaiah, C.R.; Mann, D.G.; Ziebell, A.; Sykes, R.W.; Davis, M.F.; Udvardi, M.K. Identification and overexpression of gibberellin 2-oxidase (GA2ox) in switchgrass (Panicum virgatum L.) for improved plant architecture and reduced biomass recalcitrance. Plant Biotechnol. J. 2015, 13, 636–647. [Google Scholar] [CrossRef] [PubMed] [Green Version]
  50. Zhang, Q.; Cheetamun, R.; Dhugga, K.S.; Rafalski, J.A.; Tingey, S.V.; Shirley, N.J.; Taylor, J.; Hayes, K.; Beatty, M.; Bacic, A.; et al. Spatial gradients in cell wall composition and transcriptional profiles along elongating maize internodes. BMC Plant Biol. 2014, 14, 27. [Google Scholar] [CrossRef] [PubMed] [Green Version]
  51. Ching, A.; Dhugga, K.S.; Appenzeller, L.; Meeley, R.; Bourett, T.M.; Howard, R.J.; Rafalski, A. Brittle stalk 2 encodes a putative glycosylphosphatidylinositol-anchored protein that affects mechanical strength of maize tissues by altering the composition and structure of secondary cell walls. Planta 2006, 224, 1174–1184. [Google Scholar] [CrossRef] [PubMed]
  52. Scheller, H.V.; Ulvskov, P. Hemicelluloses. Annu. Rev. Plant Biol. 2010, 61, 263–289. [Google Scholar] [CrossRef] [PubMed]
  53. Zhong, R.; Cui, D.; Ye, Z.H. Secondary cell wall biosynthesis. New Phytol. 2019, 221, 1703–1723. [Google Scholar] [CrossRef] [Green Version]
  54. Cosgrove, D.J. Wall extensibility: Its nature, measurement and relationship to plant cell growth. New Phytol. 1993, 124, 1–23. [Google Scholar] [CrossRef]
  55. Langston, J.; Sheehy, N.; Xu, F. Substrate specificity of Aspergillus oryzae family 3 beta-glucosidase. Biochim. Biophys. Acta 2006, 1764, 972–978. [Google Scholar] [CrossRef]
  56. Tsukaya, H.; Beemster, G.T. Genetics, cell cycle and cell expansion in organogenesis in plants. J. Plant Res. 2006, 119, 1–4. [Google Scholar] [CrossRef]
  57. Richards, R.A. The effect of dwarfing genes in spring wheat in dry environments. II. Growth, water use and water-use efficiency. Aust. J. Agric. Res. 1992, 43, 529–539. [Google Scholar] [CrossRef]
  58. Beharav, A.; Cahaner, A.; Pinthus, M.J. Genetic correlations between culm length, grain yield and seedling elongation within tall (rht1) and semi-dwarf (Rht1) spring wheat (Triticum aestivum L.). Eur. J. Agron. 1998, 9, 35–40. [Google Scholar] [CrossRef]
  59. Schillinger, W.F.; Donaldson, E.; Allan, R.E.; Jones, S.S. Winter wheat seedling emergence from deep sowing depths. Agron. J. 1998, 90, 582–586. [Google Scholar] [CrossRef]
  60. Fang, J.; Yuan, S.; Li, C.; Jiang, D.; Zhao, L.; Peng, L.; Zhao, J.; Zhang, W.; Li, X. Reduction of ATPase activity in the rice kinesin protein Stemless Dwarf 1 inhibits cell division and organ development. Plant J. 2018, 96, 620–634. [Google Scholar] [CrossRef] [Green Version]
  61. Rosa, M.; Abraham-Juarez, M.J.; Lewis, M.W.; Fonseca, J.P.; Tian, W.; Ramirez, V.; Luan, S.; Pauly, M.; Hake, S. The maize mid-complementing activity homolog cell number regulator13/narrow odd dwarf coordinates organ growth and tissue patterning. Plant Cell 2017, 29, 474–490. [Google Scholar] [CrossRef]
  62. Wu, C.; Fu, Y.; Hu, G.; Si, H.; Cheng, S.; Liu, W. Isolation and characterization of a rice mutant with narrow and rolled leaves. Planta 2010, 232, 313–324. [Google Scholar] [CrossRef]
  63. Kalve, S.; Fotschki, J.; Beeckman, T.; Vissenberg, K.; Beemster, G.T. Three-dimensional patterns of cell division and expansion throughout the development of Arabidopsis thaliana leaves. J. Exp. Bot. 2014, 65, 6385–6397. [Google Scholar] [CrossRef] [Green Version]
  64. Cosgrove, D.J. Expansive growth of plant cell walls. Plant Physiol. Bioch. 2000, 38, 109–124. [Google Scholar] [CrossRef]
  65. Li, M.; Xiong, G.; Li, R.; Cui, J.; Tang, D.; Zhang, B.; Pauly, M.; Cheng, Z.; Zhou, Y. Rice cellulose synthase-like D4 is essential for normal cell-wall biosynthesis and plant growth. Plant J. 2009, 60, 1055–1069. [Google Scholar] [CrossRef]
  66. Cosgrove, D.J.; Jarvis, M.C. Comparative structure and biomechanics of plant primary and secondary cell walls. Front. Plant Sci. 2012, 3, 204. [Google Scholar] [CrossRef] [Green Version]
  67. Hamant, O.; Traas, J. The mechanics behind plant development. New Phytol. 2010, 185, 369–385. [Google Scholar] [CrossRef]
  68. Yamaguchi, S. Gibberellin metabolism and its regulation. Annu. Rev. Plant Biol. 2008, 59, 225–251. [Google Scholar] [CrossRef] [PubMed]
  69. Majda, M.; Robert, S. The role of auxin in cell wall expansion. Int. J. Mol. Sci. 2018, 19, 951. [Google Scholar] [CrossRef] [PubMed] [Green Version]
  70. Vanneste, S.; Friml, J. Auxin: A trigger for change in plant development. Cell 2009, 136, 1005–1016. [Google Scholar] [CrossRef] [PubMed]
  71. Springer, N.M. Isolation of plant DNA for PCR and genotyping using organic extraction and CTAB. Cold Spring Harb. Protoc. 2010, 11, 1128–1129. [Google Scholar] [CrossRef]
  72. Guo, Z.; Wang, H.; Tao, J.; Ren, Y.; Xu, C.; Wu, K.; Zou, C.; Zhang, J.; Xu, Y. Development of multiple SNP marker panels affordable to breeders through genotyping by target sequencing (GBTS) in maize. Mol. Breed. 2019, 39, 37. [Google Scholar] [CrossRef]
  73. Abe, A.; Kosugi, S.; Yoshida, K.; Natsume, S.; Takagi, H.; Kanzaki, H.; Matsumura, H.; Yoshida, K.; Mitsuoka, C.; Tamiru, M.; et al. Genome sequencing reveals agronomically important loci in rice using MutMap. Nat. Biotechnol. 2012, 30, 174–178. [Google Scholar] [CrossRef] [Green Version]
  74. Alamin, M.; Zeng, D.D.; Sultana, M.H.; Qin, R.; Jin, X.L.; Shi, C.H. Rice SDSFL1 plays a critical role in the regulation of plant structure through the control of different phytohormones and altered cell structure. J. Plant Physiol. 2018, 231, 110–123. [Google Scholar] [CrossRef]
  75. Willems, E.; Leyns, L.; Vandesompele, J. Standardization of real-time PCR gene expression data from independent biological replicates. Anal. Biochem. 2008, 379, 127–129. [Google Scholar] [CrossRef]
Figure 1. Gross morphology of WT and the dnl2 mutant. (A) dnl2 and the wild-type at tasseling stage. Bar = 20 cm. (B) The leaf of dnl2 and the wild-type. Bar = 10 cm. (C) The tassel of dnl2 and the wild-type. Bar = 5 cm. (D,E) The ear of dnl2 and the wild-type. Bar = 5 cm. (F) Plant height, ear height, and tassel length of dnl2 and the wild-type. PH: plant height. EH: ear height. TL: tassel length. (G) Measurement of the length and width of the first leaf below the uppermost ear, the leaf of the ear, and the three leaves above the ear. ELL-1, ELW-1: the length and width of the first leaf below the ear. ELL, ELW: the length and width of the leaf at the ear. ELL + 1, ELW + 1: length and width of the first leaf above the ear. (H) Tassel branch number. Data are means ± SD, asterisks indicate significant differences between dnl2 and the wild-type (** p < 0.01).
Ijms 23 00795 g001
Figure 2. Comparison of the length of the internodes of dnl2 and the wild-type. (A) Internodes of dnl2 and the wild-type, bar = 10 cm; (B) Comparison of internodes length between dnl2 and the wild-type.
Ijms 23 00795 g002
Figure 3. Transverse sections of the seventh internodes at the V15 stage from dnl2 and the wild-type. (A,B) Transverse view of the vascular bundles and sclerenchyma cells of dnl2 and the wild-type. (C) The area of the vascular bundles of dnl2 and the wild-type. (D) The diameter of the parenchymal cells of dnl2 and the wild-type. Orange arrowheads indicate vascular bundles and green arrowheads indicate parenchymal cells. Asterisks indicate significant differences between dnl2 and the wild-type (** p < 0.01). Bars = 150 μm.
Ijms 23 00795 g003
Figure 4. Longitudinal section of the seventh internodes at the V15 stage from dnl2 and the wild-type. (A,B) Longitudinal view of the parenchymal cells of dnl2 and the wild-type. (C) Length and width of the parenchymal cells. (D) Number of cells in visual field of dnl2 and the wild-type. The blue box indicates a single parenchymal cell. Asterisks indicate significant differences between dnl2 and the wild-type (** p < 0.01). Bars = 500 μm.
Ijms 23 00795 g004
Figure 5. Comparison of the transverse sections of the leaves of dnl2 and the wild-type at the mature stage. (A,B) Anatomical analysis of the transverse sections of dnl2 and the wild-type leaves by microscope. Bar = 500 μm. LV: large vein; SV: small vein. (C) Transverse sections of the leaves of dnl2 and the wild-type. Bar = 1 cm. (D) Large vein number of dnl2 and the wild-type. (E) Small vein number of dnl2 and the wild-type. (F) Leaf width of dnl2 and the wild-type. Asterisks indicate significant differences between dnl2 and the wild-type (** p < 0.01).
Ijms 23 00795 g005
Figure 6. Phloroglucinol staining of lignin in the internodes and leaves. Lignin staining of the seventh internode of the wild-type (A) and dnl2 (B) at the V15 stage. Lignin staining of the 15th leaf of the wild-type (C) and dnl2 (D) at the V15 stage. Black arrowheads indicate vascular bundles. The black box indicates the sclerenchyma tissue. Bars = 200 μm.
Ijms 23 00795 g006
Figure 7. Measurement of endogenous hormones in dnl2 and the wild-type seventh internode and 15th leaf at the V15 stage. (A) Measurement of IAA content. (B) Measurement of GA content. (C) Measurement of ABA content. Asterisks indicate significant differences between dnl2 and the wild-type (** p < 0.01).
Ijms 23 00795 g007
Figure 8. The whole-genome distribution of the SNP-index.
Ijms 23 00795 g008
Figure 9. Differentially expressed genes between dnl2 and the wild-type.
Ijms 23 00795 g009
Figure 10. Quantitative RT-PCR validation of differentially expressed genes identified by RNA-seq. (A) Comparison of the relative expression between the qRT-PCR and RNA-seq results. (B) Correlation coefficient between the qRT-PCR results and RNA-seq results. R2 = 0.96.
Ijms 23 00795 g010
Figure 11. The significantly enriched GO terms of the up-regulated and down-regulated DEGs between dnl2 and the wild-type. (A) The enriched BP, MF, and CC terms of the up-regulated DEGs. (B) The enriched BP, MF, and CC terms of the down-regulated DEGs.
Ijms 23 00795 g011
Figure 12. Enriched Kyoto encyclopedia of genes and genomes (KEGG) pathway enrichment of DEGs between dnl2 and the wild-type. Enriched KEGG pathways of up-regulated DEGs (A) and down-regulated DEGs (B) in dnl2 compared with the wild-type. The point size represents the number of genes in the pathway; the color depth indicates the q-value.
Ijms 23 00795 g012
Figure 13. DEGs involved in phytohormone biosynthesis and signaling. (A) DEGs involved in auxin biosynthesis and signaling. (B) DEGs involved in gibberellin synthesis and signaling. On the log2 scale, dark blue and dark red colors represent lower and higher expression, respectively.
Ijms 23 00795 g013
Figure 14. Heatmap of cell wall related DEGs. (A) Heatmap of DEGs involved in cellulose synthesis of the secondary cell wall. (B) Heatmap of DEGs participated in xylan synthesis. (C) Heatmap of DEGs participated in lignin synthesis.
Ijms 23 00795 g014
Publisher’s Note: MDPI stays neutral with regard to jurisdictional claims in published maps and institutional affiliations.

