
The CAR–mRNA Interaction Surface Is a Zipper Extension of the Ribosome A Site

 , , , , and
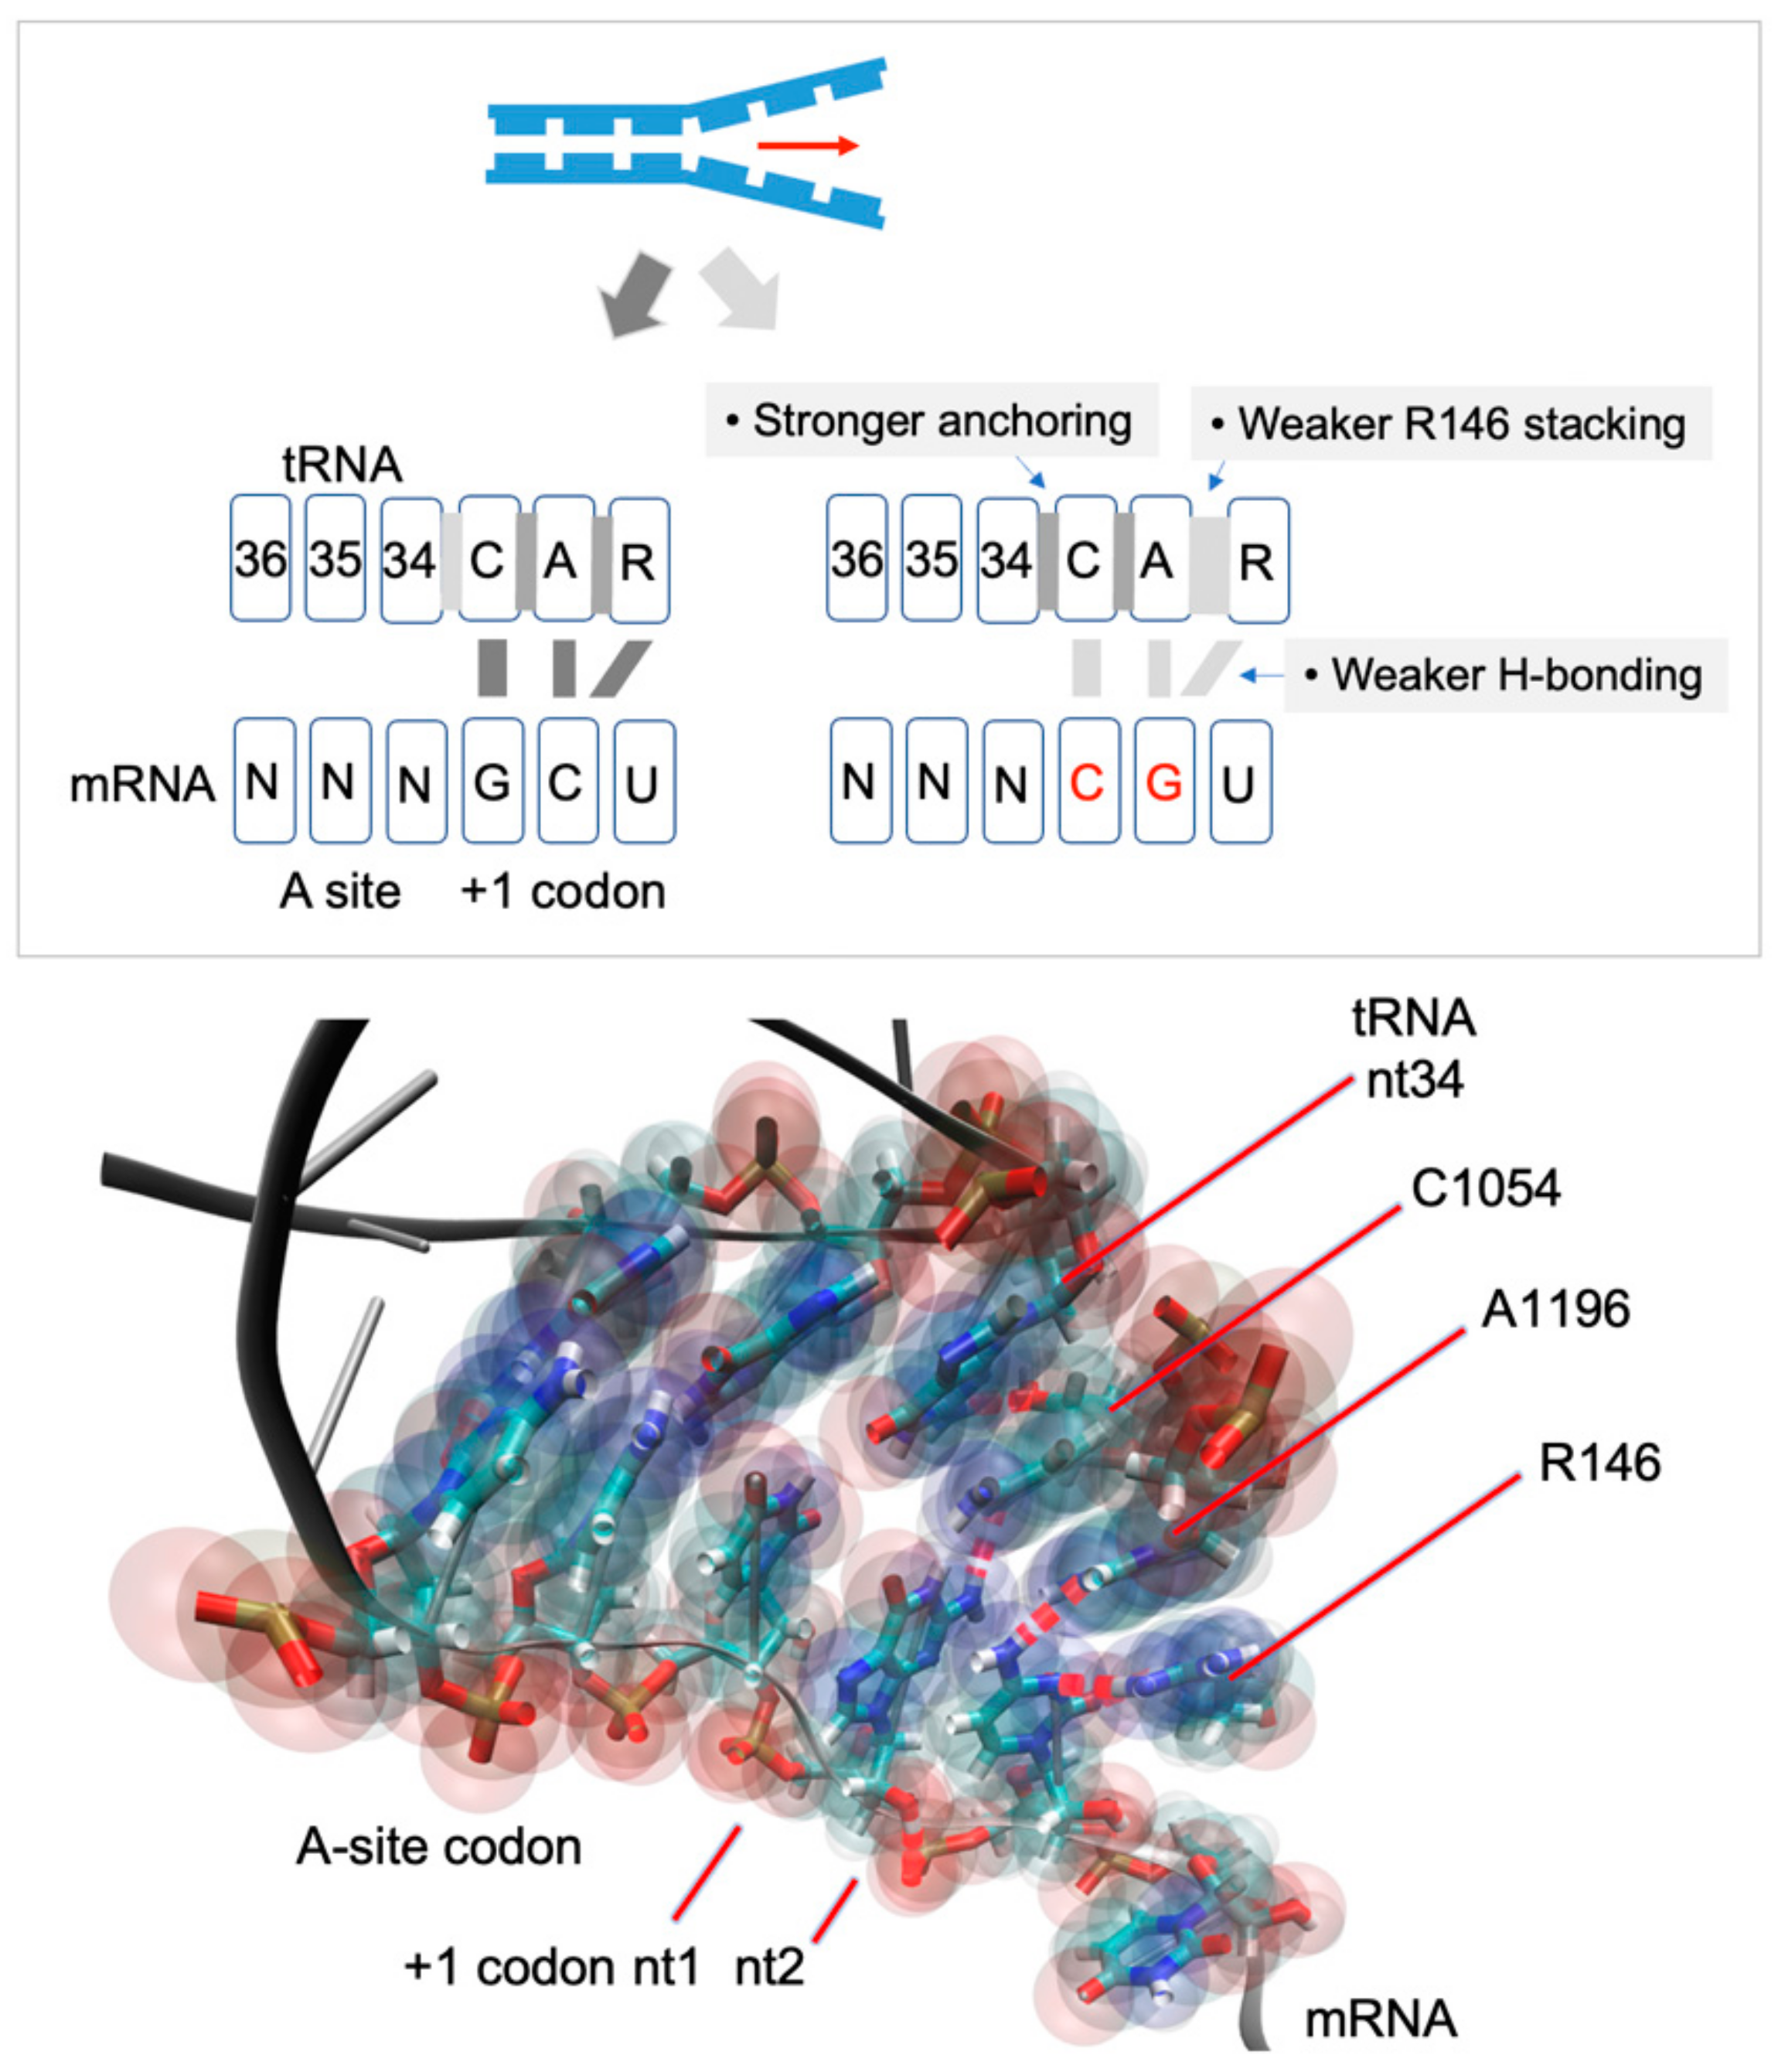
Abstract
:1. Introduction
2. Results and Discussion
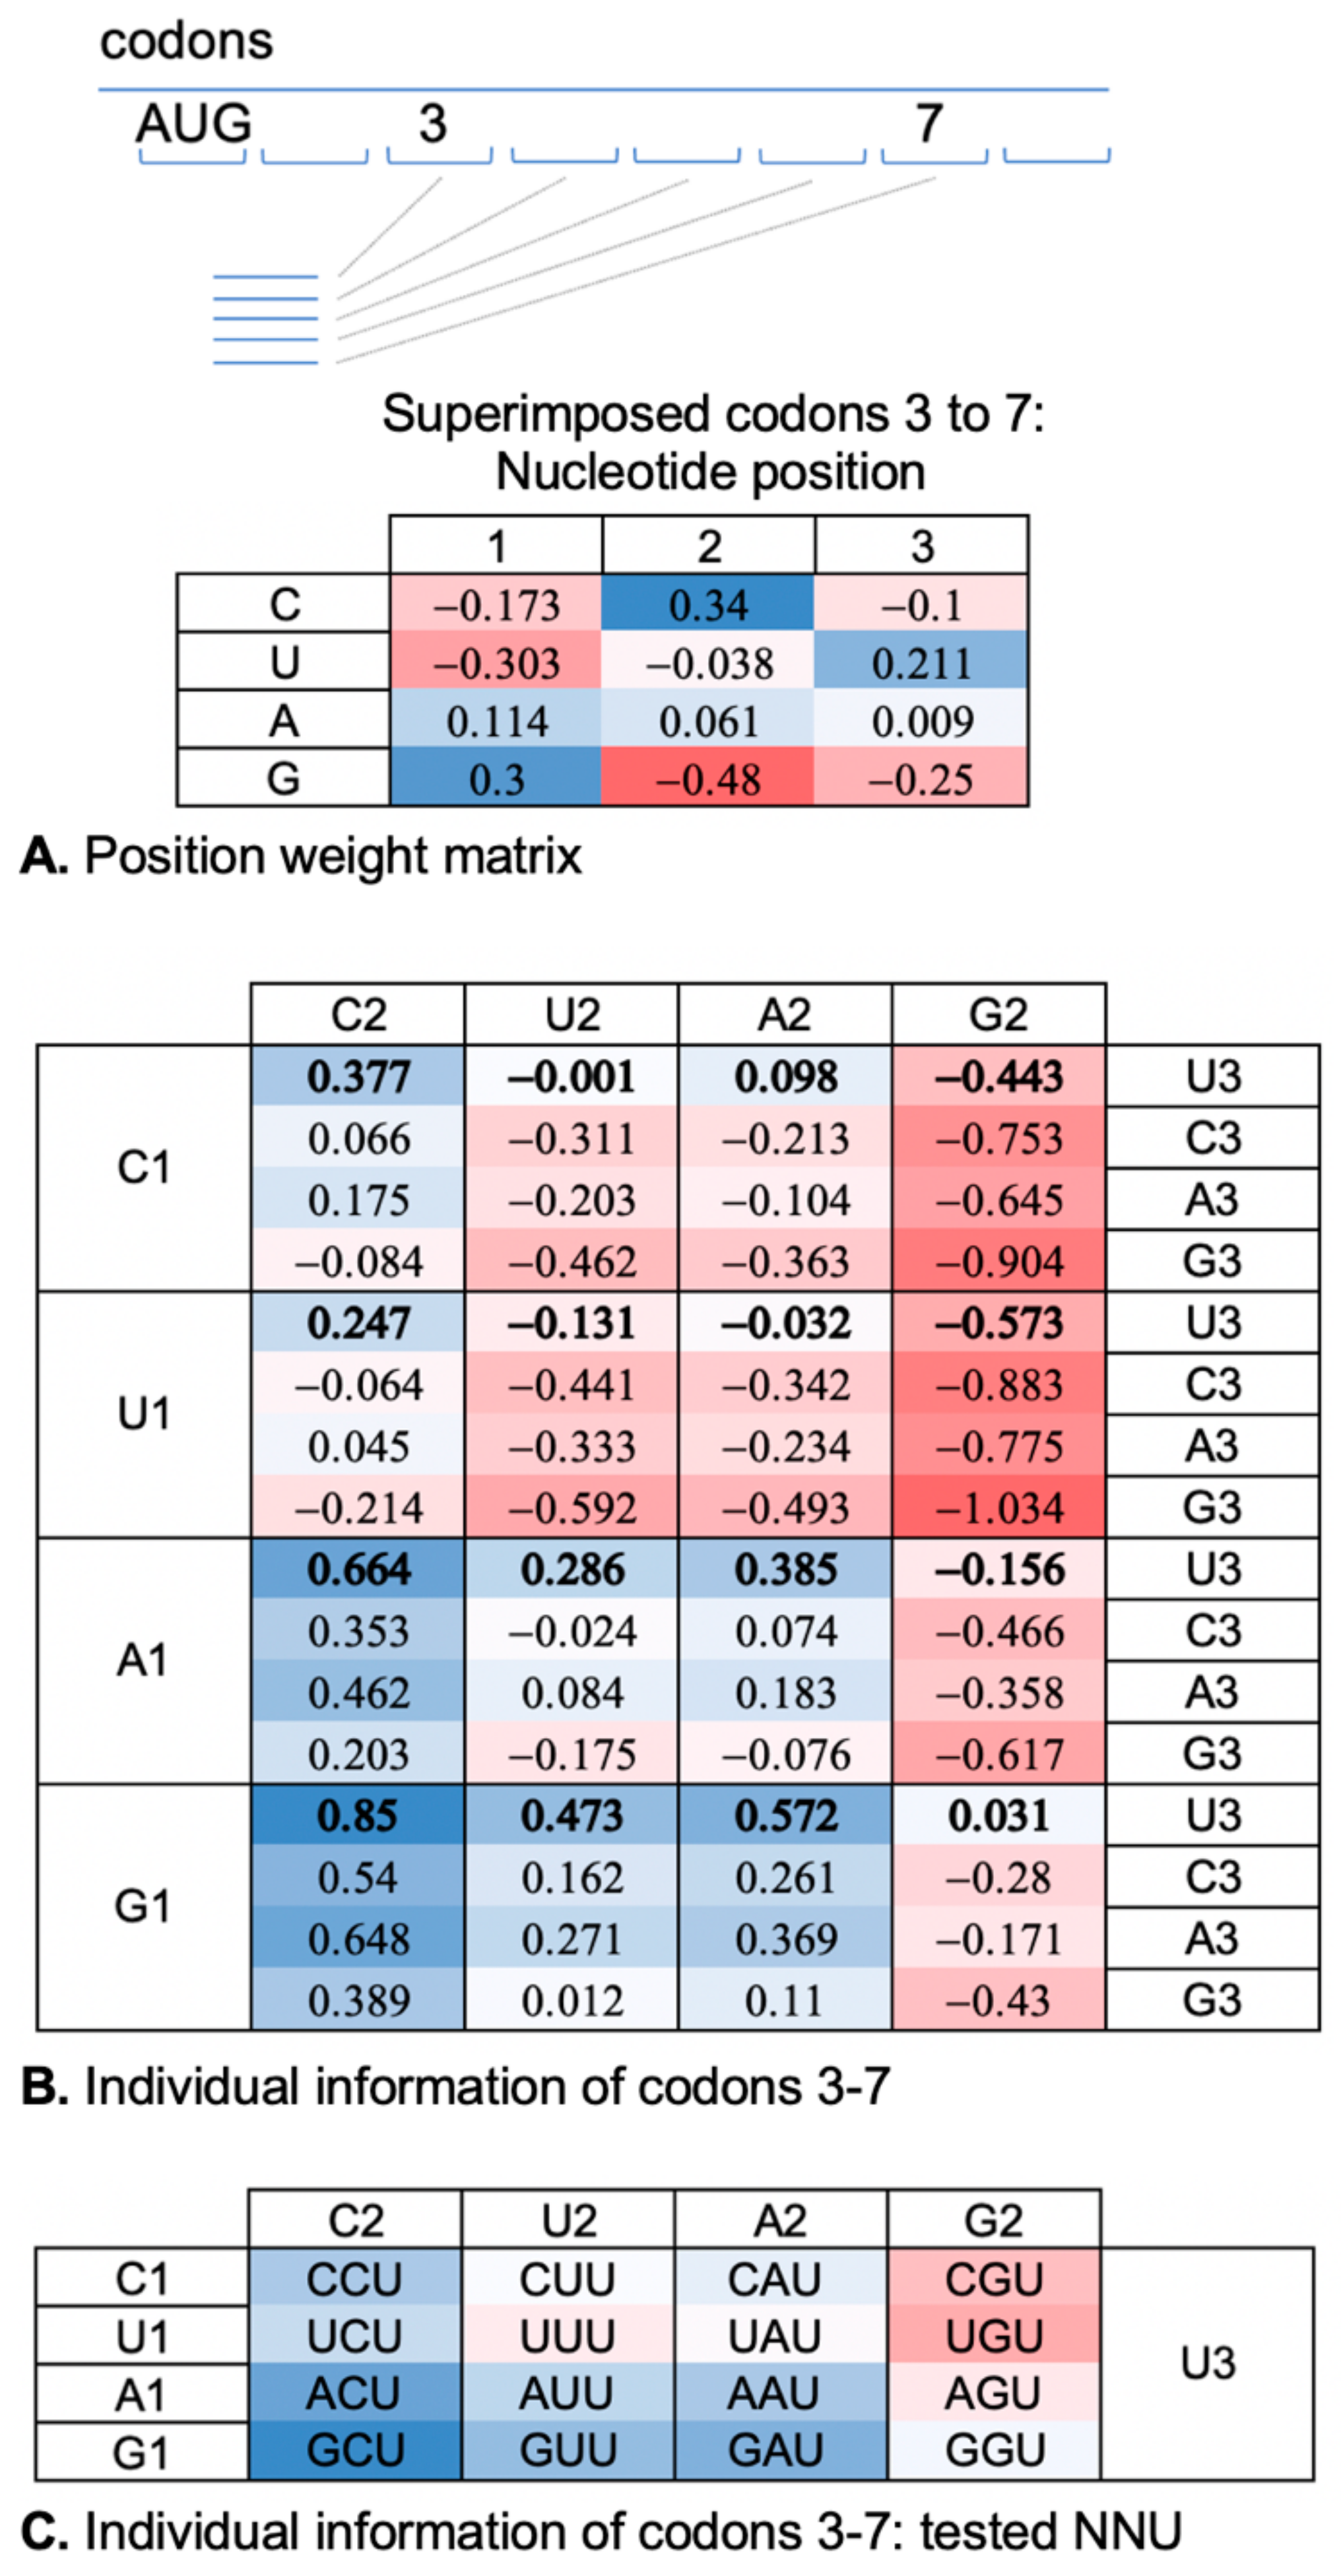
2.1. A Ramp Codon Position Weight Matrix Reveals Nucleotide Selection Preferences
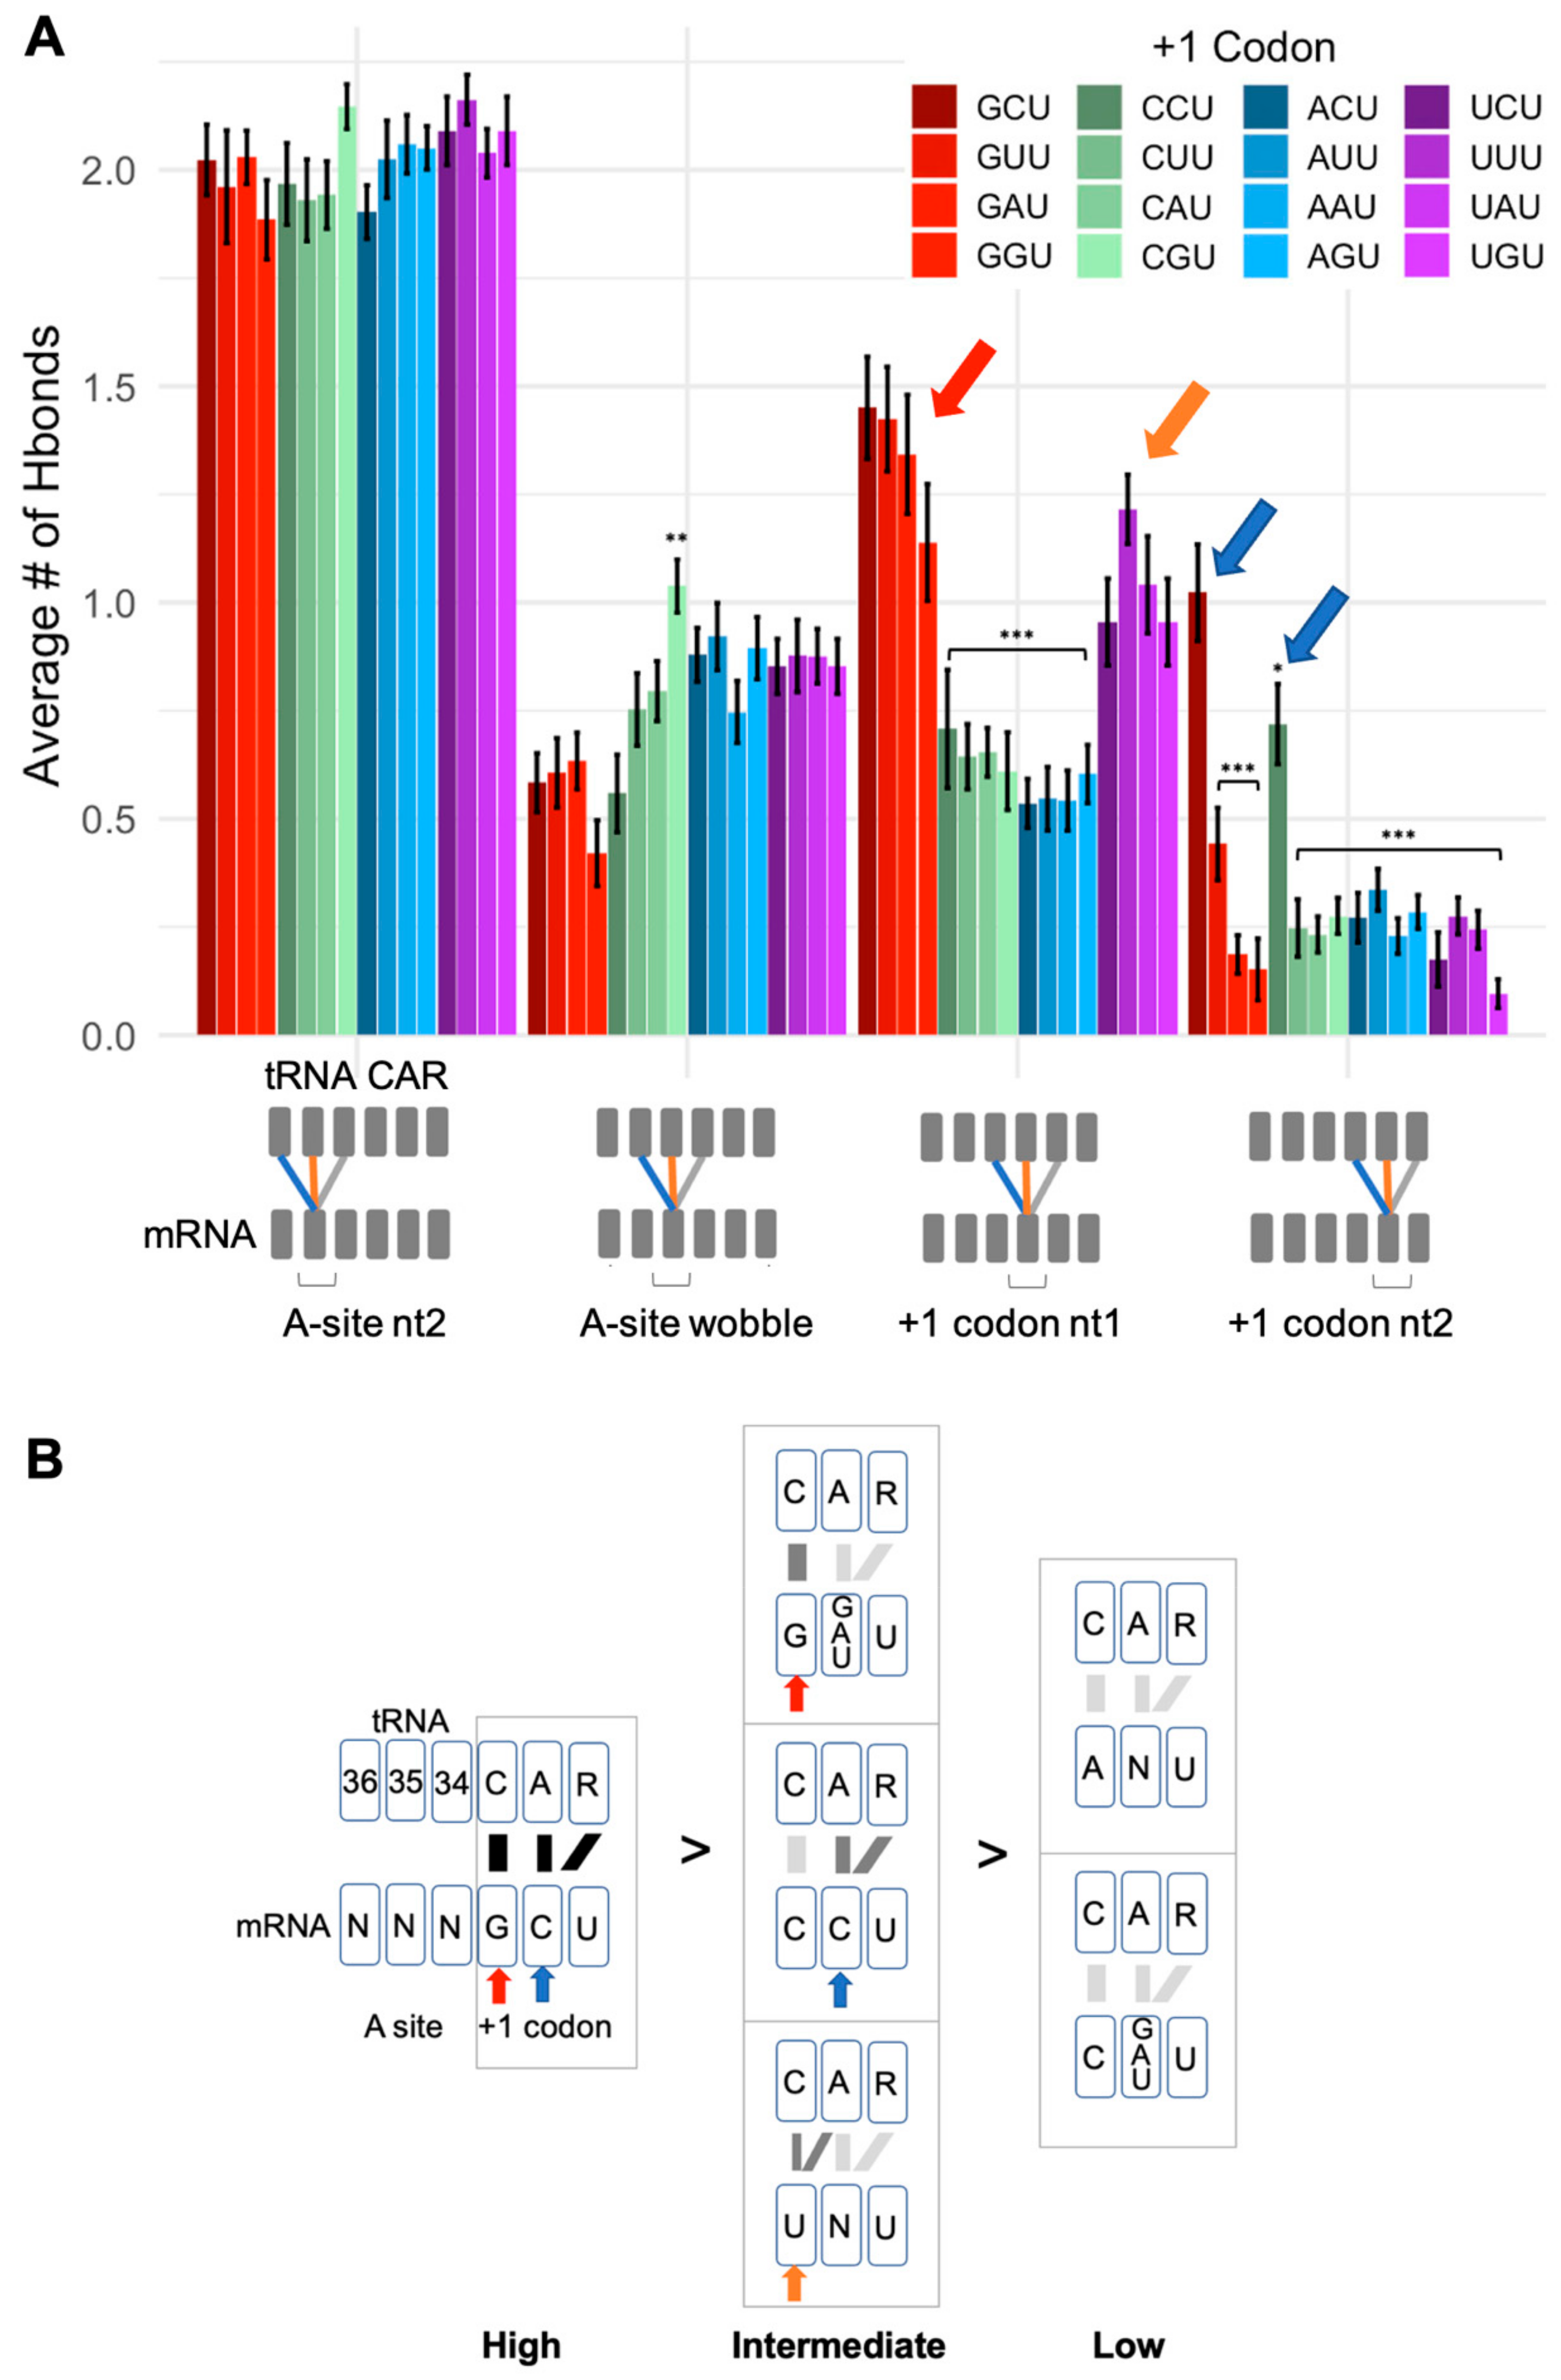
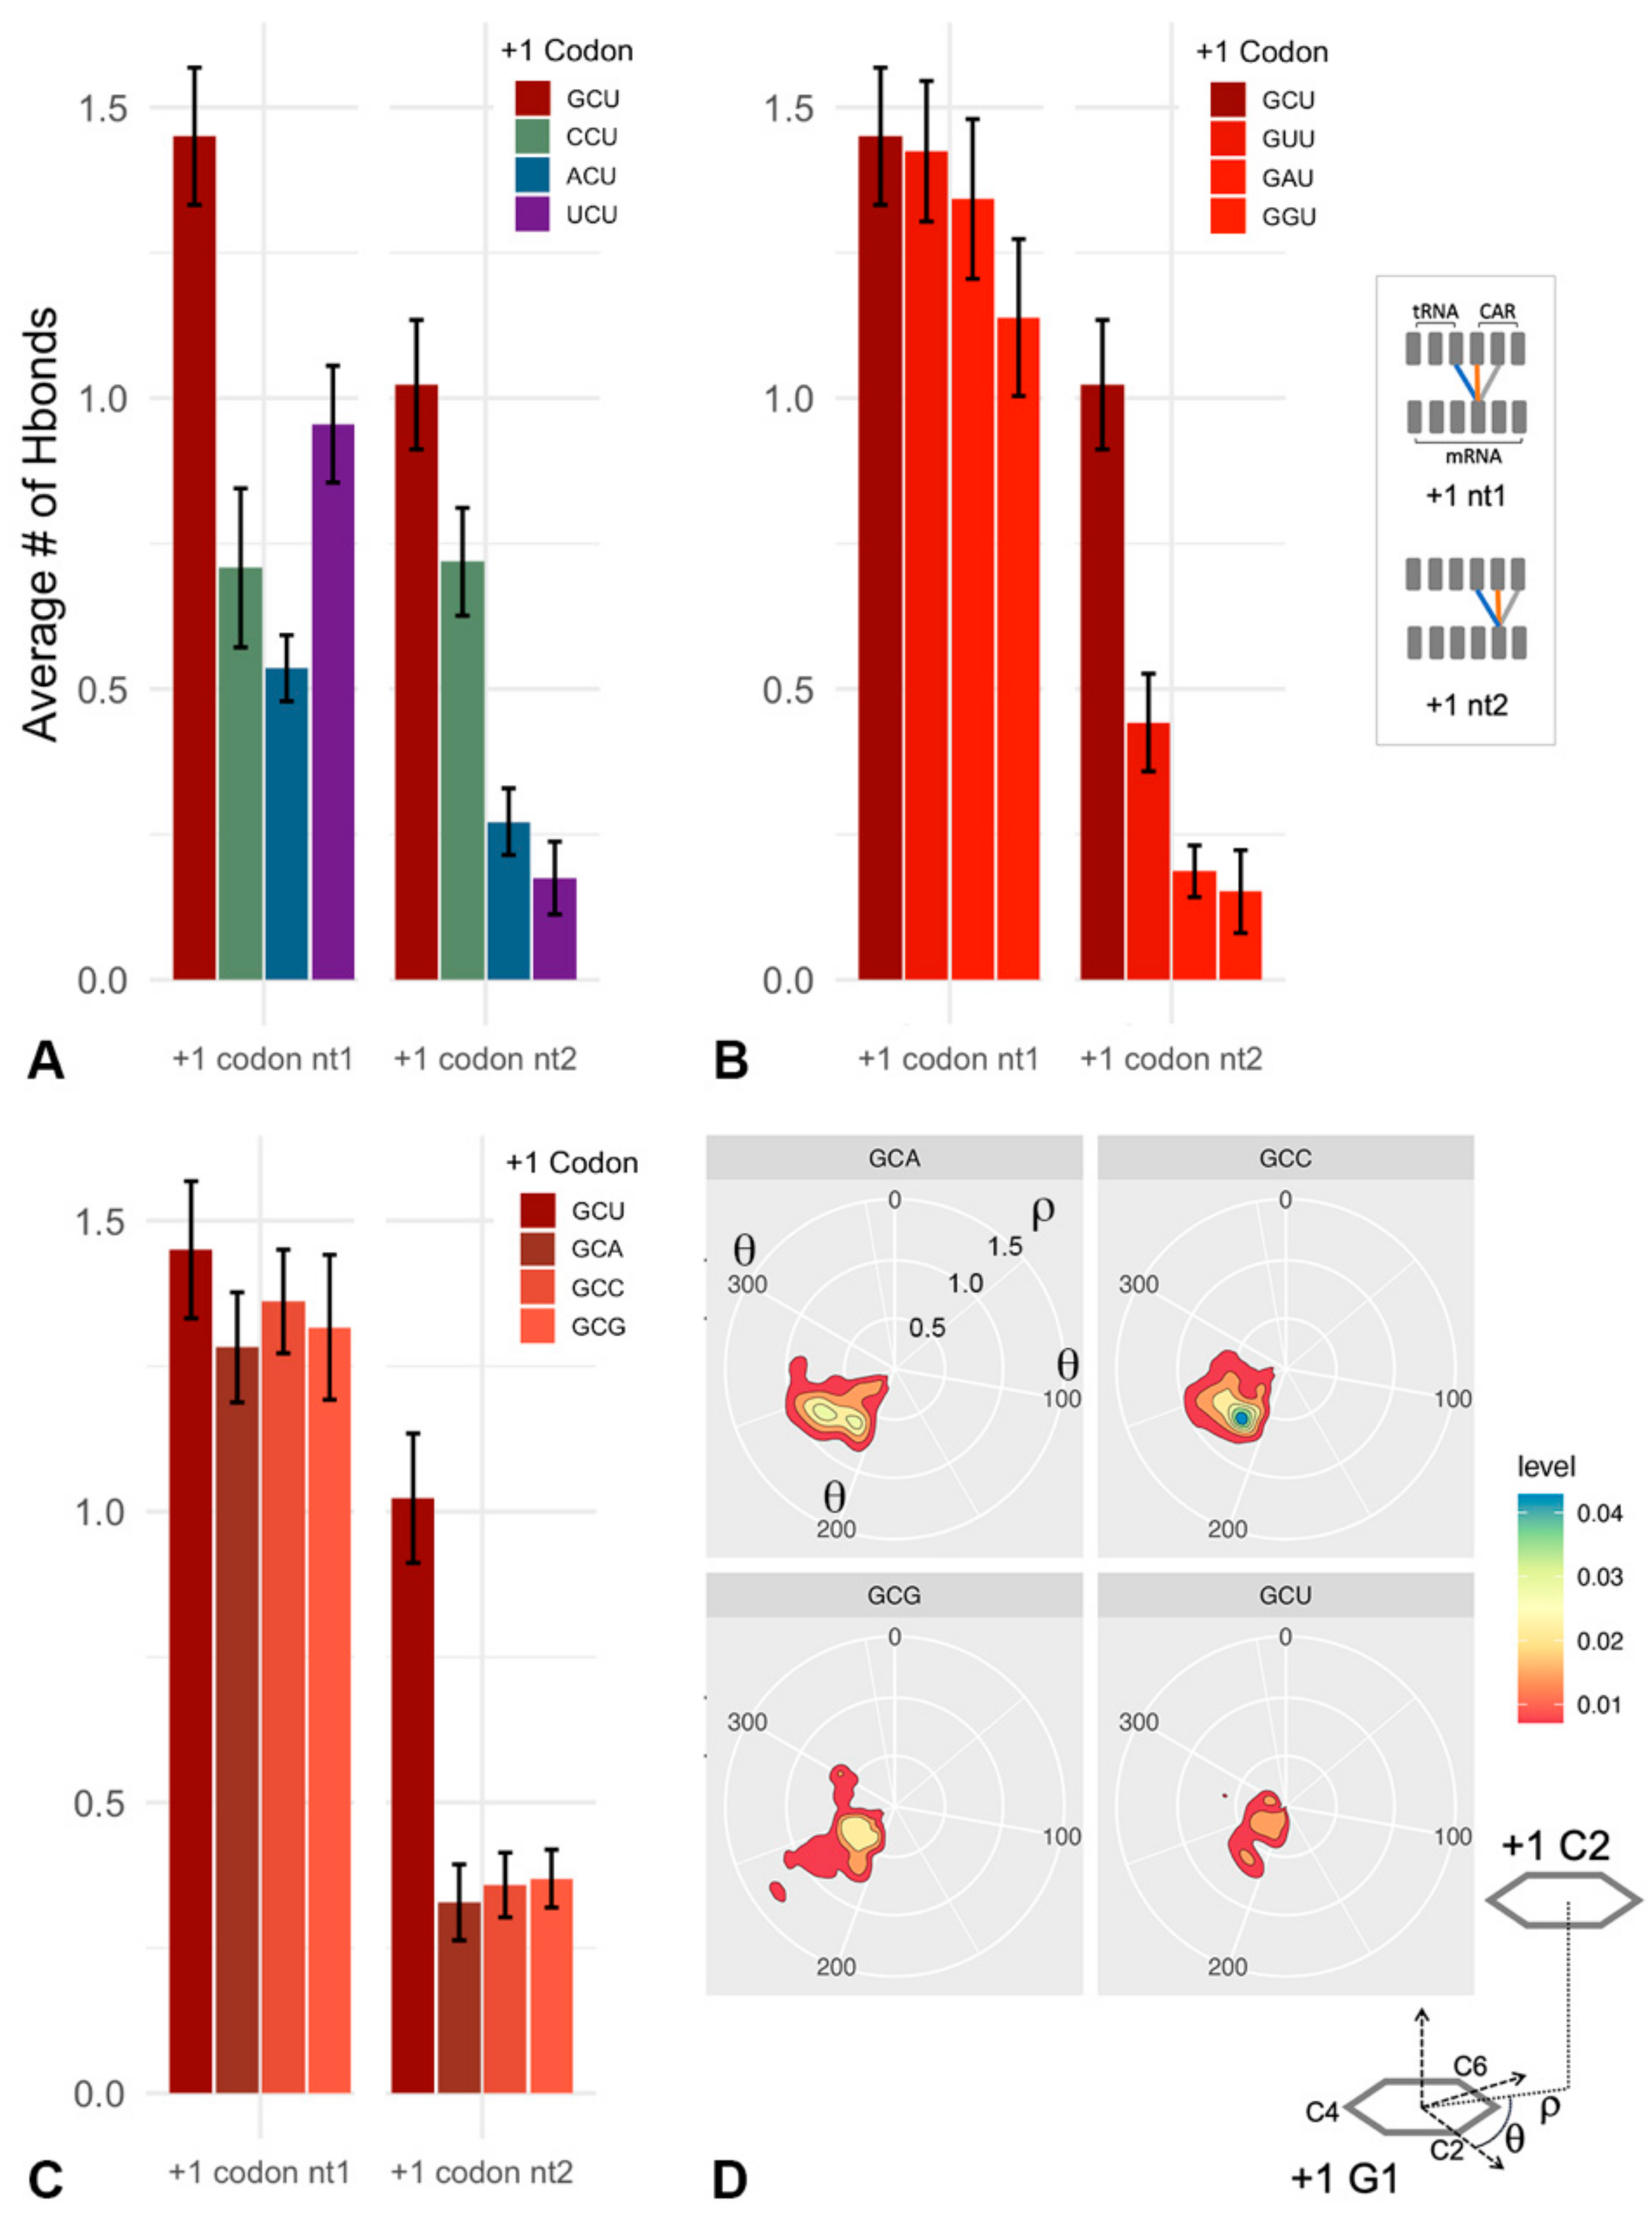
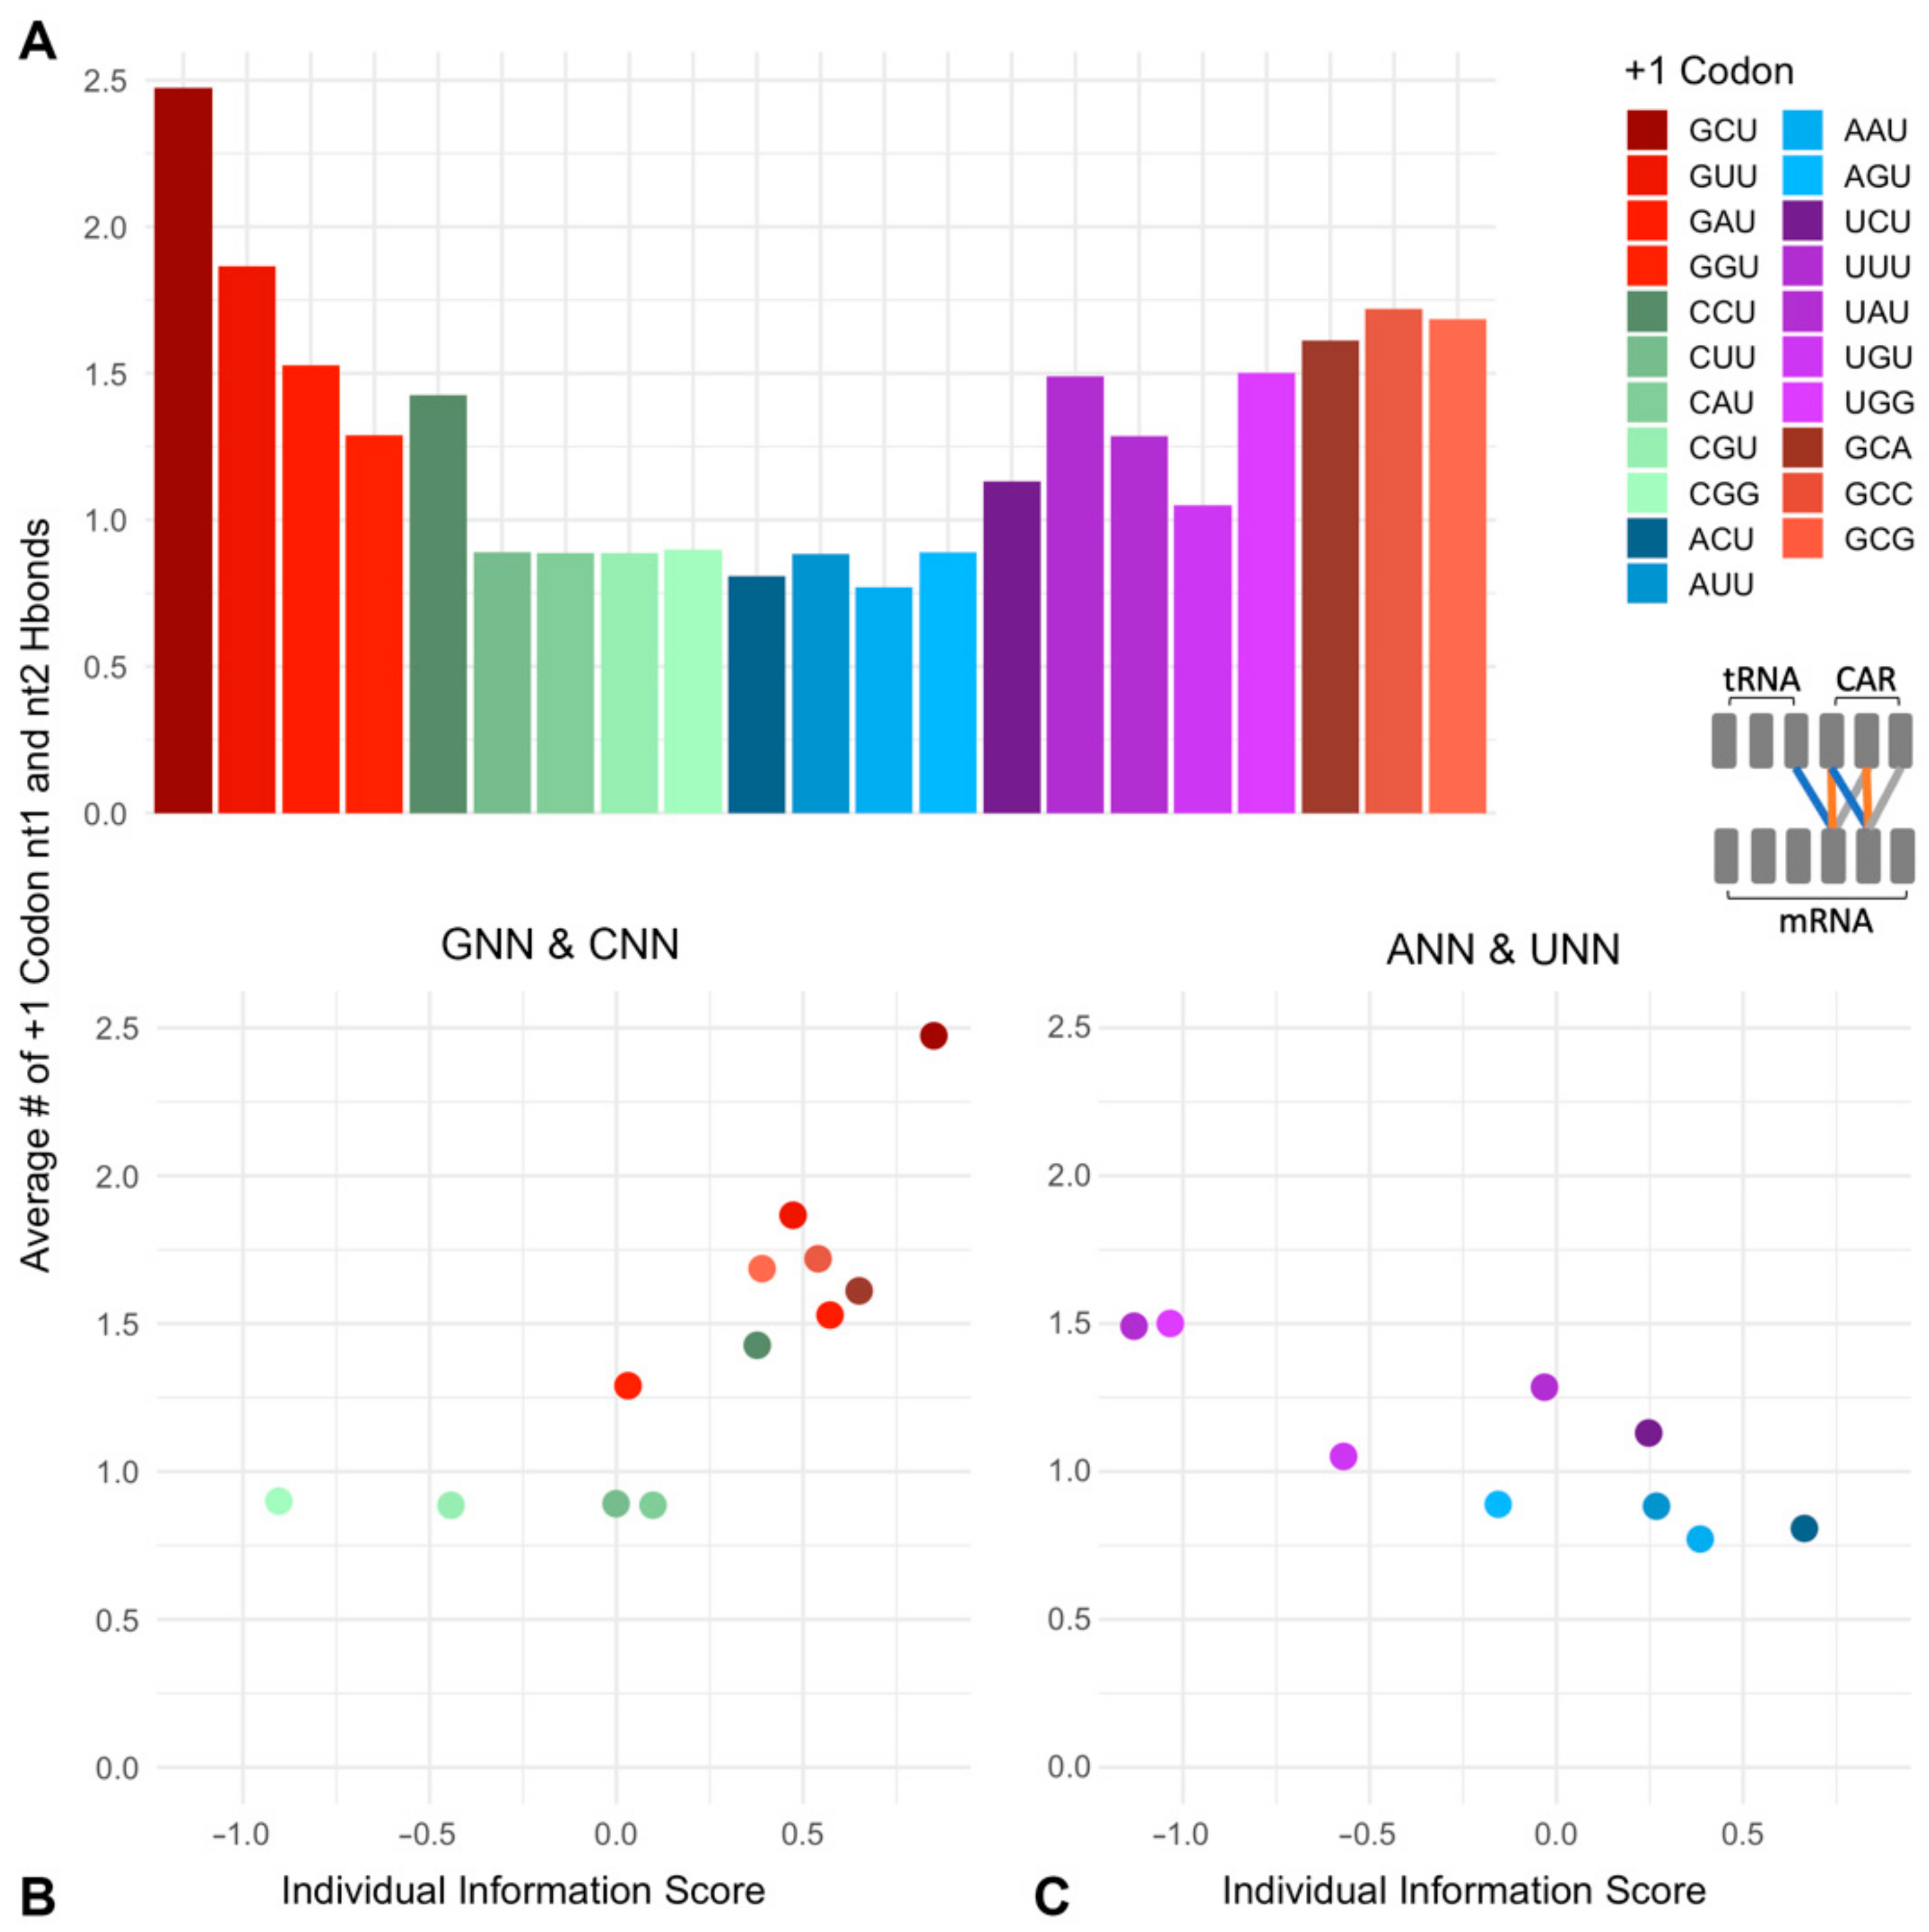
2.2. CAR–mRNA H-Bonding Is Sequence Dependent
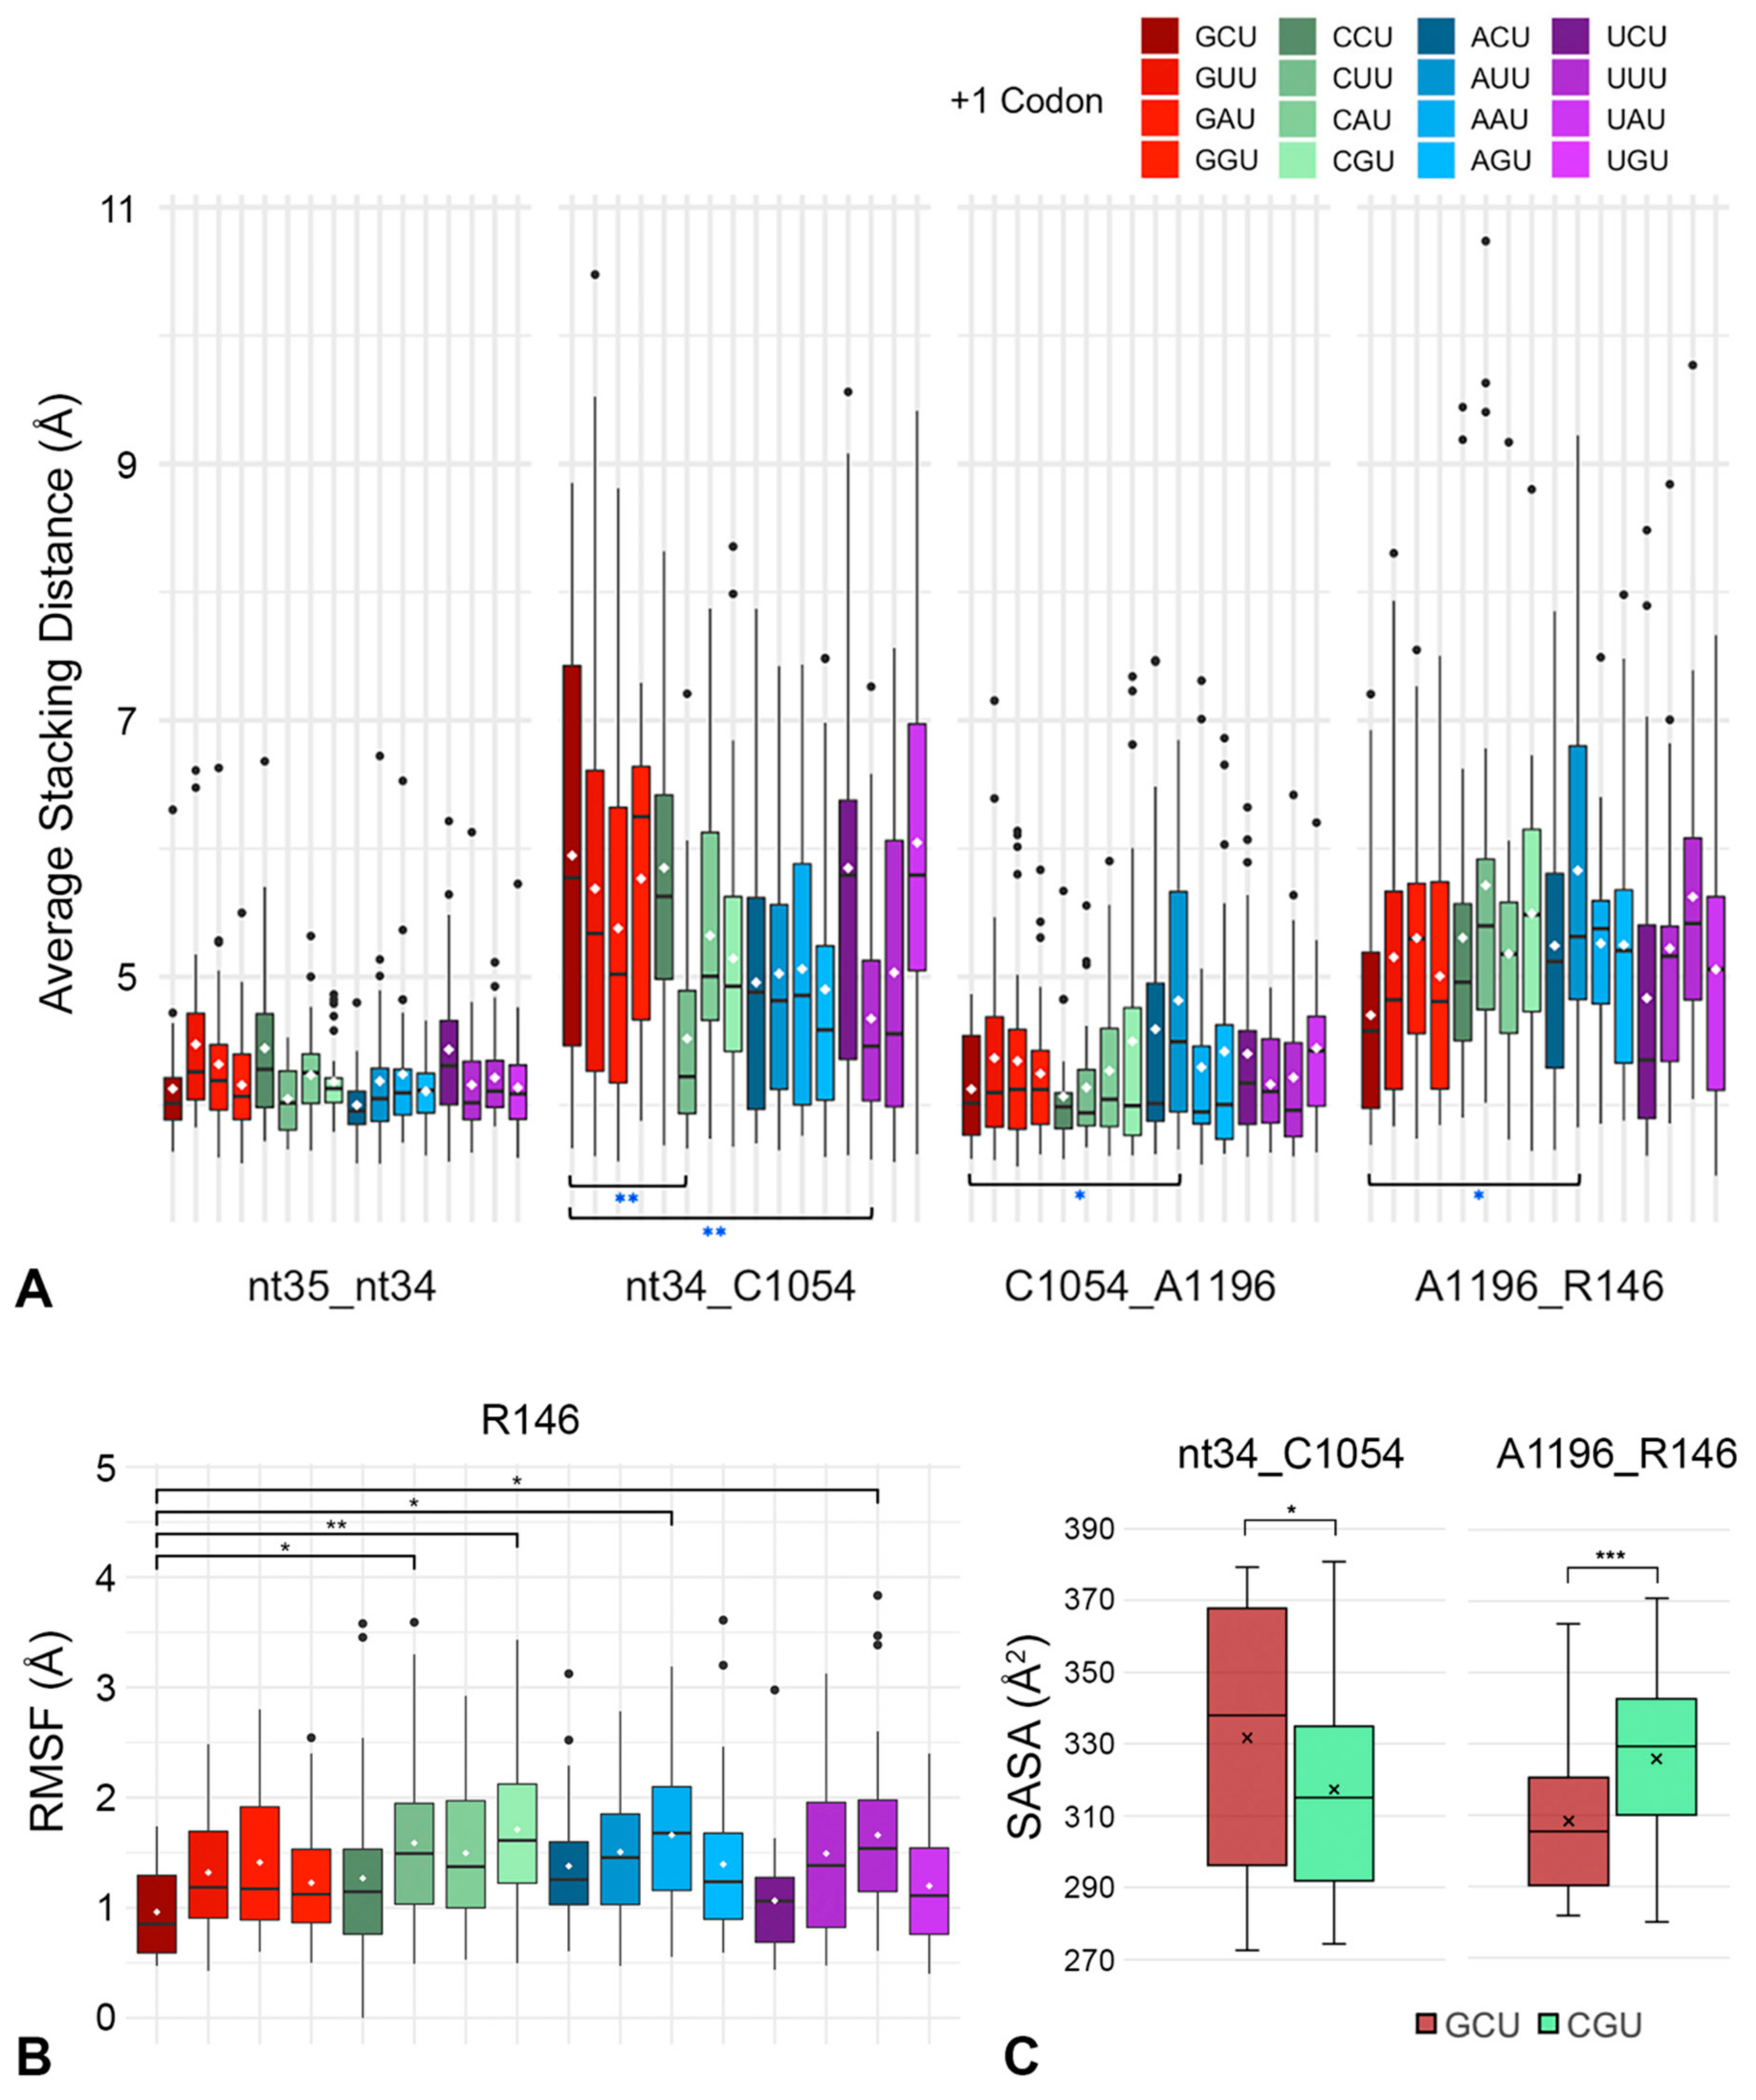
2.3. CAR Behaves as an Extension of the A-Site Anticodon
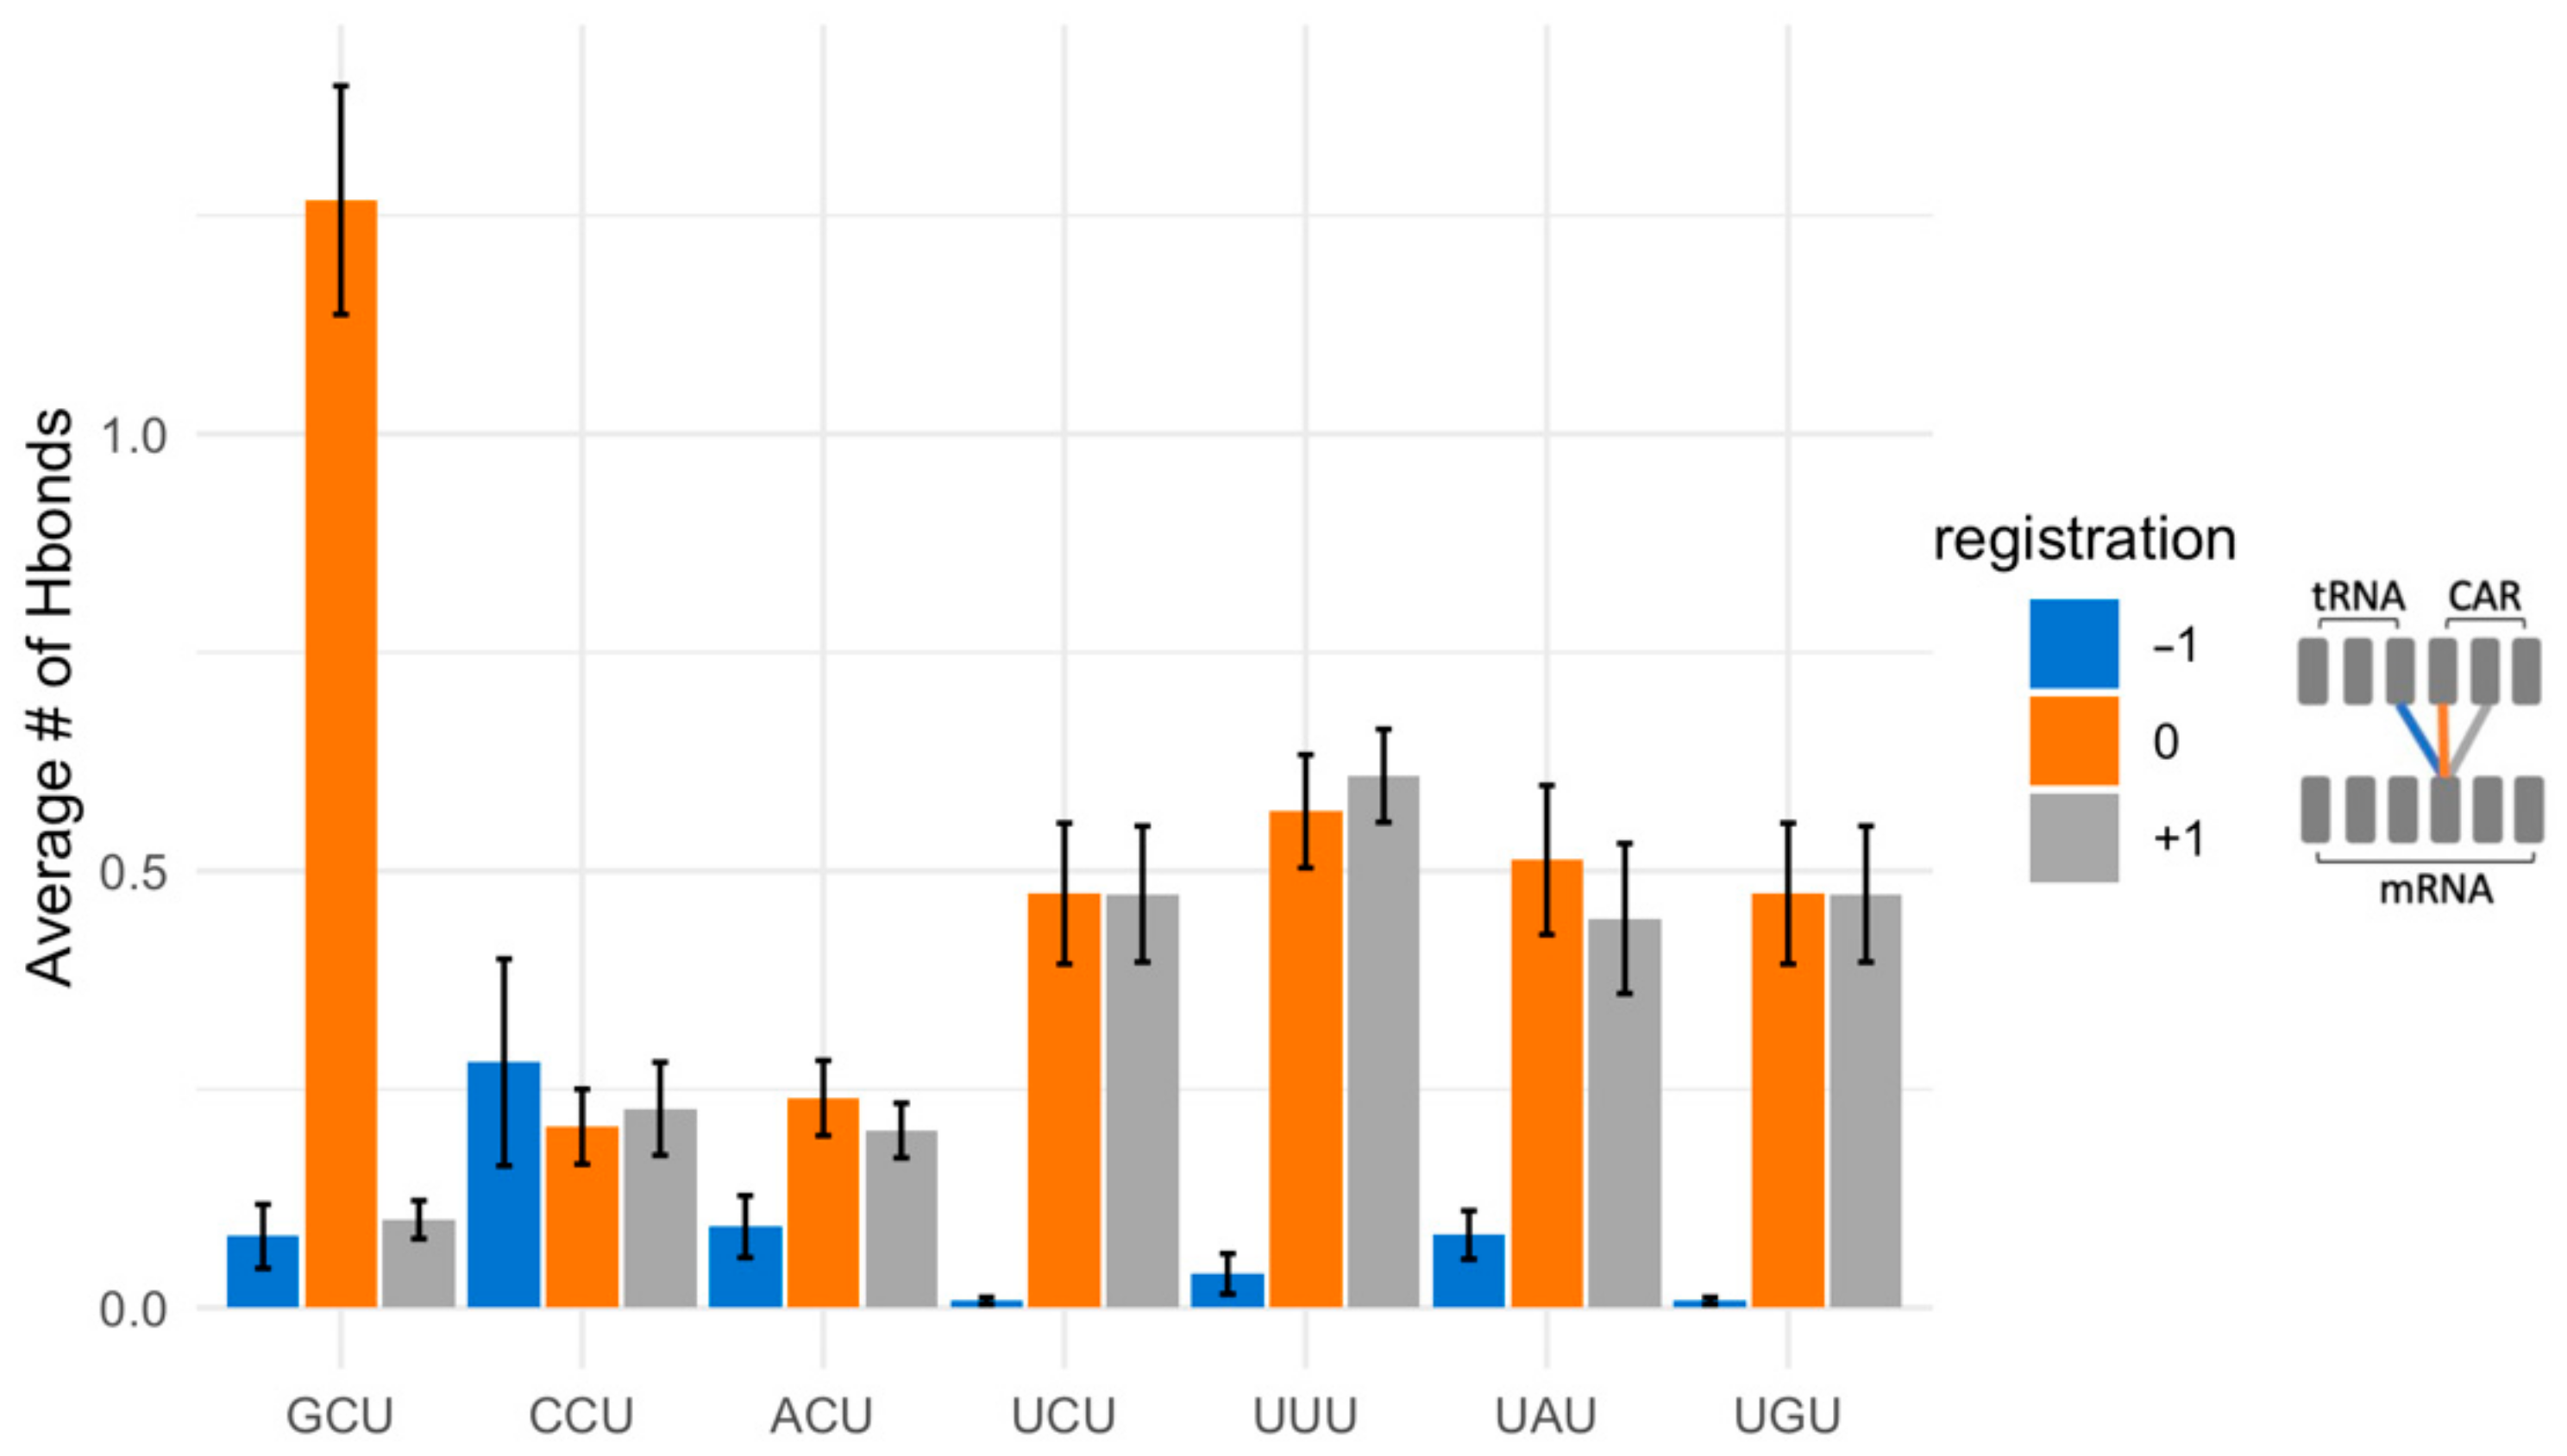
2.4. The mRNA Interactions Modulate CAR Integrity and Anchoring
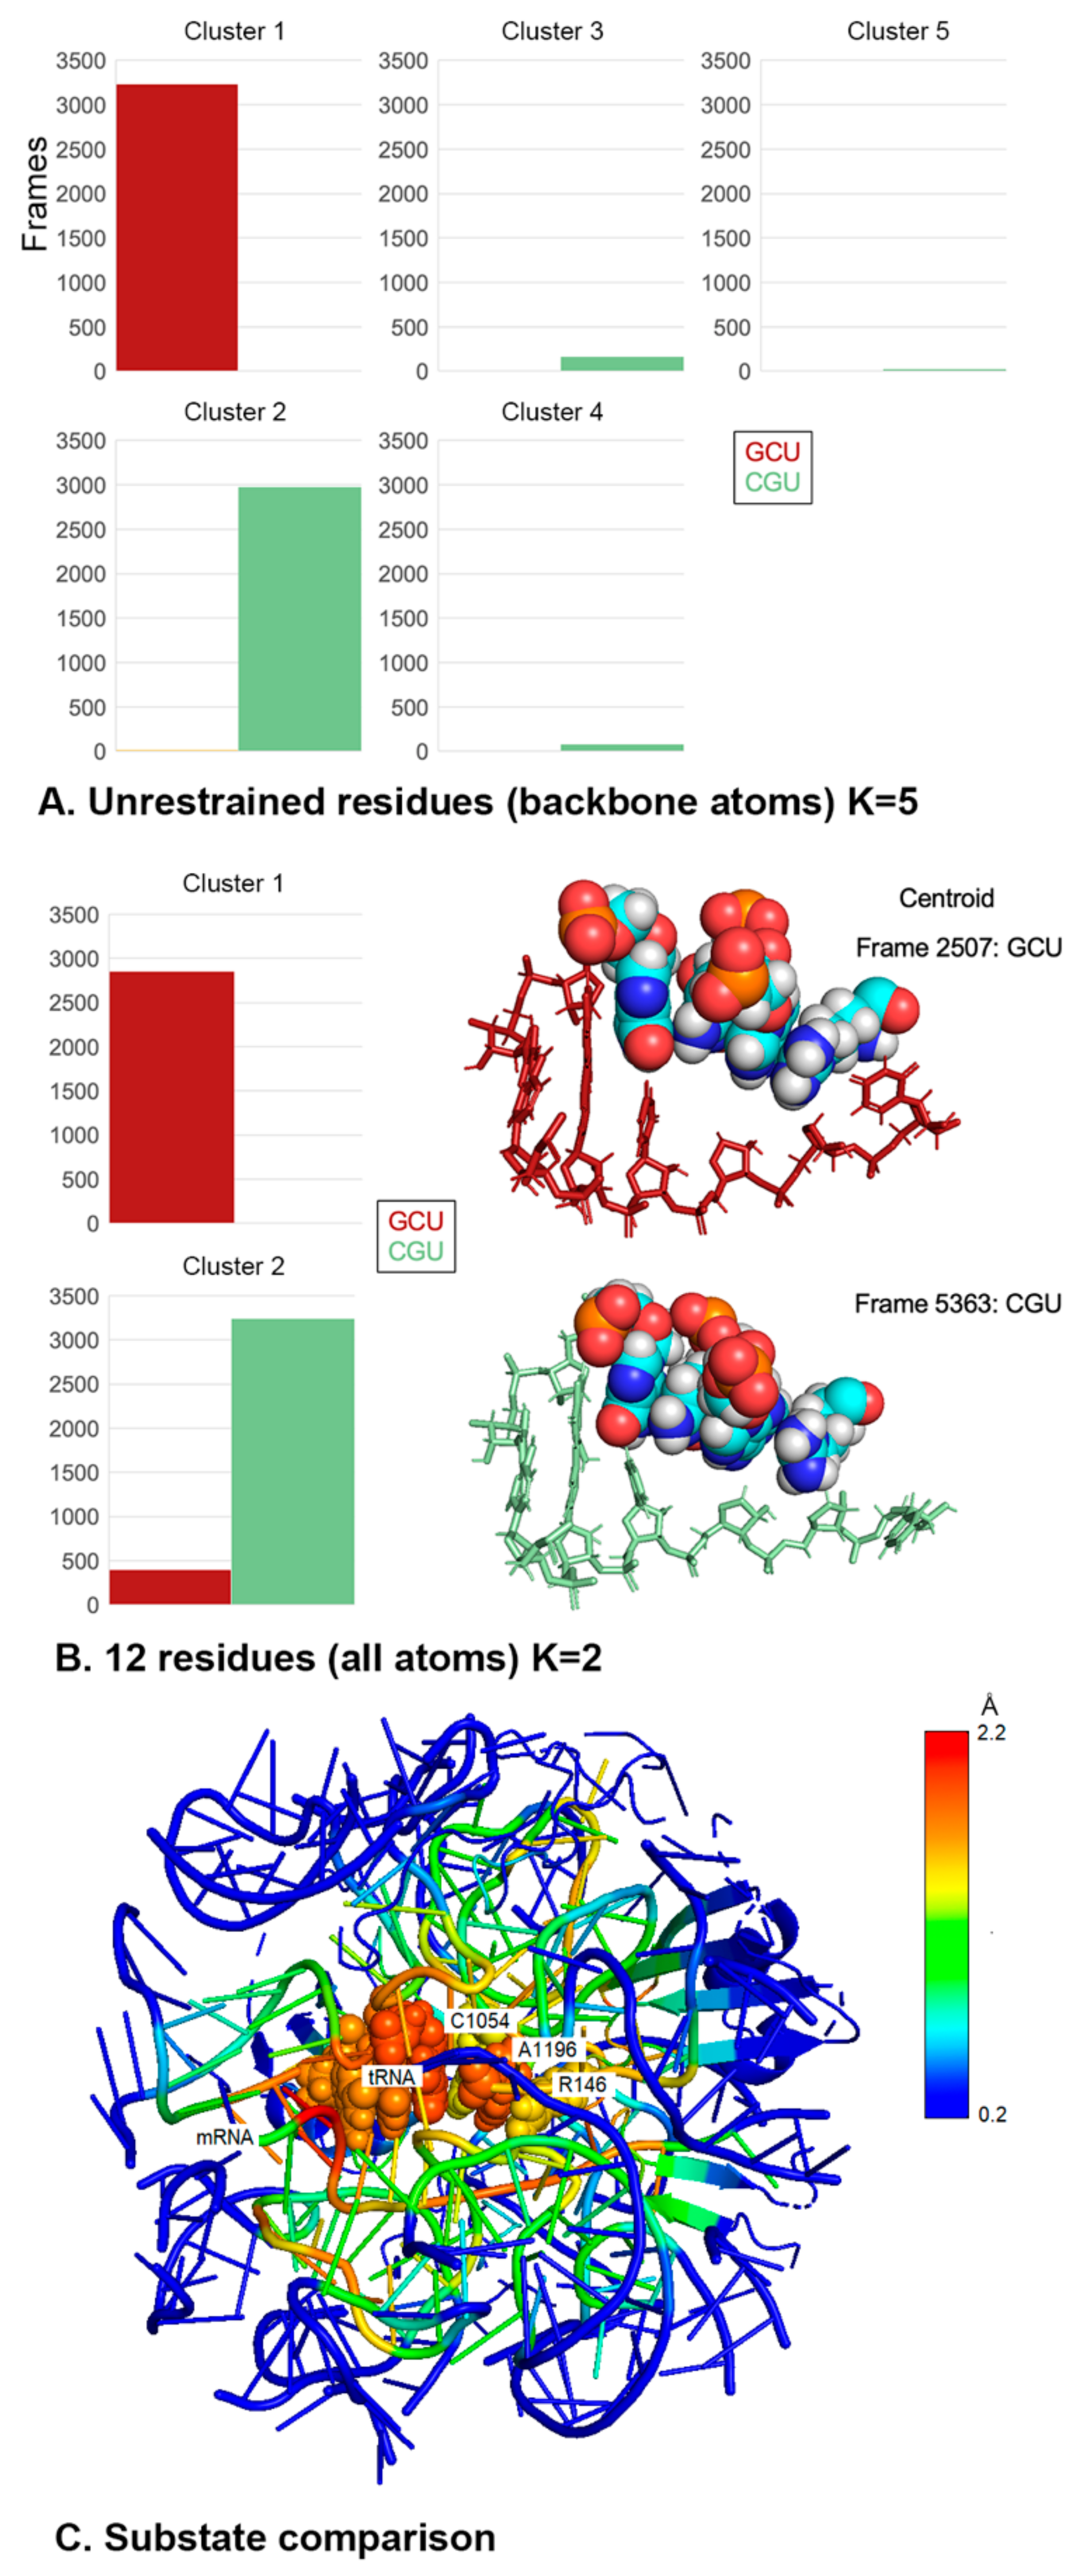
2.5. Different +1 Codons Exhibit Different Substates of the Decoding Center
3. Conclusions
4. Materials and Methods
4.1. Information Theoretic Analysis of Codons
4.2. Molecular Dynamic Analysis
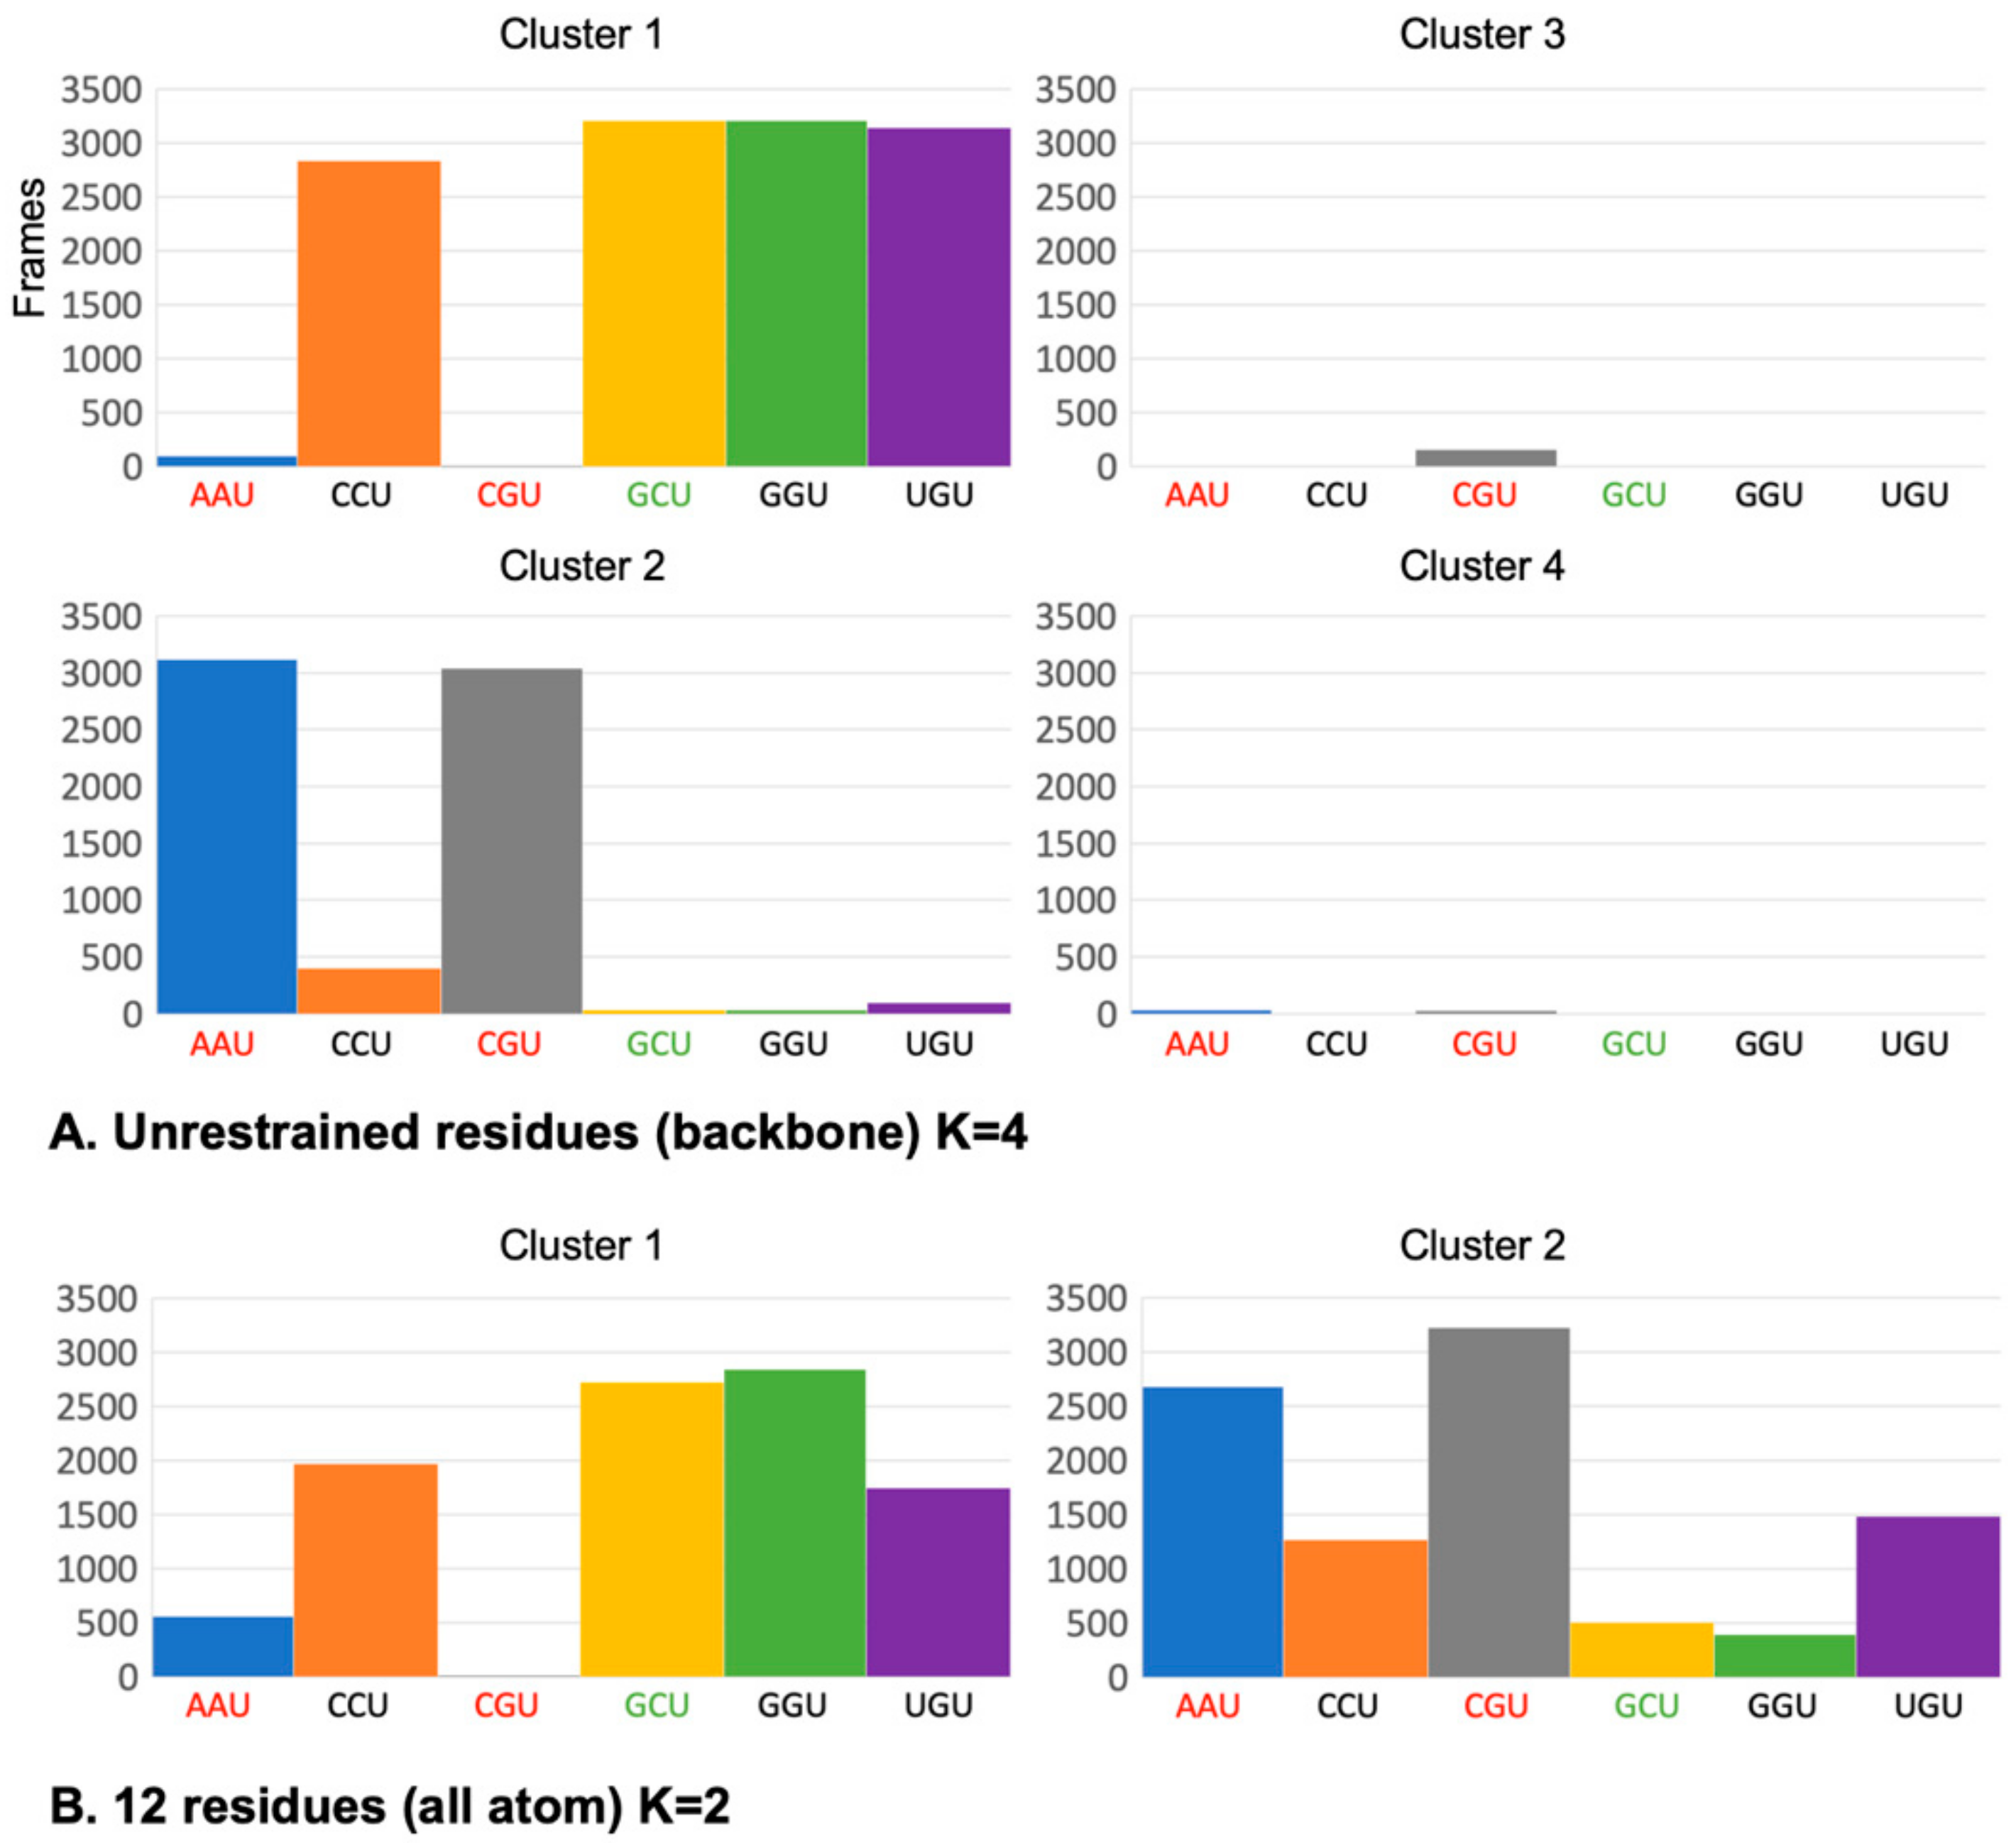
4.3. Clustering Analysis of Trajectories
Supplementary Materials
Author Contributions
Funding
Institutional Review Board Statement
Informed Consent Statement
Data Availability Statement
Acknowledgments
Conflicts of Interest
References
- Pavitt, G.D. Regulation of translation initiation factor eIF2B at the hub of the integrated stress response. WIREs RNA 2018, 9, e1491. [Google Scholar] [CrossRef] [PubMed]
- Sanchez, M.; Lin, Y.; Yang, C.; McQuary, P.; Campos, A.R.; Blanc, P.A.; Wolf, D.A. Cross Talk between eIF2a and eEF2 Phosphorylation Pathways Optimizes Translational Arrest in Response to Oxidative Stress. iScience 2019, 20, 466–480. [Google Scholar] [CrossRef] [PubMed] [Green Version]
- Shenton, D.; Smirnova, J.B.; Selley, J.N.; Carroll, K.; Hubbard, S.J.; Pavitt, G.D.; Ashe, M.P.; Grant, C.M. Global Translational Responses to Oxidative Stress Impact upon Multiple Levels of Protein Synthesis. J. Biol. Chem. 2006, 281, 29011–29021. [Google Scholar] [CrossRef] [PubMed] [Green Version]
- Chan, C.T.; Dyavaiah, M.; DeMott, M.S.; Taghizadeh, K.; Dedon, P.C.; Begley, T.J. A quantitative systems approach reveals dynamic control of tRNA modifications during cellular stress. PLoS Genet. 2010, 6, e1001247. [Google Scholar] [CrossRef] [Green Version]
- Gu, C.; Begley, T.J.; Dedon, P.C. tRNA modifications regulate translation during cellular stress. FEBS Lett. 2014, 588, 4287–4296. [Google Scholar] [CrossRef] [Green Version]
- Hou, Y.M.; Gamper, H.; Yang, W. Post-transcriptional modifications to tRNA—A response to the genetic code degeneracy. RNA 2015, 21, 642–644. [Google Scholar] [CrossRef]
- Schosserer, M.; Minois, N.; Angerer, T.B.; Amring, M.; Dellago, H.; Harreither, E.; Calle-Perez, A.; Pircher, A.; Gerstl, M.P.; Pfeifenberger, S.; et al. Methylation of ribosomal RNA by NSUN5 is a conserved mechanism modulating organismal lifespan. Nat. Commun. 2015, 6, 6158. [Google Scholar] [CrossRef] [Green Version]
- Sloan, K.E.; Warda, A.S.; Sharma, S.; Entian, K.D.; Lafontaine, D.L.J.; Bohnsack, M.T. Tuning the ribosome: The influence of rRNA modification on eukaryotic ribosome biogenesis and function. RNA Biol. 2017, 14, 1138–1152. [Google Scholar] [CrossRef]
- Zhao, B.S.; Roundtree, I.A.; He, C. Post-transcriptional gene regulationby mRNA modifications. Nat. Rev. Mol. Cell Biol. 2017, 18, 31–42. [Google Scholar] [CrossRef]
- Back, S.; Gorman, A.W.; Vogel, C.; Silva, G.M. Site-Specific K63 Ubiquitinomics Provides Insights into Translation Regulation under Stress. J. Proteome Res. 2019, 18, 309–318. [Google Scholar] [CrossRef]
- Silva, G.M.; Finley, D.; Vogel, C. K63 polyubiquitination is a new modulator of the oxidative stress response. Nat. Struct. Mol. Biol. 2015, 22, 116–123. [Google Scholar] [CrossRef] [PubMed] [Green Version]
- Farley-Barnes, K.I.; McCann, K.L.; Ogawa, L.M.; Merkel, J.; Surovtseva, Y.V.; Baserga, S.J. Diverse Regulators of Human Ribosome Biogenesis Discovered by Changes in Nucleolar Number. Cell Rep. 2018, 22, 1923–1934. [Google Scholar] [CrossRef] [PubMed] [Green Version]
- Genuth, N.R.; Barna, M. The Discovery of Ribosome Heterogeneity and Its Implications for Gene Regulation and Organismal Life. Mol. Cell 2018, 71, 364–374. [Google Scholar] [CrossRef] [PubMed] [Green Version]
- Monaco, P.L.; Marcel, V.; Diaz, J.J.; Catez, F. 2'-O-Methylation of Ribosomal RNA: Towards an Epitranscriptomic Control of Translation? Biomolecules 2018, 8, 106. [Google Scholar] [CrossRef] [PubMed] [Green Version]
- Shi, Z.; Fujii, K.; Kovary, K.M.; Genuth, N.R.; Rost, H.L.; Teruel, M.N.; Barna, M. Heterogeneous Ribosomes Preferentially Translate Distinct Subpools of mRNAs Genome-wide. Mol. Cell 2017, 67, 71–83 e77. [Google Scholar] [CrossRef] [PubMed] [Green Version]
- Xue, S.; Barna, M. Specialized ribosomes: A new frontier in gene regulation and organismal biology. Nat. Rev. Mol. Cell Biol. 2012, 13, 355–369. [Google Scholar] [CrossRef] [PubMed] [Green Version]
- Barr, W.A.; Sheth, R.B.; Kwon, J.; Cho, J.; Glickman, J.W.; Hart, F.; Chatterji, O.K.; Scopino, K.; Voelkel-Meiman, K.; Krizanc, D.; et al. GCN sensitive protein translation in yeast. PLoS ONE 2020, 15, e0233197. [Google Scholar]
- Scopino, K.; Dalgarno, C.; Nachmanoff, C.; Krizanc, D.; Thayer, K.M.; Weir, M.P. Arginine Methylation Regulates Ribosome CAR Function. Int. J. Mol. Sci. 2021, 22, 1335. [Google Scholar] [CrossRef]
- Scopino, K.; Williams, E.; Elsayed, A.; Barr, W.A.; Krizanc, D.; Thayer, K.M.; Weir, M.P. A Ribosome Interaction Surface Sensitive to mRNA GCN Periodicity. Biomolecules 2020, 10, 849. [Google Scholar] [CrossRef]
- Abeyrathne, P.D.; Koh, C.S.; Grant, T.; Grigorieff, N.; Korostelev, A.A. Ensemble cryo-EM uncovers inchworm-like translocation of a viral IRES through the ribosome. Elife 2016, 5, e14874. [Google Scholar] [CrossRef]
- Lv, F.; Zhang, T.; Zhou, Z.; Gao, S.; Wong, C.C.; Zhou, J.Q.; Ding, J. Structural basis for Sfm1 functioning as a protein arginine methyltransferase. Cell Discov. 2015, 1, 15037. [Google Scholar] [CrossRef] [PubMed] [Green Version]
- Young, B.D.; Weiss, D.I.; Zurita-Lopez, C.I.; Webb, K.J.; Clarke, S.G.; McBride, A.E. Identification of methylated proteins in the yeast small ribosomal subunit: A role for SPOUT methyltransferases in protein arginine methylation. Biochemistry 2012, 51, 5091–5104. [Google Scholar] [CrossRef] [PubMed] [Green Version]
- Gerashchenko, M.V.; Gladyshev, V.N. Translation inhibitors cause abnormalities in ribosome profiling experiments. Nucleic. Acids Res. 2014, 42, e134. [Google Scholar] [CrossRef] [PubMed] [Green Version]
- Crawford, R.A.; Pavitt, G.D. Translational regulation in response to stress in Saccharomyces cerevisiae. Yeast 2019, 36, 5–21. [Google Scholar] [CrossRef] [Green Version]
- Tuller, T.; Carmi, A.; Vestsigian, K.; Navon, S.; Dorfan, Y.; Zaborske, J.; Pan, T.; Dahan, O.; Furman, I.; Pilpel, Y. An evolutionarily conserved mechanism for controlling the efficiency of protein translation. Cell 2010, 141, 344–354. [Google Scholar] [CrossRef] [Green Version]
- Schneider, T.D. Information content of individual genetic sequences. J. Theor. Biol. 1997, 189, 427–441. [Google Scholar] [CrossRef]
- Shultzaberger, R.K.; Roberts, L.R.; Lyakhov, I.G.; Sidorov, I.A.; Stephen, A.G.; Fisher, R.J.; Schneider, T.D. Correlation between binding rate constants and individual information of E. coli Fis binding sites. Nucleic Acids Res. 2007, 35, 5275–5282. [Google Scholar] [CrossRef] [Green Version]
- Sharp, P.M.; Li, W.H. The codon Adaptation Index--a measure of directional synonymous codon usage bias, and its potential applications. Nucleic Acids Res. 1987, 15, 1281–1295. [Google Scholar] [CrossRef] [Green Version]
- Lagunez-Otero, J.; Trifonov, E.N. mRNA periodical infrastructure complementary to the proof-reading site in the ribosome. J. Biomol. Struct. Dyn. 1992, 10, 455–464. [Google Scholar] [CrossRef]
- Mendoza, L.; Mondragon, M.; Lagunez-Otero, J. Interaction of the 530 ribosomal site with regions of mRNA. Biosystems 1998, 46, 293–298. [Google Scholar] [CrossRef]
- Case, D.A.; Ben-Shalom, I.Y.; Brozell, S.R.; Cerutti, D.S.; Cheatham, T.E., III; Cruzeiro, V.W.D.; Darden, T.A.; Duke, R.E.; Ghoreishi, D.; Gilson, M.K.; et al. AMBER 18; University of California: San Francisco, CA, USA, 2018. [Google Scholar]
- Bottaro, S.; Di Palma, F.; Bussi, G. The role of nucleobase interactions in RNA structure and dynamics. Nucleic Acids Res. 2014, 42, 13306–13314. [Google Scholar] [CrossRef] [PubMed]
- Jacobs, J.L.; Belew, A.T.; Rakauskaite, R.; Dinman, J.D. Identification of functional, endogenous programmed -1 ribosomal frameshift signals in the genome of Saccharomyces cerevisiae. Nucleic Acids Res. 2007, 35, 165–174. [Google Scholar] [CrossRef] [PubMed]
- Sponer, J.; Sponer, J.E.; Mladek, A.; Jurecka, P.; Banas, P.; Otyepka, M. Nature and magnitude of aromatic base stacking in DNA and RNA: Quantum chemistry, molecular mechanics, and experiment. Biopolymers 2013, 99, 978–988. [Google Scholar] [CrossRef] [PubMed]
- Amaro, R.E.; Cheng, X.; Ivanov, I.; Xu, D.; McCammon, J.A. Characterizing loop dynamics and ligand recognition in human-and avian-type influenza neuraminidases via generalized born molecular dynamics and end-point free energy calculations. J. Am. Chem. Soc. 2009, 131, 4702–4709. [Google Scholar] [CrossRef] [PubMed] [Green Version]
- Weiser, J.; Shenkin, P.; Still, W. Approximate atomic surfaces from linear combinations of pairwise overlaps (LCPO). J. Comput. Chem. 1999, 20, 217–230. [Google Scholar] [CrossRef]
- Thayer, K.M.; Lakhani, B.; Beveridge, D.L. Molecular Dynamics-Markov State Model of Protein Ligand Binding and Allostery in CRIB-PDZ: Conformational Selection and Induced Fit. J. Phys. Chem. B 2017, 121, 5509–5514. [Google Scholar] [CrossRef] [PubMed]
- Roe, D.R.; Cheatham, T.E., III. PTRAJ and CPPTRAJ: Software for processing and analysis of molecular synamics trajectory data. J. Chem. Theory Comput. 2013, 9, 3084–3095. [Google Scholar] [CrossRef]
- DeLano, W.L.; Lano, W.L. The PyMOL Molecular Graphics System, Version 2.3 Schrödinger, LLC. Available online: https://pymol.org/2/support.html (accessed on 3 May 2020).
- Hsin, J.; Arkhipov, A.; Yin, Y.; Stone, J.E.; Schulten, K. Using VMD: An introductory tutorial. Curr. Protoc. Bioinform. 2008, 14, 5–7. [Google Scholar] [CrossRef] [Green Version]
- Humphrey, W.; Dalke, A.; Schulten, K. VMD: Visual Molecular Dynamics. J. Molec Graph 1986, 14, 33–38. [Google Scholar] [CrossRef]


Publisher’s Note: MDPI stays neutral with regard to jurisdictional claims in published maps and institutional affiliations. |
© 2022 by the authors. Licensee MDPI, Basel, Switzerland. This article is an open access article distributed under the terms and conditions of the Creative Commons Attribution (CC BY) license (https://creativecommons.org/licenses/by/4.0/).
Share and Cite
Dalgarno, C.; Scopino, K.; Raval, M.; Nachmanoff, C.; Sakkas, E.D.; Krizanc, D.; Thayer, K.M.; Weir, M.P. The CAR–mRNA Interaction Surface Is a Zipper Extension of the Ribosome A Site. Int. J. Mol. Sci. 2022, 23, 1417. https://0-doi-org.brum.beds.ac.uk/10.3390/ijms23031417
Dalgarno C, Scopino K, Raval M, Nachmanoff C, Sakkas ED, Krizanc D, Thayer KM, Weir MP. The CAR–mRNA Interaction Surface Is a Zipper Extension of the Ribosome A Site. International Journal of Molecular Sciences. 2022; 23(3):1417. https://0-doi-org.brum.beds.ac.uk/10.3390/ijms23031417
Chicago/Turabian StyleDalgarno, Carol, Kristen Scopino, Mitsu Raval, Clara Nachmanoff, Eric D. Sakkas, Daniel Krizanc, Kelly M. Thayer, and Michael P. Weir. 2022. "The CAR–mRNA Interaction Surface Is a Zipper Extension of the Ribosome A Site" International Journal of Molecular Sciences 23, no. 3: 1417. https://0-doi-org.brum.beds.ac.uk/10.3390/ijms23031417