
Genetic Interaction between Mfrp and Adipor1 Mutations Affect Retinal Disease Phenotypes

 , , , and
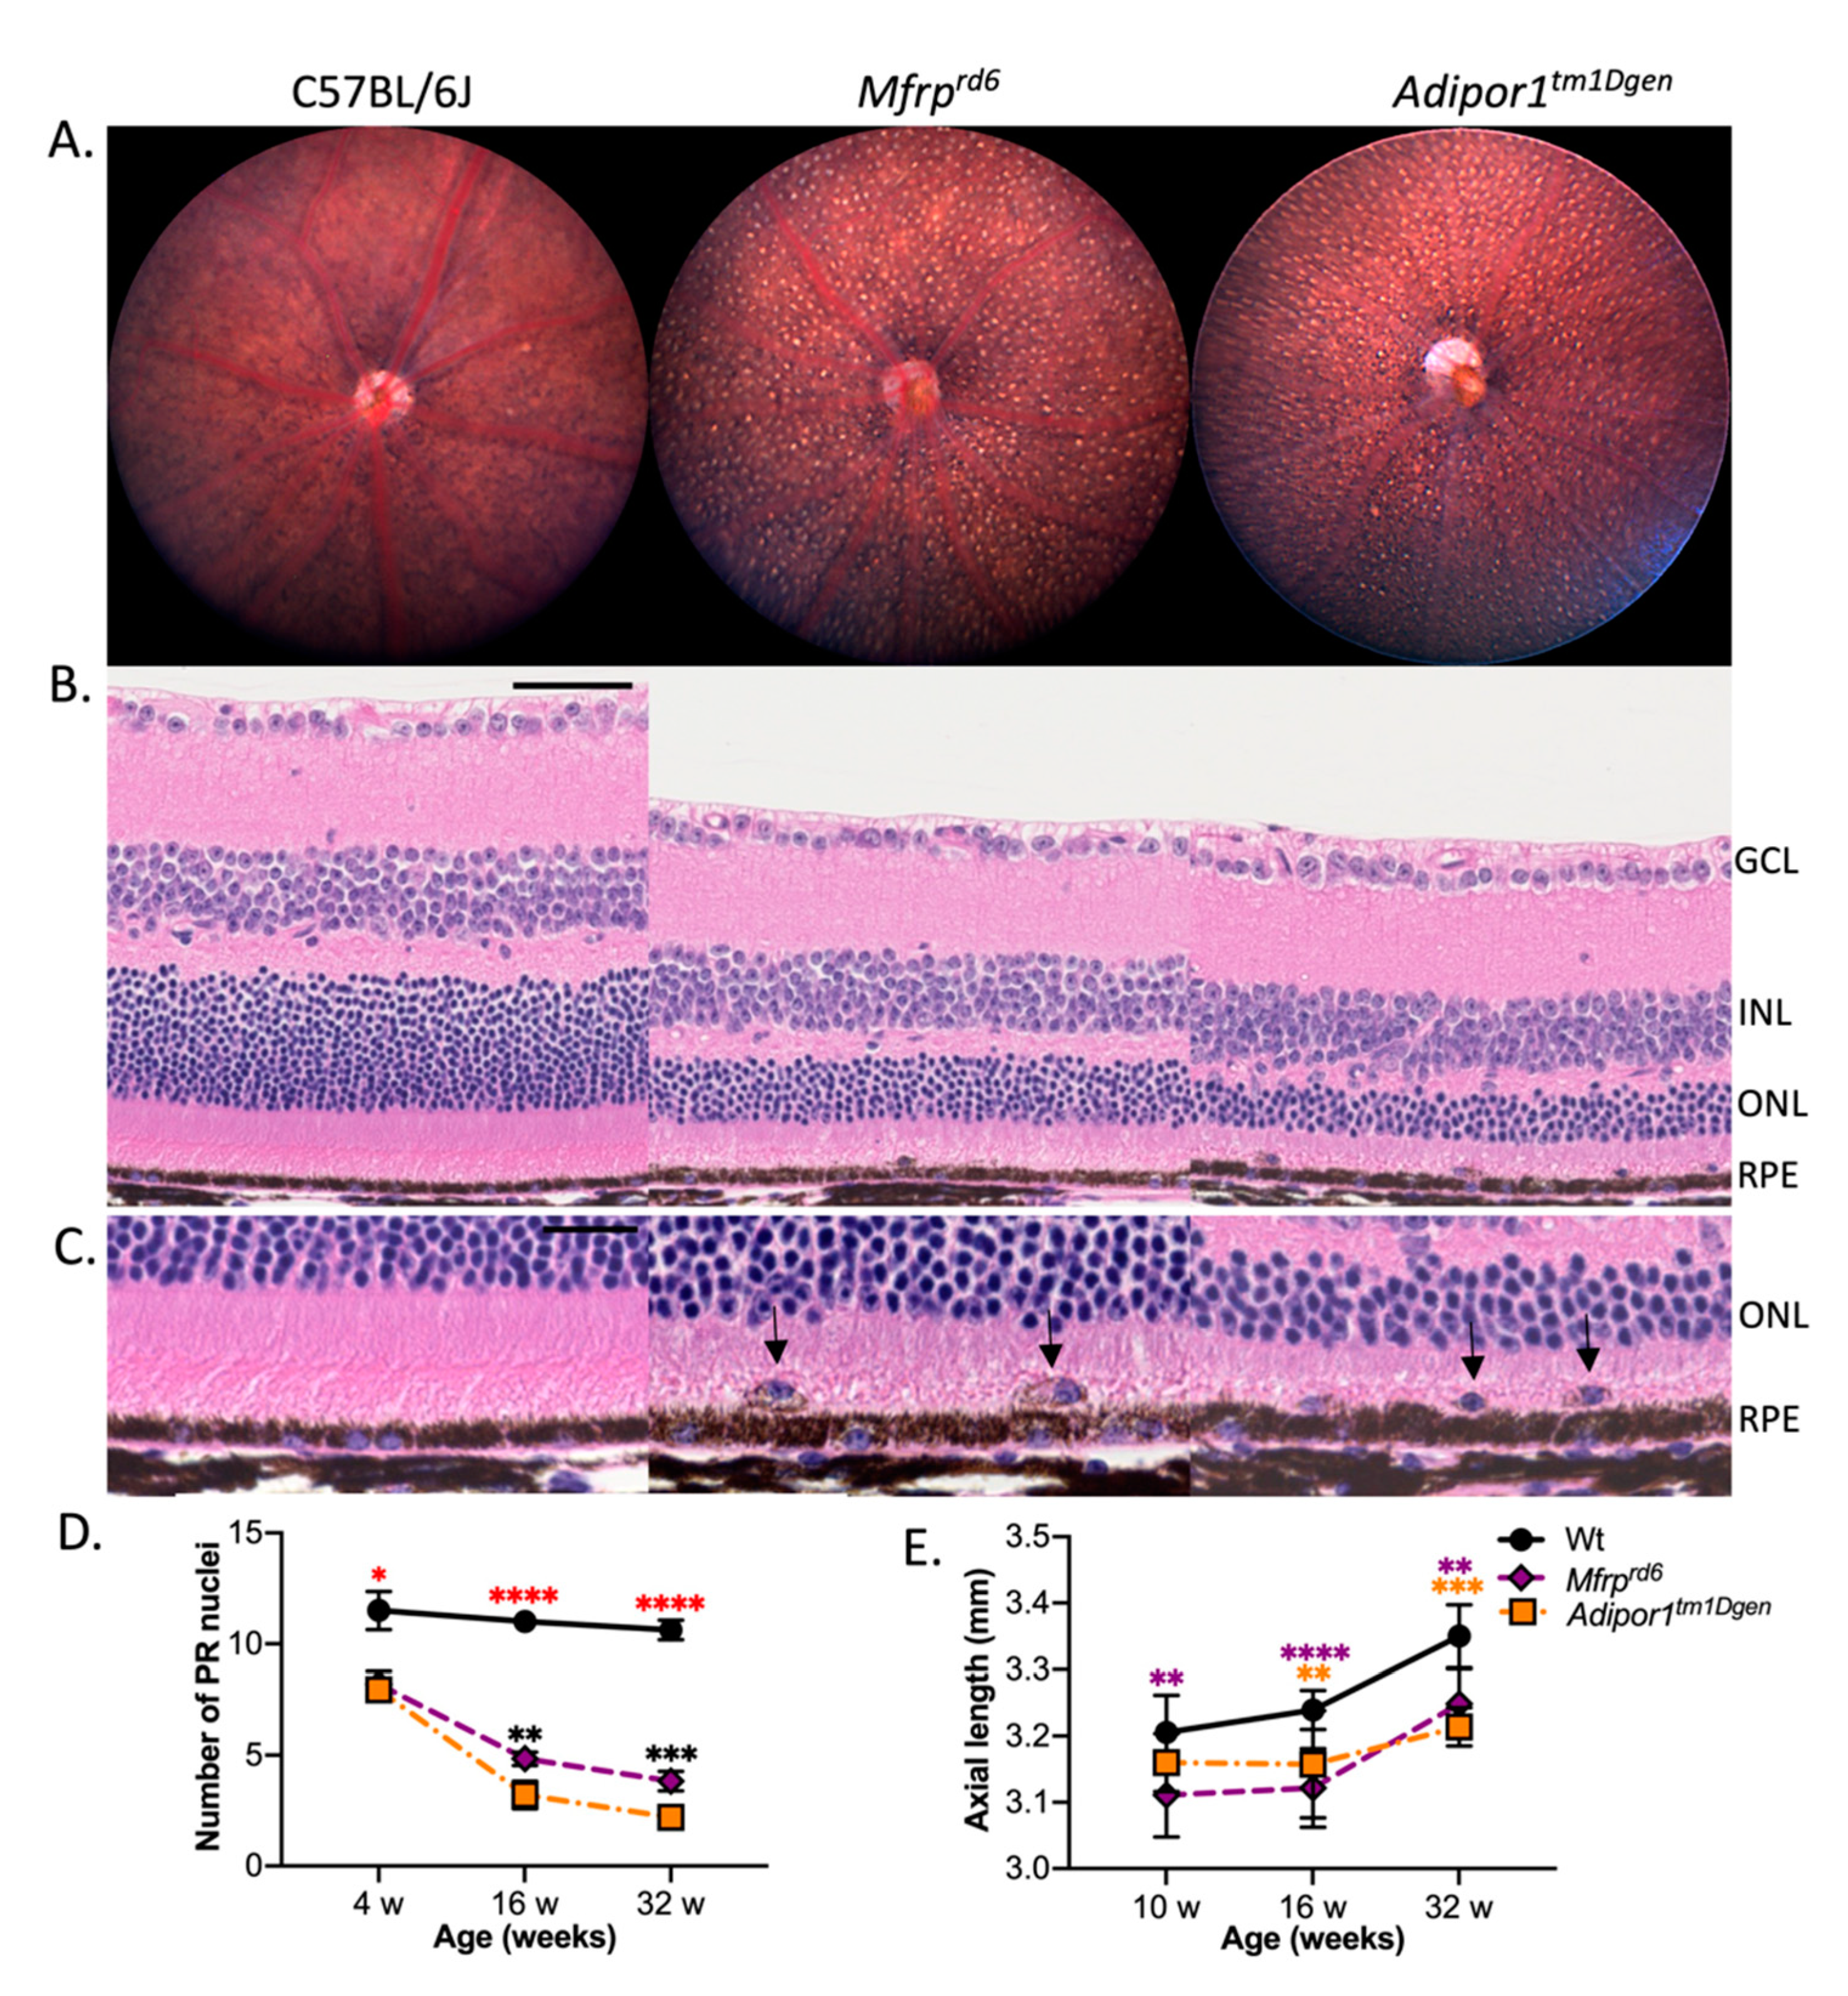
Abstract
:1. Introduction
2. Results
2.1. Phenotypic Similarities between Mfrprd6 and Adipor1tm1Dgen Mice
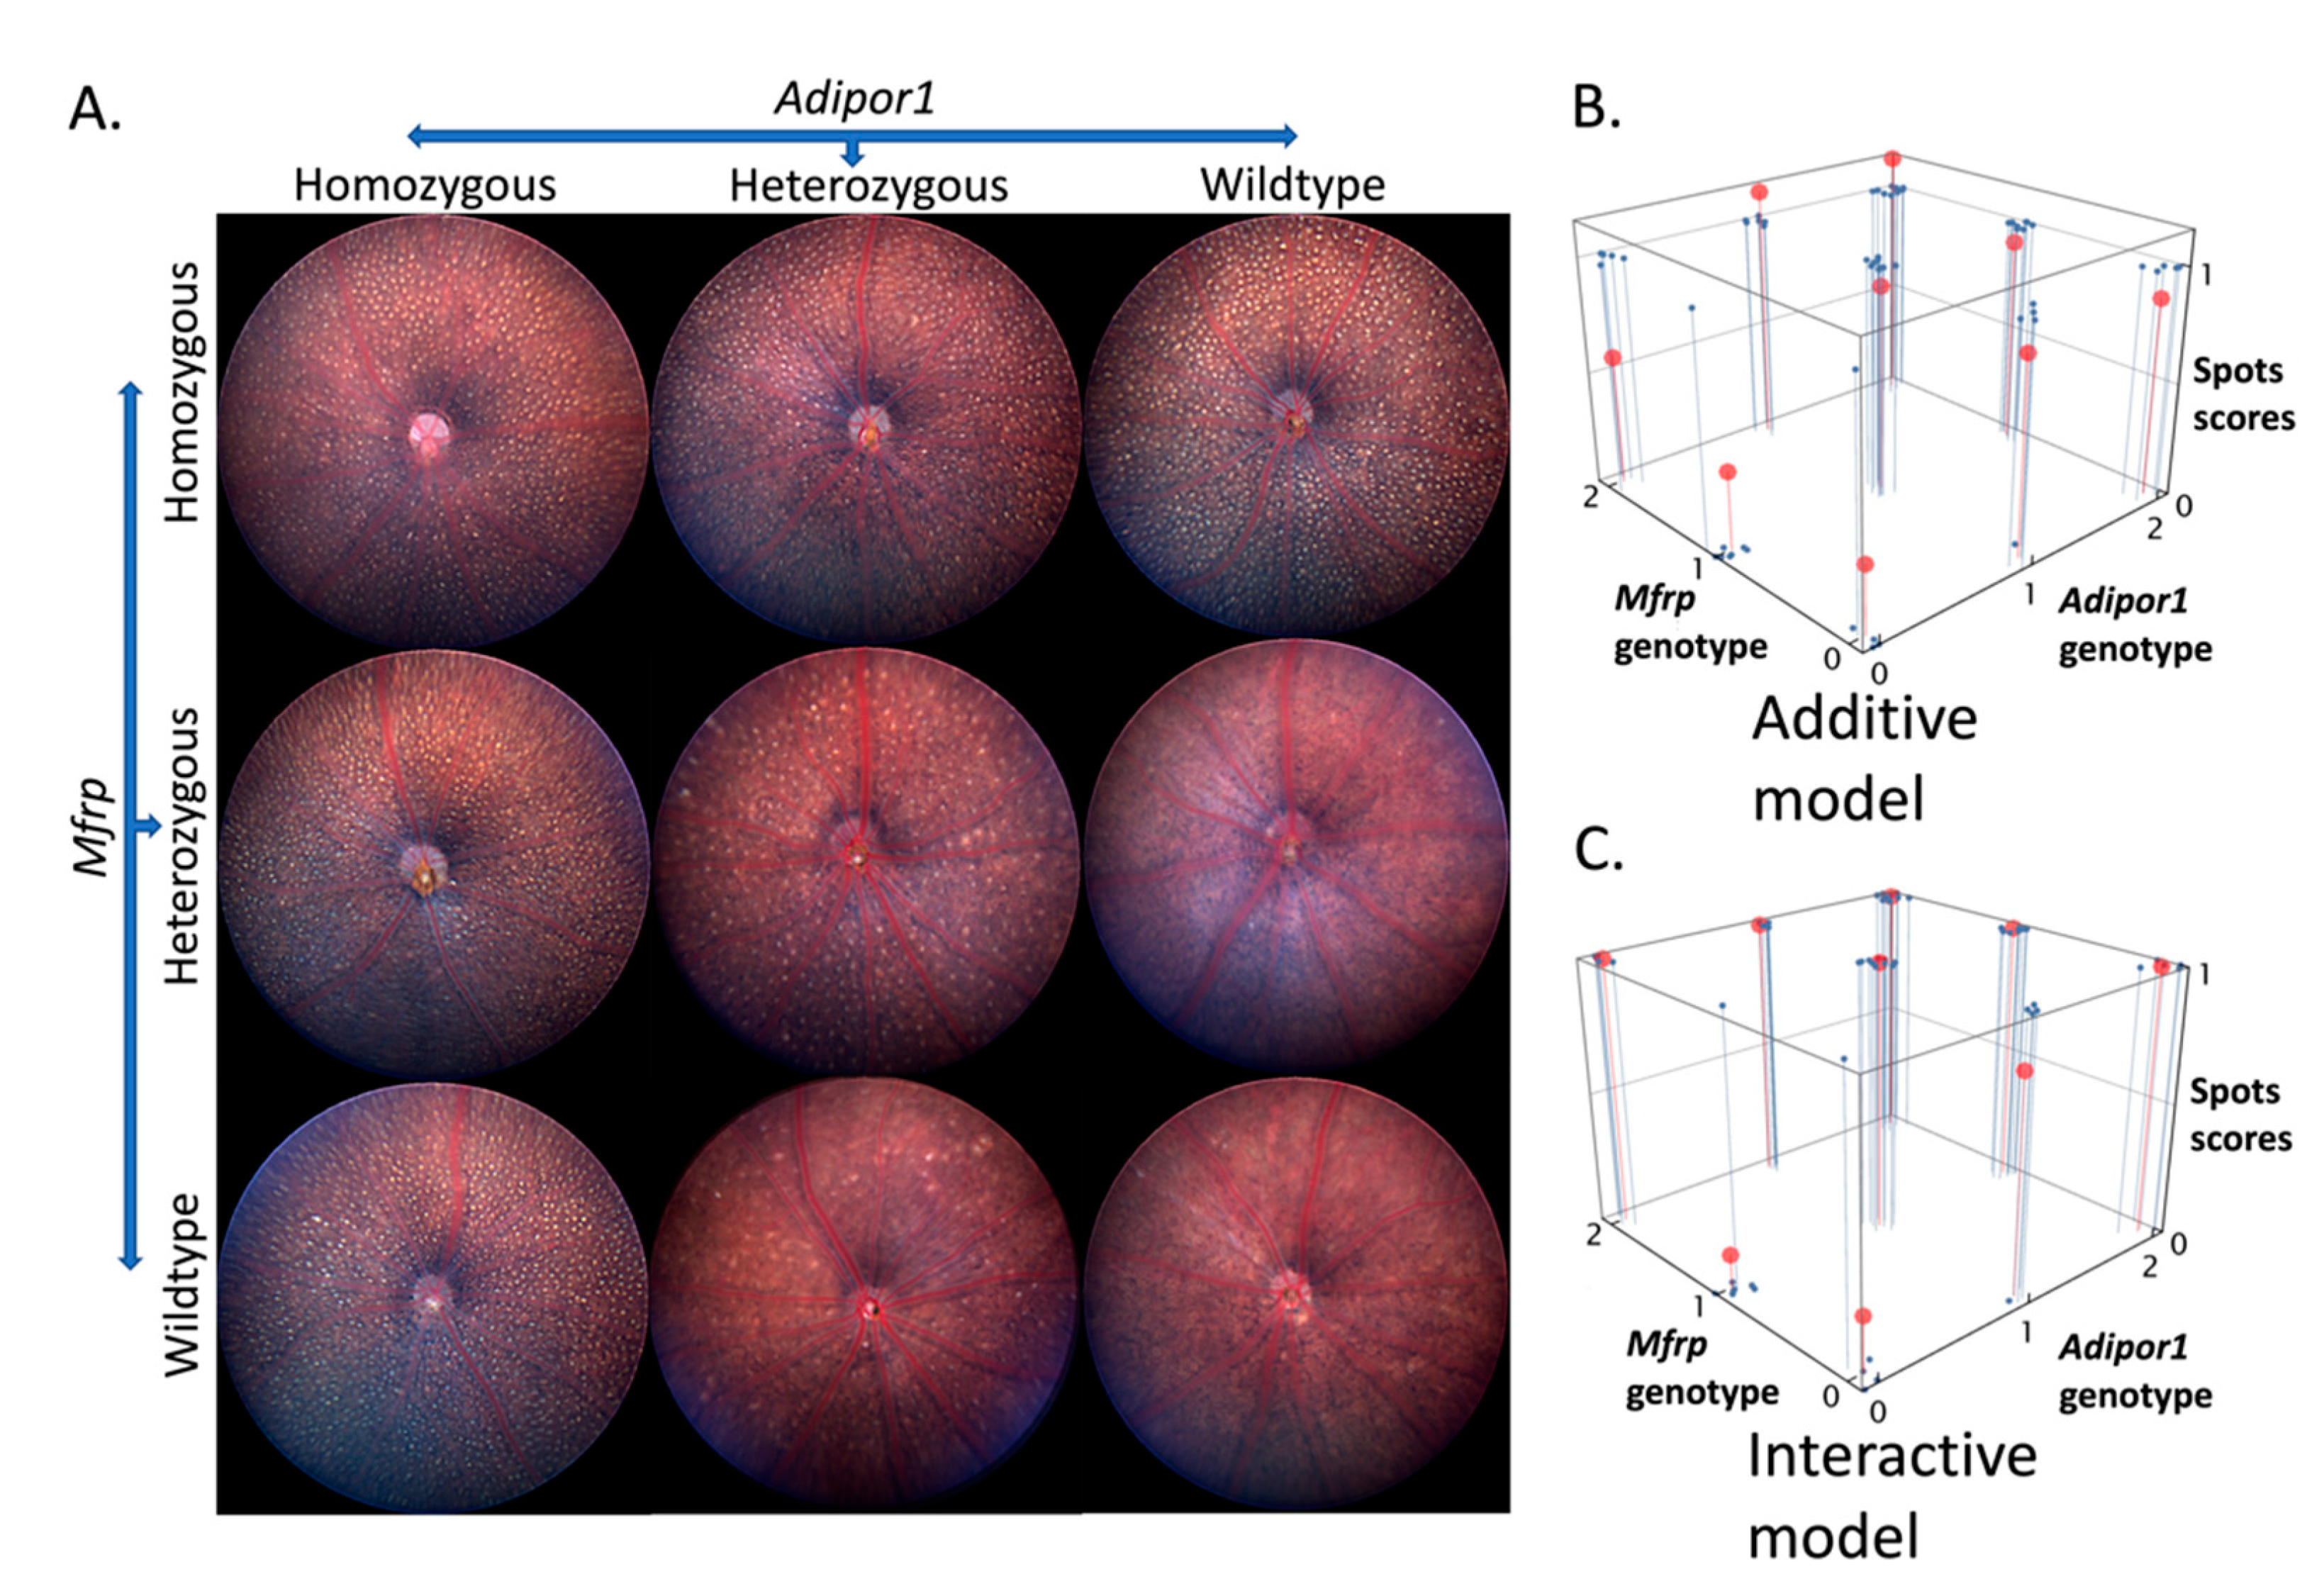
2.2. Effects of Adipor1tm1Dgen and/or Mfrprd6 Alleles on Fundus Appearance
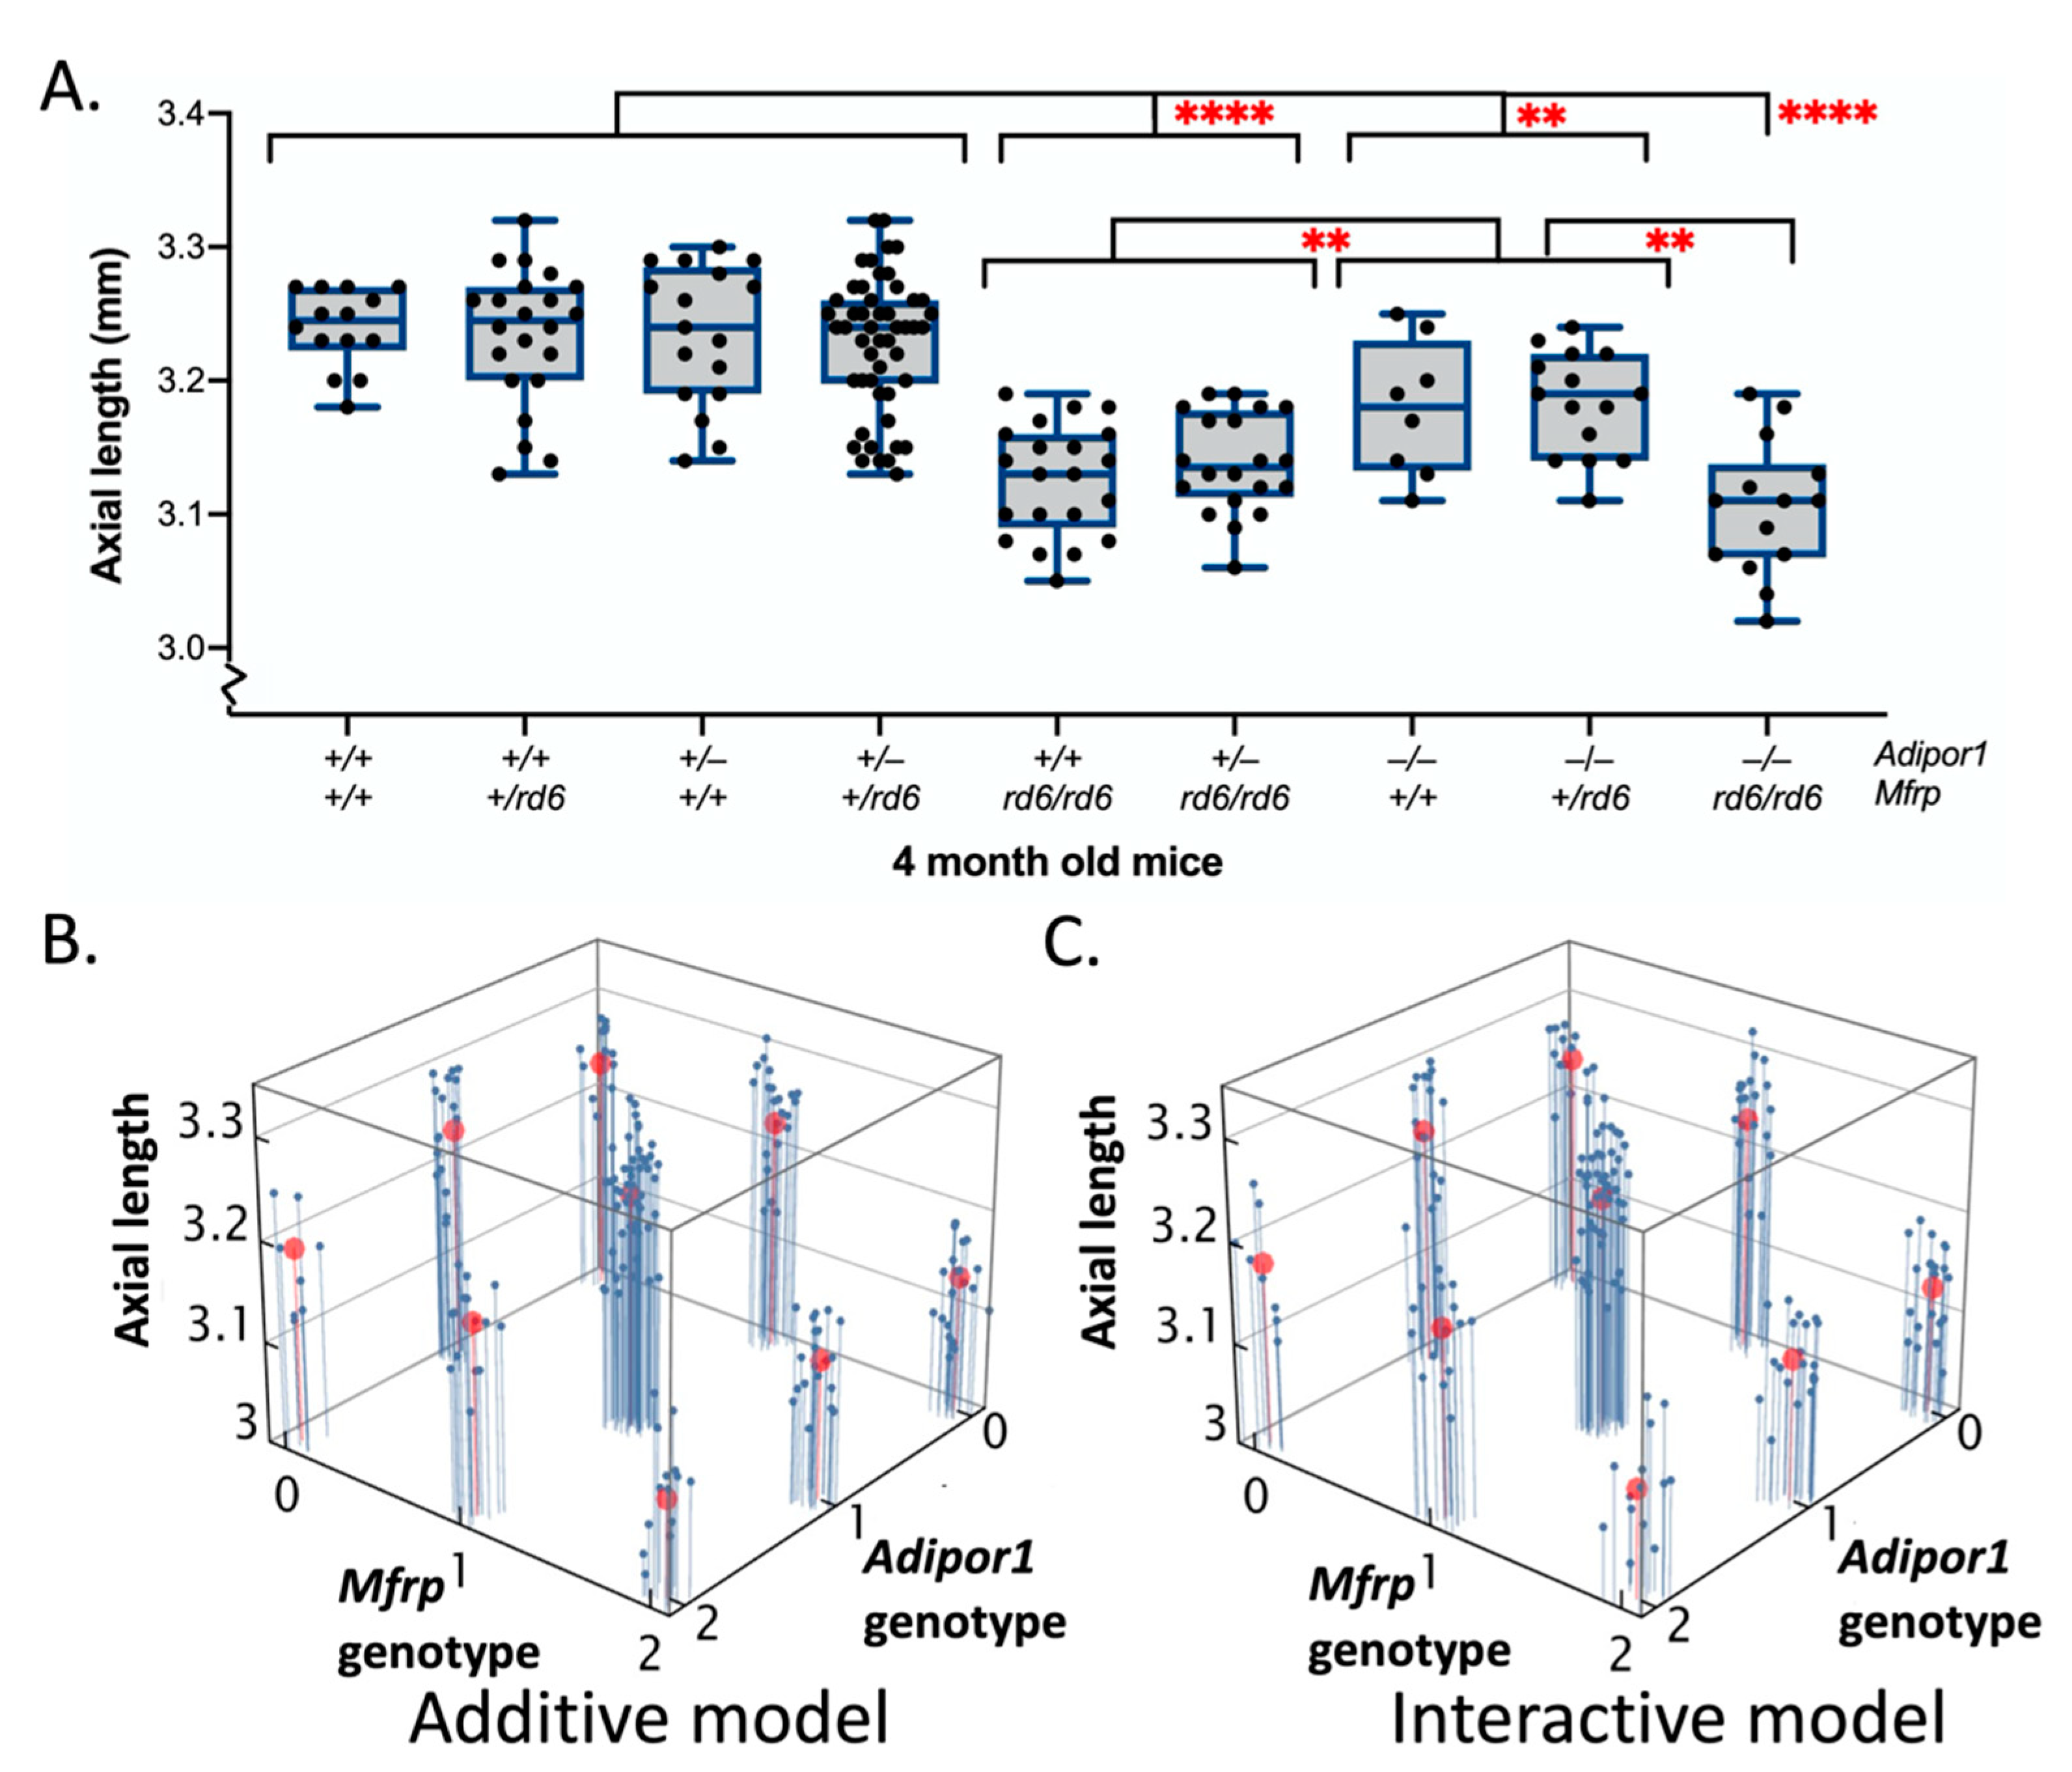
2.3. Effects of Adipor1tm1Dgen and/or Mfrprd6 Alleles on Axial Length (AL)
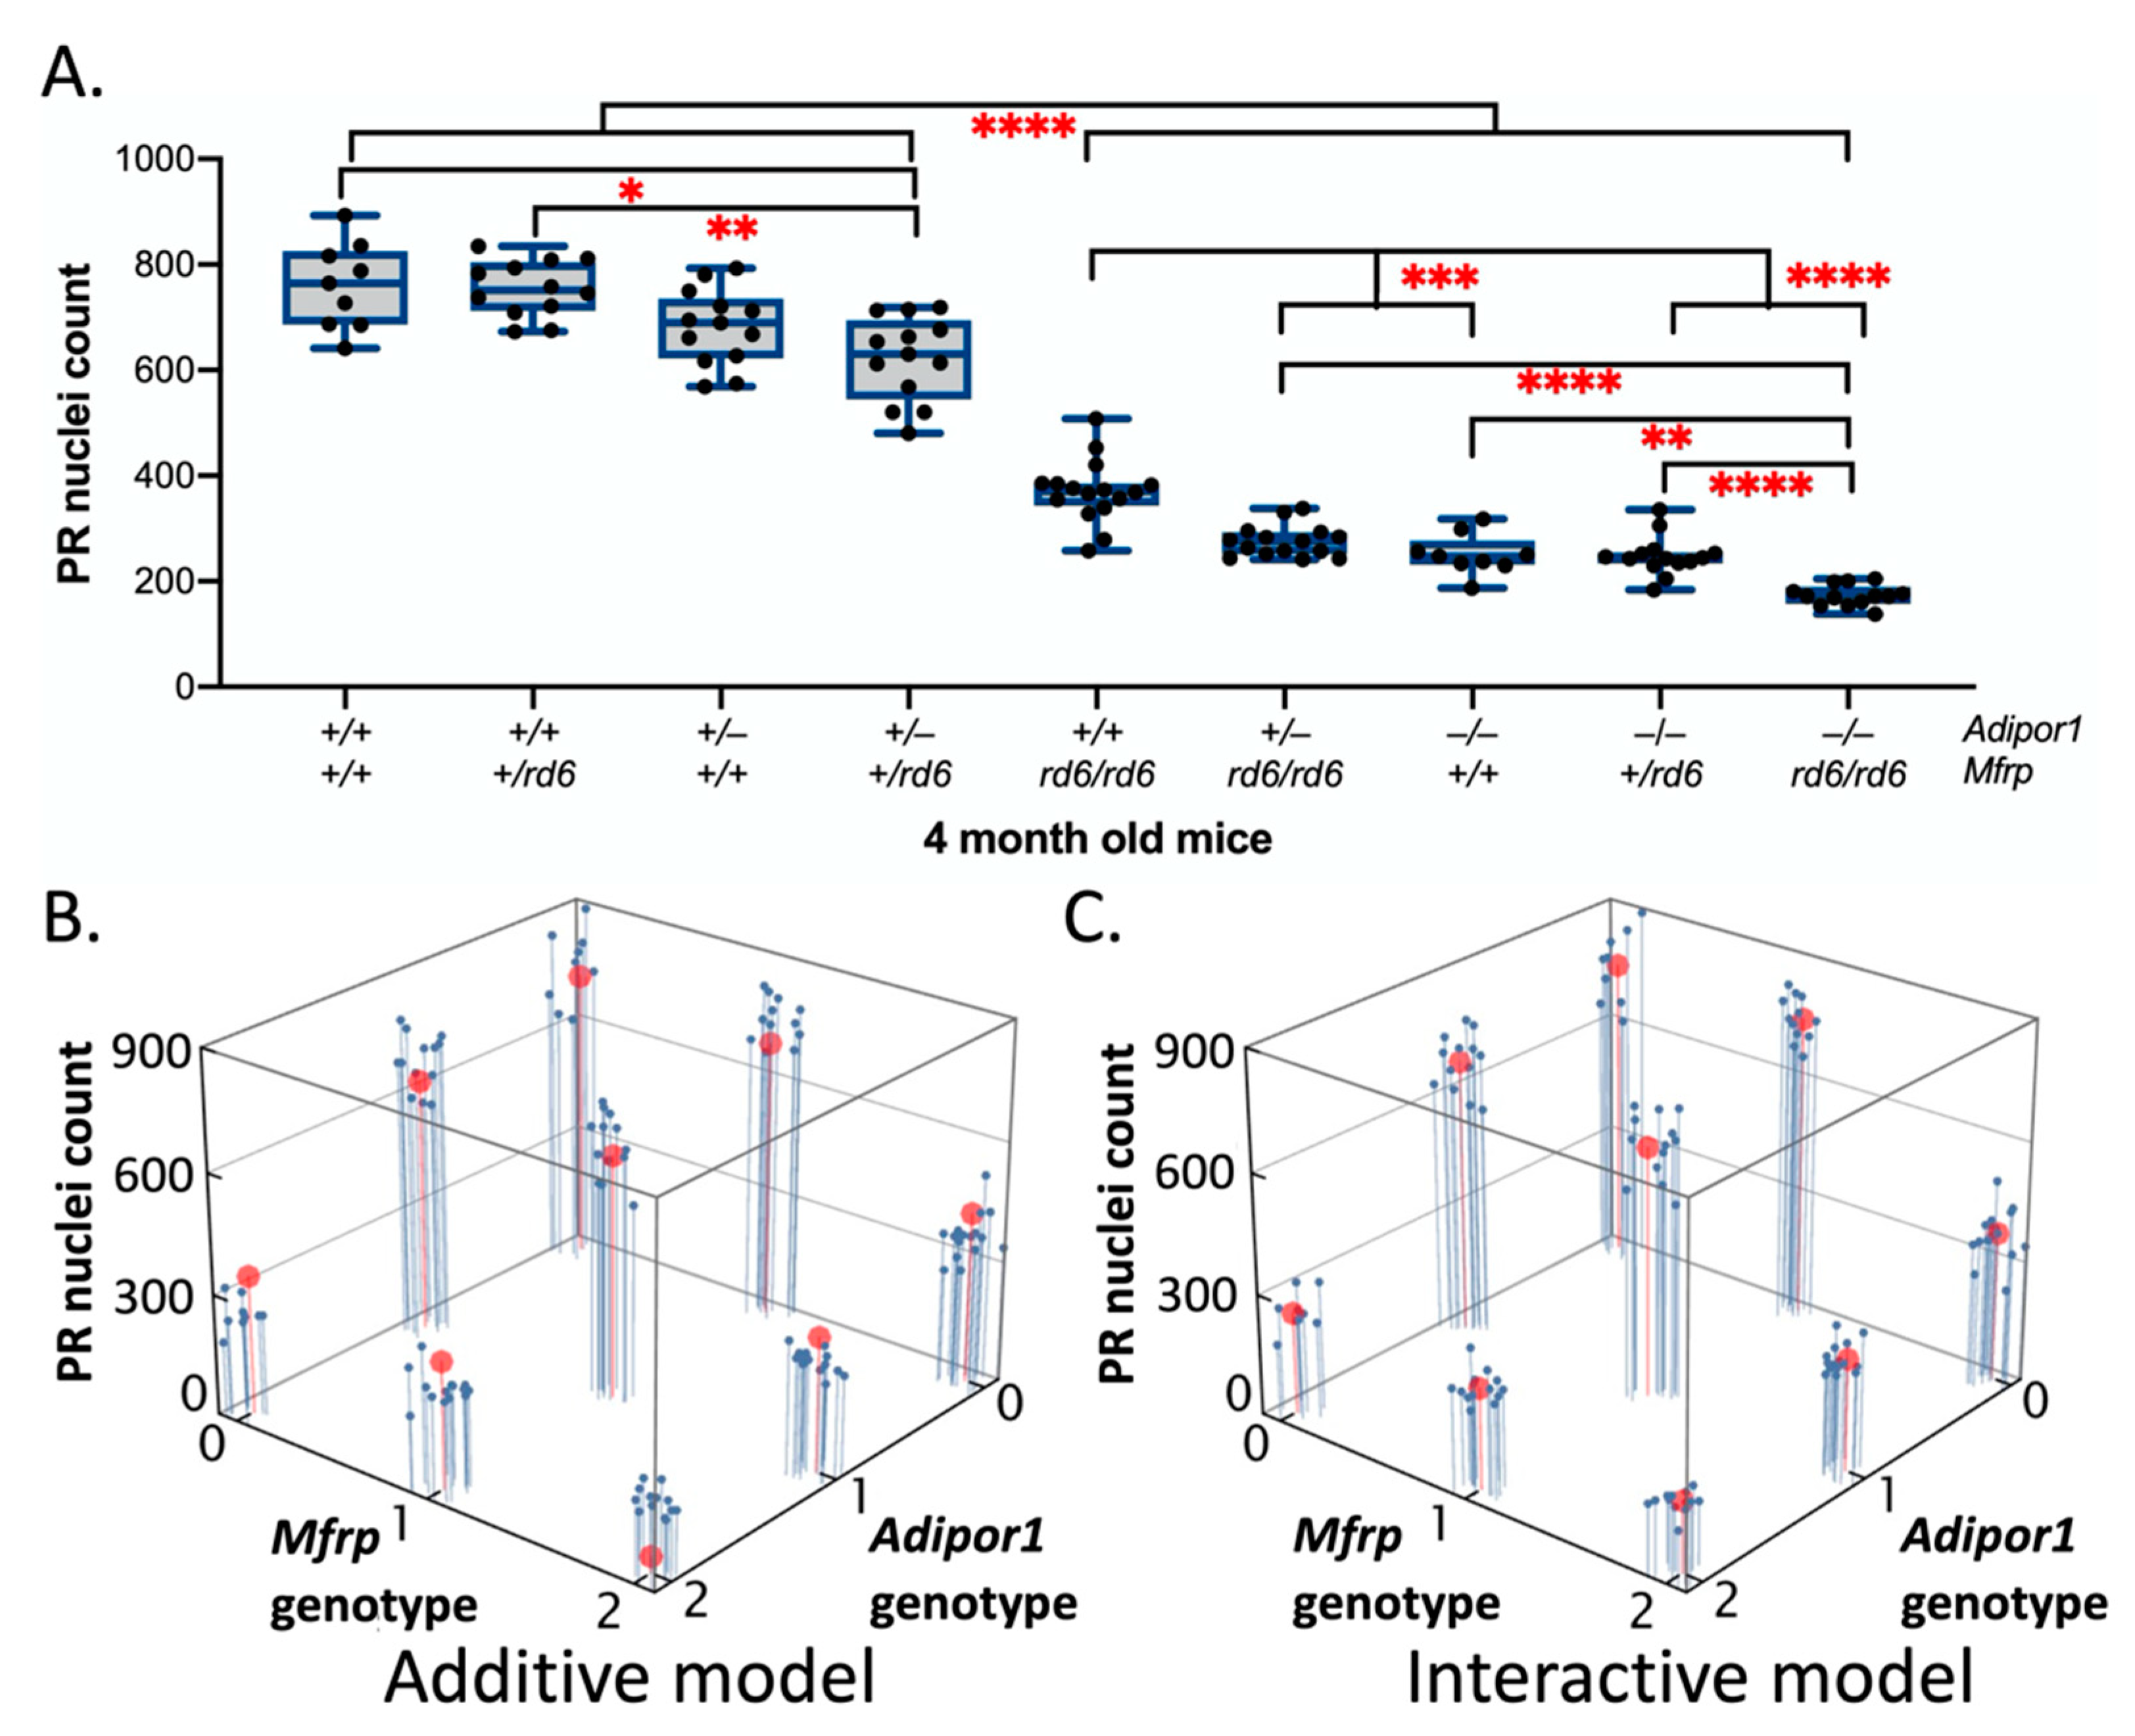
2.4. Effects of Adipor1tm1Dgen and/or Mfrprd6 Alleles on Photoreceptor (PR) Degeneration
3. Discussion
4. Materials and Methods
4.1. Ethics Statement
4.2. Animals
4.3. Genotyping
4.4. Fundus Imaging
4.5. Histological Analysis
4.6. Axial Length Measurement
4.7. Refractive Error Measurement
4.8. Statistical Analysis
Supplementary Materials
Author Contributions
Funding
Institutional Review Board Statement
Informed Consent Statement
Data Availability Statement
Acknowledgments
Conflicts of Interest
References
- Won, J.; Smith, R.S.; Peachey, N.S.; Wu, J.; Hicks, W.L.; Naggert, J.K.; Nishina, P.M. Membrane frizzled-related protein is necessary for the normal development and maintenance of photoreceptor outer segments. Vis. Neurosci. 2008, 25, 563–574. [Google Scholar] [CrossRef] [PubMed]
- Kameya, S.; Hawes, N.L.; Chang, B.; Heckenlively, J.R.; Naggert, J.K.; Nishina, P.M. Mfrp, a gene encoding a frizzled related protein, is mutated in the mouse retinal degeneration 6. Hum. Mol. Genet. 2002, 11, 1879–1886. [Google Scholar] [CrossRef] [PubMed]
- Mandal, M.N.; Vasireddy, V.; Jablonski, M.M.; Wang, X.; Heckenlively, J.R.; Hughes, B.A.; Reddy, G.B.; Ayyagari, R. Spatial and temporal expression of MFRP and its interaction with CTRP5. Investig. Ophthalmol. Vis. Sci. 2006, 47, 5514–5521. [Google Scholar] [CrossRef] [PubMed]
- Velez, G.; Tsang, S.H.; Tsai, Y.T.; Hsu, C.W.; Gore, A.; Abdelhakim, A.H.; Mahajan, M.; Silverman, R.H.; Sparrow, J.R.; Bassuk, A.G.; et al. Gene Therapy Restores Mfrp and Corrects Axial Eye Length. Sci. Rep. 2017, 7, 16151. [Google Scholar] [CrossRef] [PubMed]
- Sundin, O.H.; Leppert, G.S.; Silva, E.D.; Yang, J.M.; Dharmaraj, S.; Maumenee, I.H.; Santos, L.C.; Parsa, C.F.; Traboulsi, E.I.; Broman, K.W.; et al. Extreme hyperopia is the result of null mutations in MFRP, which encodes a Frizzled-related protein. Proc. Natl. Acad. Sci. USA 2005, 102, 9553–9558. [Google Scholar] [CrossRef] [Green Version]
- Prasov, L.; Guan, B.; Ullah, E.; Archer, S.M.; Ayres, B.M.; Besirli, C.G.; Wiinikka-Buesser, L.; Comer, G.M.; Del Monte, M.A.; Elner, S.G.; et al. Novel TMEM98, MFRP, PRSS56 variants in a large United States high hyperopia and nanophthalmos cohort. Sci. Rep. 2020, 10, 19986. [Google Scholar] [CrossRef]
- Aldahmesh, M.A.; Nowilaty, S.R.; Alzahrani, F.; Al-Ebdi, L.; Mohamed, J.Y.; Rajab, M.; Khan, A.O.; Alkuraya, F.S. Posterior microphthalmos as a genetically heterogeneous condition that can be allelic to nanophthalmos. Arch. Ophthalmol. 2011, 129, 805–807. [Google Scholar] [CrossRef] [PubMed] [Green Version]
- Dinculescu, A.; Estreicher, J.; Zenteno, J.C.; Aleman, T.S.; Schwartz, S.B.; Huang, W.C.; Roman, A.J.; Sumaroka, A.; Li, Q.; Deng, W.T.; et al. Gene therapy for retinitis pigmentosa caused by MFRP mutations: Human phenotype and preliminary proof of concept. Hum. Gene. Ther. 2012, 23, 367–376. [Google Scholar] [CrossRef] [PubMed] [Green Version]
- Godinho, G.; Madeira, C.; Grangeia, A.; Neves-Cardoso, P.; Santos-Silva, R.; Brandao, E.; Carneiro, A.; Falcao-Reis, F.; Estrela-Silva, S. A novel MFRP gene variant in a family with posterior microphthalmos, retinitis pigmentosa, foveoschisis, and foveal hypoplasia. Ophthalmic Genet. 2020, 41, 474–479. [Google Scholar] [CrossRef]
- Crespi, J.; Buil, J.A.; Bassaganyas, F.; Vela-Segarra, J.I.; Diaz-Cascajosa, J.; Ayala-Ramirez, R.; Zenteno, J.C. A novel mutation confirms MFRP as the gene causing the syndrome of nanophthalmos-renititis pigmentosa-foveoschisis-optic disk drusen. Am. J. Ophthalmol. 2008, 146, 323–328. [Google Scholar] [CrossRef]
- Ayala-Ramirez, R.; Graue-Wiechers, F.; Robredo, V.; Amato-Almanza, M.; Horta-Diez, I.; Zenteno, J.C. A new autosomal recessive syndrome consisting of posterior microphthalmos, retinitis pigmentosa, foveoschisis, and optic disc drusen is caused by a MFRP gene mutation. Mol. Vis. 2006, 12, 1483–1489. [Google Scholar] [PubMed]
- Fogerty, J.; Besharse, J.C. 174delG mutation in mouse MFRP causes photoreceptor degeneration and RPE atrophy. Investig. Ophthalmol. Vis. Sci. 2011, 52, 7256–7266. [Google Scholar] [CrossRef] [PubMed] [Green Version]
- Chekuri, A.; Sahu, B.; Chavali, V.R.M.; Voronchikhina, M.; Soto-Hermida, A.; Suk, J.J.; Alapati, A.N.; Bartsch, D.U.; Ayala-Ramirez, R.; Zenteno, J.C.; et al. Long-Term Effects of Gene Therapy in a Novel Mouse Model of Human MFRP-Associated Retinopathy. Hum. Gene Ther. 2019, 30, 632–650. [Google Scholar] [CrossRef] [PubMed]
- Neri, A.; Leaci, R.; Zenteno, J.C.; Casubolo, C.; Delfini, E.; Macaluso, C. Membrane frizzled-related protein gene-related ophthalmological syndrome: 30-month follow-up of a sporadic case and review of genotype-phenotype correlation in the literature. Mol. Vis. 2012, 18, 2623–2632. [Google Scholar]
- Zenteno, J.C.; Buentello-Volante, B.; Quiroz-Gonzalez, M.A.; Quiroz-Reyes, M.A. Compound heterozygosity for a novel and a recurrent MFRP gene mutation in a family with the nanophthalmos-retinitis pigmentosa complex. Mol. Vis. 2009, 15, 1794–1798. [Google Scholar]
- Hawes, N.L.; Chang, B.; Hageman, G.S.; Nusinowitz, S.; Nishina, P.M.; Schneider, B.S.; Smith, R.S.; Roderick, T.H.; Davisson, M.T.; Heckenlively, J.R. Retinal degeneration 6 (rd6): A new mouse model for human retinitis punctata albescens. Investig. Ophthalmol. Vis. Sci. 2000, 41, 3149–3157. [Google Scholar]
- Rice, D.S.; Calandria, J.M.; Gordon, W.C.; Jun, B.; Zhou, Y.; Gelfman, C.M.; Li, S.; Jin, M.; Knott, E.J.; Chang, B.; et al. Adiponectin receptor 1 conserves docosahexaenoic acid and promotes photoreceptor cell survival. Nat. Commun. 2015, 6, 6228. [Google Scholar] [CrossRef] [Green Version]
- Zhang, J.; Wang, C.; Shen, Y.; Chen, N.; Wang, L.; Liang, L.; Guo, T.; Yin, X.; Ma, Z.; Zhang, B.; et al. A mutation in ADIPOR1 causes nonsyndromic autosomal dominant retinitis pigmentosa. Hum. Genet. 2016, 135, 1375–1387. [Google Scholar] [CrossRef]
- Xu, M.; Eblimit, A.; Wang, J.; Li, J.; Wang, F.; Zhao, L.; Wang, X.; Xiao, N.; Li, Y.; Wong, L.J.; et al. ADIPOR1 Is Mutated in Syndromic Retinitis Pigmentosa. Hum. Mutat. 2016, 37, 246–249. [Google Scholar] [CrossRef] [Green Version]
- Sundin, O.H.; Dharmaraj, S.; Bhutto, I.A.; Hasegawa, T.; McLeod, D.S.; Merges, C.A.; Silval, E.D.; Maumenee, I.H.; Lutty, G.A. Developmental basis of nanophthalmos: MFRP Is required for both prenatal ocular growth and postnatal emmetropization. Ophthalmic Genet. 2008, 29, 1–9. [Google Scholar] [CrossRef] [Green Version]
- Koli, S.; Labelle-Dumais, C.; Zhao, Y.; Paylakhi, S.; Nair, K.S. Identification of MFRP and the secreted serine proteases PRSS56 and ADAMTS19 as part of a molecular network involved in ocular growth regulation. PLoS Genet. 2021, 17, e1009458. [Google Scholar] [CrossRef] [PubMed]
- Kaarniranta, K.; Paananen, J.; Nevalainen, T.; Sorri, I.; Seitsonen, S.; Immonen, I.; Salminen, A.; Pulkkinen, L.; Uusitupa, M. Adiponectin receptor 1 gene (ADIPOR1) variant is associated with advanced age-related macular degeneration in Finnish population. Neurosci. Lett. 2012, 513, 233–237. [Google Scholar] [CrossRef] [PubMed]
- Osada, H.; Toda, E.; Homma, K.; Guzman, N.A.; Nagai, N.; Ogawa, M.; Negishi, K.; Arita, M.; Tsubota, K.; Ozawa, Y. ADIPOR1 deficiency-induced suppression of retinal ELOVL2 and docosahexaenoic acid levels during photoreceptor degeneration and visual loss. Cell Death Dis. 2021, 12, 458. [Google Scholar] [CrossRef] [PubMed]
- Kautzmann, M.I.; Gordon, W.C.; Jun, B.; Do, K.V.; Matherne, B.J.; Fang, Z.; Bazan, N.G. Membrane-type frizzled-related protein regulates lipidome and transcription for photoreceptor function. FASEB J. 2020, 34, 912–929. [Google Scholar] [CrossRef] [PubMed] [Green Version]
- Sun, S.; Baryshnikova, A.; Brandt, N.; Gresham, D. Genetic interaction profiles of regulatory kinases differ between environmental conditions and cellular states. Mol. Syst. Biol. 2020, 16, e9167. [Google Scholar] [CrossRef] [PubMed]
- Billmann, M.; Horn, T.; Fischer, B.; Sandmann, T.; Huber, W.; Boutros, M. A genetic interaction map of cell cycle regulators. Mol. Biol. Cell 2016, 27, 1397–1407. [Google Scholar] [CrossRef]
- Costanzo, M.; VanderSluis, B.; Koch, E.N.; Baryshnikova, A.; Pons, C.; Tan, G.; Wang, W.; Usaj, M.; Hanchard, J.; Lee, S.D.; et al. A global genetic interaction network maps a wiring diagram of cellular function. Science 2016, 353. [Google Scholar] [CrossRef]
- Boucher, B.; Jenna, S. Genetic interaction networks: Better understand to better predict. Front. Genet. 2013, 4, 290. [Google Scholar] [CrossRef] [Green Version]
- Chakraborty, R.; Read, S.A.; Vincent, S.J. Understanding Myopia: Pathogenesis and Mechanisms. In Updates on Myopia; Ang, M., Wong, T.Y., Eds.; Springer: Singapore, 2020; pp. 65–94. [Google Scholar]
- Carter, G.W. Inferring network interactions within a cell. Brief Bioinform. 2005, 6, 380–389. [Google Scholar] [CrossRef] [Green Version]
- Papaleo, F.; Burdick, M.C.; Callicott, J.H.; Weinberger, D.R. Epistatic interaction between COMT and DTNBP1 modulates prefrontal function in mice and in humans. Mol. Psychiatry 2014, 19, 311–316. [Google Scholar] [CrossRef] [Green Version]
- Fogerty, J.; Besharse, J.C. Subretinal infiltration of monocyte derived cells and complement misregulation in mice with AMD-like pathology. Adv. Exp. Med. Biol. 2014, 801, 355–363. [Google Scholar] [CrossRef] [PubMed] [Green Version]
- Gordon, W.C.; Bazan, N.G. Docosahexaenoic acid utilization during rod photoreceptor cell renewal. J. Neurosci. 1990, 10, 2190–2202. [Google Scholar] [CrossRef] [PubMed] [Green Version]
- Gordon, W.C.; Rodriguez de Turco, E.B.; Bazan, N.G. Retinal pigment epithelial cells play a central role in the conservation of docosahexaenoic acid by photoreceptor cells after shedding and phagocytosis. Curr. Eye Res. 1992, 11, 73–83. [Google Scholar] [CrossRef] [PubMed]
- Gordon, W.C.; Bazan, N.G. Visualization of [3H]docosahexaenoic acid trafficking through photoreceptors and retinal pigment epithelium by electron microscopic autoradiography. Investig. Ophthalmol. Vis. Sci. 1993, 34, 2402–2411. [Google Scholar]
- Bazan, N.G. Overview of how N32 and N34 elovanoids sustain sight by protecting retinal pigment epithelial cells and photoreceptors. J. Lipid Res. 2021, 62, 100058. [Google Scholar] [CrossRef]
- Sluch, V.M.; Banks, A.; Li, H.; Crowley, M.A.; Davis, V.; Xiang, C.; Yang, J.; Demirs, J.T.; Vrouvlianis, J.; Leehy, B.; et al. ADIPOR1 is essential for vision and its RPE expression is lost in the Mfrp(rd6) mouse. Sci. Rep. 2018, 8, 14339. [Google Scholar] [CrossRef] [Green Version]
- Almoallem, B.; Arno, G.; De Zaeytijd, J.; Verdin, H.; Balikova, I.; Casteels, I.; de Ravel, T.; Hull, S.; Suzani, M.; Destree, A.; et al. The majority of autosomal recessive nanophthalmos and posterior microphthalmia can be attributed to biallelic sequence and structural variants in MFRP and PRSS56. Sci. Rep. 2020, 10, 1289. [Google Scholar] [CrossRef]
- Collery, R.F.; Volberding, P.J.; Bostrom, J.R.; Link, B.A.; Besharse, J.C. Loss of Zebrafish Mfrp Causes Nanophthalmia, Hyperopia, and Accumulation of Subretinal Macrophages. Investig. Ophthalmol. Vis. Sci. 2016, 57, 6805–6814. [Google Scholar] [CrossRef]
- Fuhrmann, S. Wnt signaling in eye organogenesis. Organogenesis 2008, 4, 60–67. [Google Scholar] [CrossRef] [Green Version]
- Katoh, M. Molecular cloning and characterization of MFRP, a novel gene encoding a membrane-type Frizzled-related protein. Biochem. Biophys. Res. Commun. 2001, 282, 116–123. [Google Scholar] [CrossRef]
- Krebs, M.P.; Xiao, M.; Sheppard, K.; Hicks, W.; Nishina, P.M. Bright-Field Imaging and Optical Coherence Tomography of the Mouse Posterior Eye. Methods Mol. Biol 2016, 1438, 395–415. [Google Scholar] [CrossRef] [PubMed]
- Schindelin, J.; Arganda-Carreras, I.; Frise, E.; Kaynig, V.; Longair, M.; Pietzsch, T.; Preibisch, S.; Rueden, C.; Saalfeld, S.; Schmid, B.; et al. Fiji: An open-source platform for biological-image analysis. Nat. Methods 2012, 9, 676–682. [Google Scholar] [CrossRef] [PubMed] [Green Version]
- Schaeffel, F.; Burkhardt, E.; Howland, H.C.; Williams, R.W. Measurement of refractive state and deprivation myopia in two strains of mice. Optom. Vis. Sci. 2004, 81, 99–110. [Google Scholar] [CrossRef] [PubMed]


Publisher’s Note: MDPI stays neutral with regard to jurisdictional claims in published maps and institutional affiliations. |
© 2022 by the authors. Licensee MDPI, Basel, Switzerland. This article is an open access article distributed under the terms and conditions of the Creative Commons Attribution (CC BY) license (https://creativecommons.org/licenses/by/4.0/).
Share and Cite
Gogna, N.; Weatherly, S.; Zhao, F.; Collin, G.B.; Pinkney, J.; Stone, L.; Naggert, J.K.; Carter, G.W.; Nishina, P.M. Genetic Interaction between Mfrp and Adipor1 Mutations Affect Retinal Disease Phenotypes. Int. J. Mol. Sci. 2022, 23, 1615. https://0-doi-org.brum.beds.ac.uk/10.3390/ijms23031615
Gogna N, Weatherly S, Zhao F, Collin GB, Pinkney J, Stone L, Naggert JK, Carter GW, Nishina PM. Genetic Interaction between Mfrp and Adipor1 Mutations Affect Retinal Disease Phenotypes. International Journal of Molecular Sciences. 2022; 23(3):1615. https://0-doi-org.brum.beds.ac.uk/10.3390/ijms23031615
Chicago/Turabian StyleGogna, Navdeep, Sonia Weatherly, Fuxin Zhao, Gayle B. Collin, Jai Pinkney, Lisa Stone, Jürgen K. Naggert, Gregory W. Carter, and Patsy M. Nishina. 2022. "Genetic Interaction between Mfrp and Adipor1 Mutations Affect Retinal Disease Phenotypes" International Journal of Molecular Sciences 23, no. 3: 1615. https://0-doi-org.brum.beds.ac.uk/10.3390/ijms23031615