
A Splicing Mutation in Slc4a5 Results in Retinal Detachment and Retinal Pigment Epithelium Dysfunction

 , and
, and 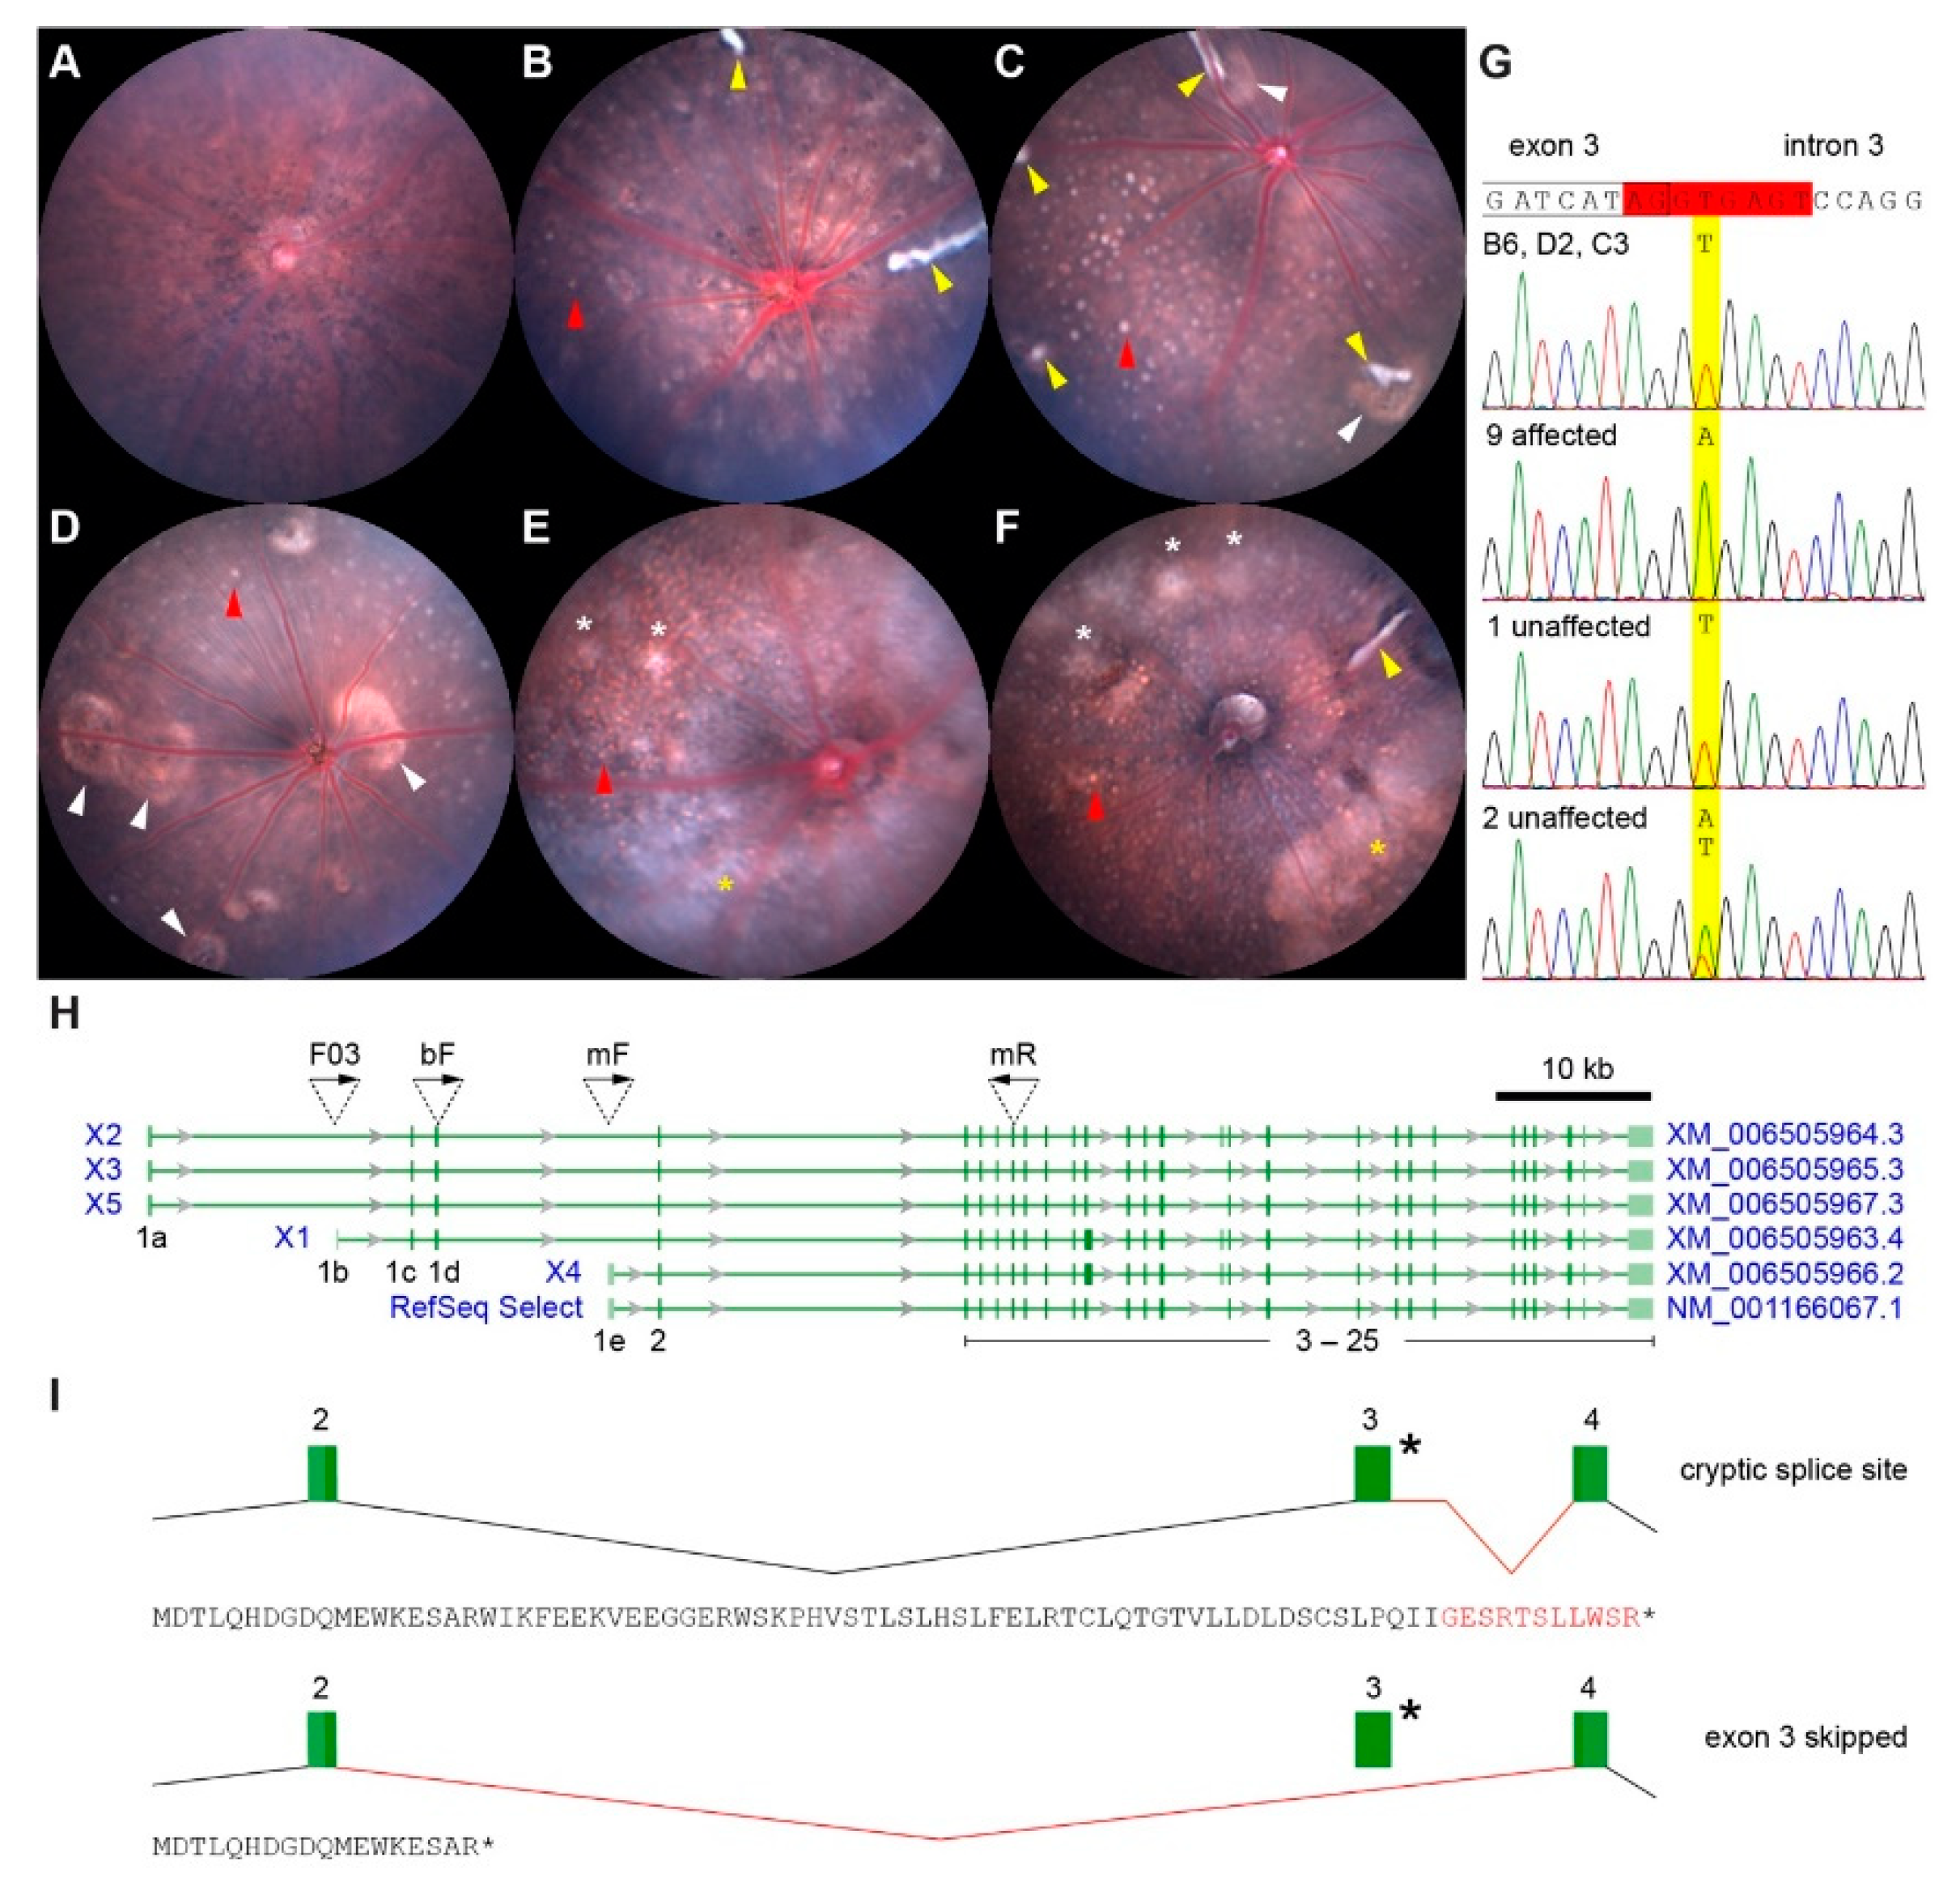
Abstract
:1. Introduction
2. Results
2.1. Identification of a New Slc4a5 Allele
2.2. Analysis of RPE Slc4a5 mRNA Transcripts
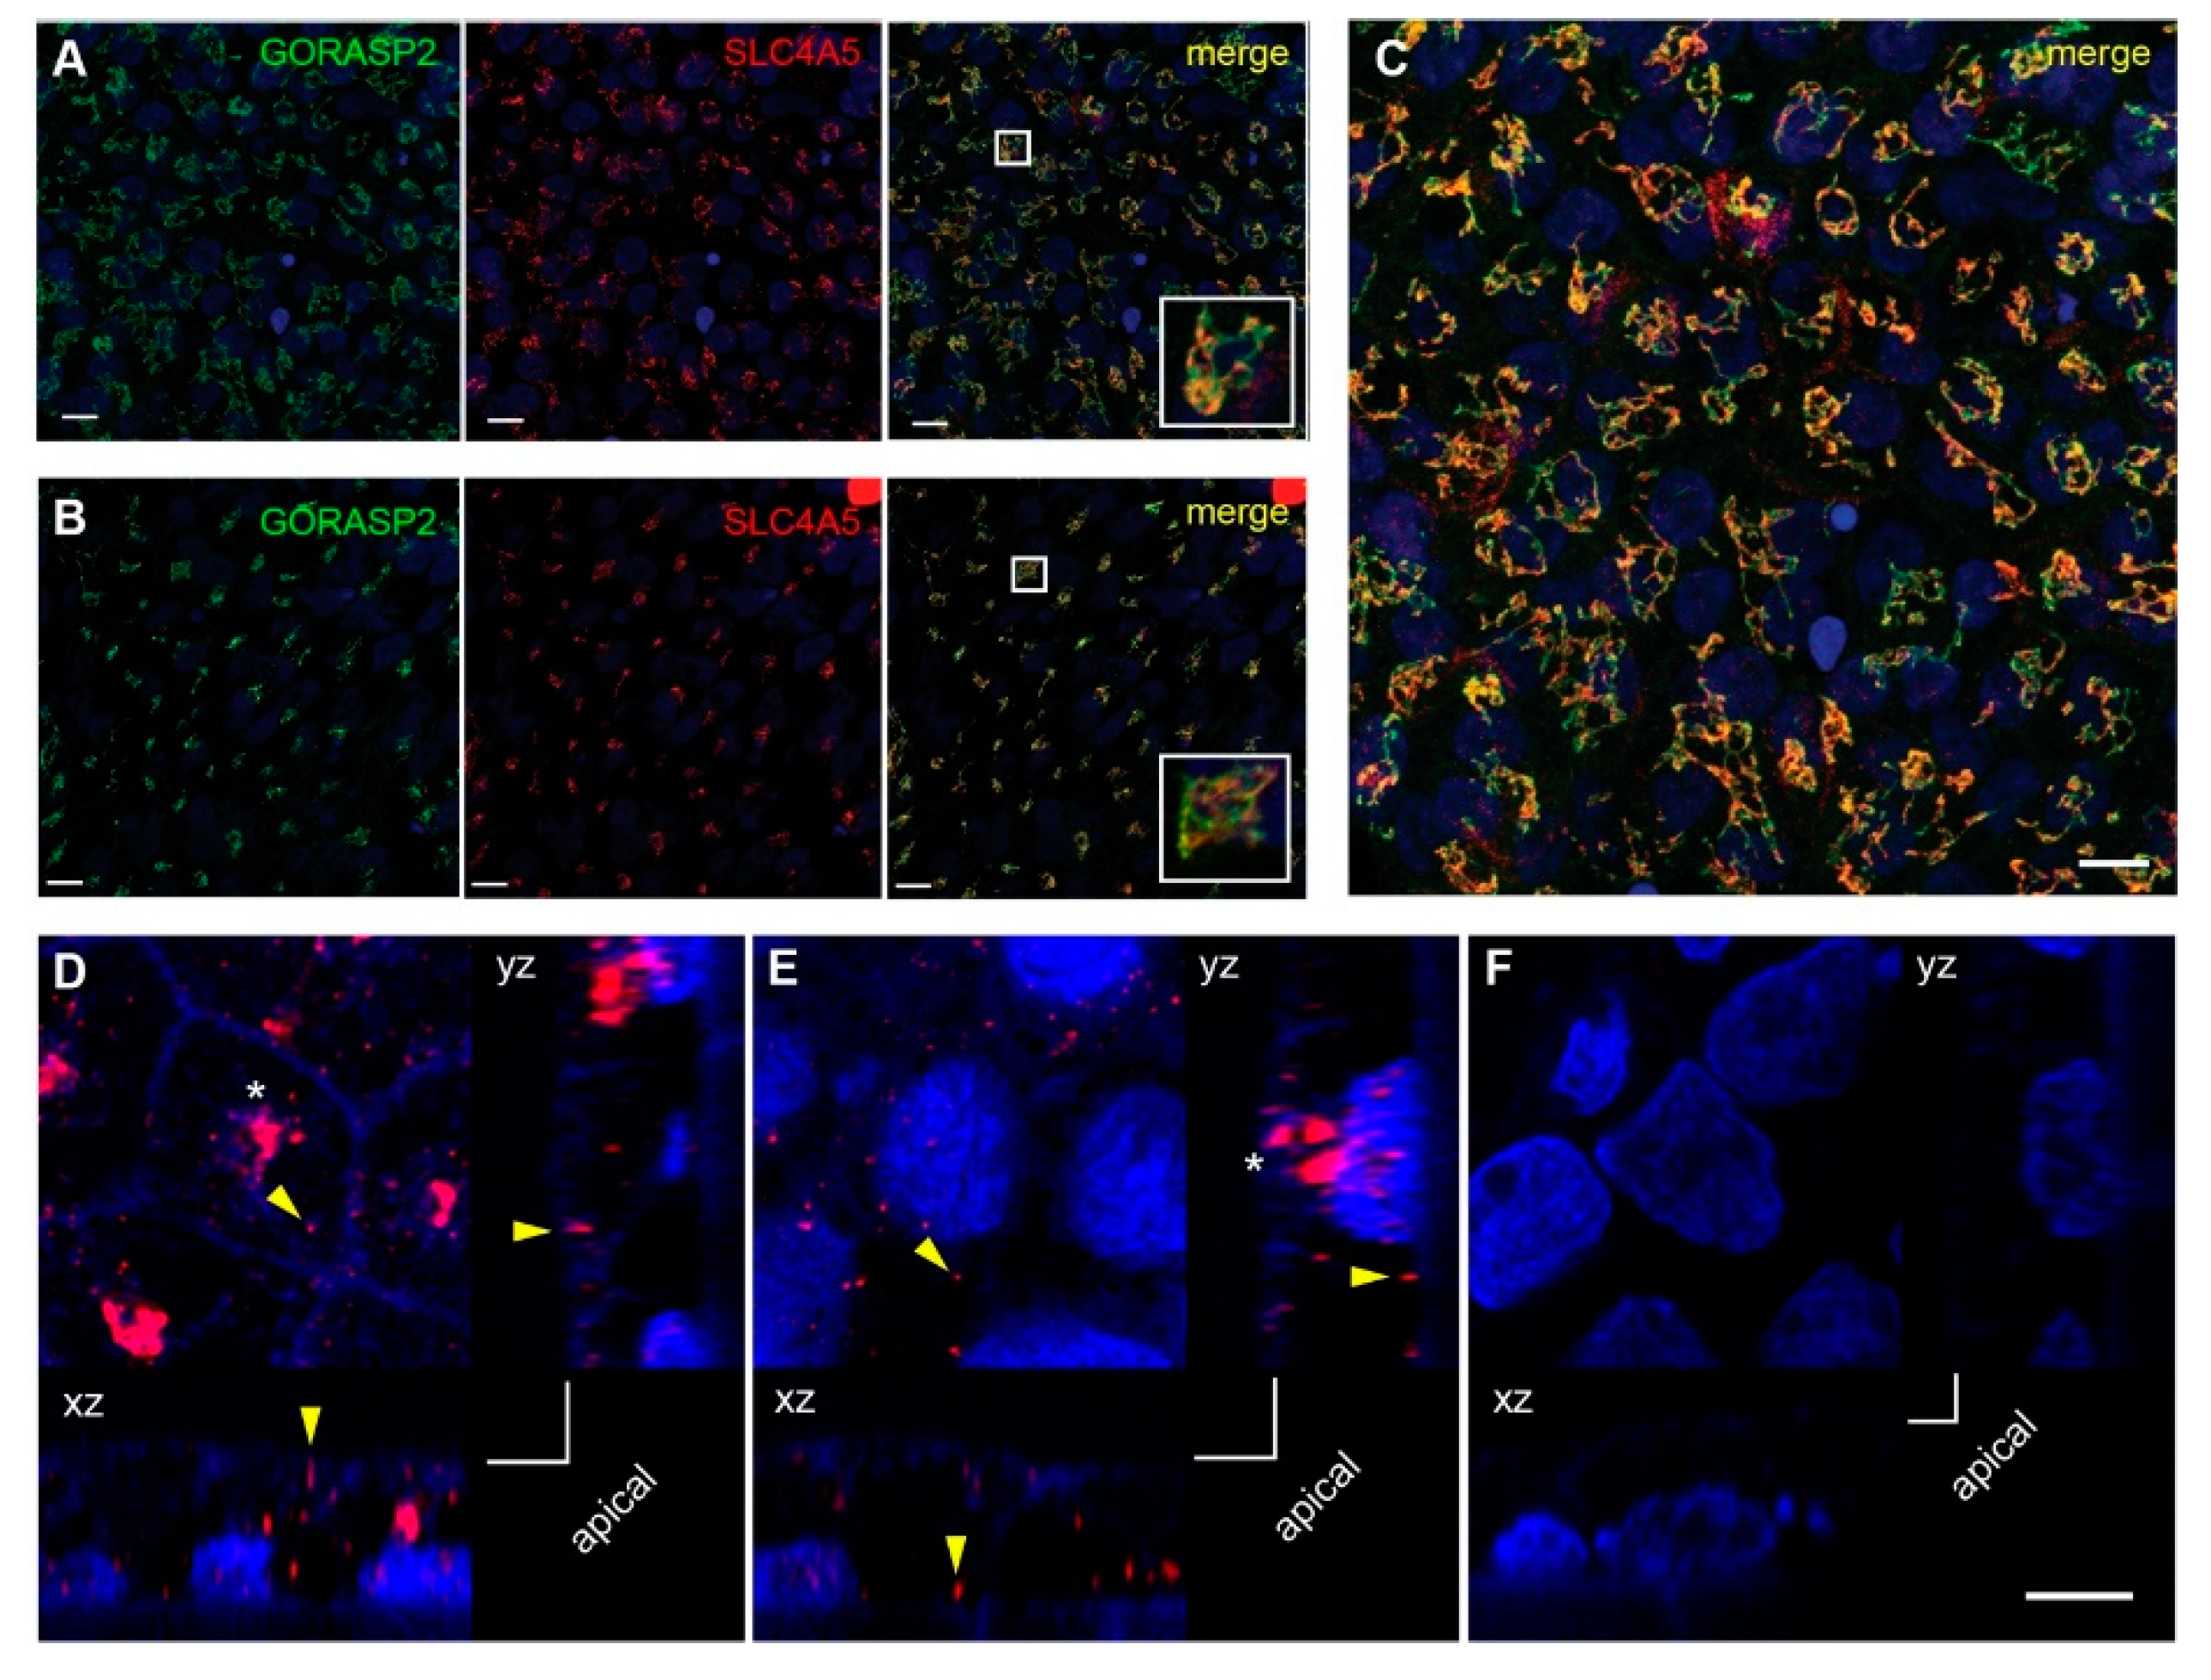
2.3. SLC4A5 Cellular Localization in Human RPE Cells
2.4. Change in Lesion Prevalence with Age and Generation
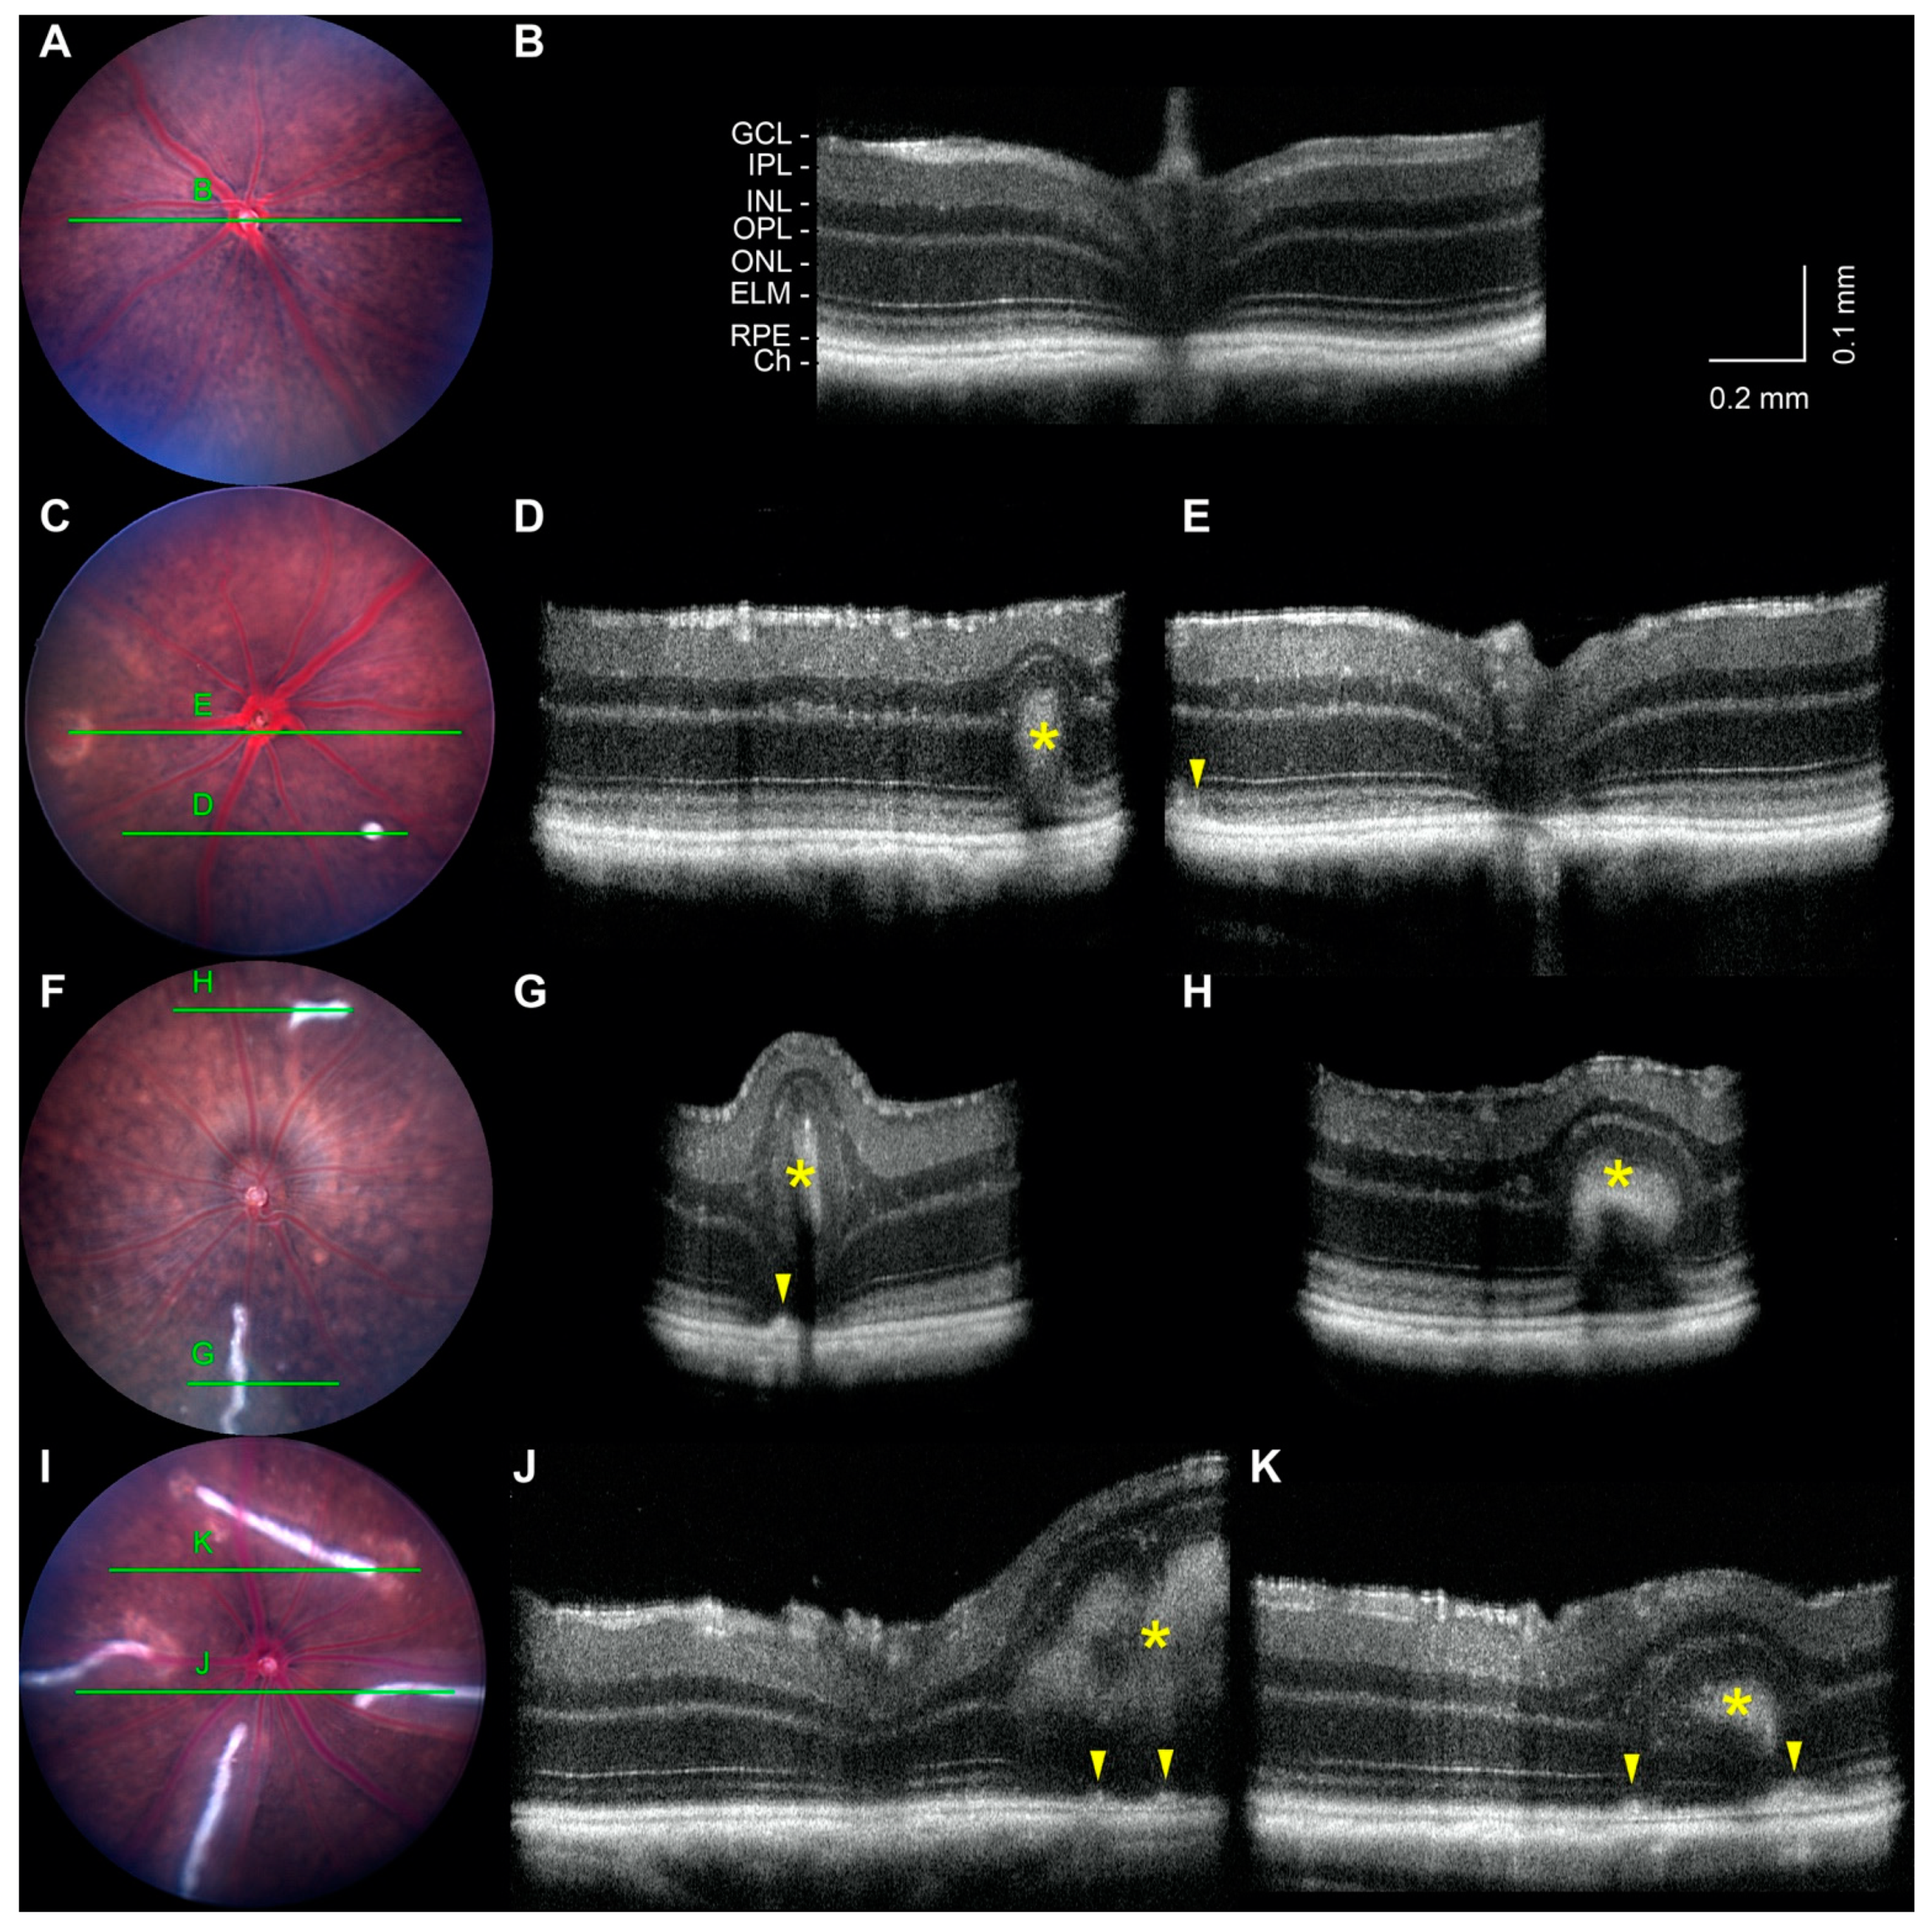
2.5. Noninvasive Imaging of White-Line Lesions and Hypopigmented Patches
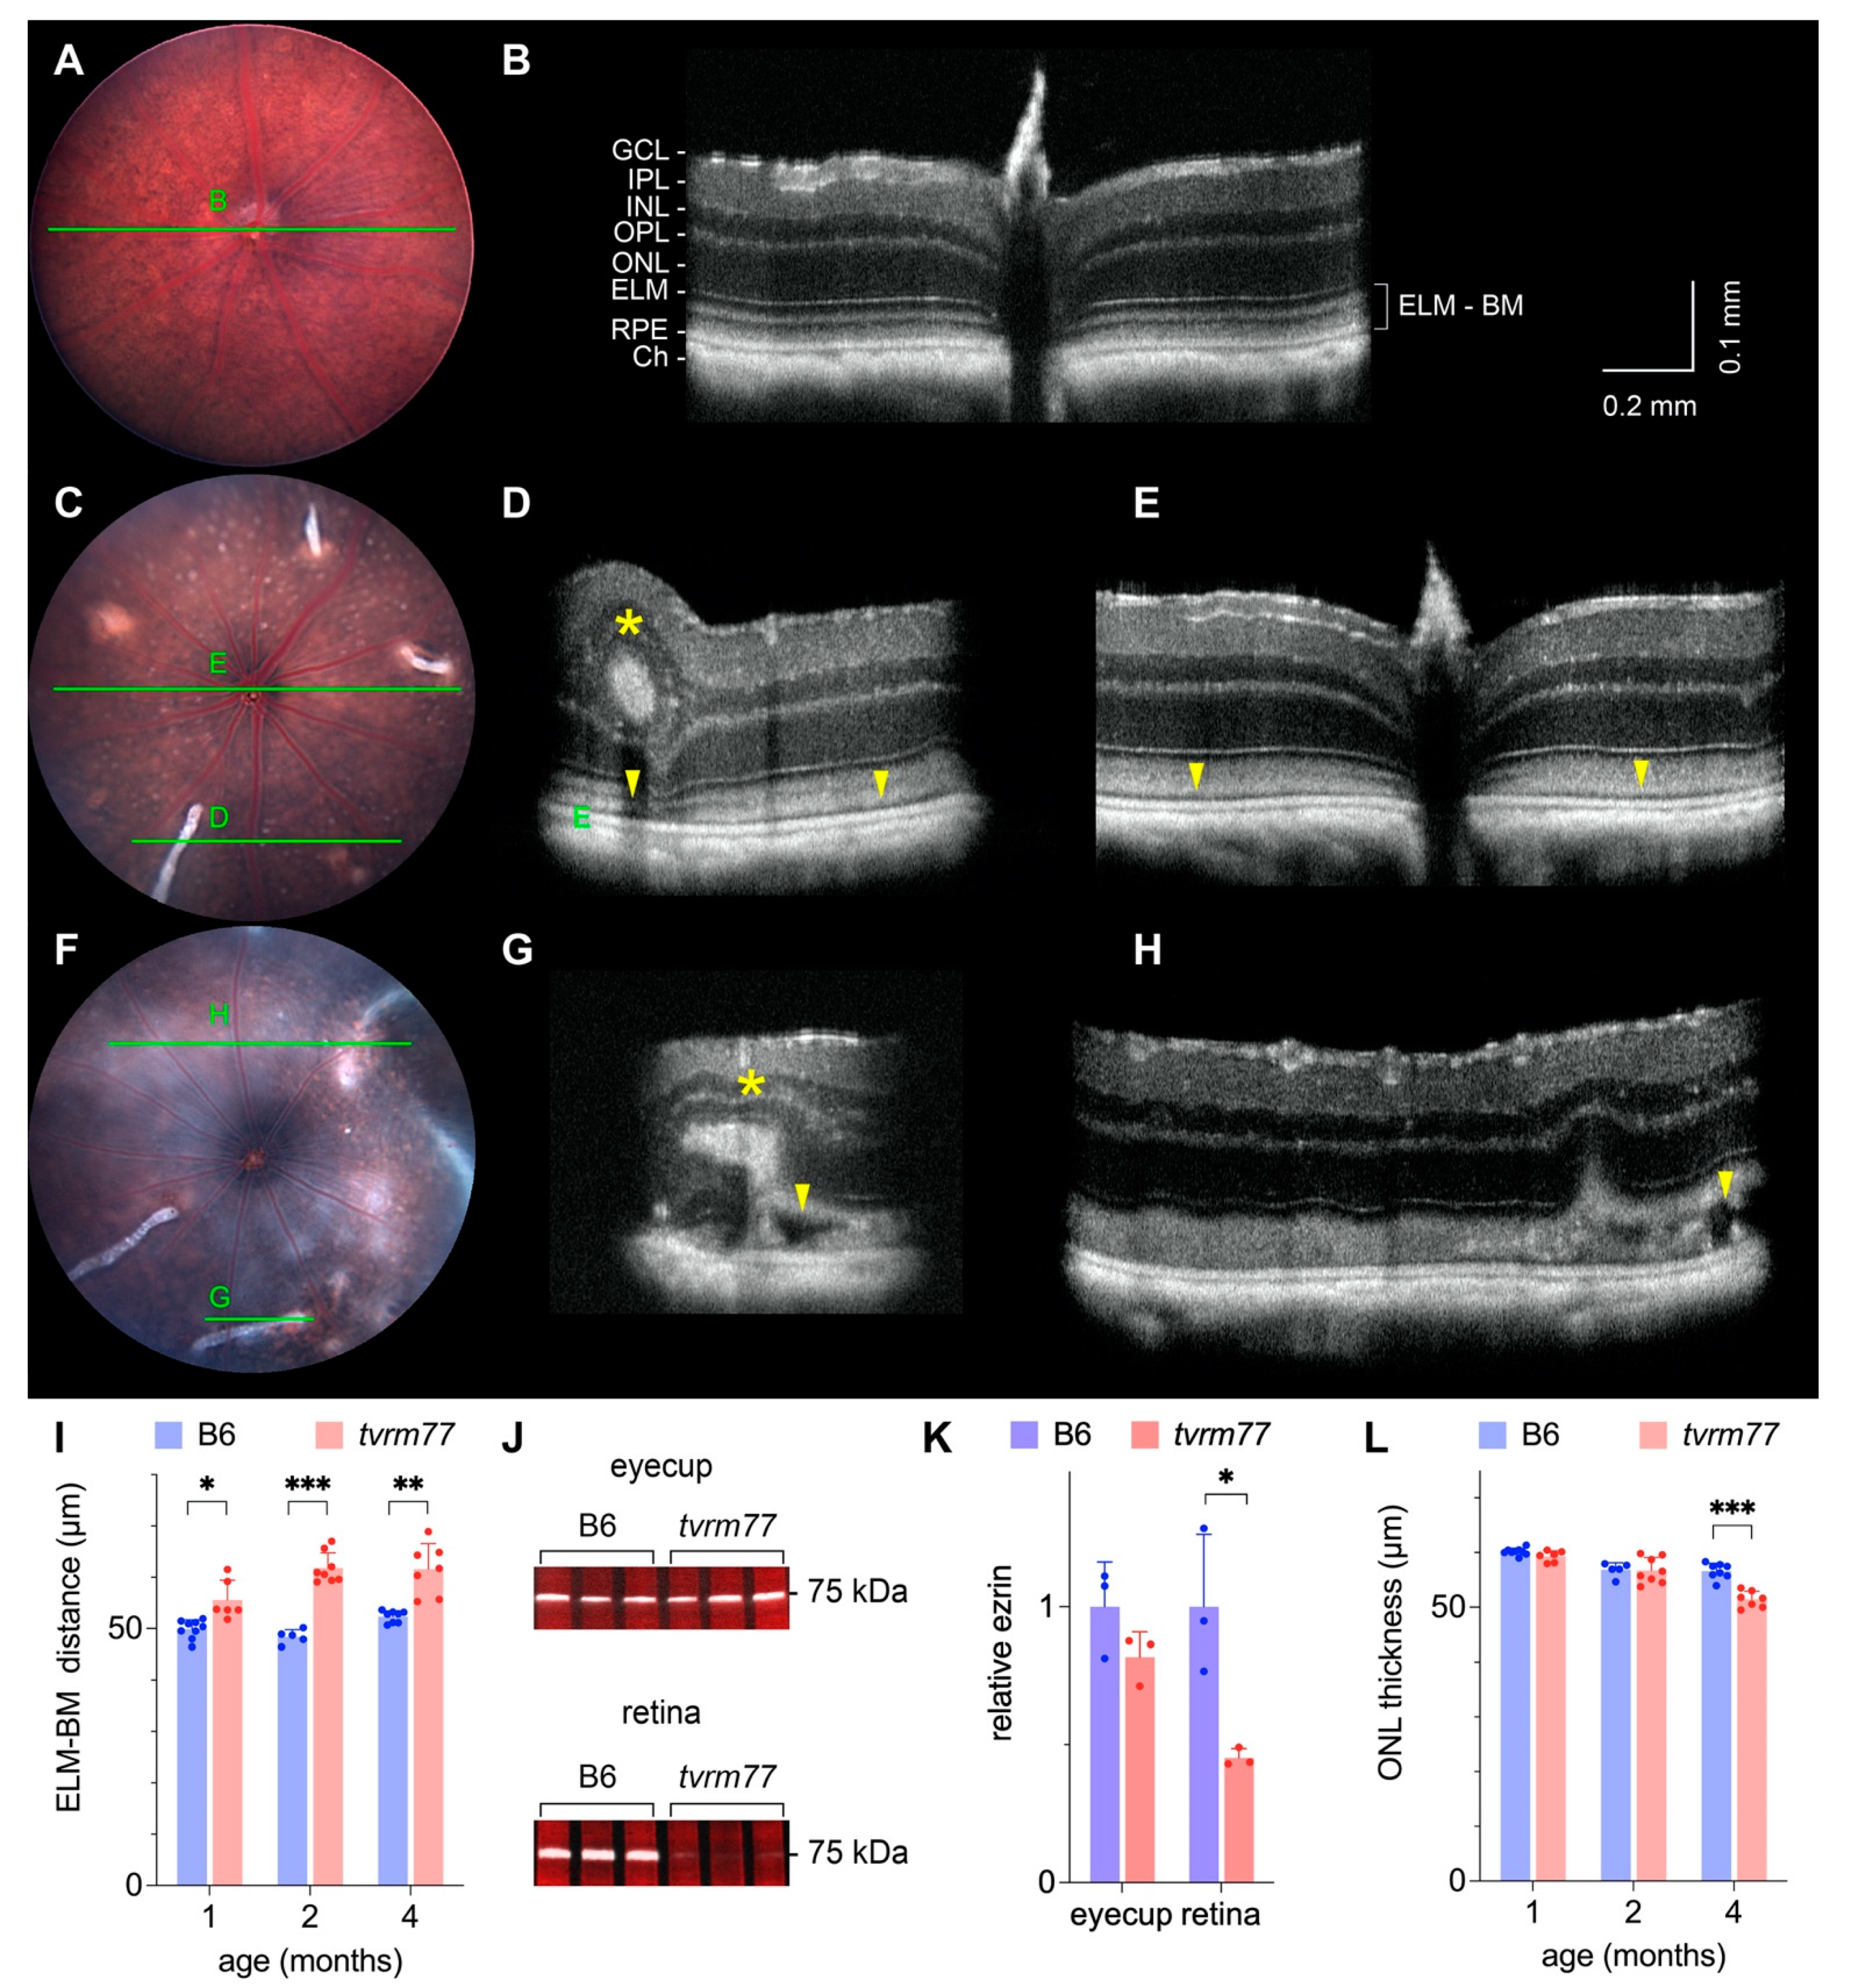
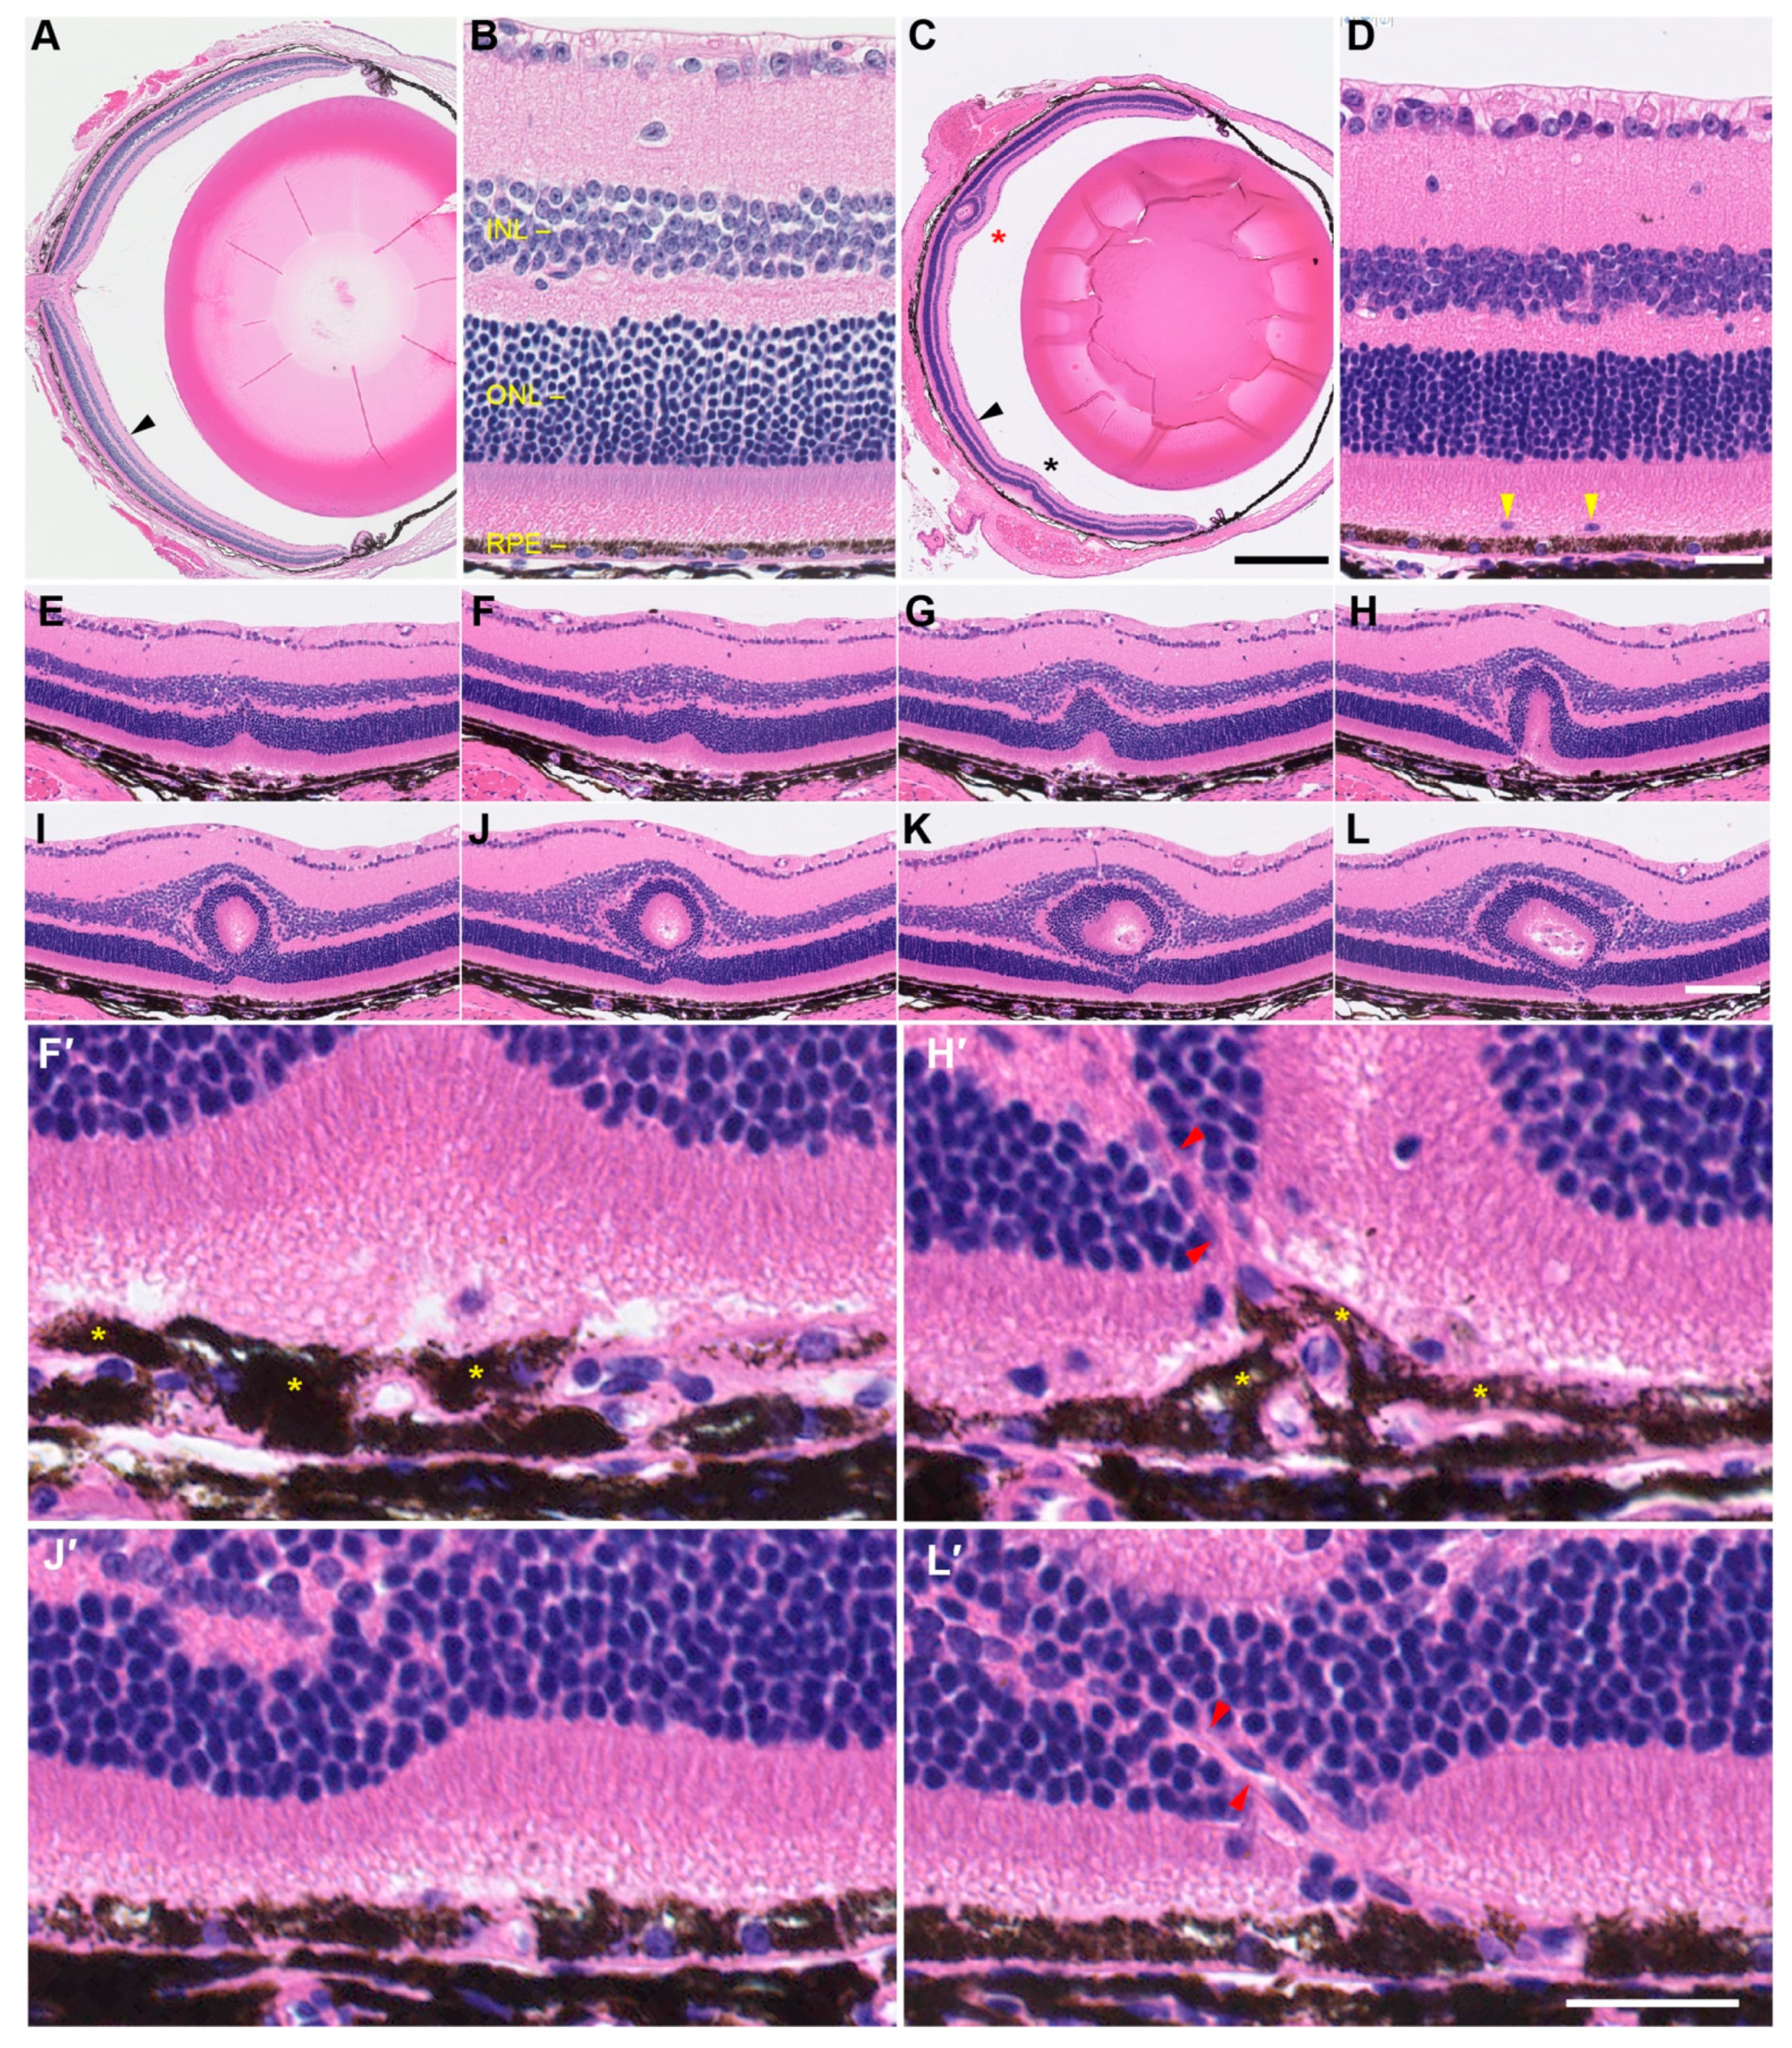
2.6. Retinal Detachment and Layer Thinning
2.7. Histological Characterization of Retinal Folds and Neovascular Lesions
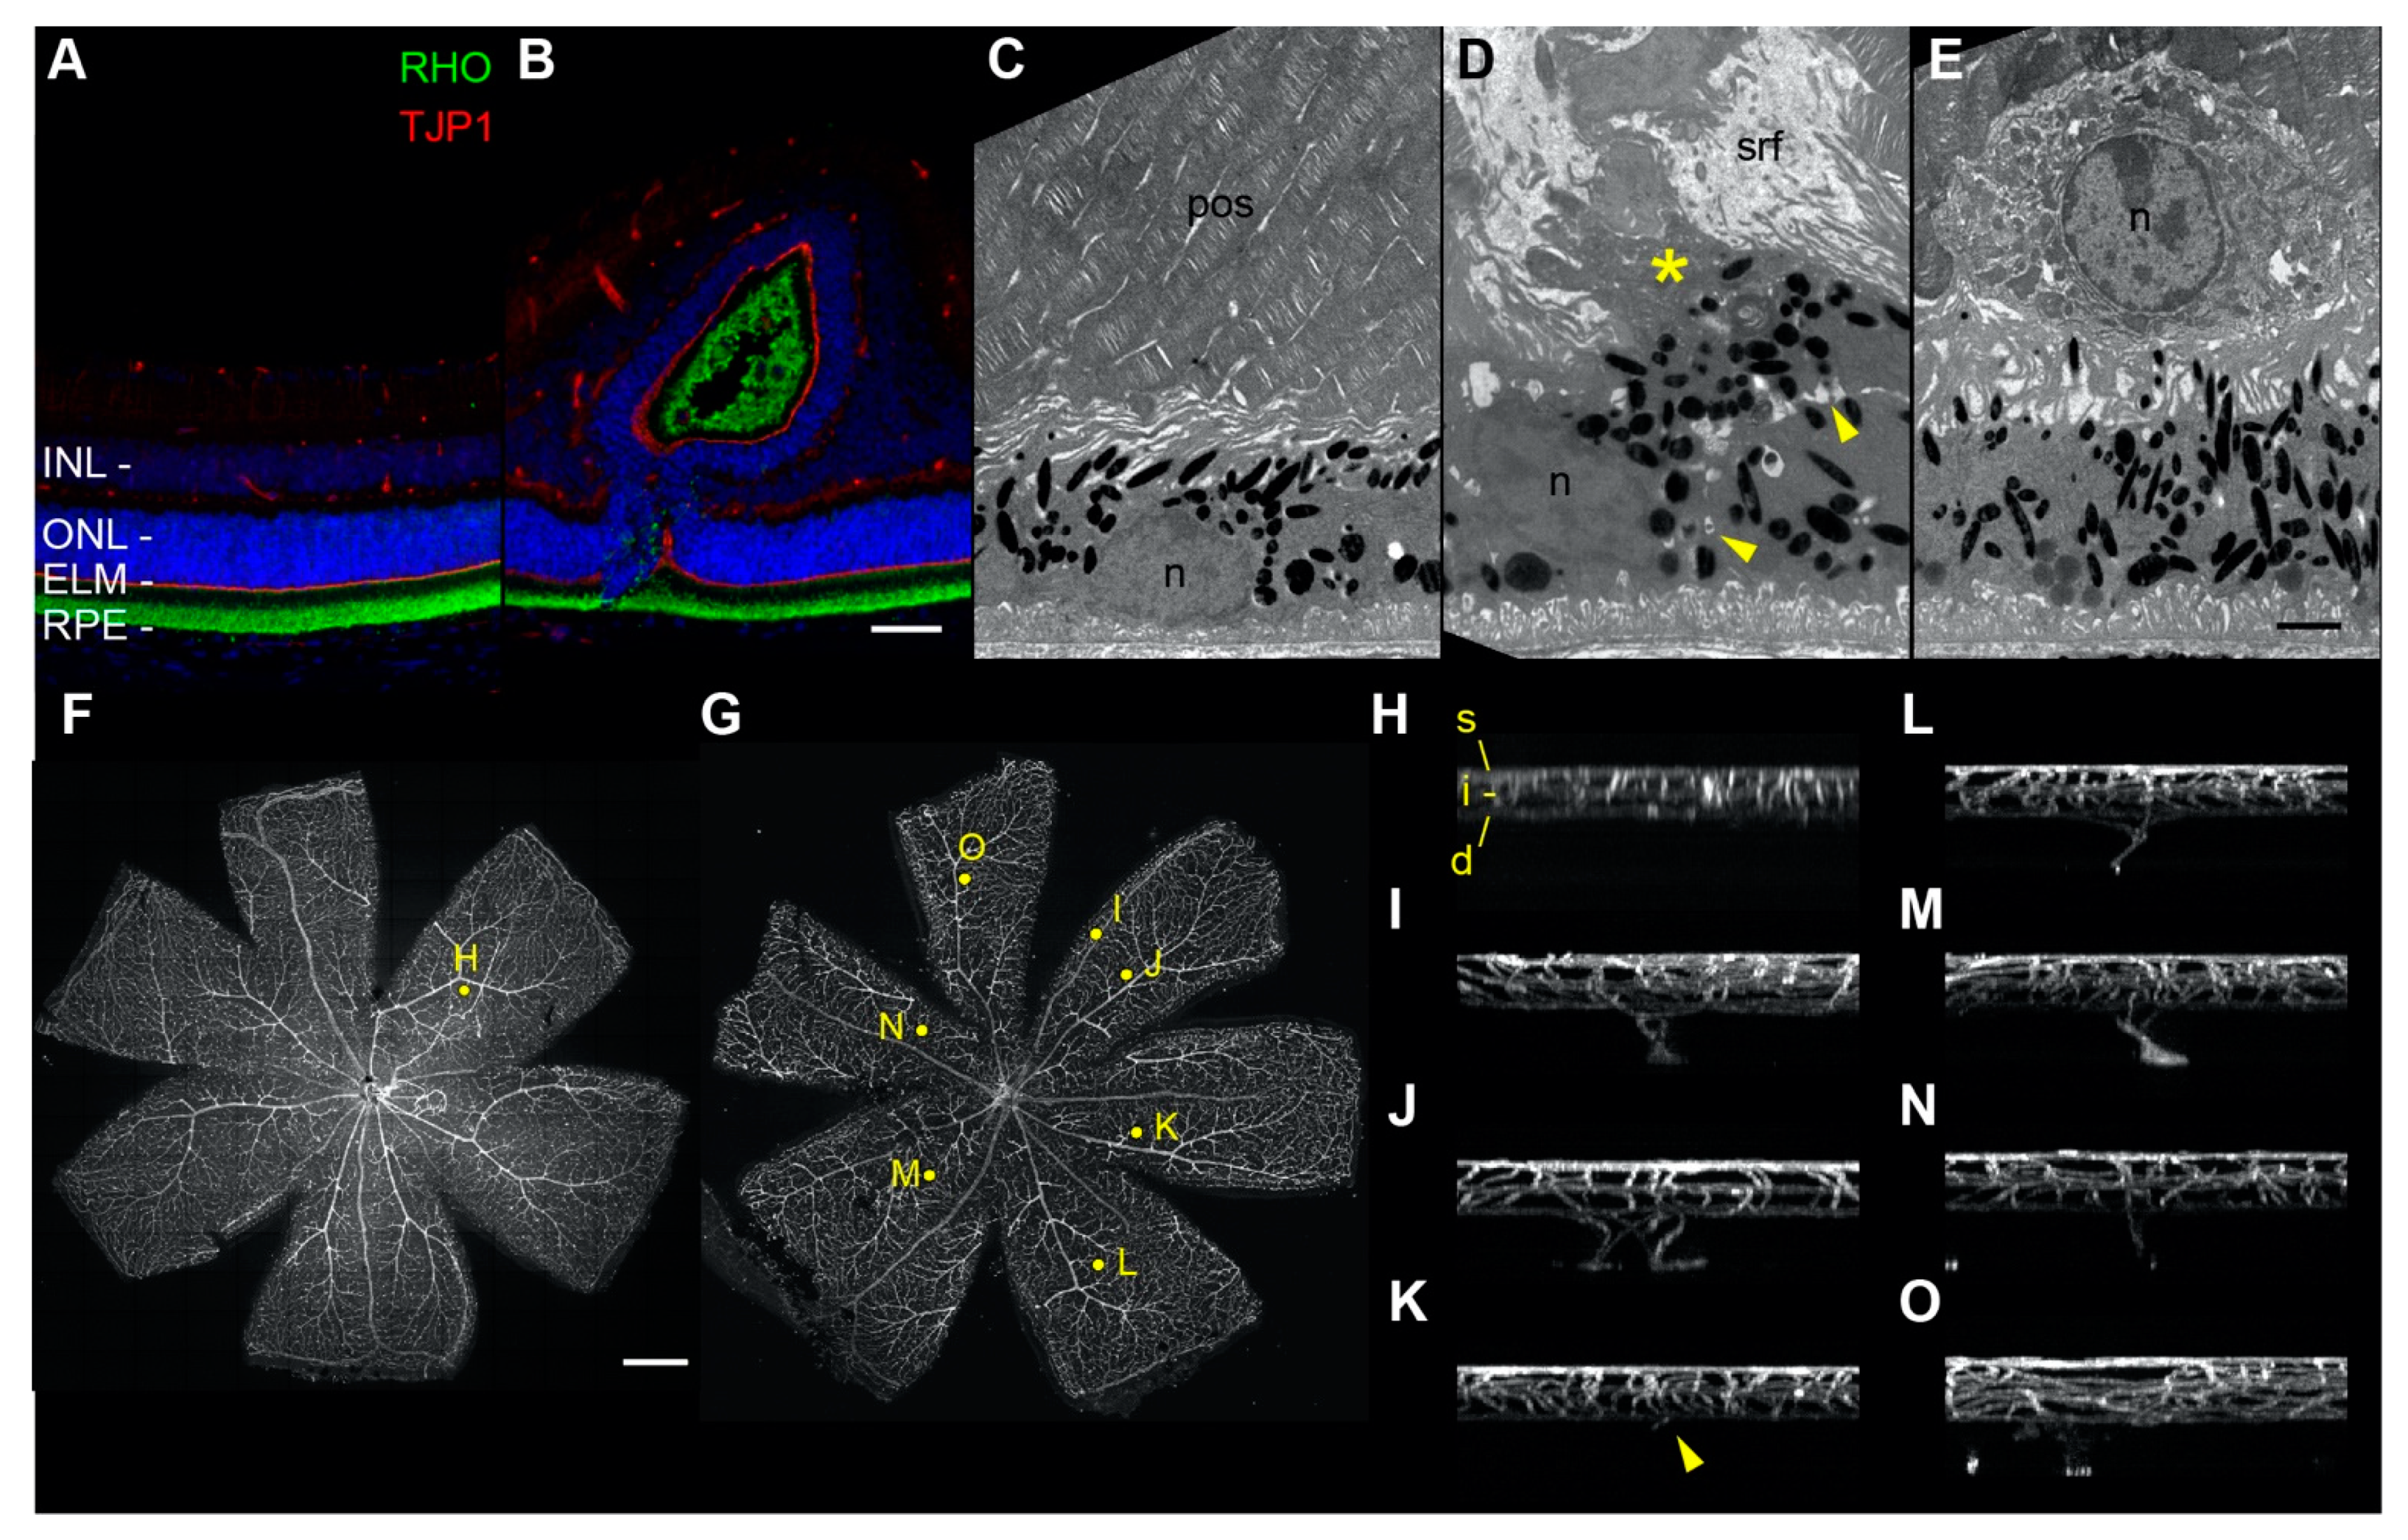
2.8. Fluorescence and Electron Microscopy of Retinal Folds, Detachment, and Neovascularization
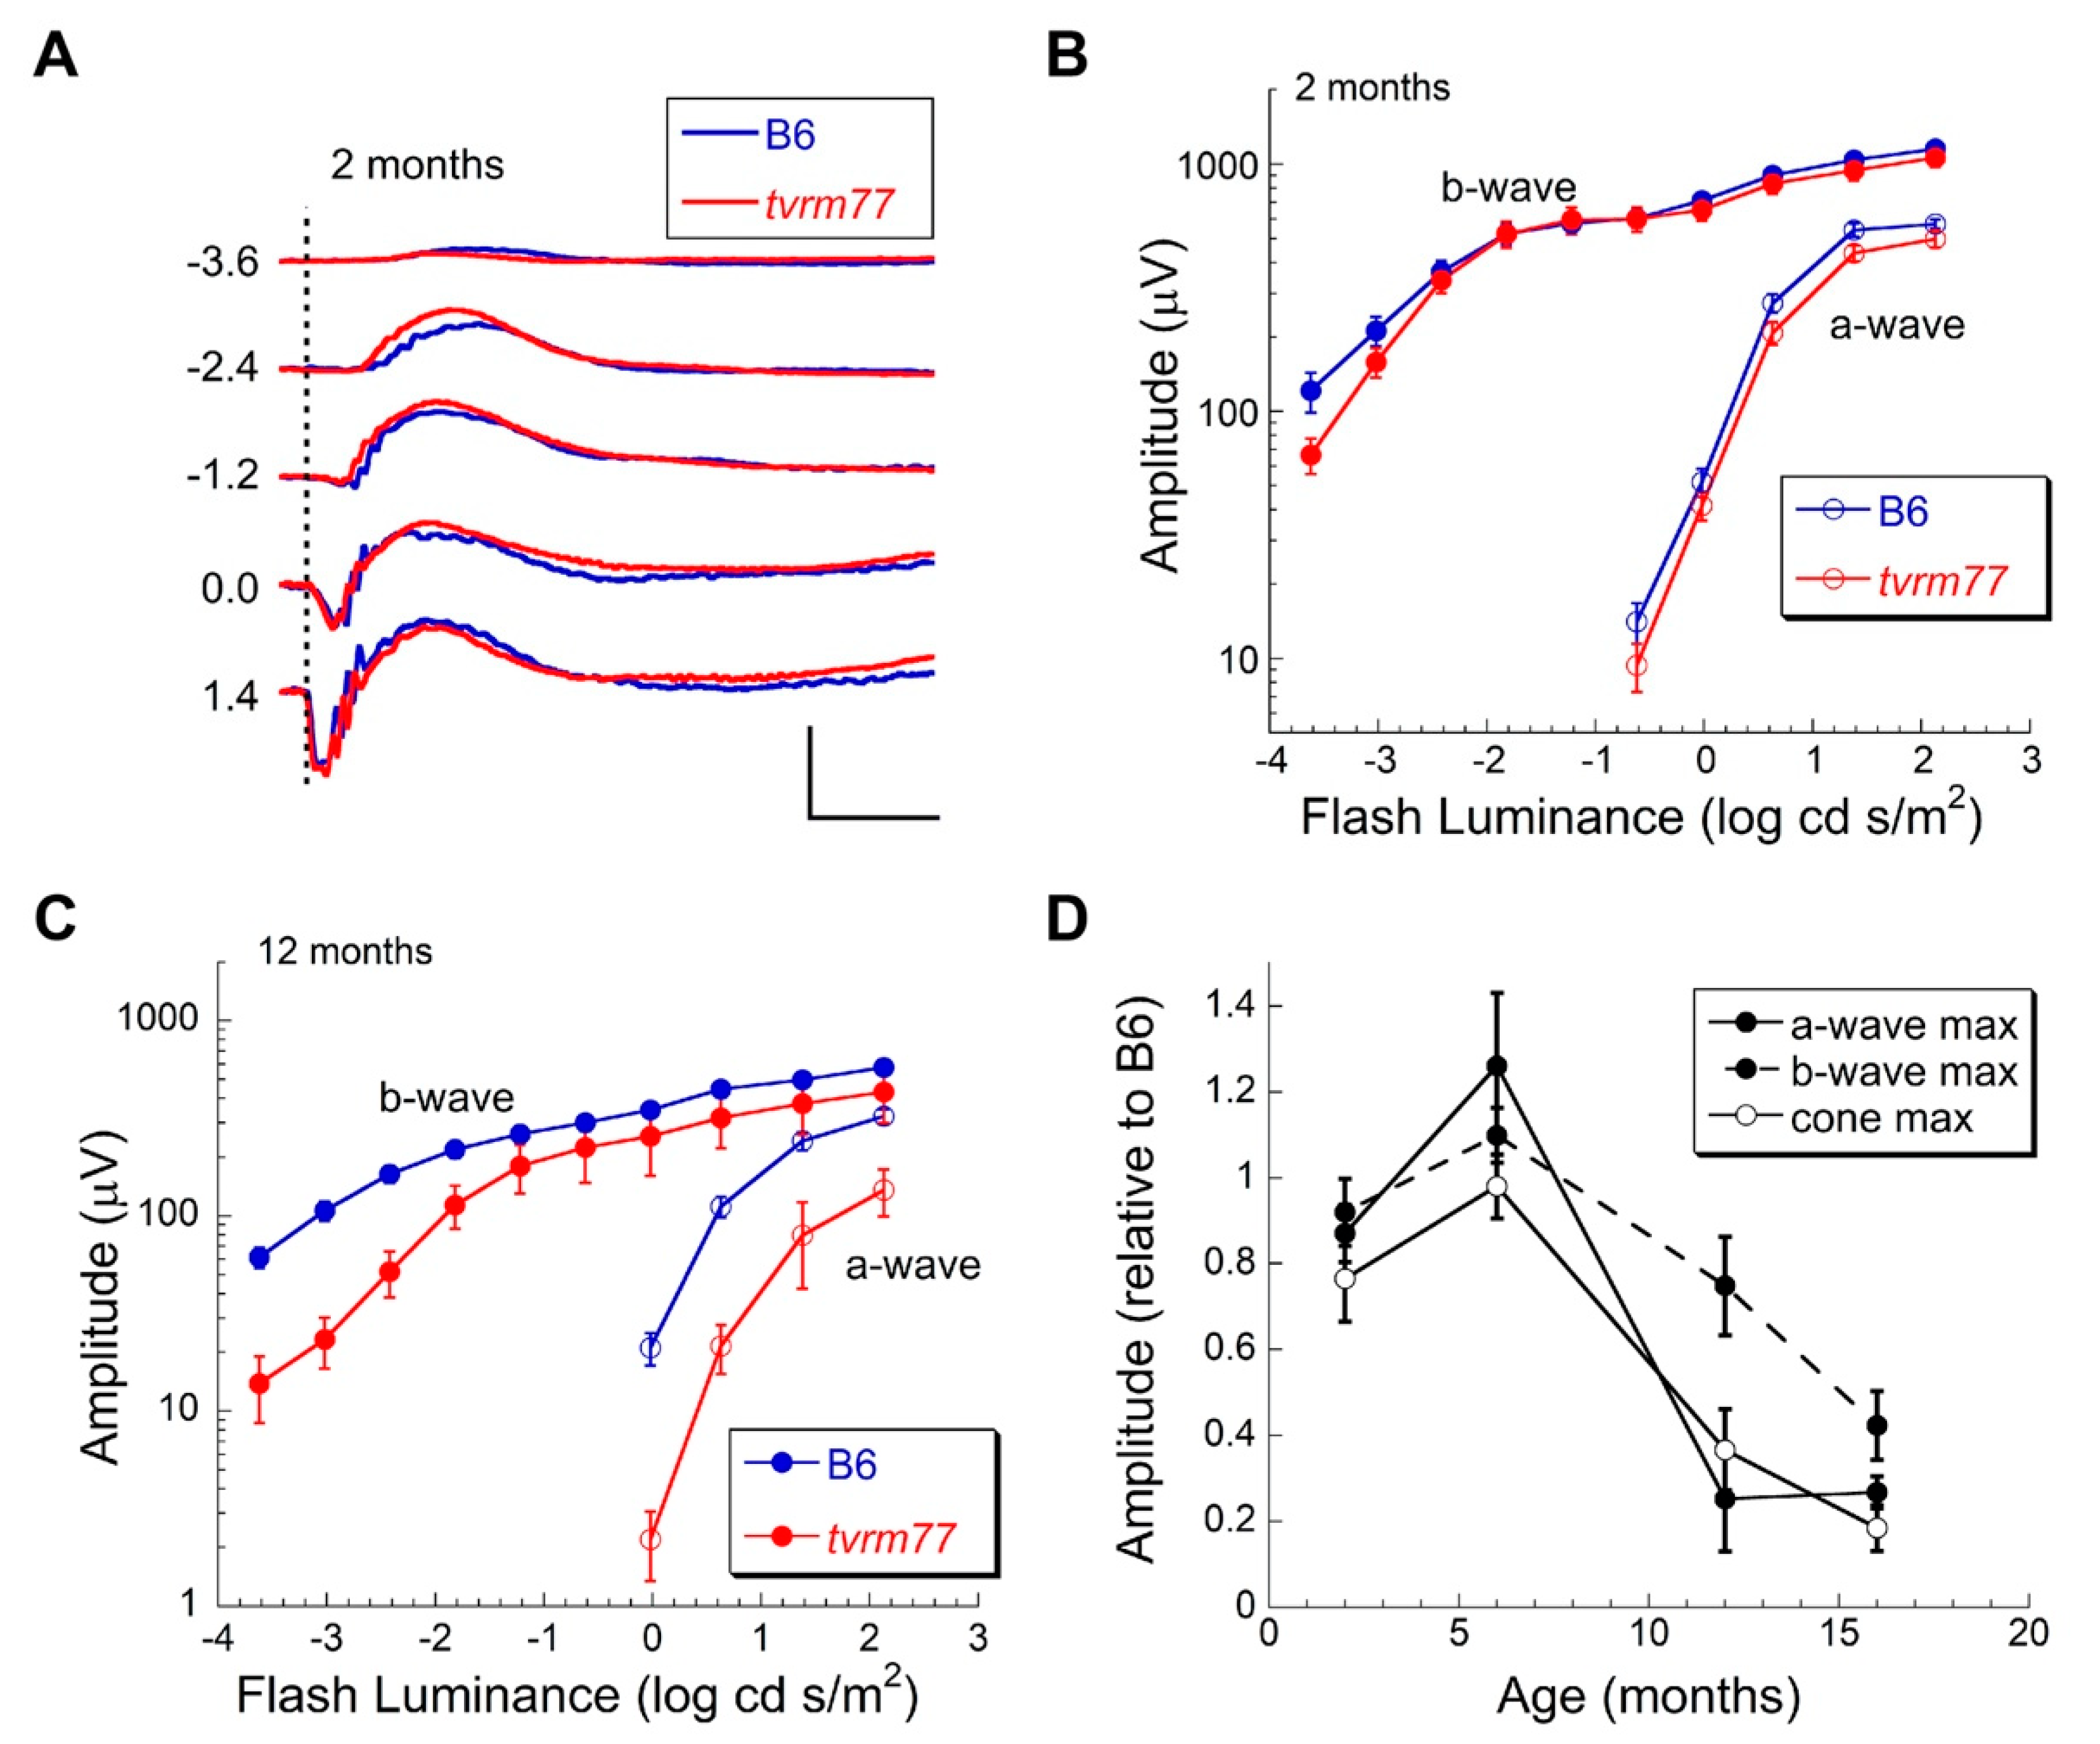
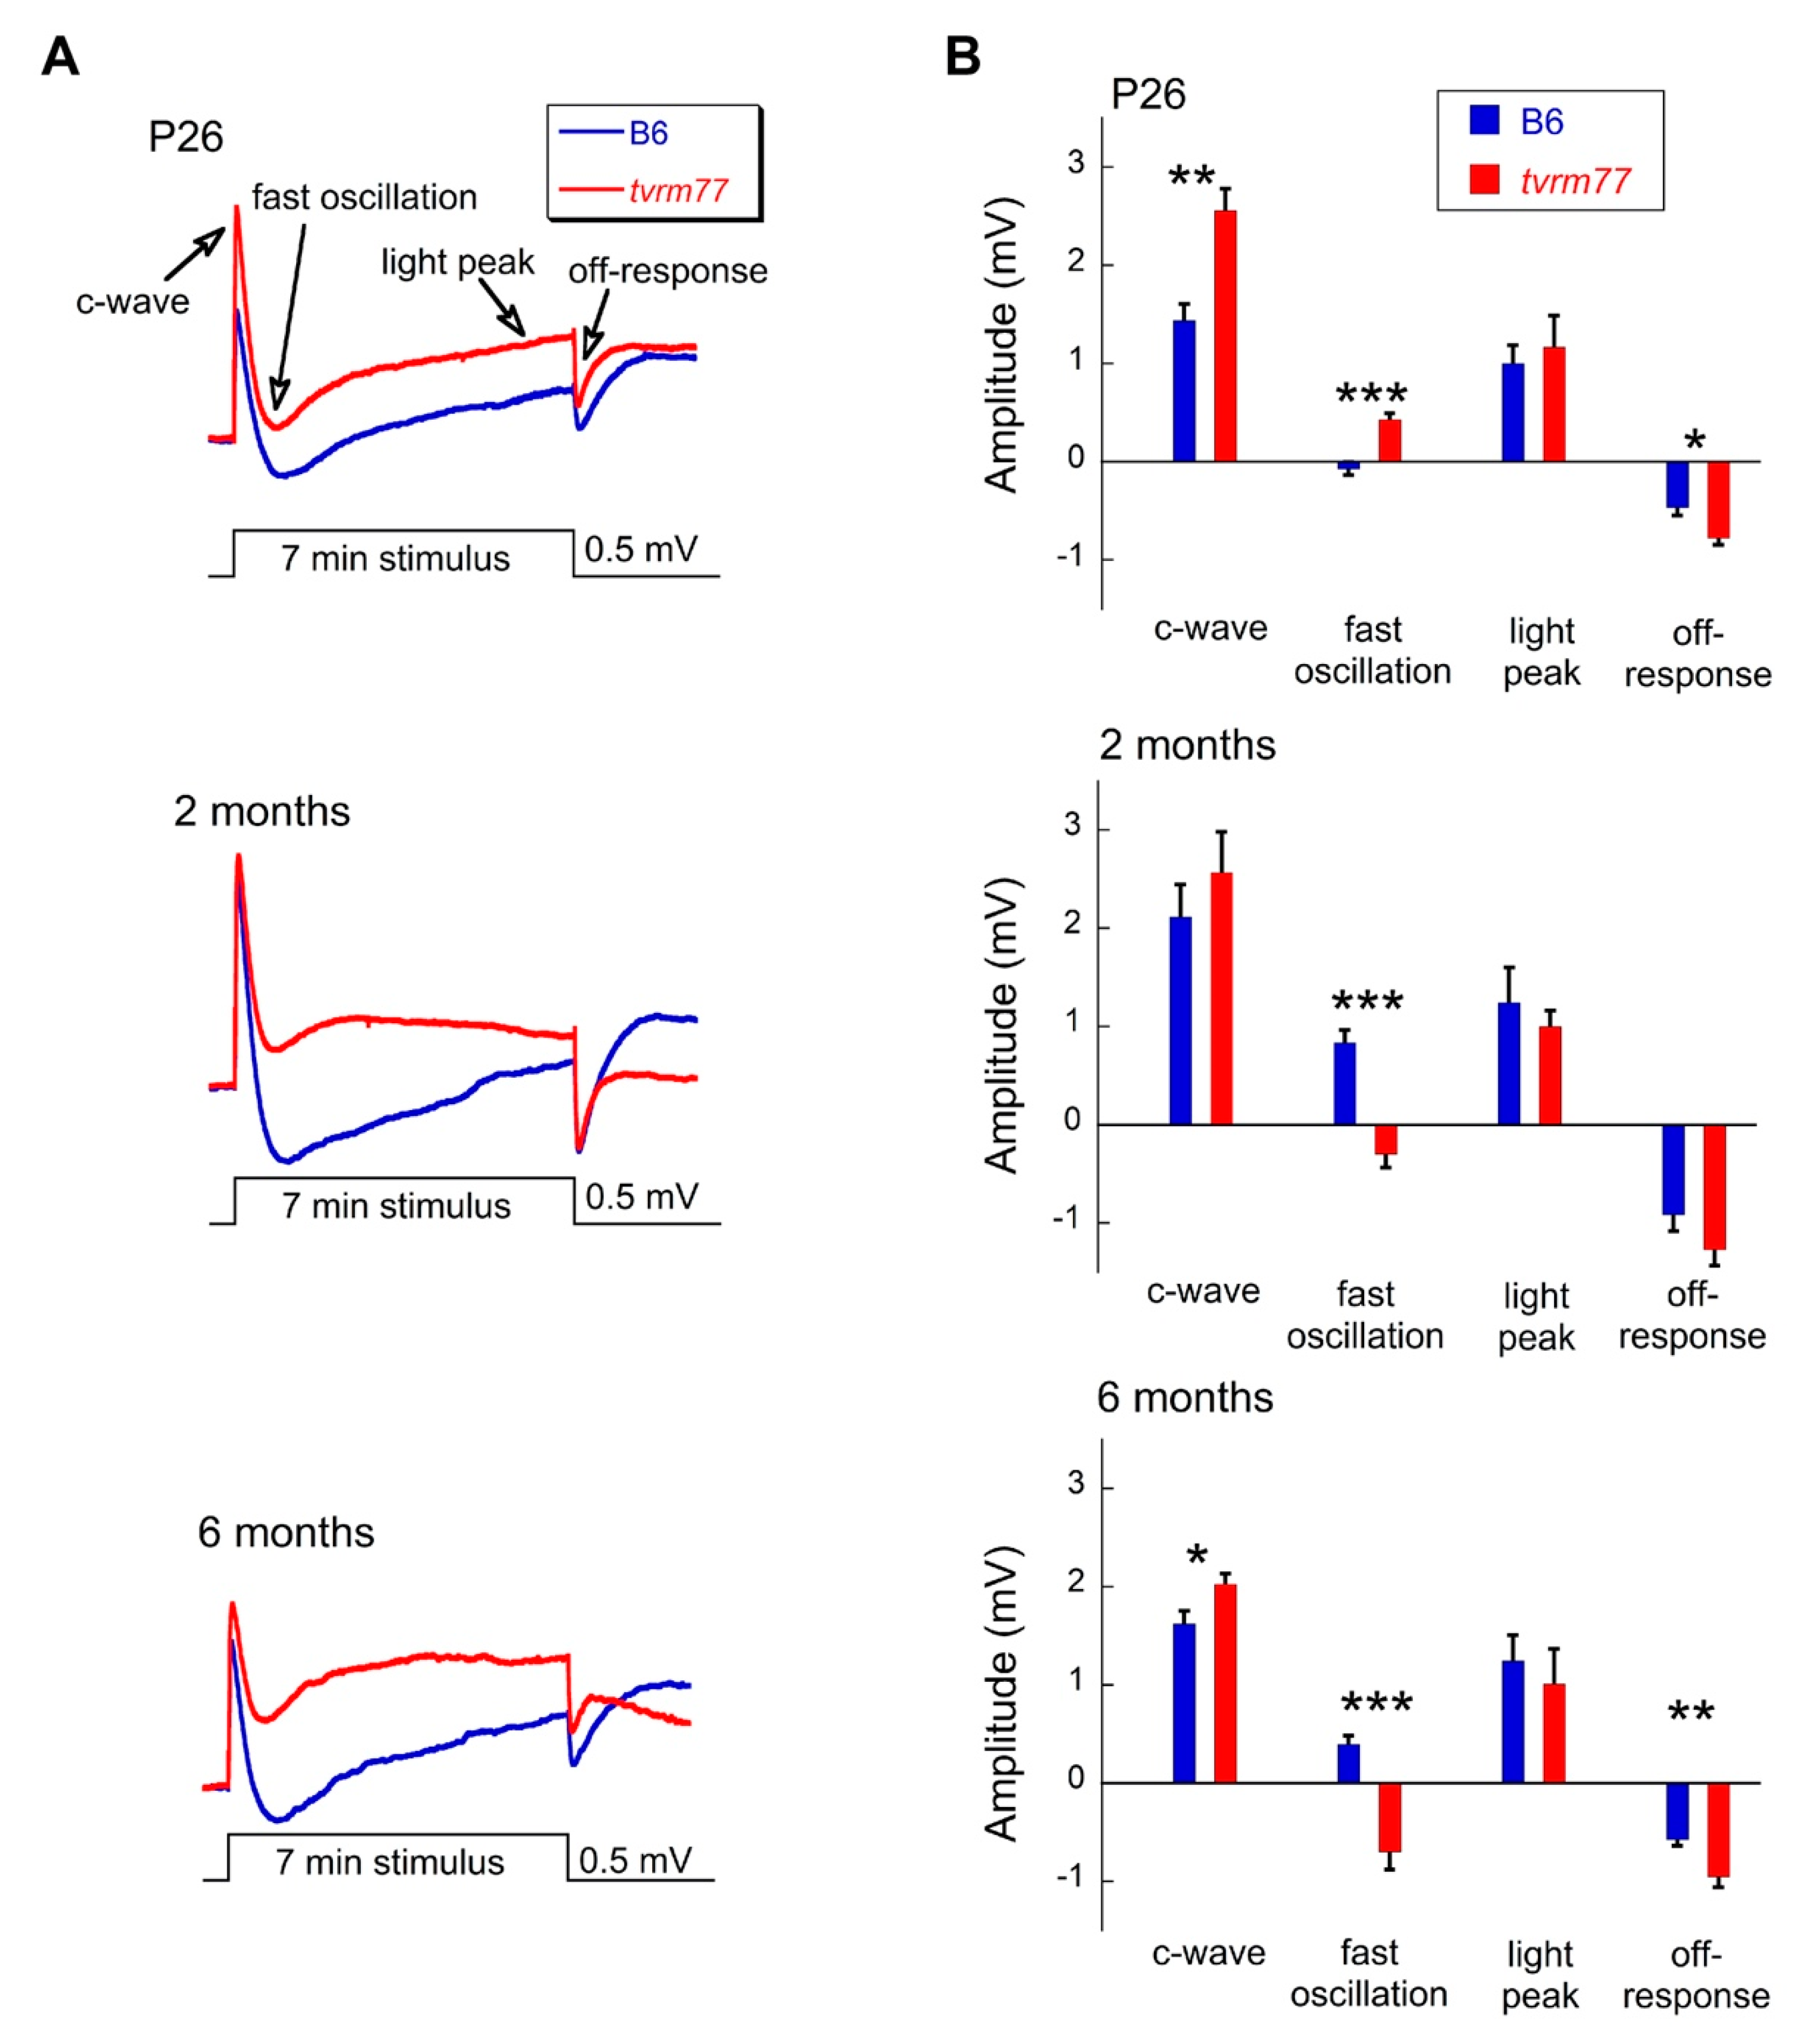
2.9. Aberrant ERG Response
3. Discussion
3.1. RPE Expression of Slc4a5 and Its Disruption in tvrm77 Mice
3.2. Early RPE-Specific ERG Defects
3.3. Role of RPE SLC4A5 in Fluid Transport across the Outer BRB
3.4. A Possible Model of Exudative Retinal Detachment and Neovascularization Type 3
3.5. A Possible Model to Study Retinal Fold Formation
3.6. Study Limitations and Recommendations for Future Work
3.7. Summary
4. Materials and Methods
4.1. Mice, Mutagenesis and Mapping
4.2. Mutation Analysis
4.3. Analysis of Slc4a5 RPE Transcripts
4.4. Human Pluripotent Stem Cell Culture
4.5. Human RPE Cell Differentiation and SLC4A5 Expression
4.6. Live Imaging of Mouse Eyes
4.7. Mouse Histology and Immunohistochemistry
4.8. Transmission Electron Microscopy
4.9. Assessment of Retinal/RPE Adhesion
4.10. Fluorescence Microscopy of Retinal Flatmounts
4.11. Electroretinography
Supplementary Materials
Author Contributions
Funding
Institutional Review Board Statement
Data Availability Statement
Acknowledgments
Conflicts of Interest
References
- Campbell, M.; Humphries, P. The blood-retina barrier: Tight junctions and barrier modulation. Adv. Exp. Med. Biol. 2012, 763, 70–84. [Google Scholar] [PubMed]
- Ivanova, E.; Alam, N.M.; Prusky, G.T.; Sagdullaev, B.T. Blood-retina barrier failure and vision loss in neuron-specific degeneration. JCI Insight 2019, 4, e126747. [Google Scholar] [CrossRef] [PubMed] [Green Version]
- Lipecz, A.; Miller, L.; Kovacs, I.; Czako, C.; Csipo, T.; Baffi, J.; Csiszar, A.; Tarantini, S.; Ungvari, Z.; Yabluchanskiy, A.; et al. Microvascular contributions to age-related macular degeneration (AMD): From mechanisms of choriocapillaris aging to novel interventions. Geroscience 2019, 41, 813–845. [Google Scholar] [CrossRef] [PubMed]
- Rossino, M.G.; Dal Monte, M.; Casini, G. Relationships Between Neurodegeneration and Vascular Damage in Diabetic Retinopathy. Front. Neurosci. 2019, 13, 1172. [Google Scholar] [CrossRef] [Green Version]
- Soto, I.; Krebs, M.P.; Reagan, A.M.; Howell, G.R. Vascular Inflammation Risk Factors in Retinal Disease. Annu. Rev. Vis. Sci. 2019, 5, 99–122. [Google Scholar] [CrossRef]
- Strauss, O. The retinal pigmenT epithelium. In Webvision: The Organization of the Retina and Visual System; Kolb, H., Fernandez, E., Nelson, R., Eds.; University of Utah Health Sciences Center: Salt Lake City, UT, USA, 1995. [Google Scholar]
- Strauss, O. The retinal pigment epithelium in visual function. Physiol. Rev. 2005, 85, 845–881. [Google Scholar] [CrossRef] [Green Version]
- Sparrow, J.R.; Hicks, D.; Hamel, C.P. The retinal pigment epithelium in health and disease. Curr. Mol. Med. 2010, 10, 802–823. [Google Scholar] [CrossRef]
- Dvoriashyna, M.; Foss, A.J.E.; Gaffney, E.A.; Repetto, R. Fluid and solute transport across the retinal pigment epithelium: A theoretical model. J. R. Soc. Interface 2020, 17, 20190735. [Google Scholar] [CrossRef] [Green Version]
- Caceres, P.S.; Benedicto, I.; Lehmann, G.L.; Rodriguez-Boulan, E.J. Directional Fluid Transport across Organ-Blood Barriers: Physiology and Cell Biology. Cold Spring Harb. Perspect. Biol. 2017, 9, a027847. [Google Scholar] [CrossRef] [Green Version]
- Hanke-Gogokhia, C.; Lehmann, G.L.; Benedicto, I.; de la Fuente-Ortega, E.; Arshavsky, V.Y.; Schreiner, R.; Rodriguez-Boulan, E. Apical CLC-2 in retinal pigment epithelium is crucial for survival of the outer retina. FASEB J. 2021, 35, e21689. [Google Scholar] [CrossRef]
- Won, J.; Shi, L.Y.; Hicks, W.; Wang, J.; Hurd, R.; Naggert, J.K.; Chang, B.; Nishina, P.M. Mouse model resources for vision research. J. Ophthalmol. 2011, 2011, 391384. [Google Scholar] [CrossRef] [Green Version]
- Won, J.; Shi, L.Y.; Hicks, W.; Wang, J.; Naggert, J.K.; Nishina, P.M. Translational vision research models program. Adv. Exp. Med. Biol. 2012, 723, 391–397. [Google Scholar]
- Krebs, M.P.; Collin, G.B.; Hicks, W.L.; Yu, M.; Charette, J.R.; Shi, L.Y.; Wang, J.; Naggert, J.K.; Peachey, N.S.; Nishina, P.M. Mouse models of human ocular disease for translational research. PLoS ONE 2017, 12, e0183837. [Google Scholar] [CrossRef] [PubMed] [Green Version]
- Romero, M.F.; Fulton, C.M.; Boron, W.F. The SLC4 family of HCO 3-transporters. Pflug. Arch. Eur. J. Physiol. 2004, 447, 495–509. [Google Scholar] [CrossRef] [PubMed]
- Pushkin, A.; Abuladze, N.; Newman, D.; Lee, I.; Xu, G.; Kurtz, I. Two C-terminal variants of NBC4, a new member of the sodium bicarbonate cotransporter family: Cloning, characterization, and localization. IUBMB Life 2000, 50, 13–19. [Google Scholar] [PubMed]
- Abuladze, N.; Pushkin, A.; Tatishchev, S.; Newman, D.; Sassani, P.; Kurtz, I. Expression and localization of rat NBC4c in liver and renal uroepithelium. Am. J. Physiol. Cell Physiol. 2004, 287, C781–C789. [Google Scholar] [CrossRef] [Green Version]
- Damkier, H.H.; Nielsen, S.; Praetorius, J. Molecular expression of SLC4-derived Na+-dependent anion transporters in selected human tissues. Am. J. Physiol. Regul. Integr. Comp. Physiol. 2007, 293, R2136–R2146. [Google Scholar] [CrossRef] [Green Version]
- Bouzinova, E.V.; Praetorius, J.; Virkki, L.V.; Nielsen, S.; Boron, W.F.; Aalkjaer, C. Na+-dependent HCO3- uptake into the rat choroid plexus epithelium is partially DIDS sensitive. Am. J. Physiol. Cell Physiol. 2005, 289, C1448–C1456. [Google Scholar] [CrossRef] [Green Version]
- Millar, I.D.; Brown, P.D. NBCe2 exhibits a 3 HCO3(-):1 Na+ stoichiometry in mouse choroid plexus epithelial cells. Biochem. Biophys. Res. Commun. 2008, 373, 550–554. [Google Scholar] [CrossRef]
- Kao, L.; Kurtz, L.M.; Shao, X.; Papadopoulos, M.C.; Liu, L.; Bok, D.; Nusinowitz, S.; Chen, B.; Stella, S.L.; Andre, M.; et al. Severe neurologic impairment in mice with targeted disruption of the electrogenic sodium bicarbonate cotransporter NBCe2 (Slc4a5 gene). J. Biol. Chem. 2011, 286, 32563–32574. [Google Scholar] [CrossRef] [Green Version]
- Fukuda, H.; Hirata, T.; Nakamura, N.; Kato, A.; Kawahara, K.; Wakabayashi, S.; Chang, M.H.; Romero, M.F.; Hirose, S. Identification and properties of a novel variant of NBC4 (Na(+)/HCO(3)- co-transporter 4) that is predominantly expressed in the choroid plexus. Biochem. J. 2013, 450, 179–187. [Google Scholar] [CrossRef] [PubMed]
- Christensen, H.L.; Barbuskaite, D.; Rojek, A.; Malte, H.; Christensen, I.B.; Fuchtbauer, A.C.; Fuchtbauer, E.M.; Wang, T.; Praetorius, J.; Damkier, H.H. The choroid plexus sodium-bicarbonate cotransporter NBCe2 regulates mouse cerebrospinal fluid pH. J. Physiol. 2018, 596, 4709–4728. [Google Scholar] [CrossRef] [PubMed] [Green Version]
- Sassani, P.; Pushkin, A.; Gross, E.; Gomer, A.; Abuladze, N.; Dukkipati, R.; Carpenito, G.; Kurtz, I. Functional characterization of NBC4: A new electrogenic sodium-bicarbonate cotransporter. Am. J. Physiol. Cell Physiol. 2002, 282, C408–C416. [Google Scholar] [CrossRef] [PubMed] [Green Version]
- Virkki, L.V.; Wilson, D.A.; Vaughan-Jones, R.D.; Boron, W.F. Functional characterization of human NBC4 as an electrogenic Na+-HCO cotransporter (NBCe2). Am. J. Physiol. Cell Physiol. 2002, 282, C1278–C1289. [Google Scholar] [CrossRef] [PubMed]
- Groger, N.; Vitzthum, H.; Frohlich, H.; Kruger, M.; Ehmke, H.; Braun, T.; Boettger, T. Targeted mutation of SLC4A5 induces arterial hypertension and renal metabolic acidosis. Hum. Mol. Genet. 2012, 21, 1025–1036. [Google Scholar] [CrossRef] [PubMed] [Green Version]
- Hunt, S.C.; Xin, Y.; Wu, L.L.; Cawthon, R.M.; Coon, H.; Hasstedt, S.J.; Hopkins, P.N. Sodium bicarbonate cotransporter polymorphisms are associated with baseline and 10-year follow-up blood pressures. Hypertension 2006, 47, 532–536. [Google Scholar] [CrossRef] [PubMed] [Green Version]
- Taylor, J.Y.; Maddox, R.; Wu, C.Y. Genetic and environmental risks for high blood pressure among African American mothers and daughters. Biol. Res. Nurs. 2009, 11, 53–65. [Google Scholar] [CrossRef] [Green Version]
- Taylor, J.Y.; Sampson, D.; Taylor, A.D.; Caldwell, D.; Sun, Y.V. Genetic and BMI risks for predicting blood pressure in three generations of West African Dogon women. Biol. Res. Nurs. 2013, 15, 105–111. [Google Scholar] [CrossRef] [Green Version]
- Carey, R.M.; Schoeffel, C.D.; Gildea, J.J.; Jones, J.E.; McGrath, H.E.; Gordon, L.N.; Park, M.J.; Sobota, R.S.; Underwood, P.C.; Williams, J.; et al. Salt sensitivity of blood pressure is associated with polymorphisms in the sodium-bicarbonate cotransporter. Hypertension 2012, 60, 1359–1366. [Google Scholar] [CrossRef] [Green Version]
- Guziewicz, K.E.; Sinha, D.; Gomez, N.M.; Zorych, K.; Dutrow, E.V.; Dhingra, A.; Mullins, R.F.; Stone, E.M.; Gamm, D.M.; Boesze-Battaglia, K.; et al. Bestrophinopathy: An RPE-photoreceptor interface disease. Prog. Retin. Eye Res. 2017, 58, 70–88. [Google Scholar] [CrossRef] [Green Version]
- Ji, X.; Liu, Y.; Hurd, R.; Wang, J.; Fitzmaurice, B.; Nishina, P.M.; Chang, B. Retinal Pigment Epithelium Atrophy 1 (rpea1): A New Mouse Model With Retinal Detachment Caused by a Disruption of Protein Kinase C, theta. Investig. Ophthalmol. Vis. Sci. 2016, 57, 877–888. [Google Scholar] [CrossRef] [PubMed] [Green Version]
- Luna, G.; Lewis, G.P.; Linberg, K.A.; Chang, B.; Hu, Q.; Munson, P.J.; Maminishkis, A.; Miller, S.S.; Fisher, S.K. Anatomical and Gene Expression Changes in the Retinal Pigmented Epithelium Atrophy 1 (rpea1) Mouse: A Potential Model of Serous Retinal Detachment. Investig. Ophthalmol. Vis. Sci. 2016, 57, 4641–4654. [Google Scholar] [CrossRef] [PubMed] [Green Version]
- Schindelin, J.; Arganda-Carreras, I.; Frise, E.; Kaynig, V.; Longair, M.; Pietzsch, T.; Preibisch, S.; Rueden, C.; Saalfeld, S.; Schmid, B.; et al. Fiji: An open-source platform for biological-image analysis. Nat. Methods 2012, 9, 676–682. [Google Scholar] [CrossRef] [PubMed] [Green Version]
- Siegert, S.; Cabuy, E.; Scherf, B.G.; Kohler, H.; Panda, S.; Le, Y.Z.; Fehling, H.J.; Gaidatzis, D.; Stadler, M.B.; Roska, B. Transcriptional code and disease map for adult retinal cell types. Nat. Neurosci. 2012, 15, 487–495. [Google Scholar] [CrossRef]
- Macosko, E.Z.; Basu, A.; Satija, R.; Nemesh, J.; Shekhar, K.; Goldman, M.; Tirosh, I.; Bialas, A.R.; Kamitaki, N.; Martersteck, E.M.; et al. Highly Parallel Genome-wide Expression Profiling of Individual Cells Using Nanoliter Droplets. Cell 2015, 161, 1202–1214. [Google Scholar] [CrossRef] [PubMed] [Green Version]
- Louer, E.M.M.; Yi, G.; Carmone, C.; Robben, J.; Stunnenberg, H.G.; den Hollander, A.I.; Deen, P.M.T. Genes Involved in Energy Metabolism Are Differentially Expressed During the Day-Night Cycle in Murine Retinal Pigment Epithelium. Invest. Ophthalmol. Vis. Sci. 2020, 61, 49. [Google Scholar] [CrossRef] [PubMed]
- Lehmann, G.L.; Hanke-Gogokhia, C.; Hu, Y.; Bareja, R.; Salfati, Z.; Ginsberg, M.; Nolan, D.J.; Mendez-Huergo, S.P.; Dalotto-Moreno, T.; Wojcinski, A.; et al. Single-cell profiling reveals an endothelium-mediated immunomodulatory pathway in the eye choroid. J. Exp. Med. 2020, 217, e20190730. [Google Scholar] [CrossRef] [PubMed] [Green Version]
- Huynh, K.W.; Jiang, J.; Abuladze, N.; Tsirulnikov, K.; Kao, L.; Shao, X.; Newman, D.; Azimov, R.; Pushkin, A.; Zhou, Z.H.; et al. CryoEM structure of the human SLC4A4 sodium-coupled acid-base transporter NBCe1. Nat. Commun. 2018, 9, 900. [Google Scholar] [CrossRef]
- Buchholz, D.E.; Pennington, B.O.; Croze, R.H.; Hinman, C.R.; Coffey, P.J.; Clegg, D.O. Rapid and efficient directed differentiation of human pluripotent stem cells into retinal pigmented epithelium. Stem Cells Transl. Med. 2013, 2, 384–393. [Google Scholar] [CrossRef]
- Rowland, T.J.; Blaschke, A.J.; Buchholz, D.E.; Hikita, S.T.; Johnson, L.V.; Clegg, D.O. Differentiation of human pluripotent stem cells to retinal pigmented epithelium in defined conditions using purified extracellular matrix proteins. J. Tissue Eng. Regen. Med. 2013, 7, 642–653. [Google Scholar] [CrossRef]
- Hasegawa, E.; Sweigard, H.; Husain, D.; Olivares, A.M.; Chang, B.; Smith, K.E.; Birsner, A.E.; D’Amato, R.J.; Michaud, N.A.; Han, Y.; et al. Characterization of a spontaneous retinal neovascular mouse model. PLoS ONE 2014, 9, e106507. [Google Scholar] [CrossRef] [PubMed]
- Chang, B.; FitzMaurice, B.; Wang, J.P.; Low, B.E.; Wiles, M.V.; Nishina, P.M. Spontaneous Posterior Segment Vascular Disease Phenotype of a Mouse Model, rnv3, Is Dependent on the Crb1(rd8) Allele. Investig. Ophthalmol. Vis. Sci. 2018, 59, 5127–5139. [Google Scholar] [CrossRef] [PubMed] [Green Version]
- Johnson, K.R.; Gagnon, L.H.; Chang, B. A hypomorphic mutation of the gamma-1 adaptin gene (Ap1g1) causes inner ear, retina, thyroid, and testes abnormalities in mice. Mamm. Genome 2016, 27, 200–212. [Google Scholar] [CrossRef] [PubMed] [Green Version]
- Augustin, M.; Wechdorn, M.; Pfeiffenberger, U.; Himmel, T.; Fialová, S.; Werkmeister, R.M.; Hitzenberger, C.K.; Glösmann, M.; Baumann, B. In Vivo Characterization of Spontaneous Retinal Neovascularization in the Mouse Eye by Multifunctional Optical Coherence Tomography. Investig. Ophthalmol. Vis. Sci. 2018, 59, 2054–2068. [Google Scholar] [CrossRef] [PubMed] [Green Version]
- Fischer, M.D.; Huber, G.; Beck, S.C.; Tanimoto, N.; Muehlfriedel, R.; Fahl, E.; Grimm, C.; Wenzel, A.; Remé, C.E.; van de Pavert, S.A.; et al. Noninvasive, in vivo assessment of mouse retinal structure using optical coherence tomography. PLoS ONE 2009, 4, e7507. [Google Scholar] [CrossRef] [Green Version]
- Wright, C.B.; Uehara, H.; Kim, Y.; Yasuma, T.; Yasuma, R.; Hirahara, S.; Makin, R.D.; Apicella, I.; Pereira, F.; Nagasaka, Y.; et al. Chronic Dicer1 deficiency promotes atrophic and neovascular outer retinal pathologies in mice. Proc. Natl. Acad. Sci. USA 2020, 117, 2579–2587. [Google Scholar] [CrossRef] [Green Version]
- Heimann, H.; Bopp, S. Retinal folds following retinal detachment surgery. Ophthalmologica 2011, 226 (Suppl. 1), 18–26. [Google Scholar] [CrossRef]
- Goel, S.; Rijey, A.J.; Kumar, S.; Roy, R. Imaging hydration folds following retinal detachment repair. Indian J. Ophthalmol. 2019, 67, 1346. [Google Scholar]
- Lee, W.W.; Bansal, A.; Sadda, S.; Sarraf, D.; Berger, A.R.; Wong, D.T.; Kertes, P.J.; Kohly, R.P.; Hillier, R.J.; Muni, R.H. Outer Retinal Folds Following Pars Plana Vitrectomy vs Pneumatic Retinopexy for Retinal Detachment Repair: Post Hoc Analysis from PIVOT. Ophthalmol. Retin. 2021; in press. [Google Scholar] [CrossRef]
- Fukuyama, H.; Yagiri, H.; Araki, T.; Iwami, H.; Yoshida, Y.; Ishikawa, H.; Kimura, N.; Kakusho, K.; Okadome, T.; Gomi, F. Quantitative assessment of outer retinal folds on enface optical coherence tomography after vitrectomy for rhegmatogenous retinal detachment. Sci. Rep. 2019, 9, 2327. [Google Scholar] [CrossRef]
- Iwabe, S.; Dufour, V.L.; Guzmán, J.M.; Holle, D.M.; Cohen, J.A.; Beltran, W.A.; Aguirre, G.D. Focal/multifocal and geographic retinal dysplasia in the dog-In vivo retinal microanatomy analyses. Vet. Ophthalmol. 2020, 23, 292–304. [Google Scholar] [CrossRef] [PubMed]
- Srinivasan, V.J.; Wojtkowski, M.; Witkin, A.J.; Duker, J.S.; Ko, T.H.; Carvalho, M.; Schuman, J.S.; Kowalczyk, A.; Fujimoto, J.G. High-definition and 3-dimensional imaging of macular pathologies with high-speed ultrahigh-resolution optical coherence tomography. Ophthalmology 2006, 113, 2054–2065.e3. [Google Scholar] [CrossRef] [Green Version]
- van Dijk, E.H.C.; Boon, C.J.F. Serous business: Delineating the broad spectrum of diseases with subretinal fluid in the macula. Prog. Retin. Eye Res. 2021, 84, 100955. [Google Scholar] [CrossRef] [PubMed]
- Fu, Y.; Chen, S.; Gu, Z.H.; Zhang, Y.L.; Li, L.Y.; Yang, N. Natural history of persistent subretinal fluid following the successful repair of rhegmatogenous retinal detachment. Int. J. Ophthalmol 2020, 13, 1621–1628. [Google Scholar] [CrossRef] [PubMed]
- Qi, Y.; Dai, X.; Zhang, H.; He, Y.; Zhang, Y.; Han, J.; Zhu, P.; Zhang, Y.; Zheng, Q.; Li, X.; et al. Trans-Corneal Subretinal Injection in Mice and Its Effect on the Function and Morphology of the Retina. PLoS ONE 2015, 10, e0136523. [Google Scholar] [CrossRef]
- Nandrot, E.F.; Anand, M.; Sircar, M.; Finnemann, S.C. Novel role for alphavbeta5-integrin in retinal adhesion and its diurnal peak. Am. J. Physiol. Cell Physiol. 2006, 290, C1256–C1262. [Google Scholar] [CrossRef] [Green Version]
- Murakami, Y.; Notomi, S.; Hisatomi, T.; Nakazawa, T.; Ishibashi, T.; Miller, J.W.; Vavvas, D.G. Photoreceptor cell death and rescue in retinal detachment and degenerations. Prog. Retin. Eye Res. 2013, 37, 114–140. [Google Scholar] [CrossRef] [Green Version]
- Hawes, N.L.; Chang, B.; Hageman, G.S.; Nusinowitz, S.; Nishina, P.M.; Schneider, B.S.; Smith, R.S.; Roderick, T.H.; Davisson, M.T.; Heckenlively, J.R. Retinal degeneration 6 (rd6): A new mouse model for human retinitis punctata albescens. Investig. Ophthalmol. Vis. Sci. 2000, 41, 3149–3157. [Google Scholar]
- Luhmann, U.F.; Robbie, S.; Munro, P.M.; Barker, S.E.; Duran, Y.; Luong, V.; Fitzke, F.W.; Bainbridge, J.W.; Ali, R.R.; MacLaren, R.E. The drusenlike phenotype in aging Ccl2-knockout mice is caused by an accelerated accumulation of swollen autofluorescent subretinal macrophages. Investig. Ophthalmol. Vis. Sci. 2009, 50, 5934–5943. [Google Scholar] [CrossRef] [Green Version]
- Combadiere, C.; Feumi, C.; Raoul, W.; Keller, N.; Rodero, M.; Pezard, A.; Lavalette, S.; Houssier, M.; Jonet, L.; Picard, E.; et al. CX3CR1-dependent subretinal microglia cell accumulation is associated with cardinal features of age-related macular degeneration. J. Clin. Investig. 2007, 117, 2920–2928. [Google Scholar] [CrossRef] [Green Version]
- Zhao, L.; Zabel, M.K.; Wang, X.; Ma, W.; Shah, P.; Fariss, R.N.; Qian, H.; Parkhurst, C.N.; Gan, W.B.; Wong, W.T. Microglial phagocytosis of living photoreceptors contributes to inherited retinal degeneration. EMBO Mol. Med. 2015, 7, 1179–1197. [Google Scholar] [CrossRef] [PubMed]
- Wu, J.; Peachey, N.S.; Marmorstein, A.D. Light-evoked responses of the mouse retinal pigment epithelium. J. Neurophysiol. 2004, 91, 1134–1142. [Google Scholar] [CrossRef] [PubMed]
- Samuels, I.S.; Sturgill, G.M.; Grossman, G.H.; Rayborn, M.E.; Hollyfield, J.G.; Peachey, N.S. Light-evoked responses of the retinal pigment epithelium: Changes accompanying photoreceptor loss in the mouse. J. Neurophysiol. 2010, 104, 391–402. [Google Scholar] [CrossRef] [PubMed] [Green Version]
- Griff, E.R.; Steinberg, R.H. Changes in apical [K+] produce delayed basal membrane responses of the retinal pigment epithelium in the gecko. J. Gen. Physiol. 1984, 83, 193–211. [Google Scholar] [CrossRef]
- Linsenmeier, R.A.; Steinberg, R.H. Delayed basal hyperpolarization of cat retinal pigment epithelium and its relation to the fast oscillation of the DC electroretinogram. J. Gen. Physiol. 1984, 83, 213–232. [Google Scholar] [CrossRef] [Green Version]
- Linsenmeier, R.A.; Steinberg, R.H. Origin and sensitivity of the light peak in the intact cat eye. J. Physiol. 1982, 331, 653–673. [Google Scholar] [CrossRef] [Green Version]
- Edwards, M.M.; Marin de Evsikova, C.; Collin, G.B.; Gifford, E.; Wu, J.; Hicks, W.L.; Whiting, C.; Varvel, N.H.; Maphis, N.; Lamb, B.T.; et al. Photoreceptor degeneration, azoospermia, leukoencephalopathy, and abnormal RPE cell function in mice expressing an early stop mutation in Clcn2. Investig. Ophthalmol. Vis. Sci. 2010, 51, 3264–3272. [Google Scholar] [CrossRef] [Green Version]
- Wu, J.; Marmorstein, A.D.; Kofuji, P.; Peachey, N.S. Contribution of Kir4.1 to the mouse electroretinogram. Mol. Vis. 2004, 10, 650–654. [Google Scholar]
- Adijanto, J.; Banzon, T.; Jalickee, S.; Wang, N.S.; Miller, S.S. CO2-induced ion and fluid transport in human retinal pigment epithelium. J. Gen. Physiol. 2009, 133, 603–622. [Google Scholar] [CrossRef] [Green Version]
- Lehmann, G.L.; Benedicto, I.; Philp, N.J.; Rodriguez-Boulan, E. Plasma membrane protein polarity and trafficking in RPE cells: Past, present and future. Exp. Eye Res. 2014, 126, 5–15. [Google Scholar] [CrossRef] [Green Version]
- Strunnikova, N.V.; Maminishkis, A.; Barb, J.J.; Wang, F.; Zhi, C.; Sergeev, Y.; Chen, W.; Edwards, A.O.; Stambolian, D.; Abecasis, G.; et al. Transcriptome analysis and molecular signature of human retinal pigment epithelium. Hum. Mol. Genet. 2010, 19, 2468–2486. [Google Scholar] [CrossRef] [PubMed]
- Brown, P.D.; Davies, S.L.; Speake, T.; Millar, I.D. Molecular mechanisms of cerebrospinal fluid production. Neuroscience 2004, 129, 957–970. [Google Scholar] [CrossRef] [PubMed] [Green Version]
- Praetorius, J. Water and solute secretion by the choroid plexus. Pflug. Arch. 2007, 454, 1–18. [Google Scholar] [CrossRef] [PubMed]
- Suzuki, M.; Seki, G.; Yamada, H.; Horita, S.; Fujita, T. Functional Roles of Electrogenic Sodium Bicarbonate Cotransporter NBCe1 in Ocular Tissues. Open Ophthalmol. J. 2012, 6, 36–41. [Google Scholar] [CrossRef] [PubMed] [Green Version]
- Gildea, J.J.; Xu, P.; Carlson, J.M.; Gaglione, R.T.; Bigler Wang, D.; Kemp, B.A.; Reyes, C.M.; McGrath, H.E.; Carey, R.M.; Jose, P.A.; et al. The sodium-bicarbonate cotransporter NBCe2 (slc4a5) expressed in human renal proximal tubules shows increased apical expression under high-salt conditions. Am. J. Physiol. Regul. Integr. Comp. Physiol. 2015, 309, R1447–R1459. [Google Scholar] [CrossRef] [Green Version]
- Blair, K.; Czyz, C.N. Retinal Detachment; StatPearls: Treasure Island, FL, USA, 2020. [Google Scholar]
- Cahill, M.; O’Keefe, M.; Acheson, R.; Mulvihill, A.; Wallace, D.; Mooney, D. Classification of the spectrum of Coats’ disease as subtypes of idiopathic retinal telangiectasis with exudation. Acta Ophthalmol. Scand. 2001, 79, 596–602. [Google Scholar] [CrossRef]
- Qiang, W.; Wei, R.; Chen, Y.; Chen, D. Clinical Pathological Features and Current Animal Models of Type 3 Macular Neovascularization. Front. Neurosci. 2021, 15, 734860. [Google Scholar] [CrossRef]
- Spaide, R.F.; Jaffe, G.J.; Sarraf, D.; Freund, K.B.; Sadda, S.R.; Staurenghi, G.; Waheed, N.K.; Chakravarthy, U.; Rosenfeld, P.J.; Holz, F.G.; et al. Consensus Nomenclature for Reporting Neovascular Age-Related Macular Degeneration Data: Consensus on Neovascular Age-Related Macular Degeneration Nomenclature Study Group. Ophthalmology 2020, 127, 616–636. [Google Scholar] [CrossRef] [PubMed]
- Charbel Issa, P.; Gillies, M.C.; Chew, E.Y.; Bird, A.C.; Heeren, T.F.; Peto, T.; Holz, F.G.; Scholl, H.P. Macular telangiectasia type 2. Prog. Retin. Eye Res. 2013, 34, 49–77. [Google Scholar] [CrossRef] [Green Version]
- Mehta, H.; Muller, S.; Egan, C.A.; Degli Esposti, S.; Tufail, A.; Sim, D.A.; Holz, F.G.; Browning, A.C.; Amoaku, W.M.; Charbel Issa, P.; et al. Natural history and effect of therapeutic interventions on subretinal fluid causing foveal detachment in macular telangiectasia type 2. Br. J. Ophthalmol. 2017, 101, 955–959. [Google Scholar] [CrossRef]
- Matet, A.; Yzer, S.; Chew, E.Y.; Daruich, A.; Behar-Cohen, F.; Spaide, R.F. Concurrent Idiopathic Macular Telangiectasia Type 2 and Central Serous Chorioretinopathy. Retina 2018, 38 (Suppl. 1), S67–S78. [Google Scholar] [CrossRef]
- Dalvin, L.A.; Spaide, R.F.; Yannuzzi, L.A.; Freund, K.B.; Pulido, J.S. Hydration folds in rhegmatogenous retinal detachment. Retin. Cases Brief. Rep. 2020, 14, 355–359. [Google Scholar] [CrossRef]
- dell’Omo, R.; Tan, H.S.; Schlingemann, R.O.; Bijl, H.M.; Lesnik Oberstein, S.Y.; Barca, F.; Mura, M. Evolution of outer retinal folds occurring after vitrectomy for retinal detachment repair. Invest. Ophthalmol. Vis. Sci. 2012, 53, 7928–7935. [Google Scholar] [CrossRef]
- Dell’Omo, R.; Mura, M.; Lesnik Oberstein, S.Y.; Bijl, H.; Tan, H.S. Early simultaneous fundus autofluorescence and optical coherence tomography features after pars plana vitrectomy for primary rhegmatogenous retinal detachment. Retina 2012, 32, 719–728. [Google Scholar] [CrossRef] [PubMed]
- Gupta, R.R.; Iaboni, D.S.M.; Seamone, M.E.; Sarraf, D. Inner, outer, and full-thickness retinal folds after rhegmatogenous retinal detachment repair: A review. Surv. Ophthalmol. 2019, 64, 135–161. [Google Scholar] [CrossRef] [PubMed]
- Thomseth, V.M.; Engelsvold, D.H.; Ushakova, A.; Forsaa, V.A. En Face Imaging of Outer Retinal Pathology after Retinal Detachment. Retina 2020, 41, 324–330. [Google Scholar] [CrossRef] [PubMed]
- Goldstein, O.; Guyon, R.; Kukekova, A.; Kuznetsova, T.N.; Pearce-Kelling, S.E.; Johnson, J.; Aguirre, G.D.; Acland, G.M. COL9A2 and COL9A3 mutations in canine autosomal recessive oculoskeletal dysplasia. Mamm. Genome 2010, 21, 398–408. [Google Scholar] [CrossRef] [Green Version]
- Usui, Y.; Westenskow, P.D.; Kurihara, T.; Aguilar, E.; Sakimoto, S.; Paris, L.P.; Wittgrove, C.; Feitelberg, D.; Friedlander, M.S.; Moreno, S.K.; et al. Neurovascular crosstalk between interneurons and capillaries is required for vision. J. Clin. Investig. 2015, 125, 2335–2346. [Google Scholar] [CrossRef] [Green Version]
- Barbuskaite, D.; Pedersen, F.D.; Christensen, H.L.; Johnsen, L.; Praetorius, J.; Damkier, H.H. NBCe2 (Slc4a5) Is Expressed in the Renal Connecting Tubules and Cortical Collecting Ducts and Mediates Base Extrusion. Front. Physiol. 2020, 11, 560. [Google Scholar] [CrossRef]
- Truett, G.E.; Heeger, P.; Mynatt, R.L.; Truett, A.A.; Walker, J.A.; Warman, M.L. Preparation of PCR-quality mouse genomic DNA with hot sodium hydroxide and tris (HotSHOT). Biotechniques 2000, 29, 52–54. [Google Scholar] [CrossRef]
- Dietrich, W.F.; Miller, J.; Steen, R.; Merchant, M.A.; Damron-Boles, D.; Husain, Z.; Dredge, R.; Daly, M.J.; Ingalls, K.A.; O’Connor, T.J. A comprehensive genetic map of the mouse genome. Nature 1996, 380, 149–152. [Google Scholar] [CrossRef] [PubMed]
- Xin-Zhao Wang, C.; Zhang, K.; Aredo, B.; Lu, H.; Ufret-Vincenty, R.L. Novel method for the rapid isolation of RPE cells specifically for RNA extraction and analysis. Exp. Eye Res. 2012, 102, 1–9. [Google Scholar] [CrossRef] [PubMed] [Green Version]
- Kilpinen, H.; Goncalves, A.; Leha, A.; Afzal, V.; Alasoo, K.; Ashford, S.; Bala, S.; Bensaddek, D.; Casale, F.P.; Culley, O.J.; et al. Common genetic variation drives molecular heterogeneity in human iPSCs. Nature 2017, 546, 370–375. [Google Scholar] [CrossRef] [PubMed] [Green Version]
- Krebs, M.P.; Xiao, M.; Sheppard, K.; Hicks, W.; Nishina, P.M. Bright-field imaging and optical coherence tomography of the mouse posterior eye. Methods Mol. Biol. 2016, 1438, 395–415. [Google Scholar] [PubMed]
- Kinoshita, J.; Peachey, N.S. Noninvasive Electroretinographic Procedures for the Study of the Mouse Retina. Curr. Protoc. Mouse Biol. 2018, 8, 1–16. [Google Scholar] [CrossRef]


Publisher’s Note: MDPI stays neutral with regard to jurisdictional claims in published maps and institutional affiliations. |
© 2022 by the authors. Licensee MDPI, Basel, Switzerland. This article is an open access article distributed under the terms and conditions of the Creative Commons Attribution (CC BY) license (https://creativecommons.org/licenses/by/4.0/).
Share and Cite
Collin, G.B.; Shi, L.; Yu, M.; Akturk, N.; Charette, J.R.; Hyde, L.F.; Weatherly, S.M.; Pera, M.F.; Naggert, J.K.; Peachey, N.S.; et al. A Splicing Mutation in Slc4a5 Results in Retinal Detachment and Retinal Pigment Epithelium Dysfunction. Int. J. Mol. Sci. 2022, 23, 2220. https://0-doi-org.brum.beds.ac.uk/10.3390/ijms23042220
Collin GB, Shi L, Yu M, Akturk N, Charette JR, Hyde LF, Weatherly SM, Pera MF, Naggert JK, Peachey NS, et al. A Splicing Mutation in Slc4a5 Results in Retinal Detachment and Retinal Pigment Epithelium Dysfunction. International Journal of Molecular Sciences. 2022; 23(4):2220. https://0-doi-org.brum.beds.ac.uk/10.3390/ijms23042220
Chicago/Turabian StyleCollin, Gayle B., Lanying Shi, Minzhong Yu, Nurten Akturk, Jeremy R. Charette, Lillian F. Hyde, Sonia M. Weatherly, Martin F. Pera, Jürgen K. Naggert, Neal S. Peachey, and et al. 2022. "A Splicing Mutation in Slc4a5 Results in Retinal Detachment and Retinal Pigment Epithelium Dysfunction" International Journal of Molecular Sciences 23, no. 4: 2220. https://0-doi-org.brum.beds.ac.uk/10.3390/ijms23042220