
An In Vivo Model of Separate M. tuberculosis Phagocytosis by Neutrophils and Macrophages: Gene Expression Profiles in the Parasite and Disease Development in the Mouse Host

 , and
, and 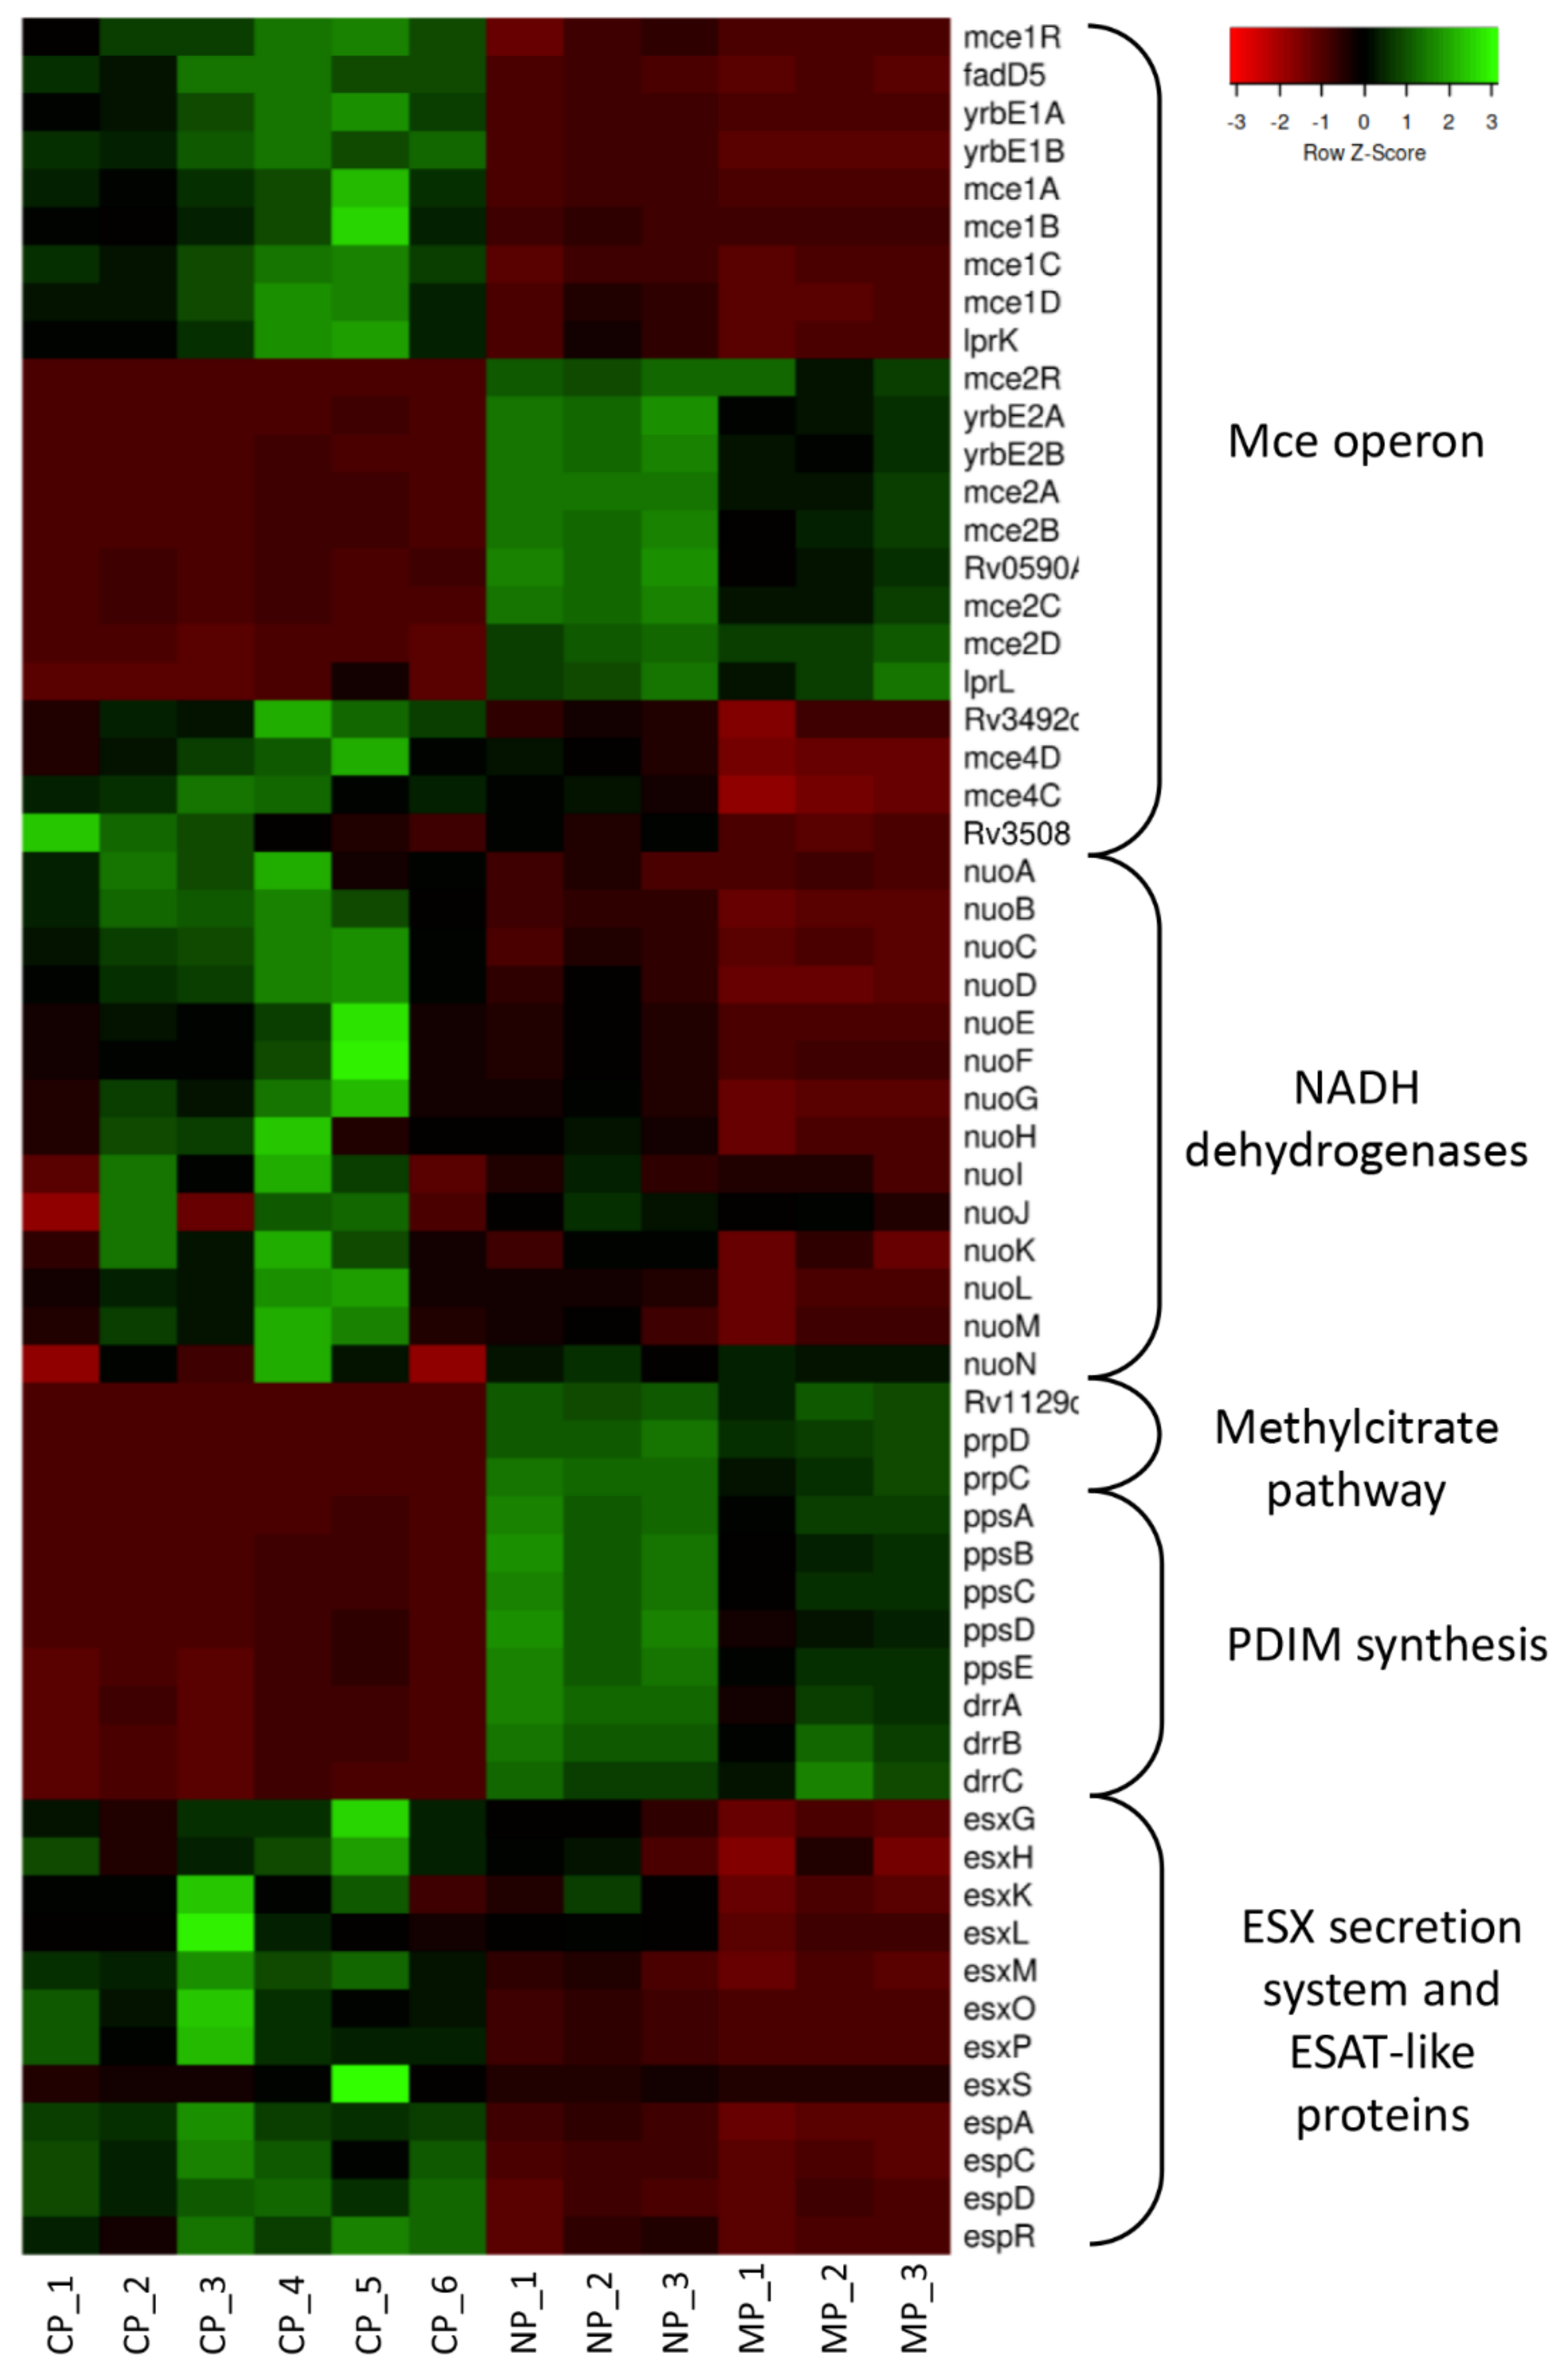
Abstract
:1. Introduction
2. Results and Discussion
2.1. Gene Expression Profiles in Mycobacteria
2.1.1. General Picture
2.1.2. Common Gene Expression Changes for MP and NP Mycobacteria
- (a)
- Increased expression of transcription regulators
- (b)
- PE/PPE proteins and ESX secretion systems
- (c)
- Mammalian cell entry (Mce) operons
- (d)
- PDIM synthesis
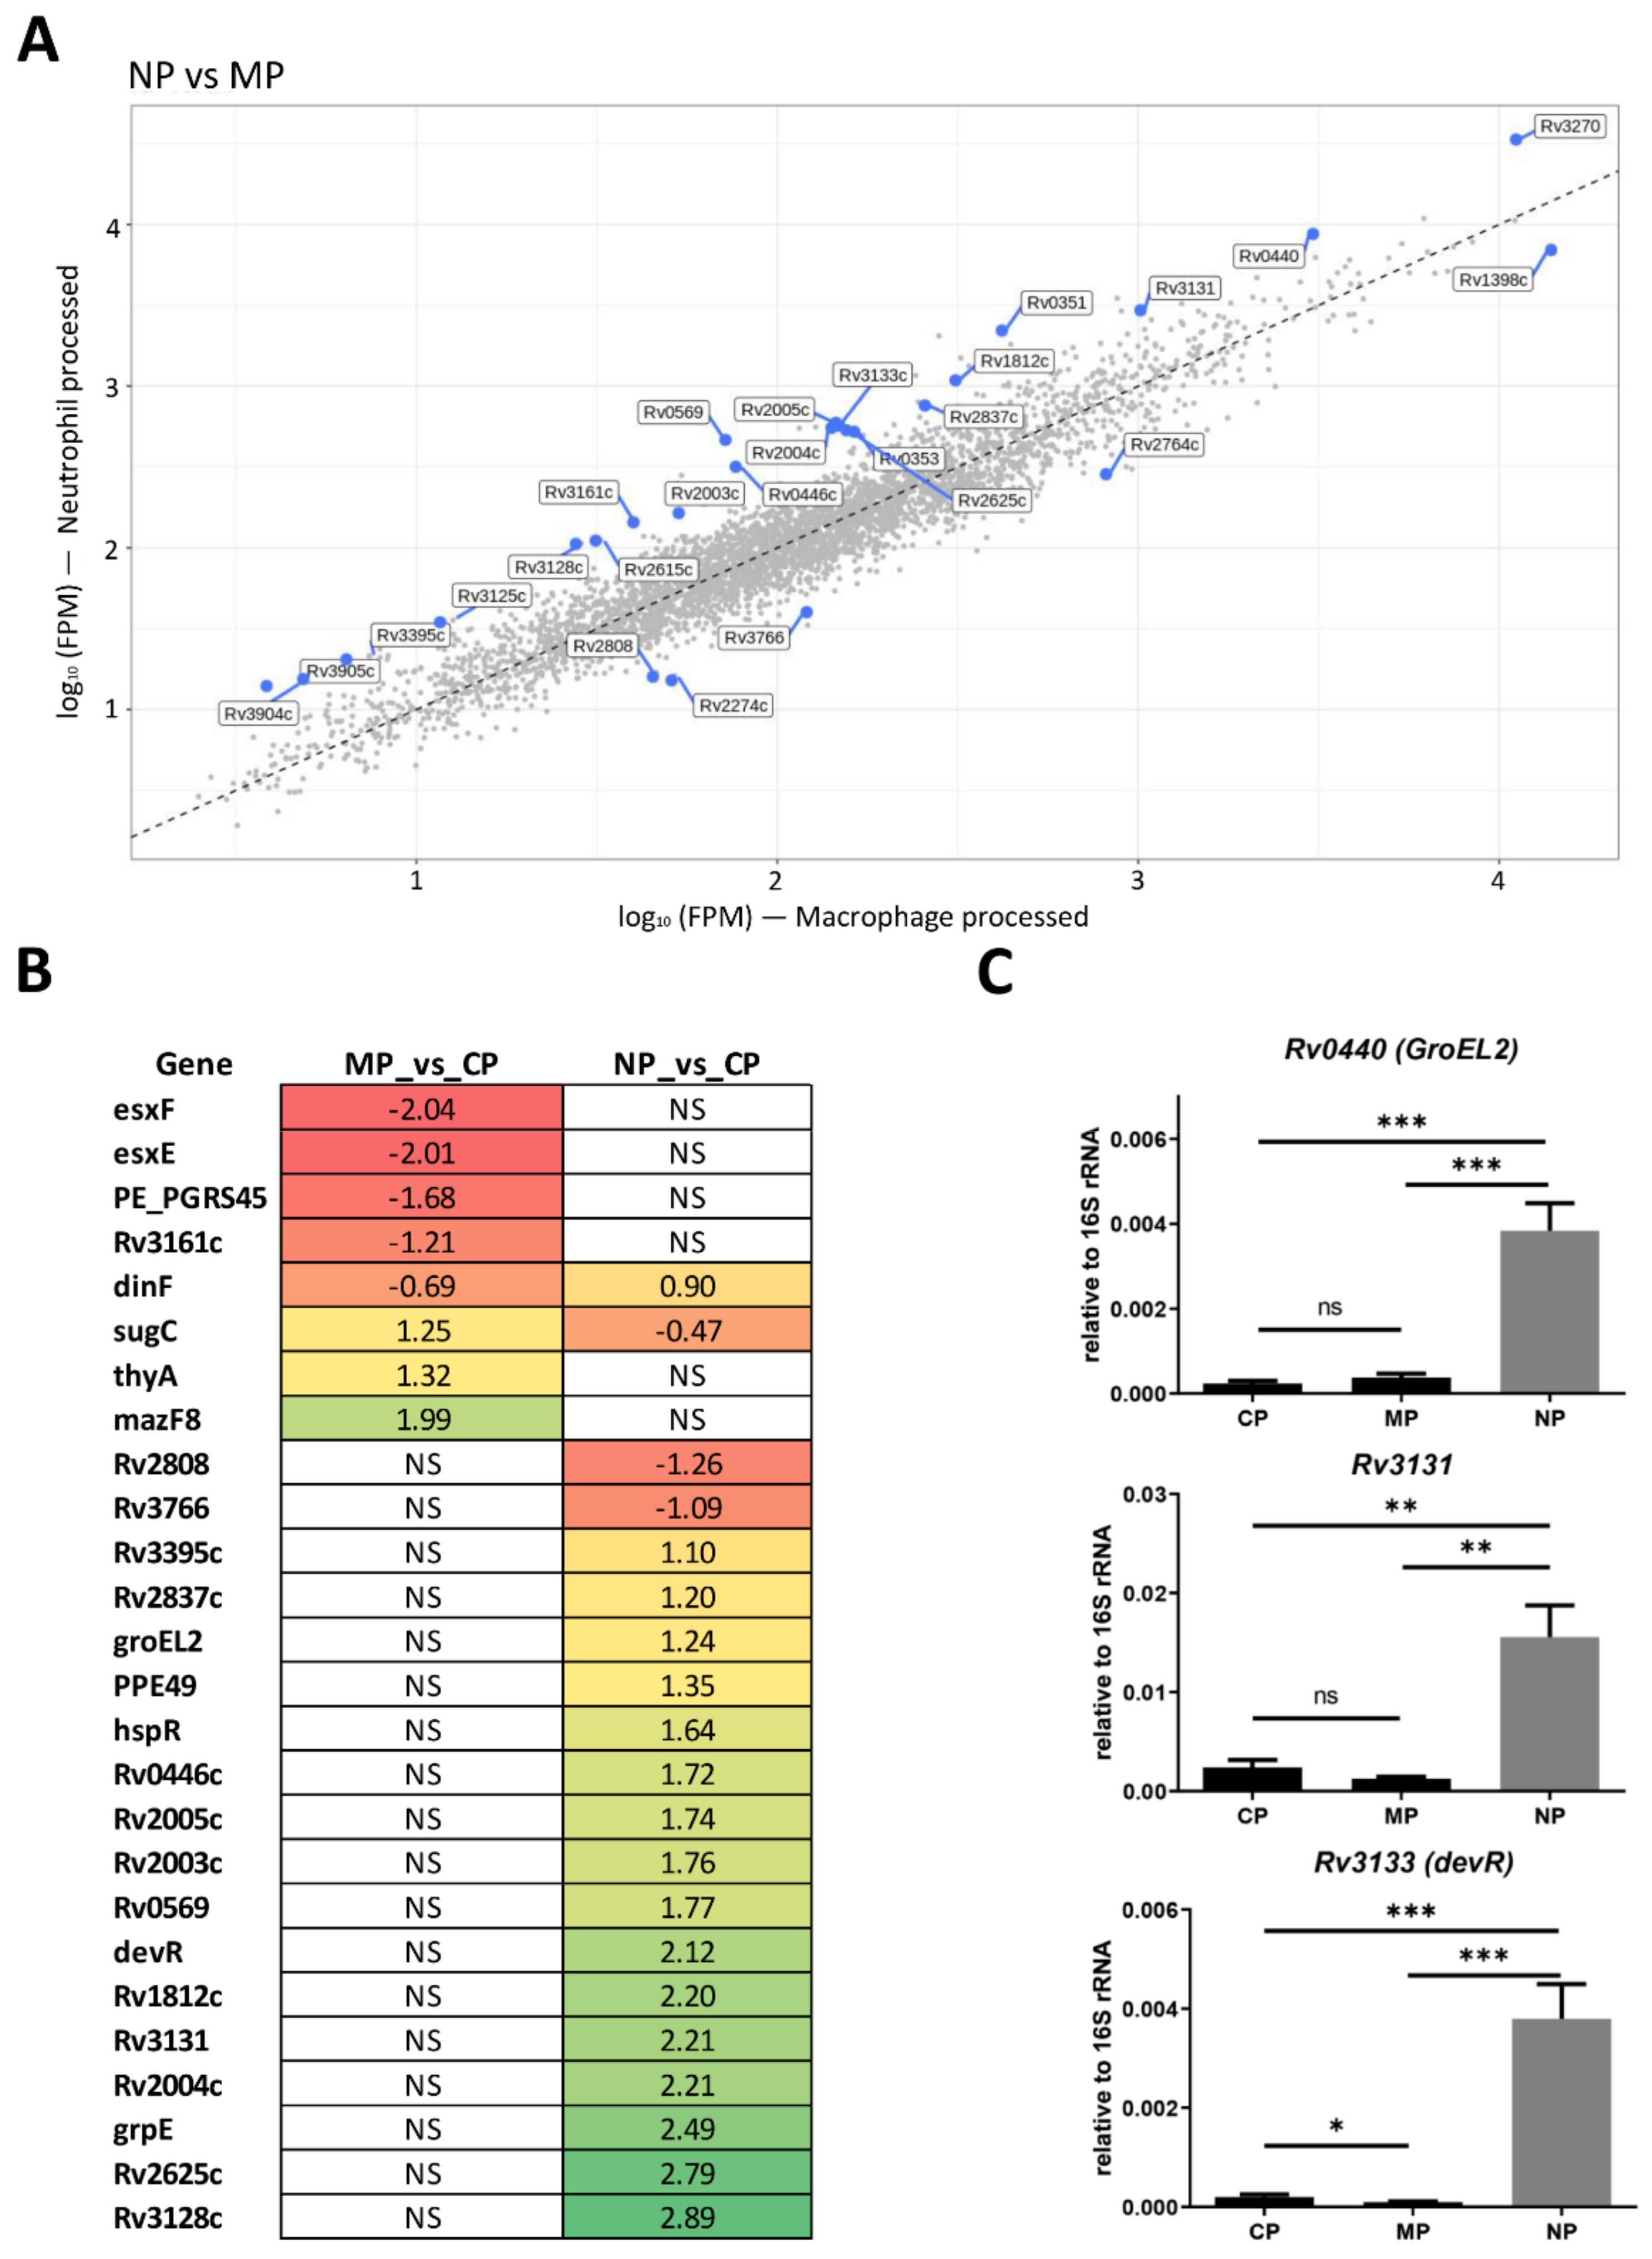
2.1.3. Mycobacterial Genes Differentially Changing the Expression within Macrophages and Neutrophils

2.2. TB Infection and Immune Response
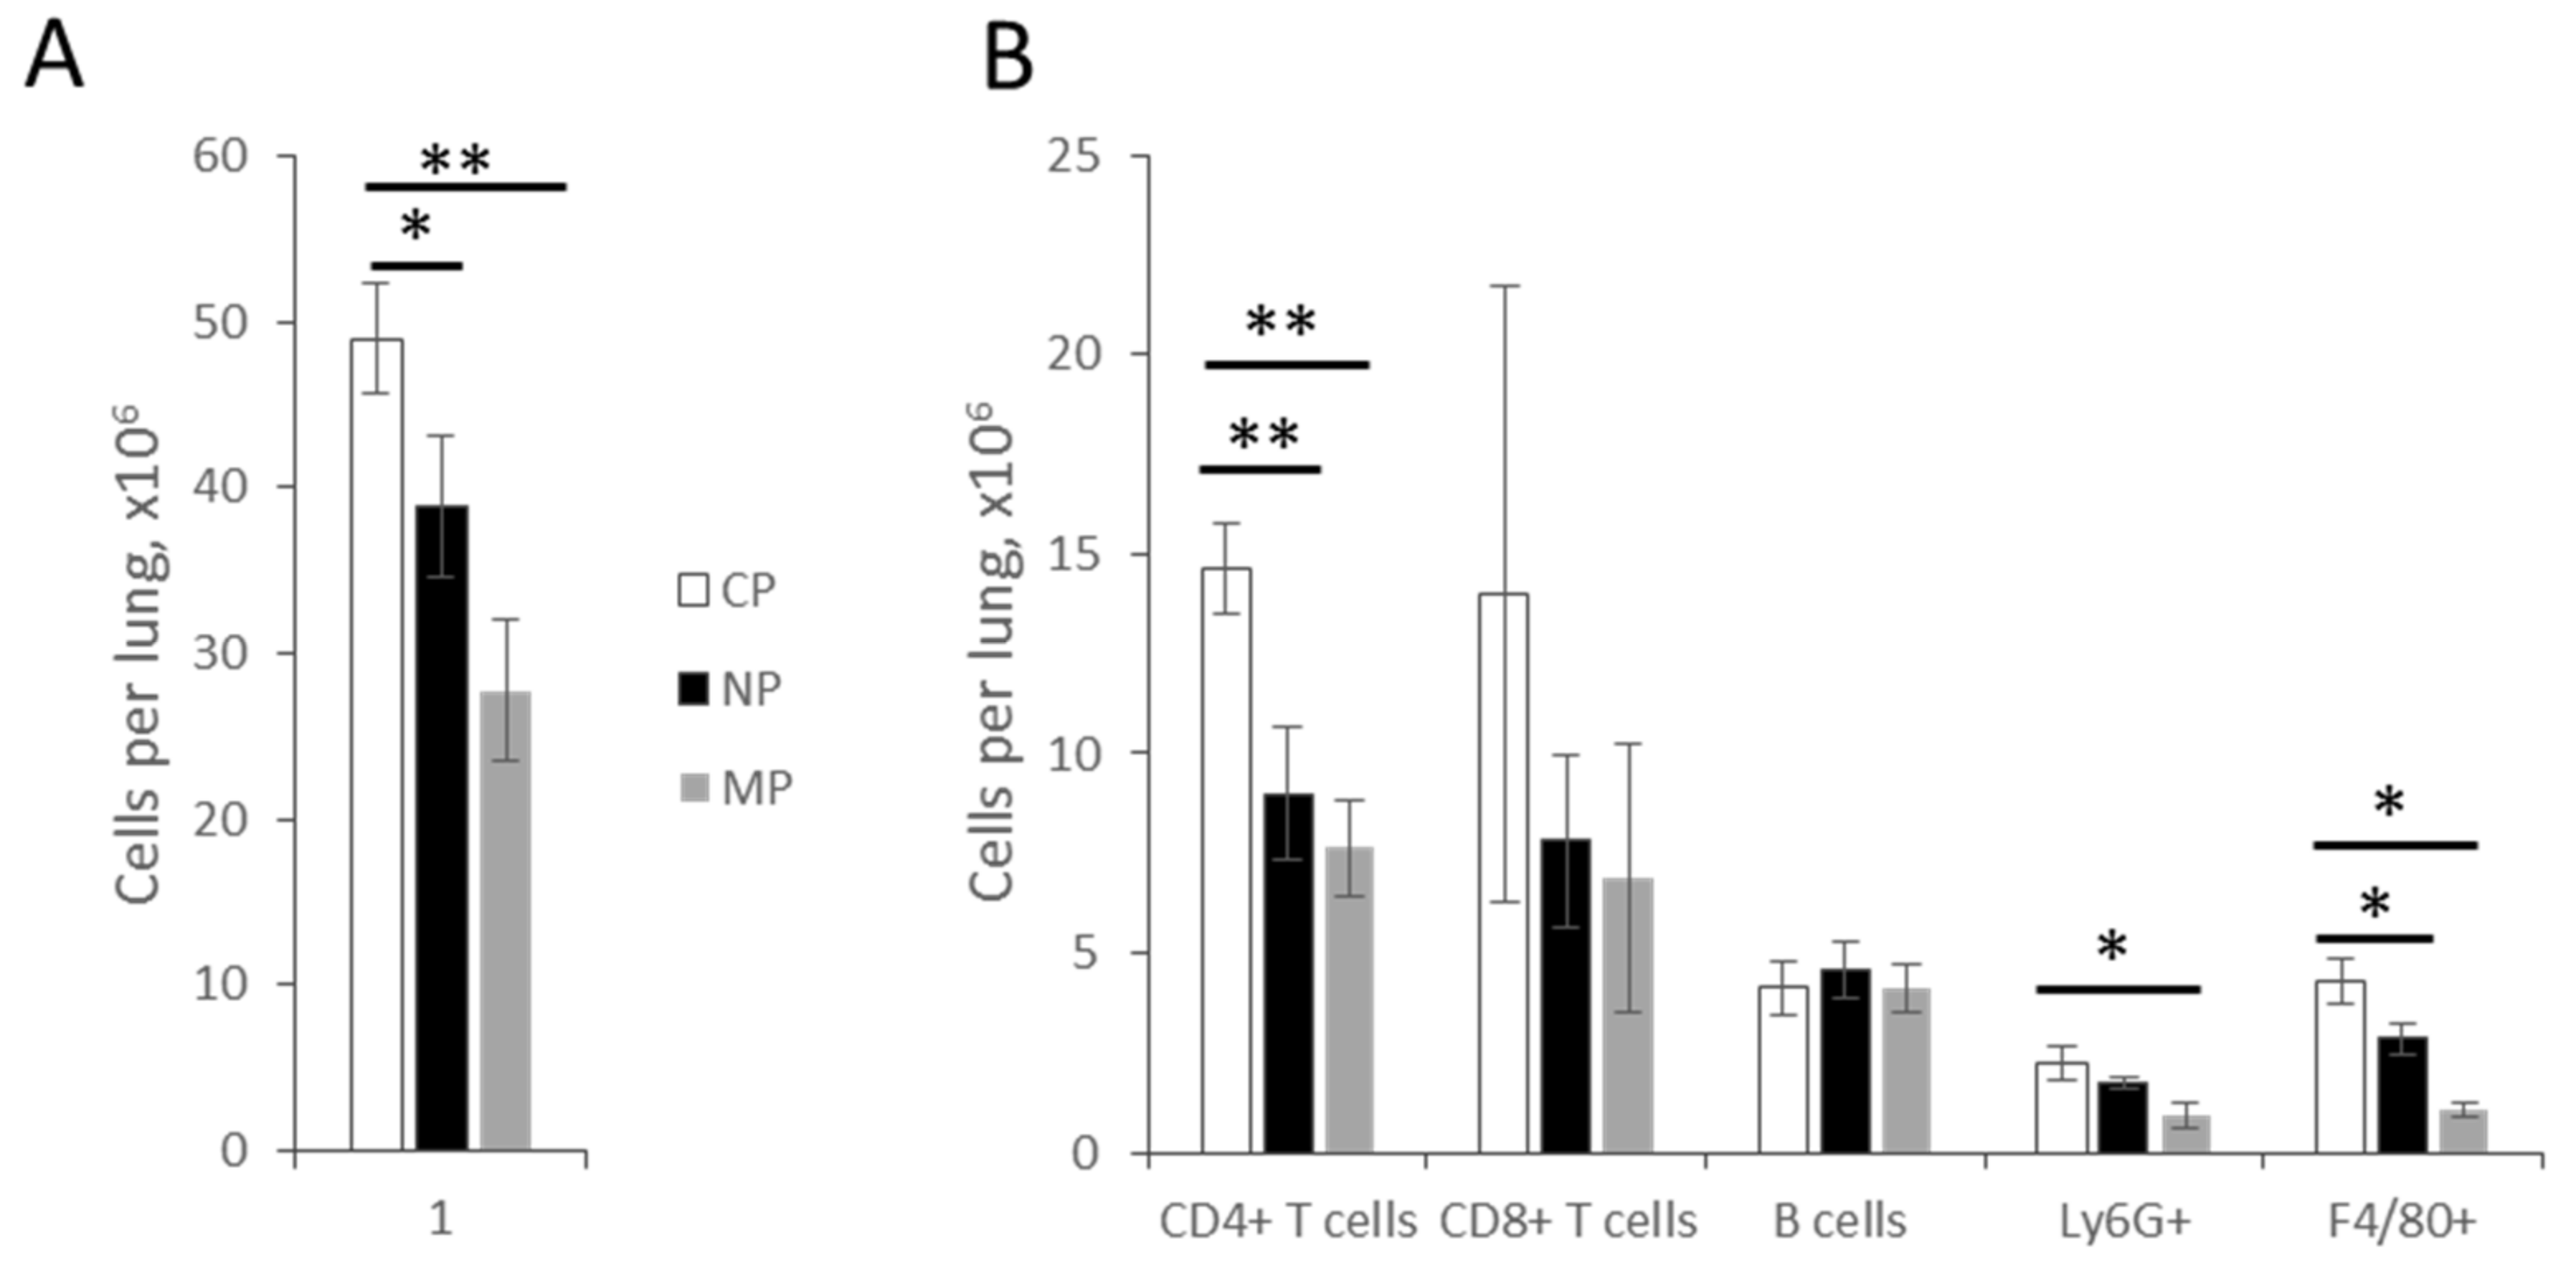
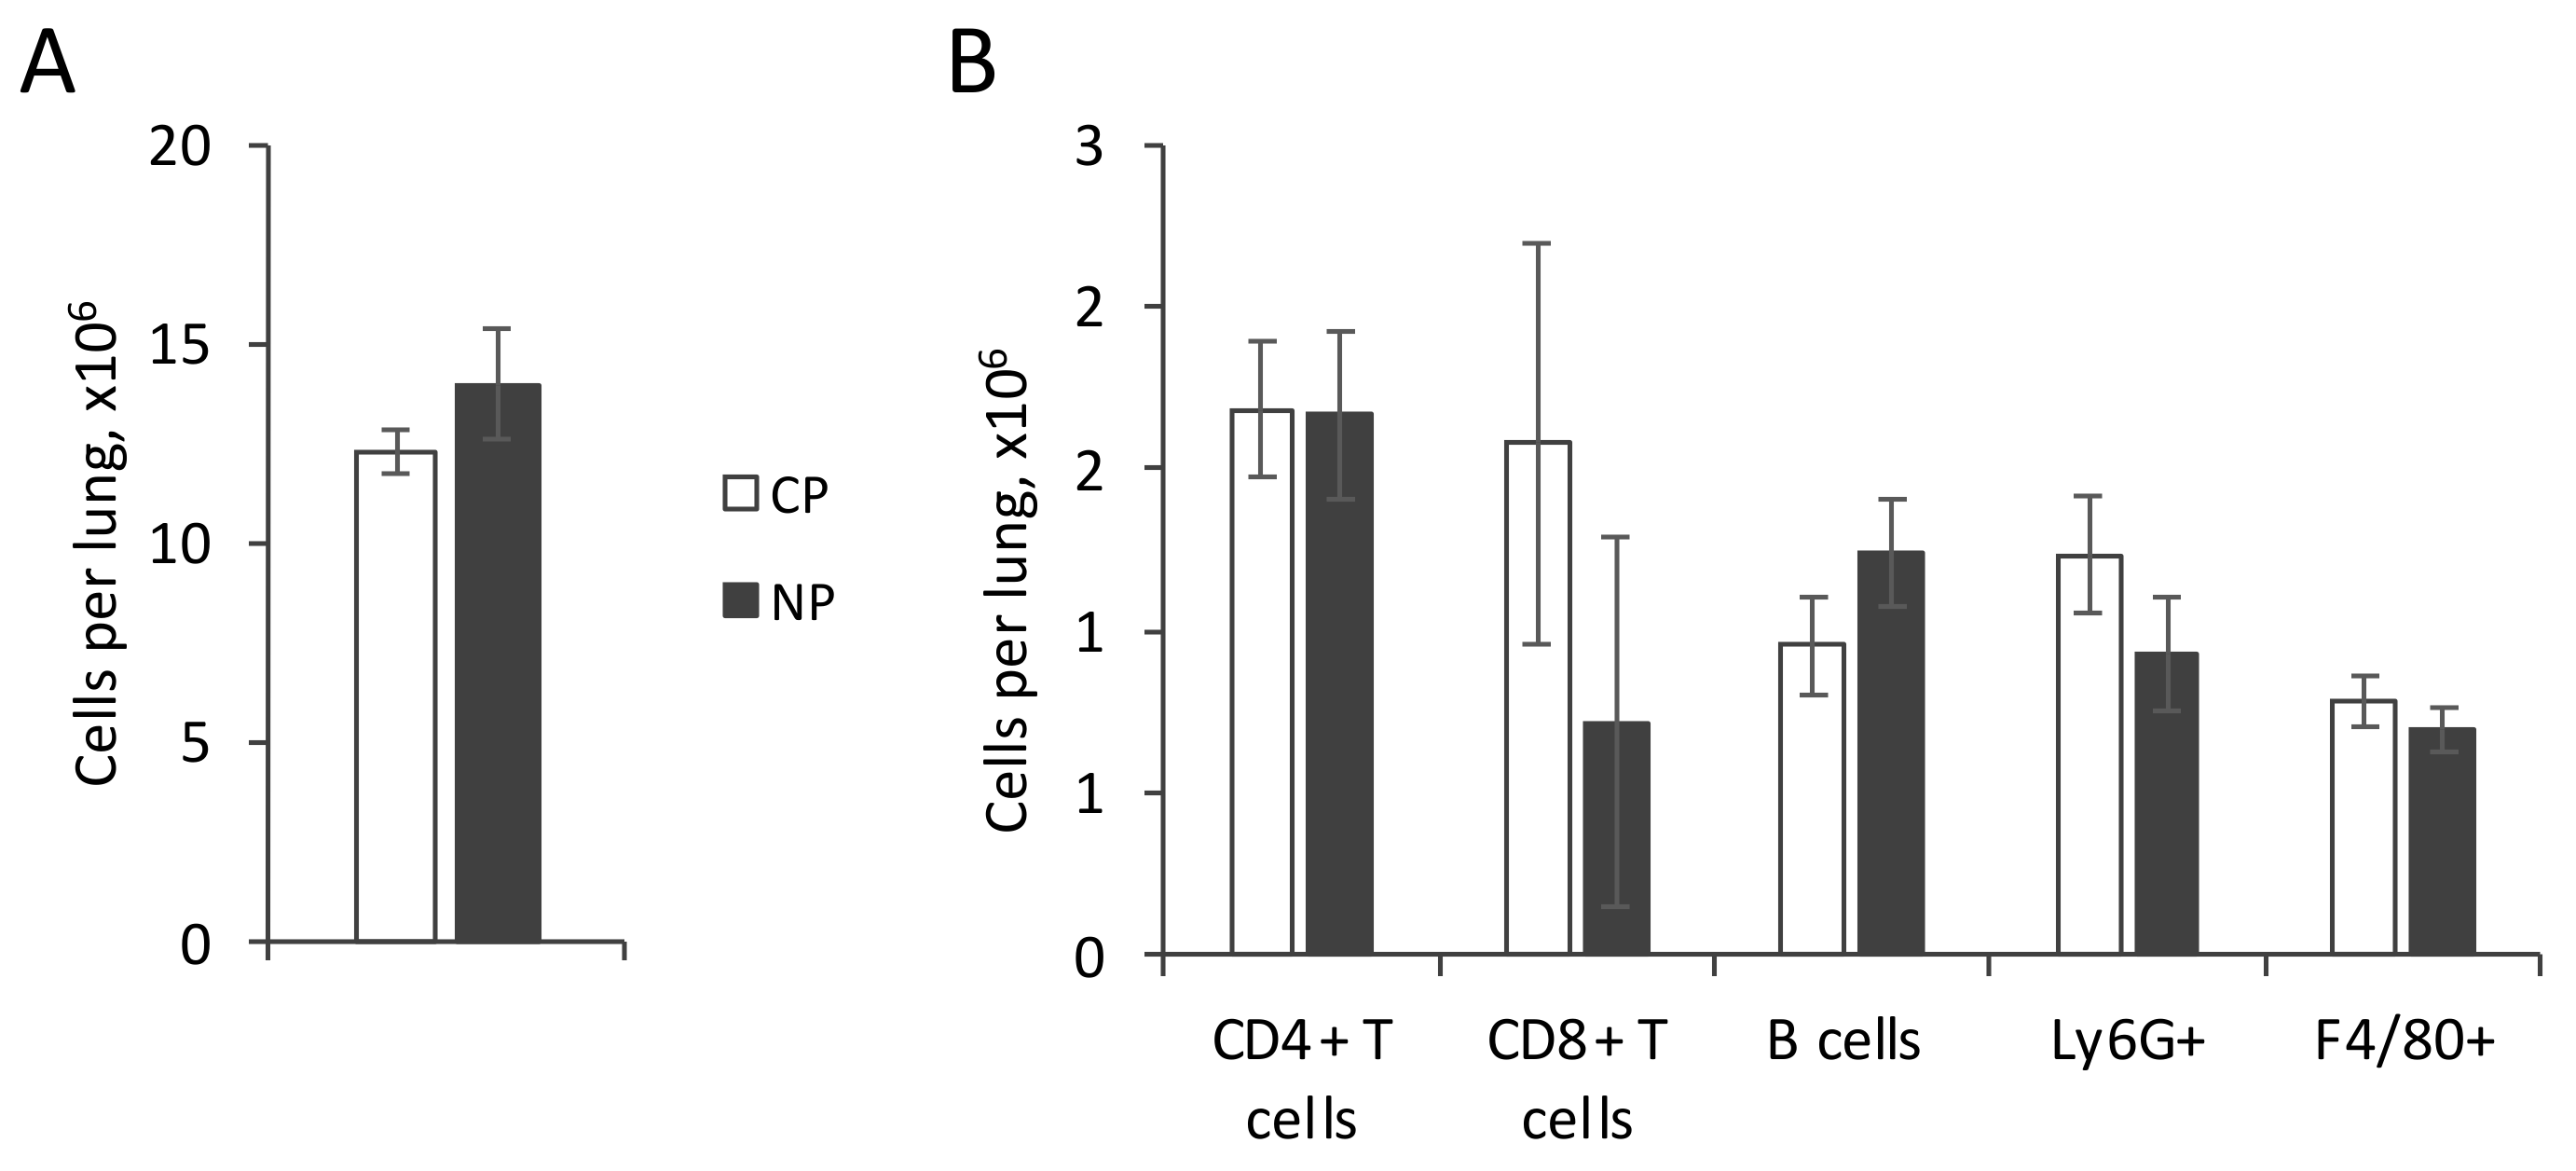
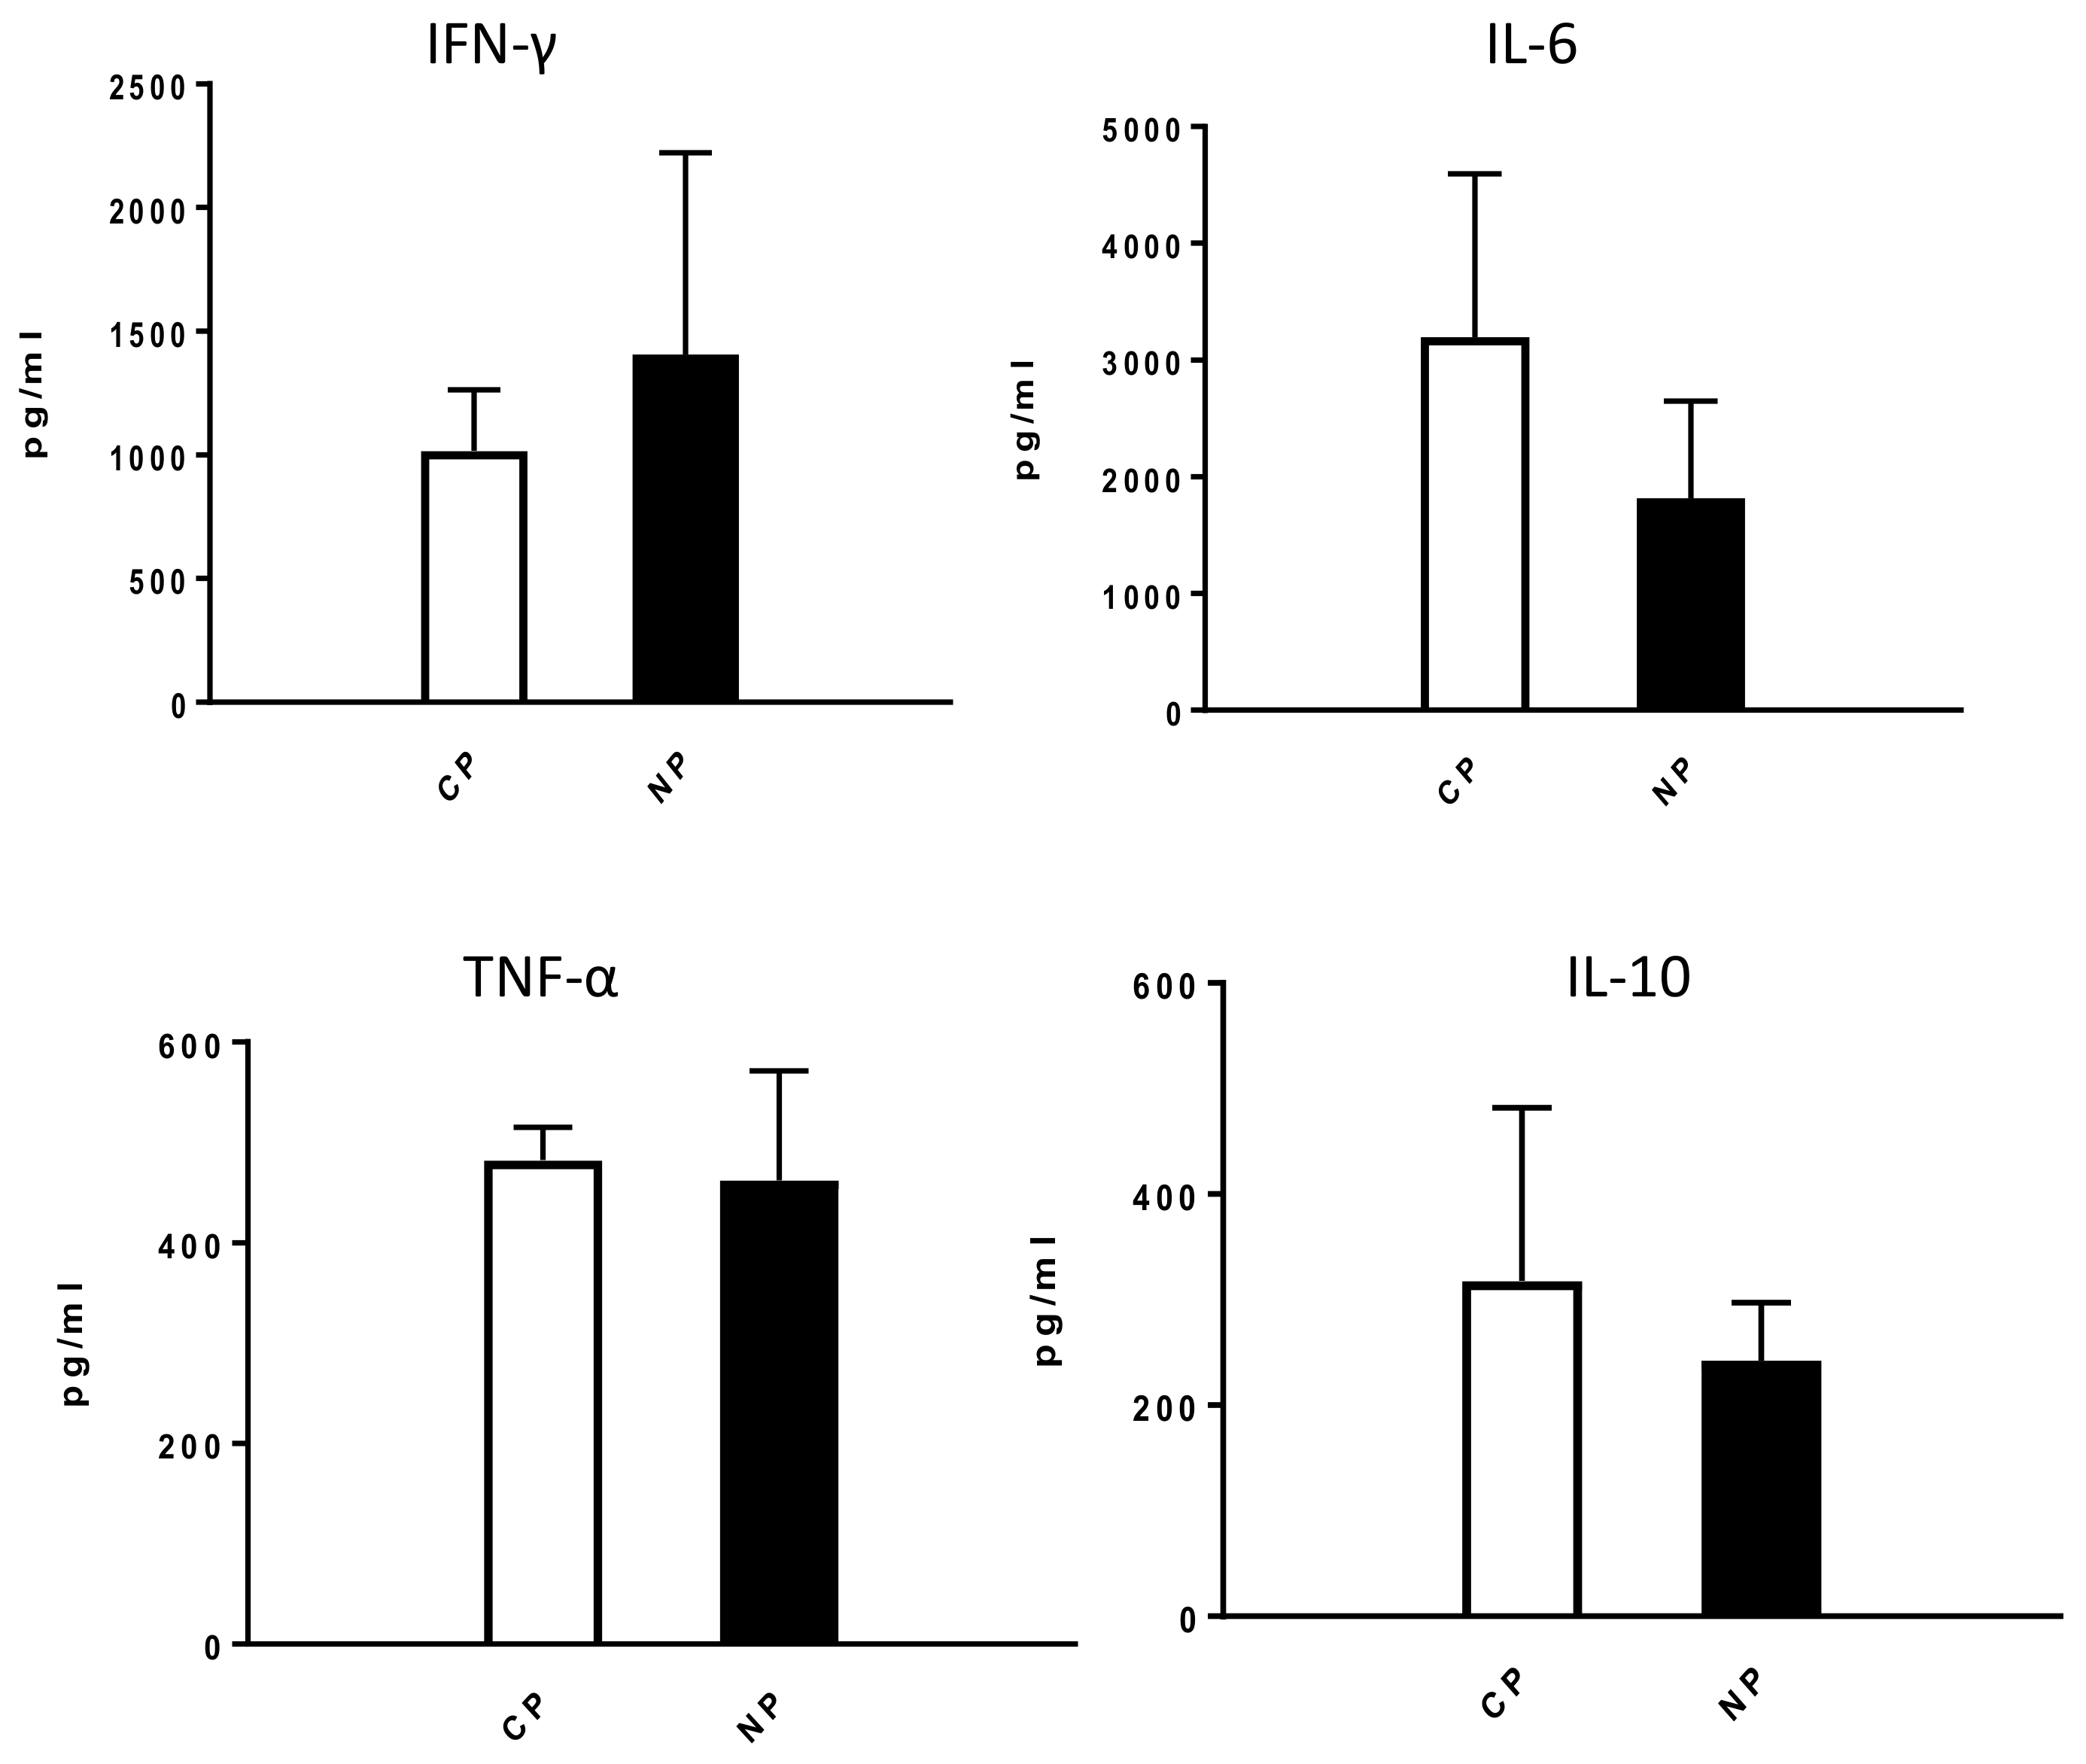
2.2.1. Lung Infiltration by Immune Cells and Cytokine Production
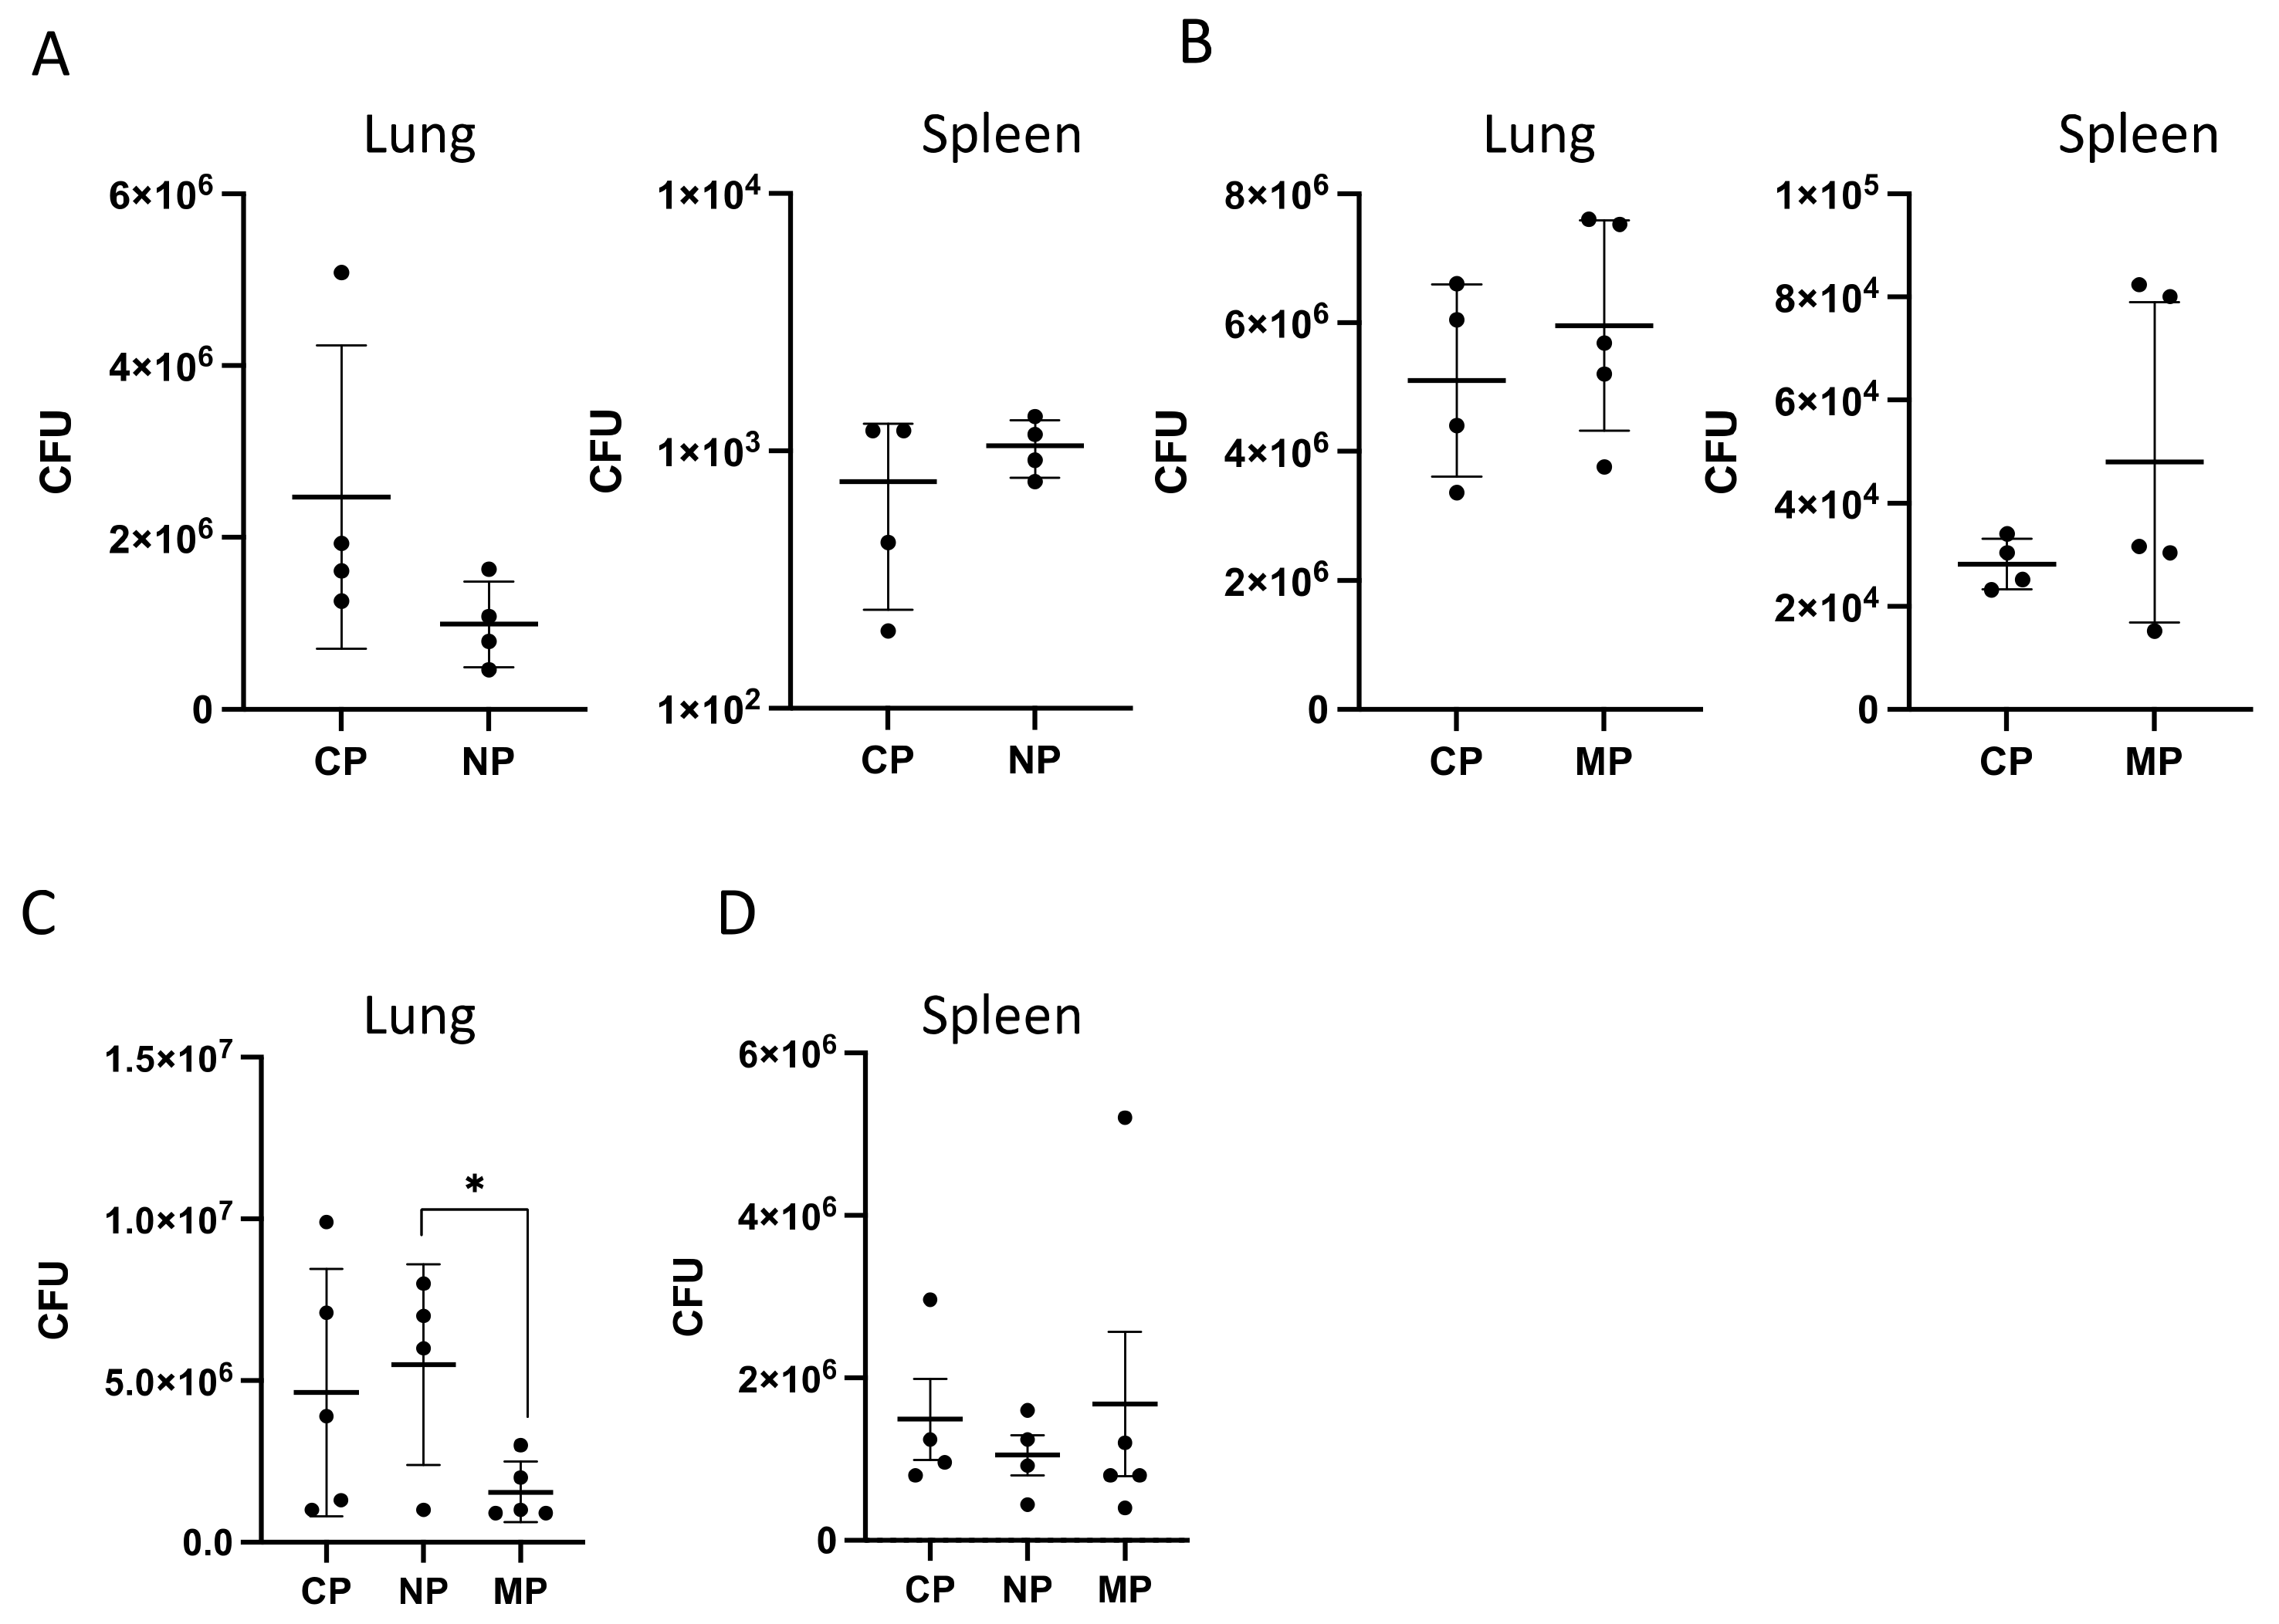
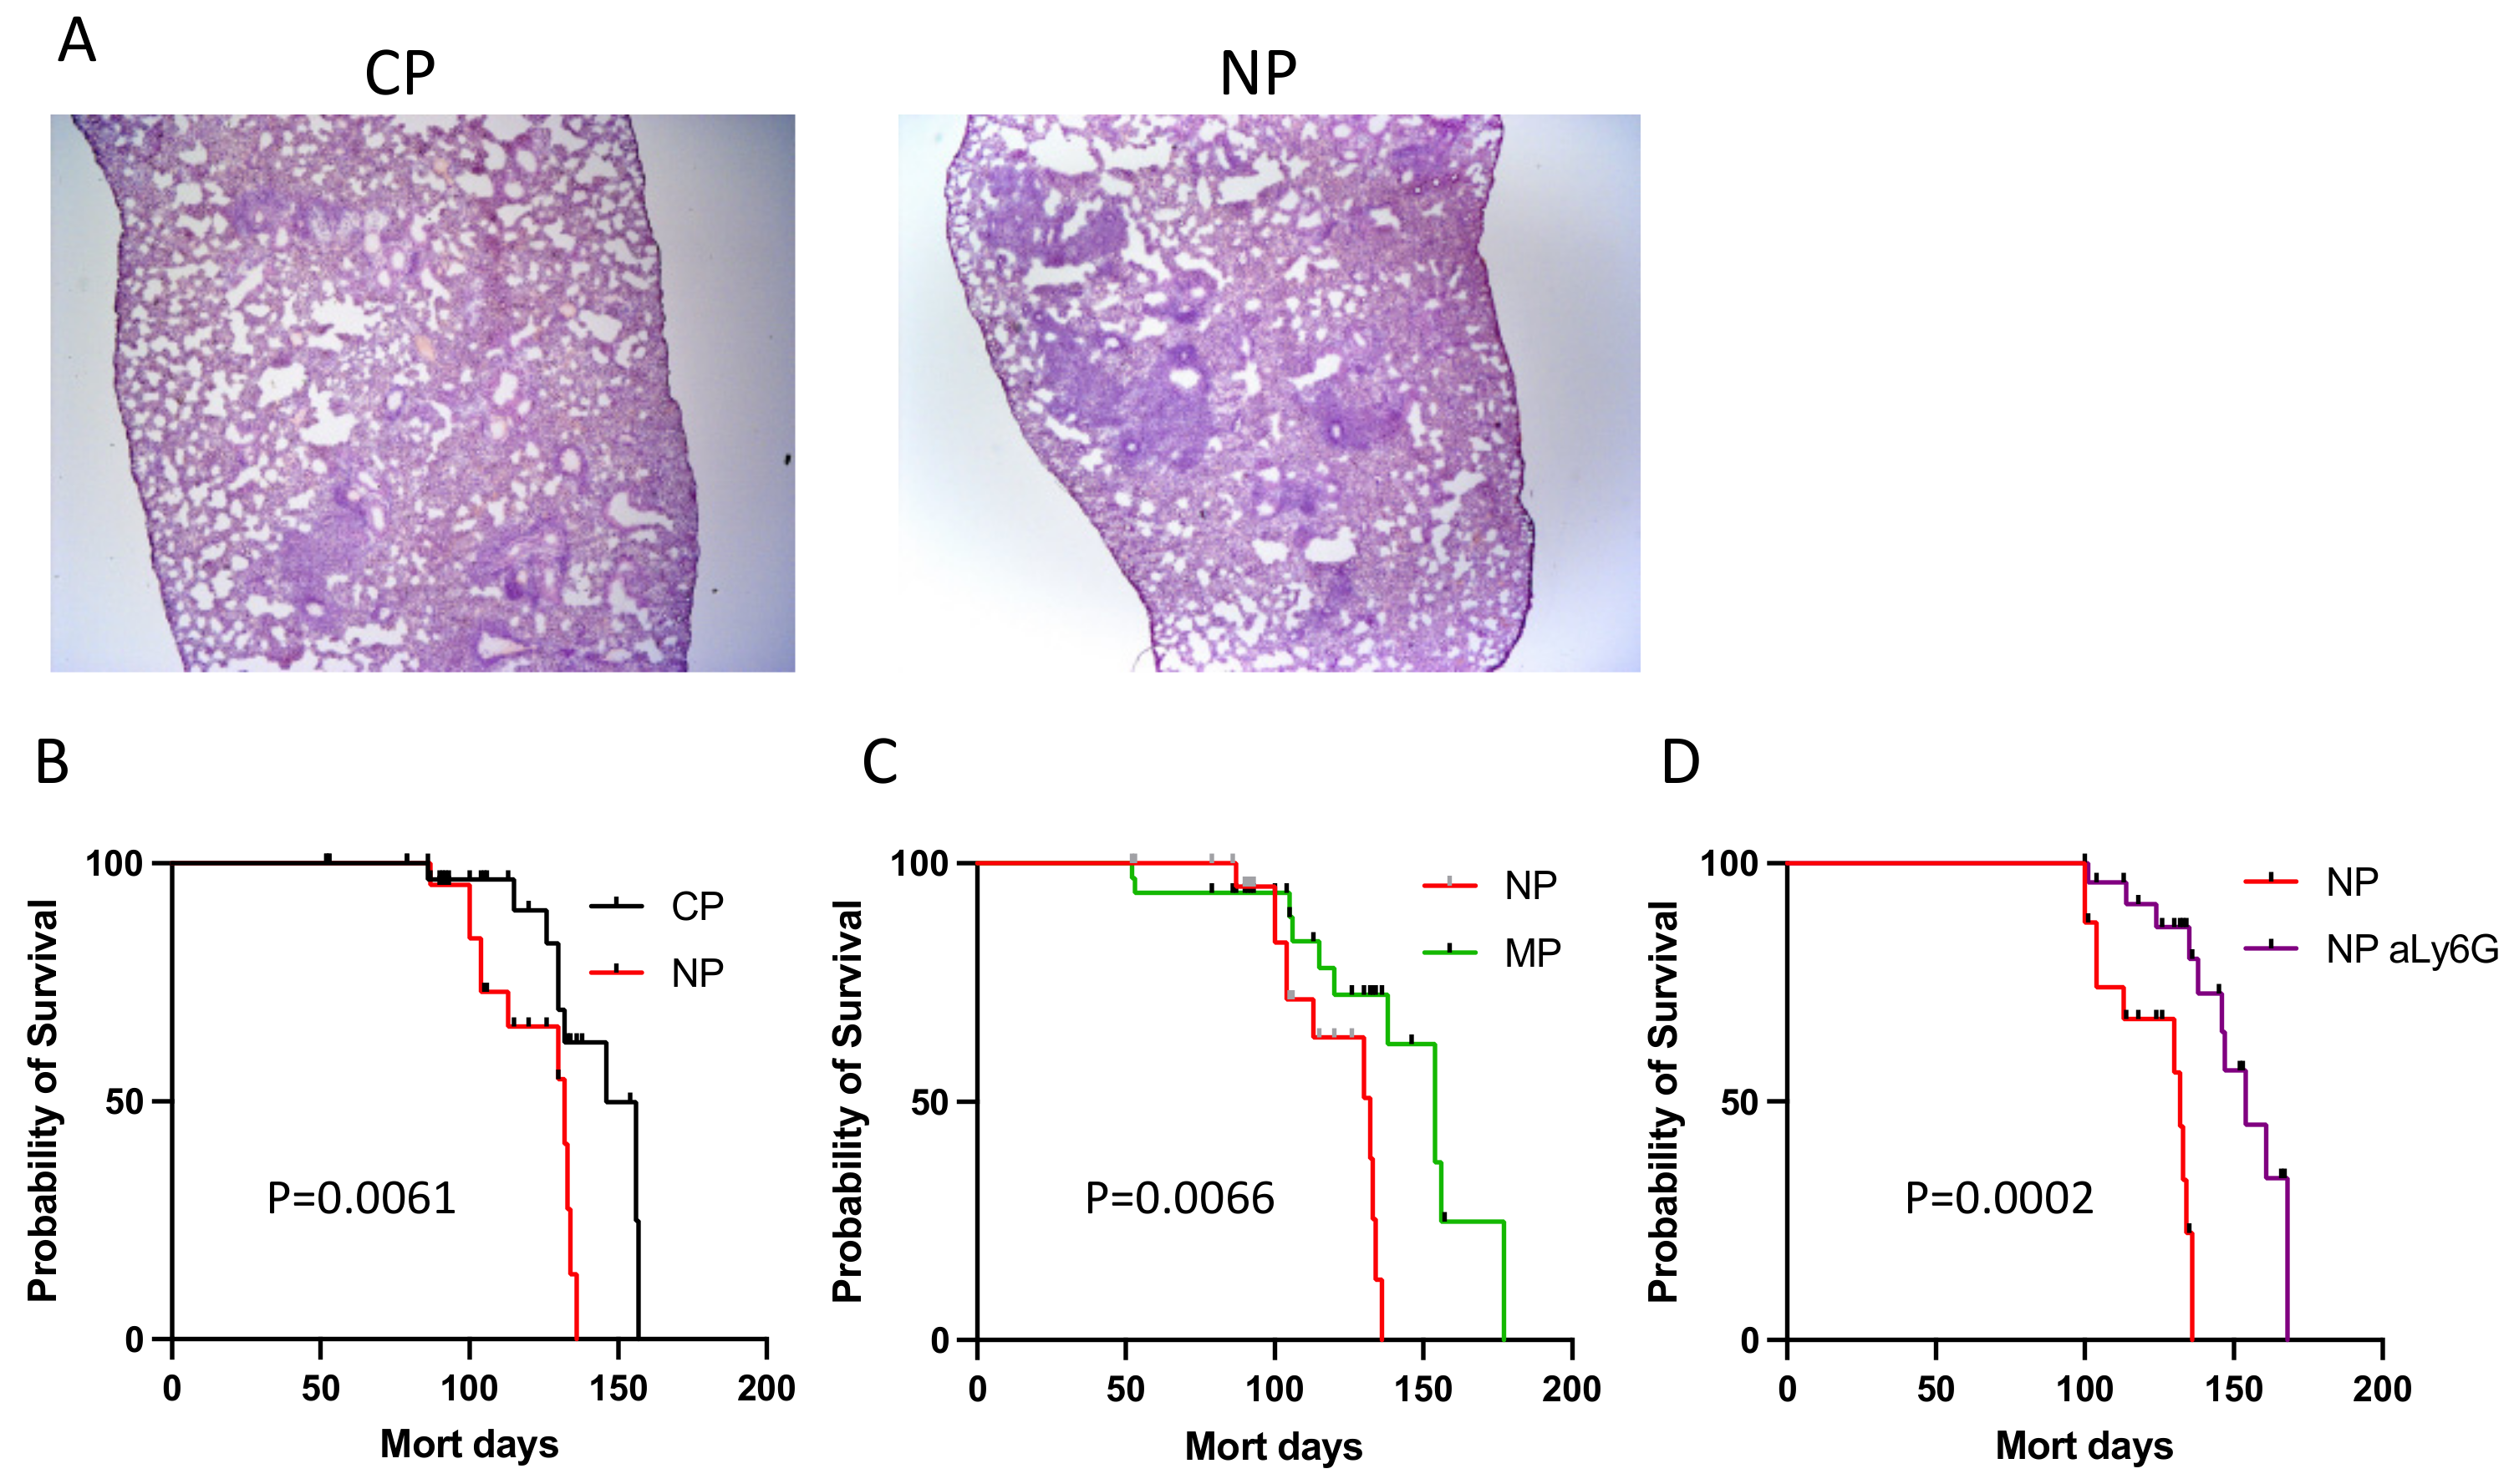
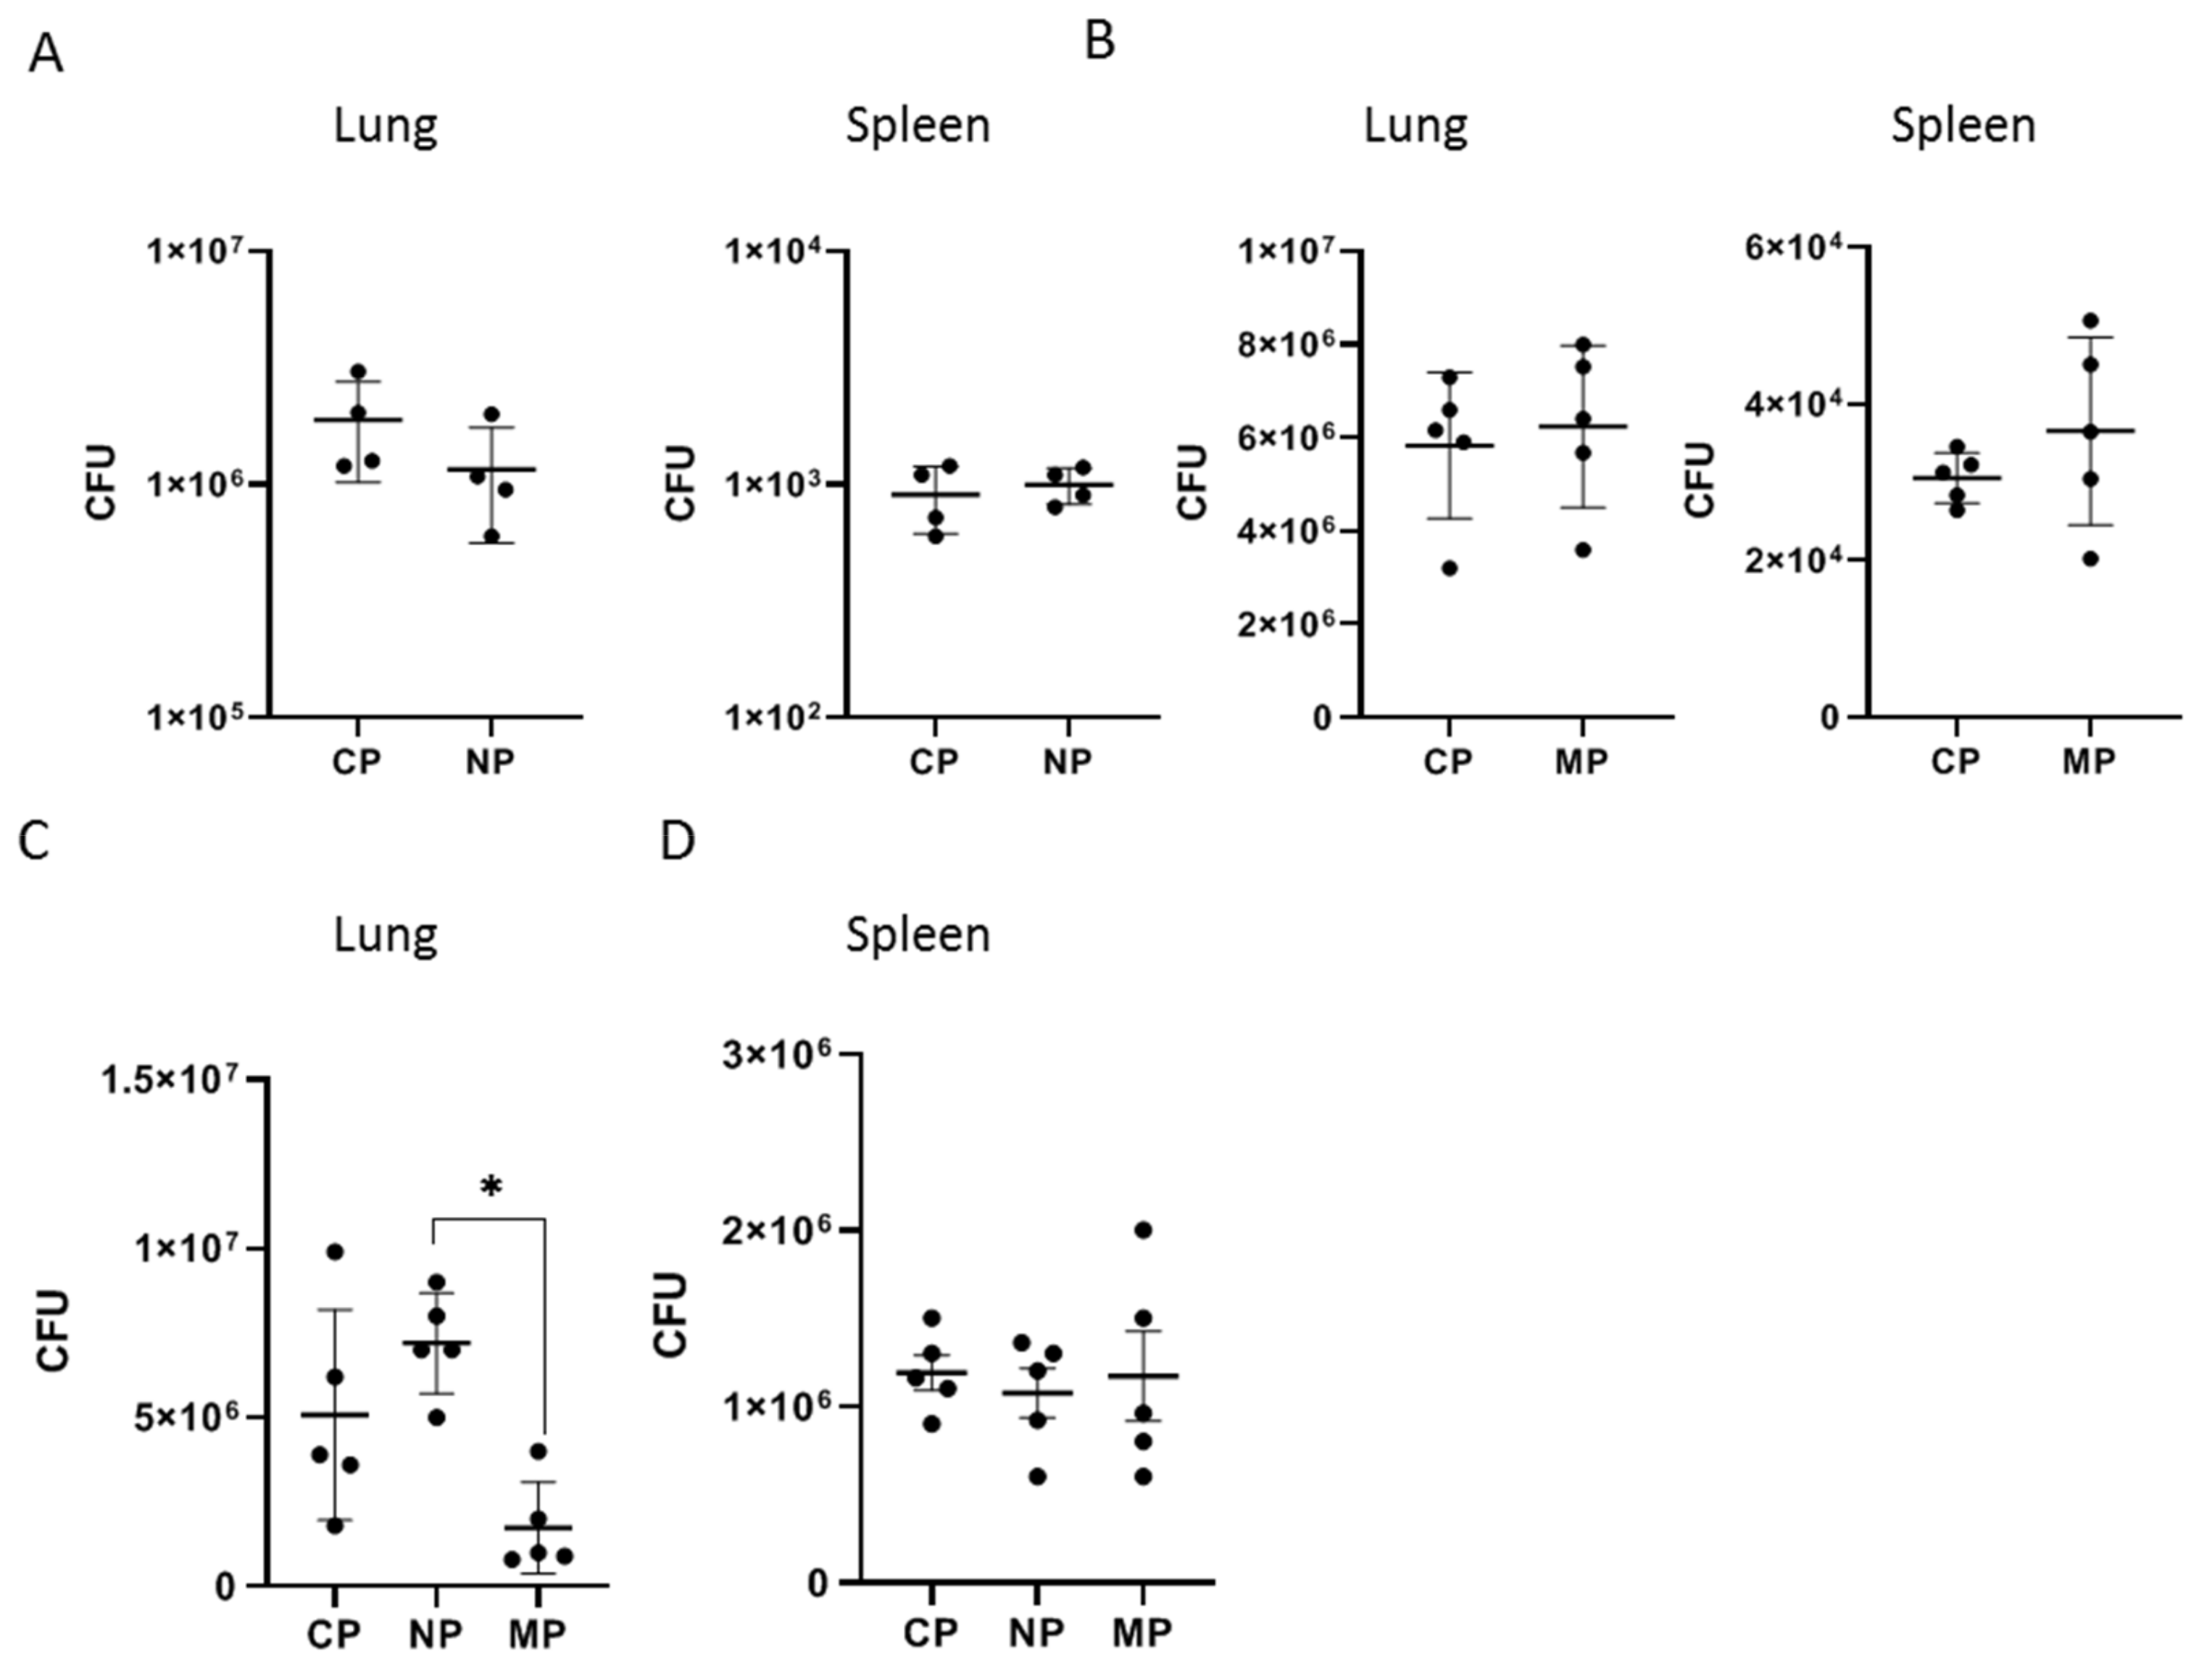
2.2.2. Mycobacterial Multiplication and Disease Severity
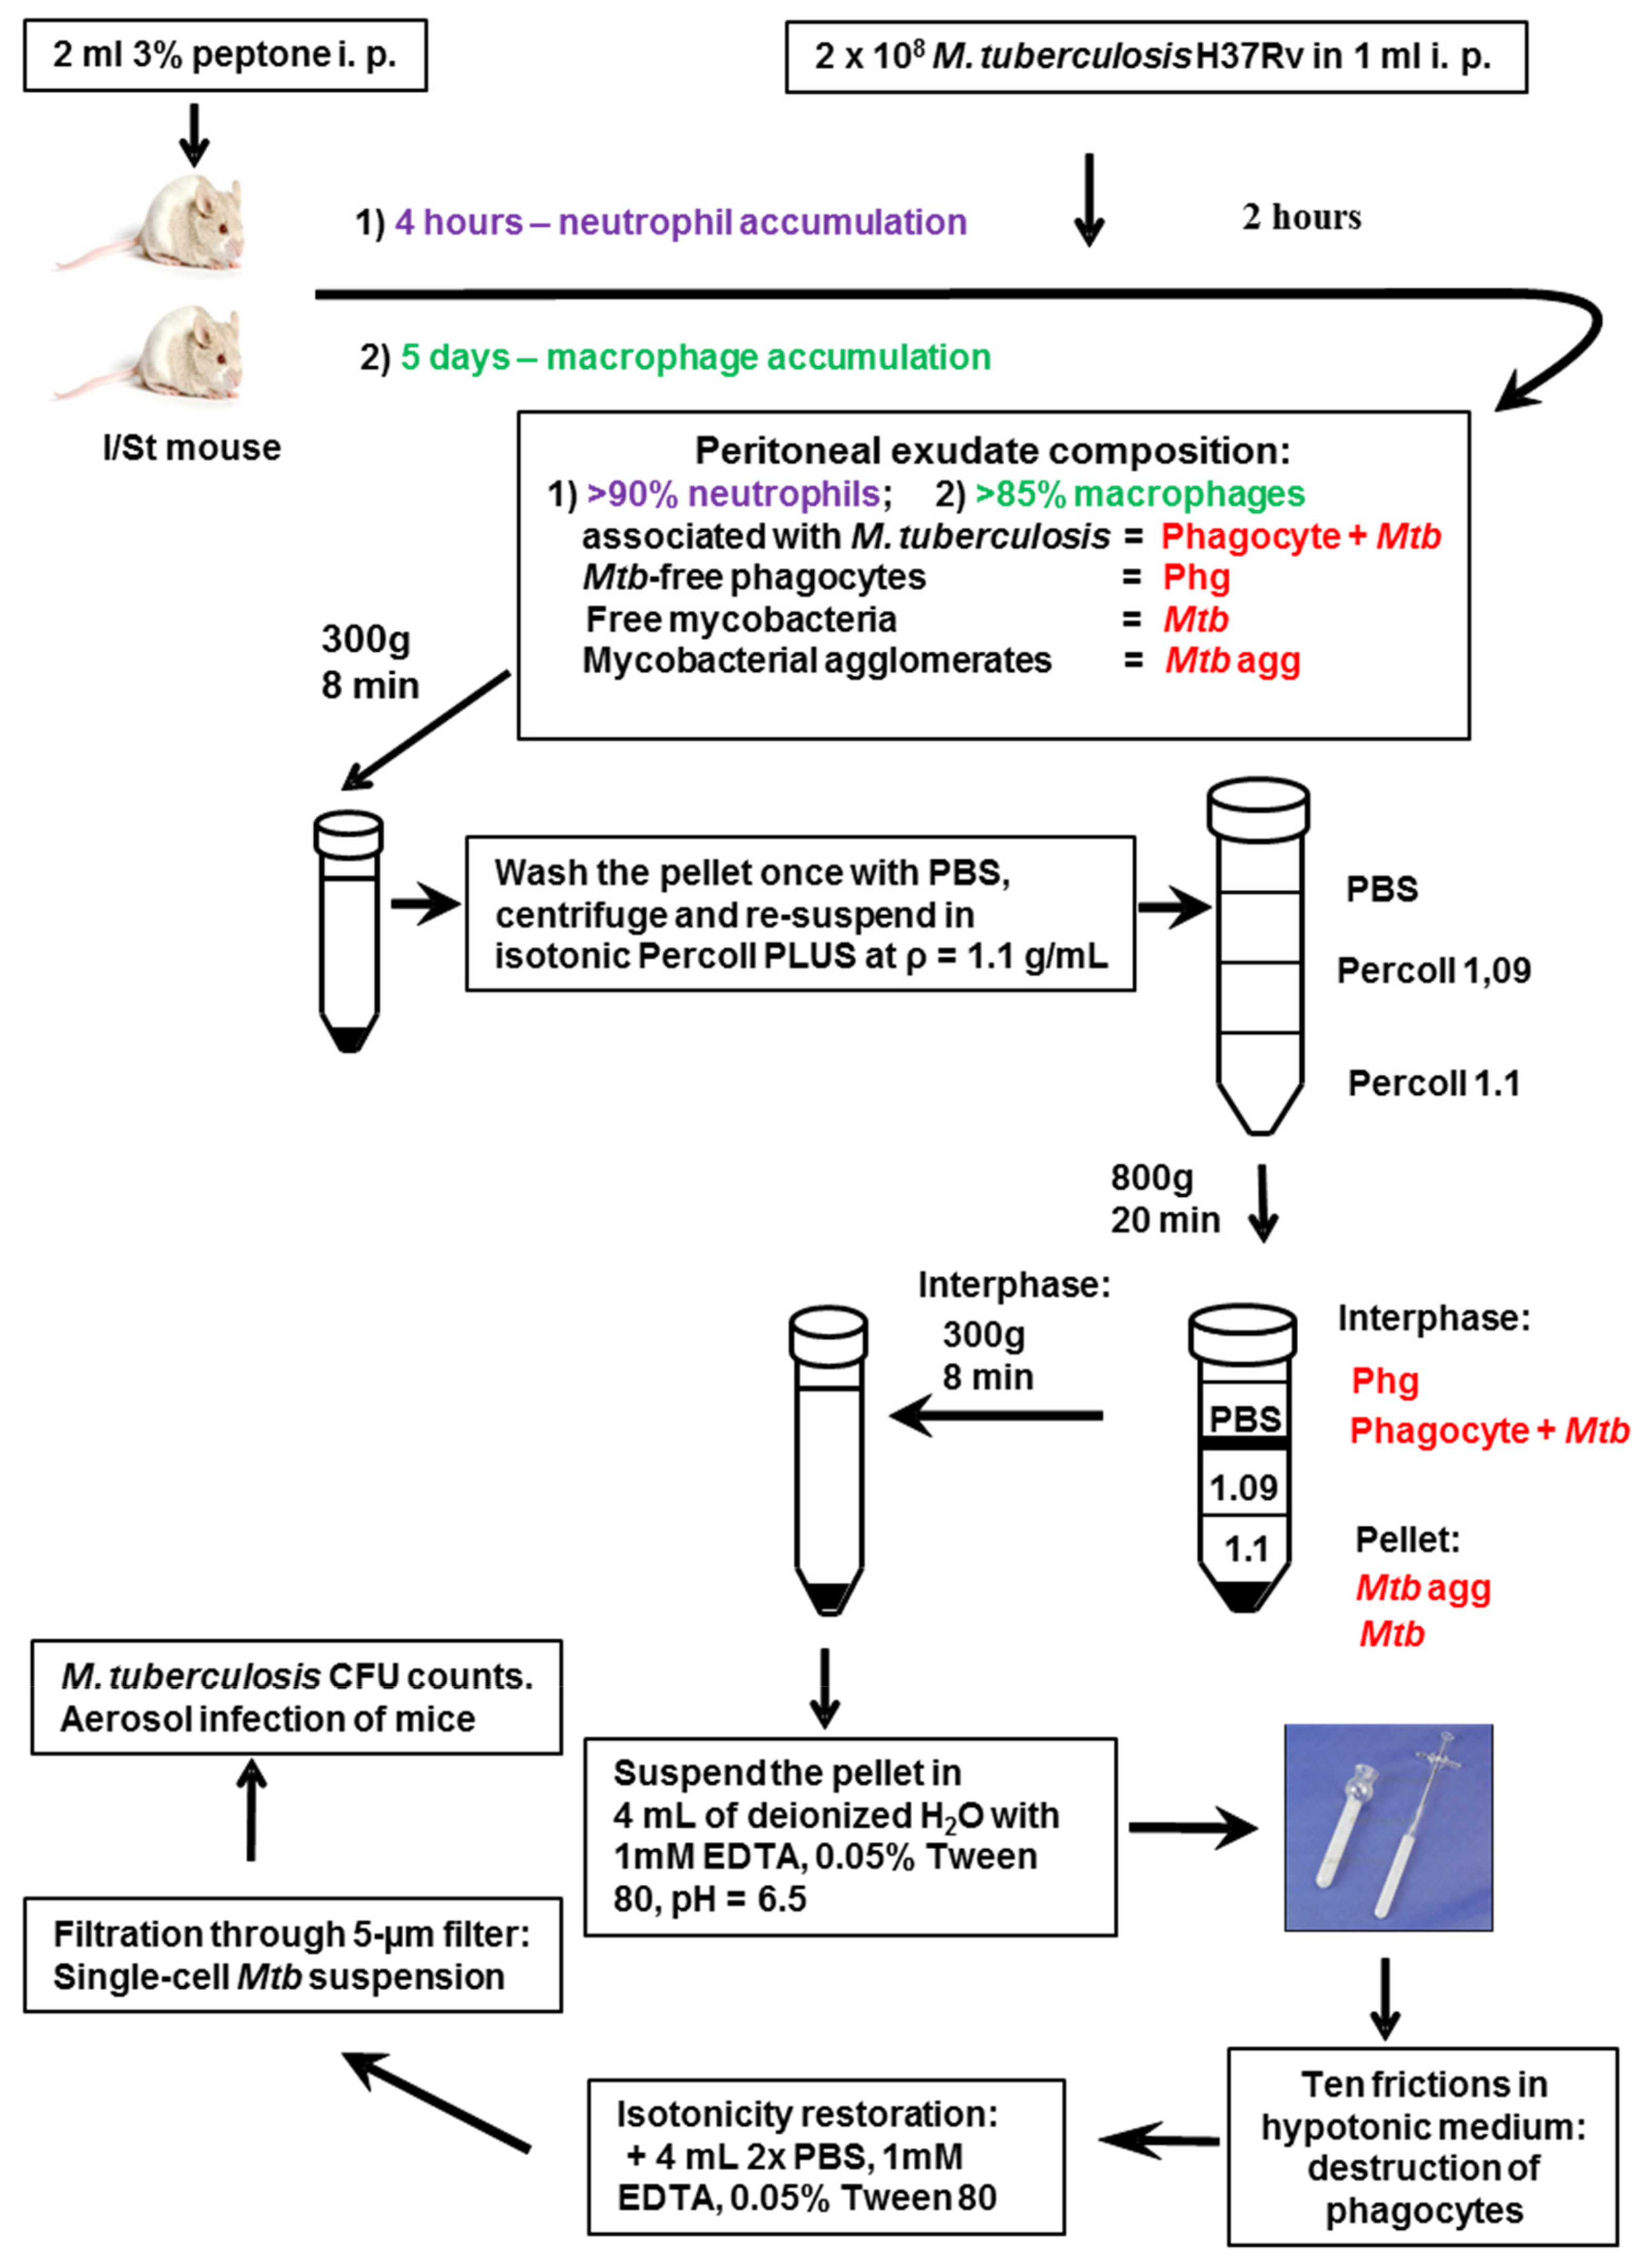
3. Materials and Methods
3.1. Gene Expression Profiling
3.2. Infection and Immunity
Supplementary Materials
Author Contributions
Funding
Institutional Review Board Statement
Data Availability Statement
Conflicts of Interest
Appendix A


References
- Eum, S.Y.; Kong, J.H.; Hong, M.S.; Lee, Y.J.; Kim, J.H.; Hwang, S.H.; Cho, S.N.; Via, L.E.; Barry, C.E. Neutrophils Are the Predominant Infected Phagocytic Cells in the Airways of Patients with Active Pulmonary TB. Chest 2010, 137, 122–128. [Google Scholar] [CrossRef] [PubMed] [Green Version]
- Eruslanov, E.B.; Lyadova, I.V.; Kondratieva, T.K.; Majorov, K.B.; Scheglov, I.V.; Orlova, M.O.; Apt, A.S. Neutrophil Responses to Mycobacterium Tuberculosis Infection in Genetically Susceptible and Resistant Mice. Infect. Immun. 2005, 73, 1744–1753. [Google Scholar] [CrossRef] [PubMed] [Green Version]
- Ulrichs, T.; Kosmiadi, G.A.; Trusov, V.; Jörg, S.; Pradl, L.; Titukhina, M.; Mishenko, V.; Gushina, N.; Kaufmann, S.H.E. Human Tuberculous Granulomas Induce Peripheral Lymphoid Follicle-like Structures to Orchestrate Local Host Defence in the Lung. J. Pathol. 2004, 204, 217–228. [Google Scholar] [CrossRef] [PubMed]
- Lowe, D.M.; Bangani, N.; Mehta, M.R.; Lang, D.M.; Rossi, A.G.; Wilkinson, K.A.; Wilkinson, R.J.; Martineau, A.R. A Novel Assay of Antimycobacterial Activity and Phagocytosis by Human Neutrophils. Tuberculosis 2013, 93, 167–178. [Google Scholar] [CrossRef] [PubMed] [Green Version]
- Liu, C.H.; Liu, H.; Ge, B. Innate Immunity in Tuberculosis: Host Defense vs Pathogen Evasion. Cell. Mol. Immunol. 2017, 14, 963–975. [Google Scholar] [CrossRef] [PubMed]
- Pedrosa, J.; Saunders, B.M.; Appelberg, R.; Orme, I.M.; Silva, M.T.; Cooper, A.M. Neutrophils Play a Protective Nonphagocytic Role in Systemic Mycobacterium Tuberculosis Infection of Mice. Infect. Immun. 2000, 68, 577–583. [Google Scholar] [CrossRef] [Green Version]
- Sugawara, I.; Udagawa, T.; Yamada, H. Rat Neutrophils Prevent the Development of Tuberculosis. Infect. Immun. 2004, 72, 1804–1806. [Google Scholar] [CrossRef] [Green Version]
- Dorhoi, A.; Desel, C.; Yeremeev, V.; Pradl, L.; Brinkmann, V.; Mollenkopf, H.J.; Hanke, K.; Gross, O.; Ruland, J.; Kaufmann, S.H.E. The Adaptor Molecule CARD9 Is Essential for Tuberculosis Control. J. Exp. Med. 2010, 207, 777–792. [Google Scholar] [CrossRef]
- Nandi, B.; Behar, S.M. Regulation of Neutrophils by Interferon-γ Limits Lung Inflammation during Tuberculosis Infection. J. Exp. Med. 2011, 208, 2251–2262. [Google Scholar] [CrossRef]
- Blomgran, R.; Desvignes, L.; Briken, V.; Ernst, J.D. Mycobacterium Tuberculosis Inhibits Neutrophil Apoptosis, Leading to Delayed Activation of Naive CD4 T Cells. Cell Host Microbe 2012, 11, 81–90. [Google Scholar] [CrossRef] [Green Version]
- Yeremeev, V.; Linge, I.; Kondratieva, T.; Apt, A. Neutrophils Exacerbate Tuberculosis Infection in Genetically Susceptible Mice. Tuberculosis 2015, 95, 447–451. [Google Scholar] [CrossRef] [PubMed]
- Almeida, F.M.; Ventura, T.L.B.; Amaral, E.P.; Ribeiro, S.C.M.; Calixto, S.D.; Manhães, M.R.; Rezende, A.L.; Souzal, G.S.; De Carvalho, I.S.; Silva, E.C.; et al. Hypervirulent Mycobacterium Tuberculosis Strain Triggers Necrotic Lung Pathology Associated with Enhanced Recruitment of Neutrophils in Resistant C57BL/6 Mice. PLoS ONE 2017, 12, e0173715. [Google Scholar] [CrossRef]
- Weiss, S.J. Tissue Destruction by Neutrophils. N. Engl. J. Med. 1989, 320, 365–376. [Google Scholar] [CrossRef] [PubMed]
- Lee, W.L.; Downey, G.P. Neutrophil Activation and Acute Lung Injury. Curr. Opin. Crit. Care 2001, 7, 1–7. [Google Scholar] [CrossRef] [PubMed]
- Kondratieva, E.; Logunova, N.; Majorov, K.; Averbakh, M.; Apt, A. Host Genetics in Granuloma Formation: Human-like Lung Pathology in Mice with Reciprocal Genetic Susceptibility to M. tuberculosis and M. avium. PLoS ONE 2010, 5, e10515. [Google Scholar] [CrossRef] [PubMed] [Green Version]
- Denis, M.; Andersen, B.R. Human Neutrophils, Activated with Cytokines or Not, Do Not Kill Virulent Mycobacterium Tuberculosis. J. Infect. Dis. 1991, 163, 919–920. [Google Scholar] [CrossRef] [PubMed]
- Corleis, B.; Korbel, D.; Wilson, R.; Bylund, J.; Chee, R.; Schaible, U.E. Escape of Mycobacterium Tuberculosis from Oxidative Killing by Neutrophils. Cell. Microbiol. 2012, 14, 1109–1121. [Google Scholar] [CrossRef]
- Blomgran, R.; Ernst, J.D. Lung Neutrophils Facilitate Activation of Naive Antigen-Specific CD4+ T Cells during Mycobacterium Tuberculosis Infection. J. Immunol. 2011, 186, 7110–7119. [Google Scholar] [CrossRef] [Green Version]
- Andersen, P.; Kaufmann, S.H.E. Novel Vaccination Strategies against Tuberculosis. Cold Spring Harb. Perspect. Med. 2014, 4, a018523. [Google Scholar] [CrossRef] [Green Version]
- Dallenga, T.; Repnik, U.; Corleis, B.; Eich, J.; Reimer, R.; Griffiths, G.W.; Schaible, U.E.M. Tuberculosis-Induced Necrosis of Infected Neutrophils Promotes Bacterial Growth Following Phagocytosis by Macrophages. Cell Host Microbe 2017, 22, 519–530.e3. [Google Scholar] [CrossRef] [Green Version]
- Karaji, N.; Sattentau, Q.J. Efferocytosis of Pathogen-Infected Cells. Front. Immunol. 2017, 8, 1863. [Google Scholar] [CrossRef] [PubMed] [Green Version]
- Ragno, S.; Romano, M.; Howell, S.; Pappin, D.J.C.; Jenner, P.J.; Colston, M.J. Changes in Gene Expression in Macrophages Infected with Mycobacterium Tuberculosis: A Combined Transcriptomic and Proteomic Approach. Immunology 2001, 104, 99–108. [Google Scholar] [CrossRef] [PubMed] [Green Version]
- Volpe, E.; Cappelli, G.; Grassi, M.; Martino, A.; Serafino, A.; Colizzi, V.; Sanarico, N.; Mariani, F. Gene Expression Profiling of Human Macrophages at Late Time of Infection with Mycobacterium Tuberculosis. Immunology 2006, 118, 449. [Google Scholar] [CrossRef] [PubMed]
- Tailleux, L.; Waddel, S.J.; Pelizzola, M.; Mortellaro, A.; Withers, M.; Tanne, A.; Castagnoli, P.R.; Gicquel, B.; Stoker, N.G.; Butcher, P.D.; et al. Probing Host Pathogen Cross-Talk by Transcriptional Profiling of Both Mycobacterium Tuberculosis and Infected Human Dendritic Cells and Macrophages. PLoS ONE 2008, 3, e1403. [Google Scholar] [CrossRef] [PubMed]
- Pisu, D.; Huang, L.; Grenier, J.K.; Russell, D.G. Dual RNA-Seq of Mtb-Infected Macrophages In Vivo Reveals Ontologically Distinct Host-Pathogen Interactions. Cell Rep. 2020, 30, 335–350.e4. [Google Scholar] [CrossRef]
- Davis, J.M.; Ramakrishnan, L. The Role of the Granuloma in Expansion and Dissemination of Early Tuberculous Infection. Cell 2009, 136, 37–49. [Google Scholar] [CrossRef] [Green Version]
- Masiewicz, P.; Brzostek, A.; Wolański, M.; Dziadek, J.; Zakrzewska-Czerwińska, J. A Novel Role of the PrpR as a Transcription Factor Involved in the Regulation of Methylcitrate Pathway in Mycobacterium Tuberculosis. PLoS ONE 2012, 7, e43651. [Google Scholar] [CrossRef] [Green Version]
- Kendall, S.L.; Withers, M.; Soffair, C.N.; Moreland, N.J.; Gurcha, S.; Sidders, B.; Frita, R.; Ten Bokum, A.; Besra, G.S.; Lott, J.S.; et al. A Highly Conserved Transcriptional Repressor Controls a Large Regulon Involved in Lipid Degradation in Mycobacterium Smegmatis and Mycobacterium Tuberculosis. Mol. Microbiol. 2007, 65, 684. [Google Scholar] [CrossRef] [Green Version]
- Kendall, S.L.; Burgess, P.; Balhana, R.; Withers, M.; Ten Bokum, A.; Lott, J.S.; Gao, C.; Uhia-Castro, I.; Stoker, N.G. Cholesterol Utilization in Mycobacteria Is Controlled by Two TetR-Type Transcriptional Regulators: KstR and KstR2. Microbiology 2010, 156, 1362. [Google Scholar] [CrossRef] [PubMed] [Green Version]
- Fontán, P.A.; Aris, V.; Alvarez, M.E.; Ghanny, S.; Cheng, J.; Soteropoulos, P.; Trevani, A.; Pine, R.; Smith, I. Mycobacterium Tuberculosis Sigma Factor E Regulon Modulates the Host Inflammatory Response. J. Infect. Dis. 2008, 198, 877–885. [Google Scholar] [CrossRef] [Green Version]
- Li, Q.; Fu, T.; Li, C.; Fan, X.; Xie, J. Mycobacterial IclR Family Transcriptional Factor Rv2989 Is Specifically Involved in Isoniazid Tolerance by Regulating the Expression of Catalase Encoding Gene KatG. RSC Adv. 2016, 6, 54661–54667. [Google Scholar] [CrossRef]
- Chauhan, S.; Kumar, A.; Singhal, A.; Tyagi, J.S.; Prasad, H.K. CmtR, a Cadmium-Sensing ArsR–SmtB Repressor, Cooperatively Interacts with Multiple Operator Sites to Autorepress Its Transcription in Mycobacterium Tuberculosis. FEBS J. 2009, 276, 3428–3439. [Google Scholar] [CrossRef] [PubMed]
- Campbell, D.R.; Chapman, K.E.; Waldron, K.J.; Tottey, S.; Kendall, S.; Cavallaro, G.; Andreini, C.; Hinds, J.; Stoker, N.G.; Robinson, N.J.; et al. Mycobacterial Cells Have Dual Nickel-Cobalt Sensors: Sequence Relationships and Metal Sites of Metal-Responsive Repressors Are Not Congruent. J. Biol. Chem. 2007, 282, 32298–32310. [Google Scholar] [CrossRef] [PubMed] [Green Version]
- Ramón-García, S.; Ng, C.; Jensen, P.R.; Dosanjh, M.; Burian, J.; Morris, R.P.; Folcher, M.; Eltis, L.D.; Grzesiek, S.; Nguyen, L.; et al. WhiB7, an Fe-S-Dependent Transcription Factor That Activates Species-Specific Repertoires of Drug Resistance Determinants in Actinobacteria. J. Biol. Chem. 2013, 288, 34514–34528. [Google Scholar] [CrossRef] [PubMed] [Green Version]
- Chen, Z.; Hu, Y.; Cumming, B.M.; Lu, P.; Feng, L.; Deng, J.; Steyn, A.J.C.; Chen, S. Mycobacterial WhiB6 Differentially Regulates ESX-1 and the Dos Regulon to Modulate Granuloma Formation and Virulence in Zebrafish. Cell Rep. 2016, 16, 2512–2524. [Google Scholar] [CrossRef] [Green Version]
- Fishbein, S.; van Wyk, N.; Warren, R.M.; Sampson, S.L. Phylogeny to Function: PE/PPE Protein Evolution and Impact on Mycobacterium Tuberculosis Pathogenicity. Mol. Microbiol. 2015, 96, 901–916. [Google Scholar] [CrossRef]
- Champion, M.M.; Williams, E.A.; Pinapati, R.S.; Champion, P.A.D. Correlation of Phenotypic Profiles Using Targeted Proteomics Identifies Mycobacterial Esx-1 Substrates. J. Proteome Res. 2014, 13, 5151–5164. [Google Scholar] [CrossRef] [Green Version]
- Kennedy, G.M.; Hooley, G.C.; Champion, M.M.; Medie, F.M.; DiGiuseppe Champion, P.A. A Novel ESX-1 Locus Reveals That Surface-Associated ESX-1 Substrates Mediate Virulence in Mycobacterium Marinum. J. Bacteriol. 2014, 196, 1877. [Google Scholar] [CrossRef] [Green Version]
- Houben, D.; Demangel, C.; van Ingen, J.; Perez, J.; Baldeón, L.; Abdallah, A.M.; Caleechurn, L.; Bottai, D.; van Zon, M.; de Punder, K.; et al. ESX-1-Mediated Translocation to the Cytosol Controls Virulence of Mycobacteria. Cell. Microbiol. 2012, 14, 1287–1298. [Google Scholar] [CrossRef]
- Zhang, F.; Xie, J.P. Mammalian Cell Entry Gene Family of Mycobacterium Tuberculosis. Mol. Cell. Biochem. 2011, 352, 1–10. [Google Scholar] [CrossRef]
- Klepp, L.I.; Sabio y Garcia, J.; Bigi, F. Mycobacterial MCE Proteins as Transporters That Control Lipid Homeostasis of the Cell Wall. Tuberculosis 2022, 132, 102162. [Google Scholar] [CrossRef]
- Mohn, W.W.; Van Der Geize, R.; Stewart, G.R.; Okamoto, S.; Liu, J.; Dijkhuizen, L.; Eltis, L.D. The Actinobacterial Mce4 Locus Encodes a Steroid Transporter. J. Biol. Chem. 2008, 283, 35368–35374. [Google Scholar] [CrossRef] [Green Version]
- Marjanovic, O.; Iavarone, A.T.; Riley, L.W. Sulfolipid Accumulation in Mycobacterium Tuberculosis Disrupted in the Mce2 Operon. J. Microbiol. 2011, 49, 441–447. [Google Scholar] [CrossRef] [PubMed]
- Arbues, A.; Lugo-Villarino, G.; Neyrolles, O.; Guilhot, C.; Astarie-Dequeker, C. Playing Hide-and-Seek with Host Macrophages through the Use of Mycobacterial Cell Envelope Phthiocerol Dimycocerosates and Phenolic Glycolipids. Front. Cell. Infect. Microbiol. 2014, 4, 173. [Google Scholar] [CrossRef] [Green Version]
- Passemar, C.; Arbués, A.; Malaga, W.; Mercier, I.; Moreau, F.; Lepourry, L.; Neyrolles, O.; Guilhot, C.; Astarie-Dequeker, C. Multiple Deletions in the Polyketide Synthase Gene Repertoire of Mycobacterium Tuberculosis Reveal Functional Overlap of Cell Envelope Lipids in Host-Pathogen Interactions. Cell. Microbiol. 2014, 16, 195–213. [Google Scholar] [CrossRef]
- Quigley, J.; Hughitt, V.K.; Velikovsky, C.A.; Mariuzza, R.A.; El-Sayed, N.M.; Briken, V. The Cell Wall Lipid PDIM Contributes to Phagosomal Escape and Host Cell Exit of Mycobacterium Tuberculosis. mBio 2017, 8, e00148-17. [Google Scholar] [CrossRef] [Green Version]
- Tak, U.; Dokland, T.; Niederweis, M. Pore-Forming Esx Proteins Mediate Toxin Secretion by Mycobacterium Tuberculosis. Nat. Commun. 2021, 12, 394. [Google Scholar] [CrossRef]
- Leistikow, R.L.; Morton, R.A.; Bartek, I.L.; Frimpong, I.; Wagner, K.; Voskuil, M.I. The Mycobacterium Tuberculosis DosR Regulon Assists in Metabolic Homeostasis and Enables Rapid Recovery from Nonrespiring Dormancy. J. Bacteriol. 2010, 192, 1662–1670. [Google Scholar] [CrossRef] [Green Version]
- Peddireddy, V.; Doddam, S.N.; Qureshi, I.A.; Yerra, P.; Ahmed, N. A Putative Nitroreductase from the DosR Regulon of Mycobacterium Tuberculosis Induces Pro-Inflammatory Cytokine Expression via TLR2 Signaling Pathway. Sci. Rep. 2016, 6, 24535. [Google Scholar] [CrossRef] [Green Version]
- Hickey, T.B.M.; Ziltener, H.J.; Speert, D.P.; Stokes, R.W. Mycobacterium Tuberculosis Employs Cpn60.2 as an Adhesin That Binds CD43 on the Macrophage Surface. Cell. Microbiol. 2010, 12, 1634–1647. [Google Scholar] [CrossRef]
- Joseph, S.; Yuen, A.; Singh, V.; Hmama, Z. Mycobacterium Tuberculosis Cpn60.2 (GroEL2) Blocks Macrophage Apoptosis via Interaction with Mitochondrial Mortalin. Biol. Open 2017, 6, 481–488. [Google Scholar] [CrossRef] [PubMed] [Green Version]
- Peetermans, W.E.; Raats, C.J.I.; Langermans, J.A.M.; van Furth, R. Mycobacterial Heat-Shock Protein 65 Induces Proinflammatory Cytokines but Does Not Activate Human Mononuclear Phagocytes. Scand. J. Immunol. 1994, 39, 613–617. [Google Scholar] [CrossRef]
- Tripathi, P.; Batra, J.K. Heat Shock Proteins in the Pathogenesis of Mycobacterium tuberculosis. In Mycobacterium tuberculosis: Molecular Infection Biology, Pathogenesis, Diagnostics and New Interventions; Hasnain, S., Ehtesham, N., Grover, S., Eds.; Springer: Singapore, 2019. [Google Scholar]
- Monier, B.; McDermaid, A.; Zhao, J.; Ma, Q. Vidger: Create Rapid Visualizations of RNAseq Data in R. 2021. Available online: https://bioconductor.org/packages/release/bioc/html/vidger.html (accessed on 12 December 2021).
- Babicki, S.; Arndt, D.; Marcu, A.; Liang, Y.; Grant, J.R.; Maciejewski, A.; Wishart, D.S. Heatmapper: Web-Enabled Heat Mapping for All. Nucleic Acids Res. 2016, 44, W147–W153. [Google Scholar] [CrossRef]
- Flynn, J.L.; Cooper, A.M.; Bishai, W. Animal Models of Tuberculosis. In Tuberculosis and the Tubercle Bacillus; Stuard, C., Ed.; ASM Press: Washington, DC, USA, 2005; pp. 547–560. [Google Scholar]
- Ly, L.H.; Russell, M.I.; McMurray, D.N. Cytokine Profiles in Primary and Secondary Pulmonary Granulomas of Guinea Pigs with Tuberculosis. Am. J. Respir. Cell Mol. Biol. 2008, 38, 455. [Google Scholar] [CrossRef]
- Cadena, A.M.; Fortune, S.M.; Flynn, J.L. Heterogeneity in Tuberculosis. Nat. Rev. Immunol. 2017, 17, 691–702. [Google Scholar] [CrossRef]
- Mischenko, V.V.; Kapina, M.A.; Eruslanov, E.B.; Kondratieva, E.V.; Lyadova, I.V.; Young, D.B.; Apt, A.S. Mycobacterial Dissemination and Cellular Responses after 1-Lobe Restricted Tuberculosis Infection of Genetically Susceptible and Resistant Mice. J. Infect. Dis. 2004, 190, 2137–2145. [Google Scholar] [CrossRef] [Green Version]
- Hult, C.; Mattila, J.T.; Gideon, H.P.; Linderman, J.J.; Kirschner, D.E. Neutrophil Dynamics Affect Mycobacterium Tuberculosis Granuloma Outcomes and Dissemination. Front. Immunol. 2021, 12, 3602. [Google Scholar] [CrossRef]
- Saini, D.; Hopkins, G.W.; Seay, S.A.; Chen, C.J.; Perley, C.C.; Click, E.M.; Frothingham, R. Ultra-Low Dose of Mycobacterium Tuberculosis Aerosol Creates Partial Infection in Mice. Tuberculosis 2012, 92, 160–165. [Google Scholar] [CrossRef] [Green Version]
- Plumlee, C.R.; Duffy, F.J.; Gern, B.H.; Delahaye, J.L.; Cohen, S.B.; Stoltzfus, C.R.; Rustad, T.R.; Hansen, S.G.; Axthelm, M.K.; Picker, L.J.; et al. Ultra-Low Dose Aerosol Infection of Mice with Mycobacterium Tuberculosis More Closely Models Human Tuberculosis. Cell Host Microbe 2021, 29, 68–82.e5. [Google Scholar] [CrossRef]
- Rustad, T.R.; Roberts, D.M.; Liao, R.P.; Sherman, D.R. Isolation of Mycobacterial RNA. Methods Mol. Biol. 2009, 465, 13–22. [Google Scholar] [CrossRef]
- Langmead, B.; Salzberg, S.L. Fast Gapped-Read Alignment with Bowtie 2. Nat. Methods 2012, 9, 357–359. [Google Scholar] [CrossRef] [PubMed] [Green Version]
- Love, M.I.; Huber, W.; Anders, S. Moderated Estimation of Fold Change and Dispersion for RNA-Seq Data with DESeq2. Genome Biol. 2014, 15, 550. [Google Scholar] [CrossRef] [PubMed] [Green Version]
- Lew, J.M.; Kapopoulou, A.; Jones, L.M.; Cole, S.T. TubercuList--10 Years After. Tuberculosis 2011, 91, 1–7. [Google Scholar] [CrossRef] [PubMed]
- Davis, J.J.; Wattam, A.R.; Aziz, R.K.; Brettin, T.; Butler, R.; Butler, R.M.; Chlenski, P.; Conrad, N.; Dickerman, A.; Dietrich, E.M.; et al. The PATRIC Bioinformatics Resource Center: Expanding Data and Analysis Capabilities. Nucleic Acids Res. 2020, 48, D606–D612. [Google Scholar] [CrossRef] [Green Version]
- Ruijter, J.M.; Ramakers, C.; Hoogaars, W.M.H.; Karlen, Y.; Bakker, O.; van den Hoff, M.J.B.; Moorman, A.F.M. Amplification Efficiency: Linking Baseline and Bias in the Analysis of Quantitative PCR Data. Nucleic Acids Res. 2009, 37, e45. [Google Scholar] [CrossRef] [Green Version]
- Majorov, K.; Grigorov, A.; Kondratieva, E.; Azhikina, T.; Apt, A. Extraction of Mycobacterium tuberculosis after in vivo Phagocytosis by Neutrophils for Further Genetic and Functional Analyses. CTRI Bullutin 2020, 11, 30–35. [Google Scholar] [CrossRef]
- Majorov, K.B.; Lyadova, I.V.; Kondratieva, T.K.; Eruslanov, E.B.; Rubakova, E.I.; Orlova, M.O.; Mischenko, V.V.; Apt, A.S. Different Innate Ability of I/St and A/Sn Mice to Combat Virulent Mycobacterium Tuberculosis: Phenotypes Expressed in Lung and Extrapulmonary Macrophages. Infect. Immun. 2003, 71, 697–707. [Google Scholar] [CrossRef] [PubMed] [Green Version]
- Radaeva, T.; Kondratieva, E.V.; Sosunov, V.V.; Majorov, K.B.; Apt, A.S. A Human-like TB in Genetically Susceptible Mice Followed by the True Dormancy in a Cornell-like Model. Tuberculosis 2008, 88, 576–585. [Google Scholar] [CrossRef]
- Linge, I.; Dyatlov, A.; Kondratieva, E.; Avdienko, V.; Apt, A.; Kondratieva, T. B-Lymphocytes Forming Follicle-like Structures in the Lung Tissue of Tuberculosis-Infected Mice: Dynamics, Phenotypes and Functional Activity. Tuberculosis 2017, 102, 16–23. [Google Scholar] [CrossRef]


Publisher’s Note: MDPI stays neutral with regard to jurisdictional claims in published maps and institutional affiliations. |
© 2022 by the authors. Licensee MDPI, Basel, Switzerland. This article is an open access article distributed under the terms and conditions of the Creative Commons Attribution (CC BY) license (https://creativecommons.org/licenses/by/4.0/).
Share and Cite
Kondratieva, E.; Majorov, K.; Grigorov, A.; Skvortsova, Y.; Kondratieva, T.; Rubakova, E.; Linge, I.; Azhikina, T.; Apt, A. An In Vivo Model of Separate M. tuberculosis Phagocytosis by Neutrophils and Macrophages: Gene Expression Profiles in the Parasite and Disease Development in the Mouse Host. Int. J. Mol. Sci. 2022, 23, 2961. https://0-doi-org.brum.beds.ac.uk/10.3390/ijms23062961
Kondratieva E, Majorov K, Grigorov A, Skvortsova Y, Kondratieva T, Rubakova E, Linge I, Azhikina T, Apt A. An In Vivo Model of Separate M. tuberculosis Phagocytosis by Neutrophils and Macrophages: Gene Expression Profiles in the Parasite and Disease Development in the Mouse Host. International Journal of Molecular Sciences. 2022; 23(6):2961. https://0-doi-org.brum.beds.ac.uk/10.3390/ijms23062961
Chicago/Turabian StyleKondratieva, Elena, Konstantin Majorov, Artem Grigorov, Yulia Skvortsova, Tatiana Kondratieva, Elvira Rubakova, Irina Linge, Tatyana Azhikina, and Alexander Apt. 2022. "An In Vivo Model of Separate M. tuberculosis Phagocytosis by Neutrophils and Macrophages: Gene Expression Profiles in the Parasite and Disease Development in the Mouse Host" International Journal of Molecular Sciences 23, no. 6: 2961. https://0-doi-org.brum.beds.ac.uk/10.3390/ijms23062961