
STN7 Kinase Is Essential for Arabidopsis thaliana Fitness under Prolonged Darkness but Not under Dark-Chilling Conditions

 , , ,
, , ,  and
and 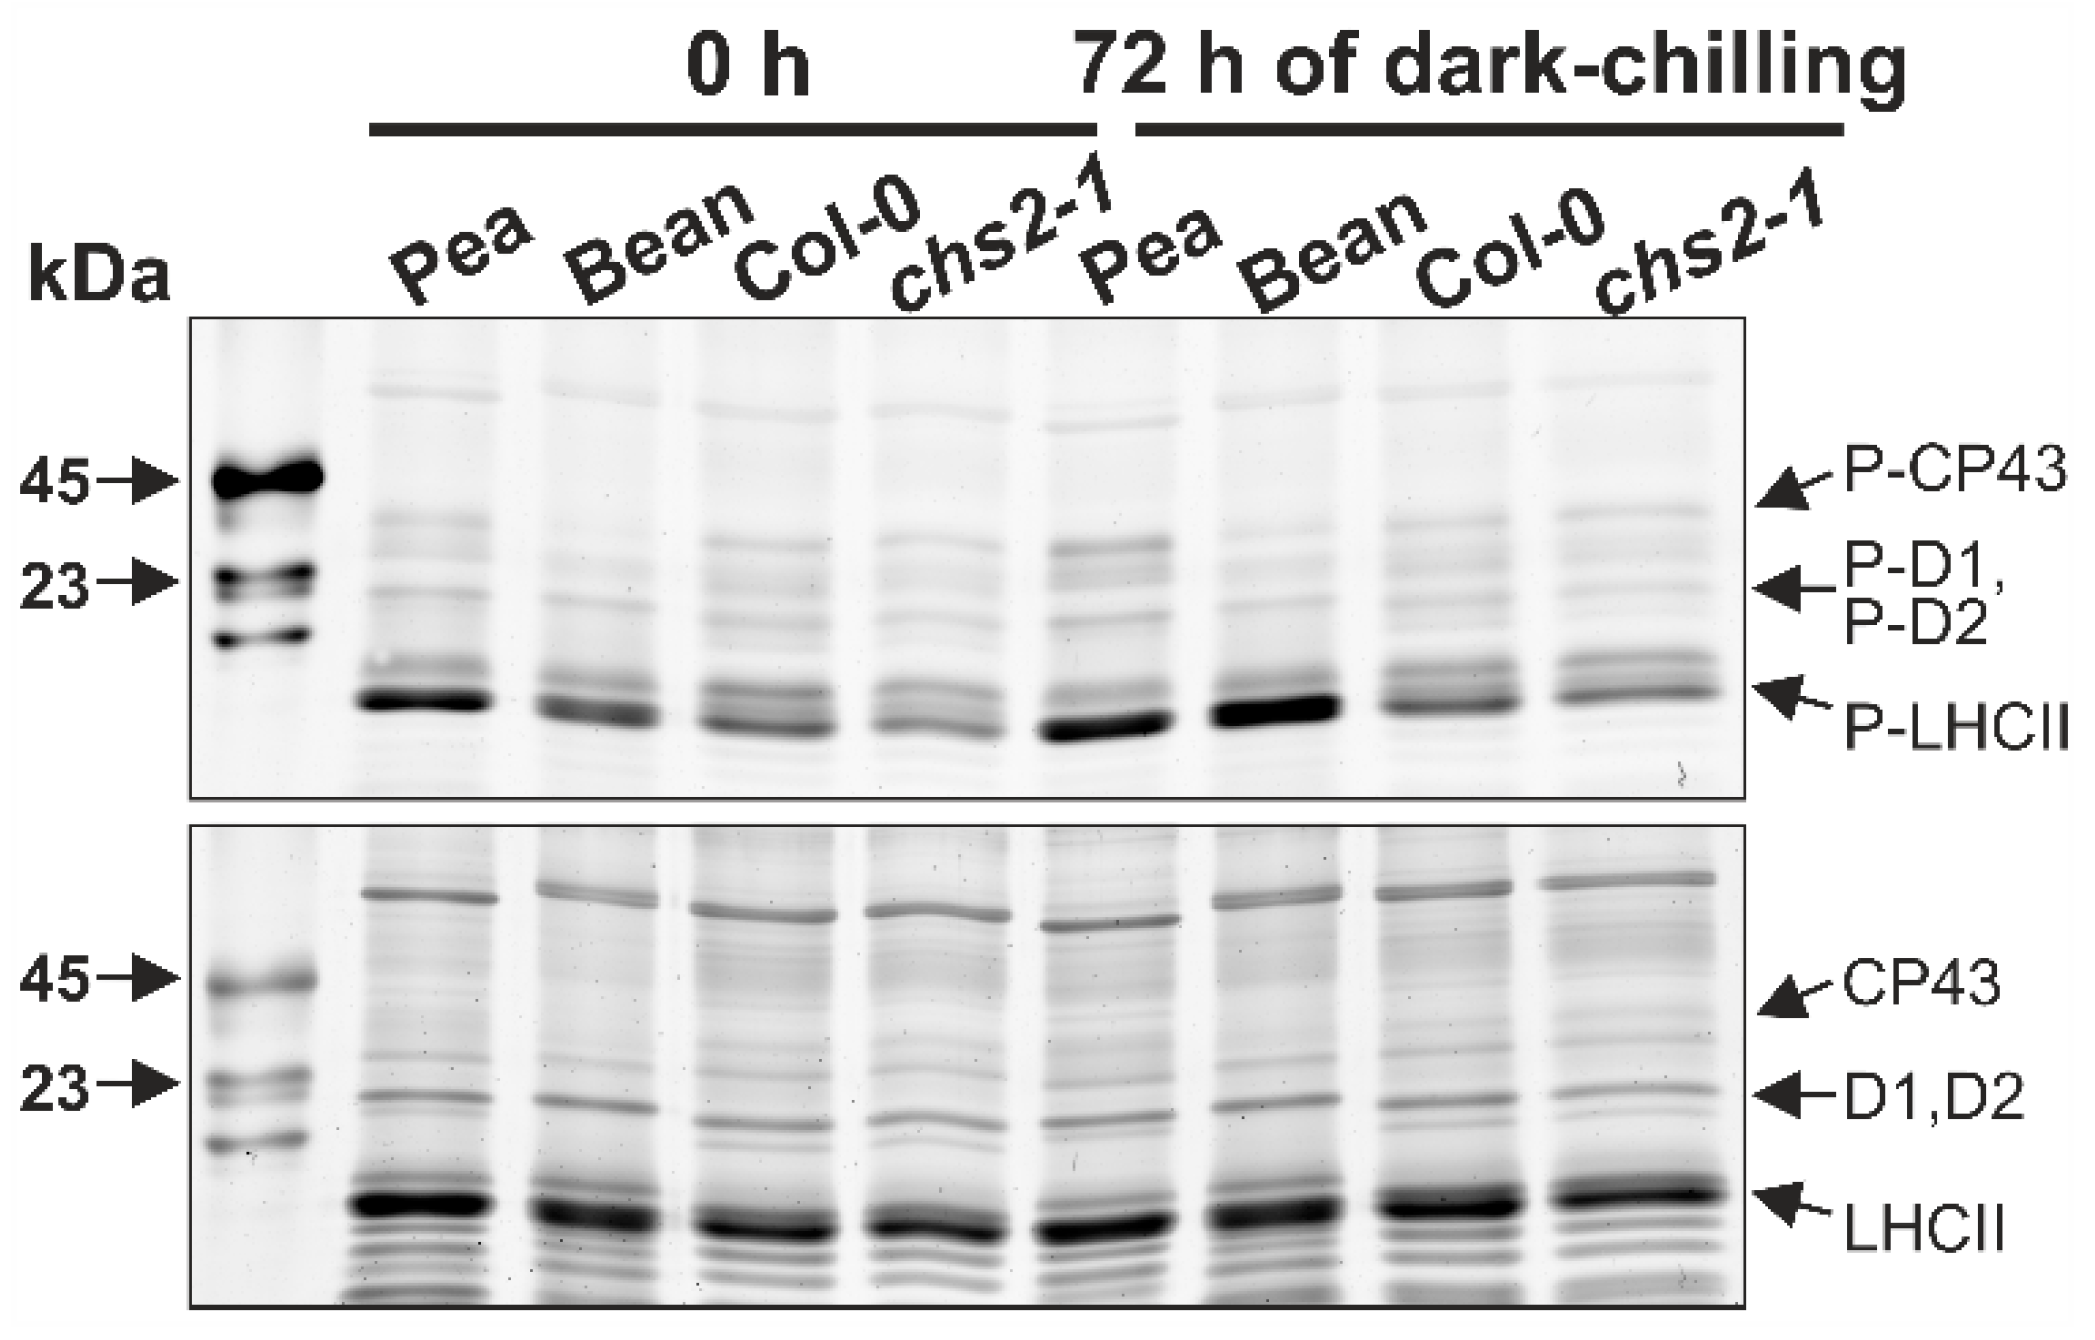
Abstract
:1. Introduction
2. Results
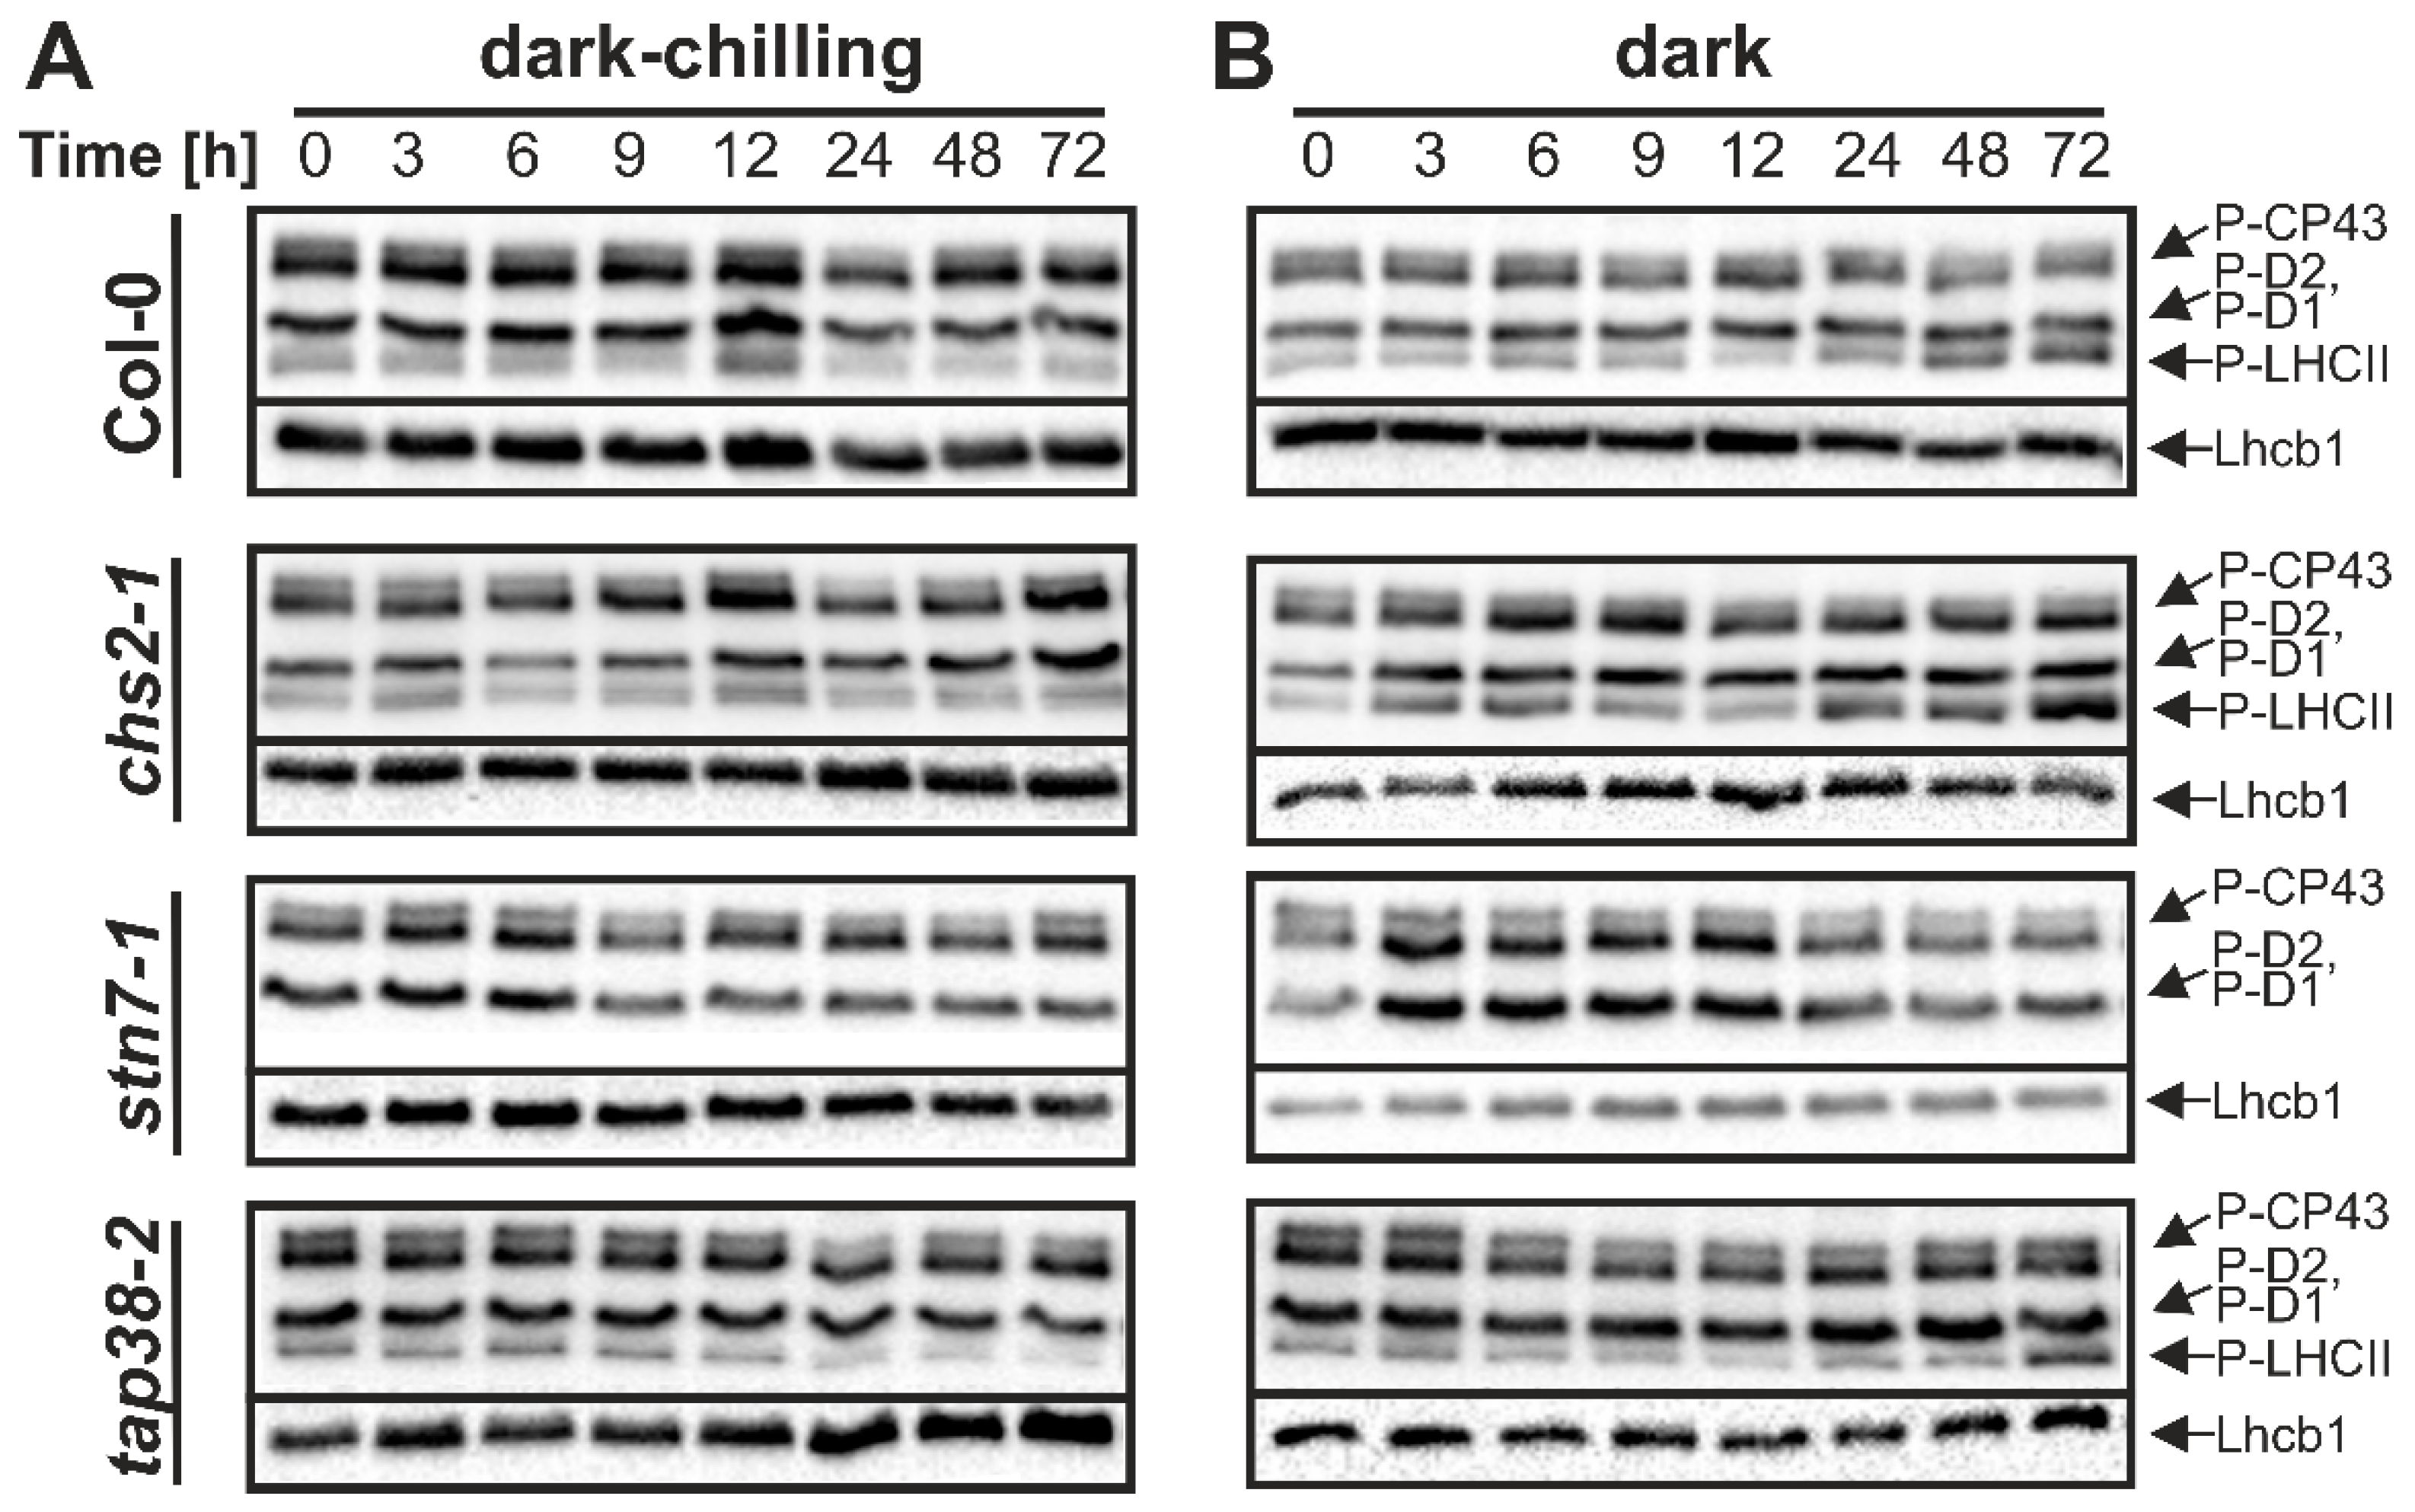
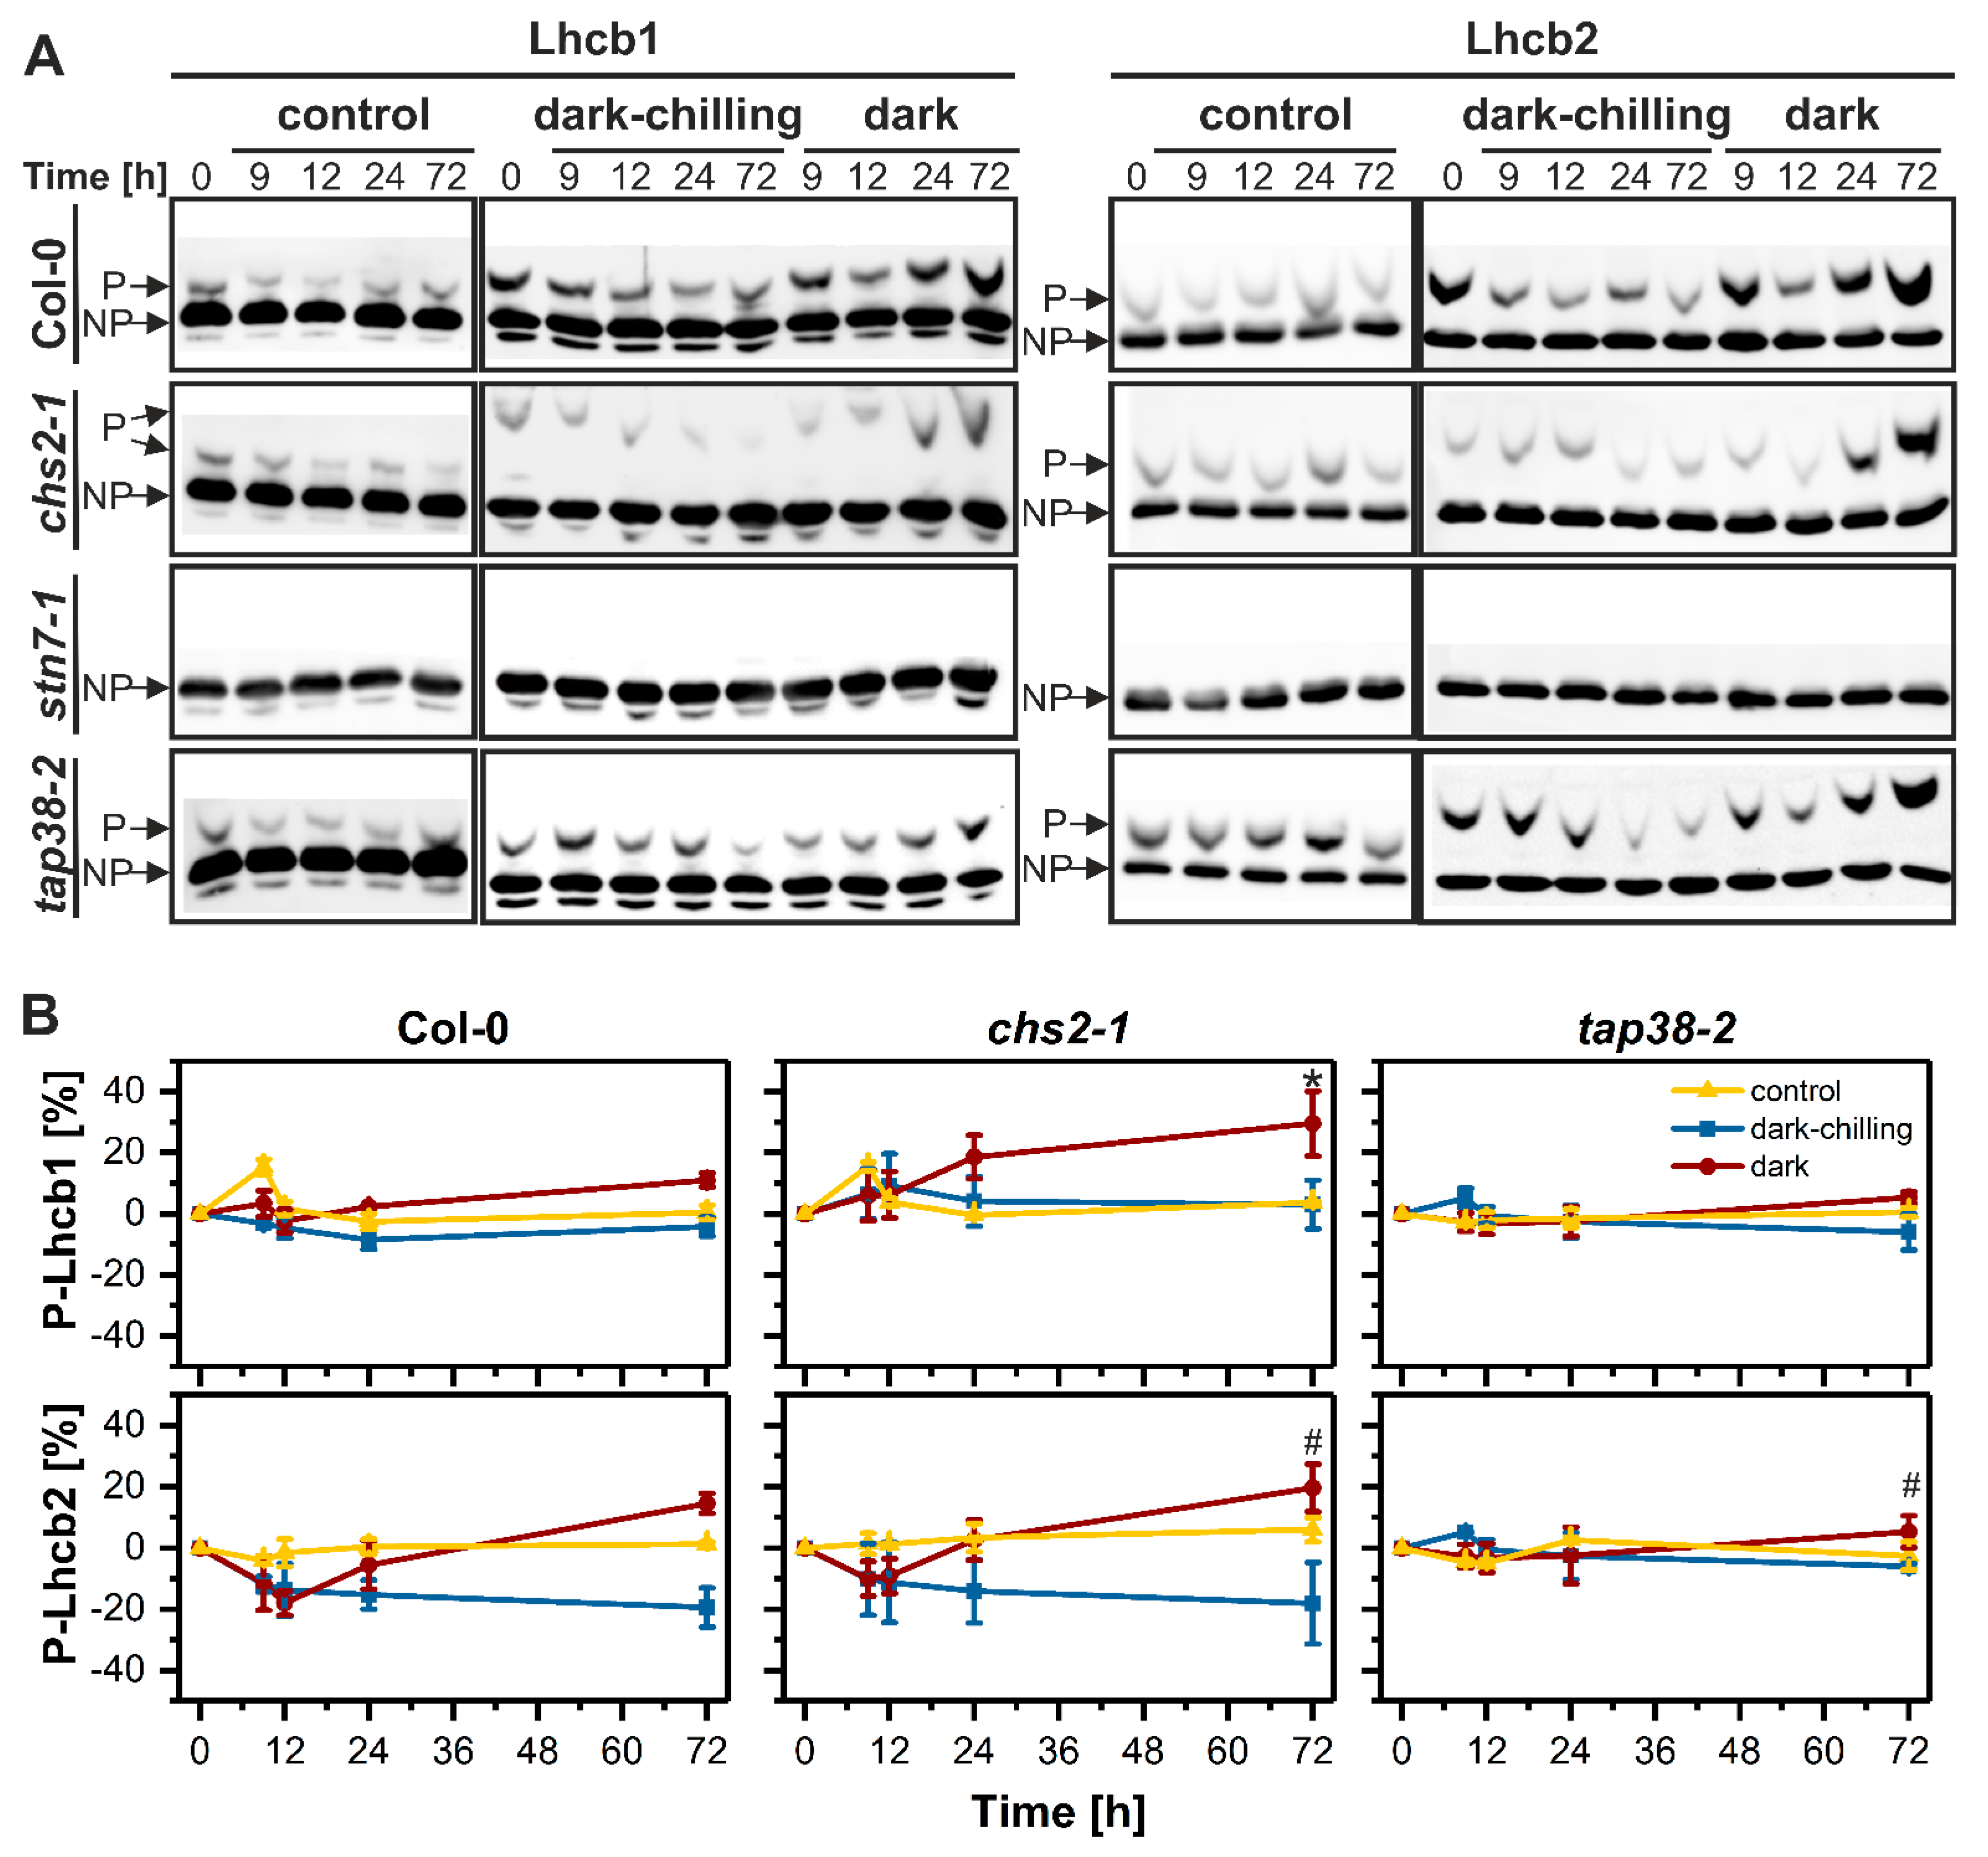
2.1. Phosphorylation Pattern of Thylakoid Proteins under Dark-Chilling and Dark Conditions
2.2. Organization of the Chlorophyll–Protein (CP) Complexes under Dark-Chilling and Dark Conditions
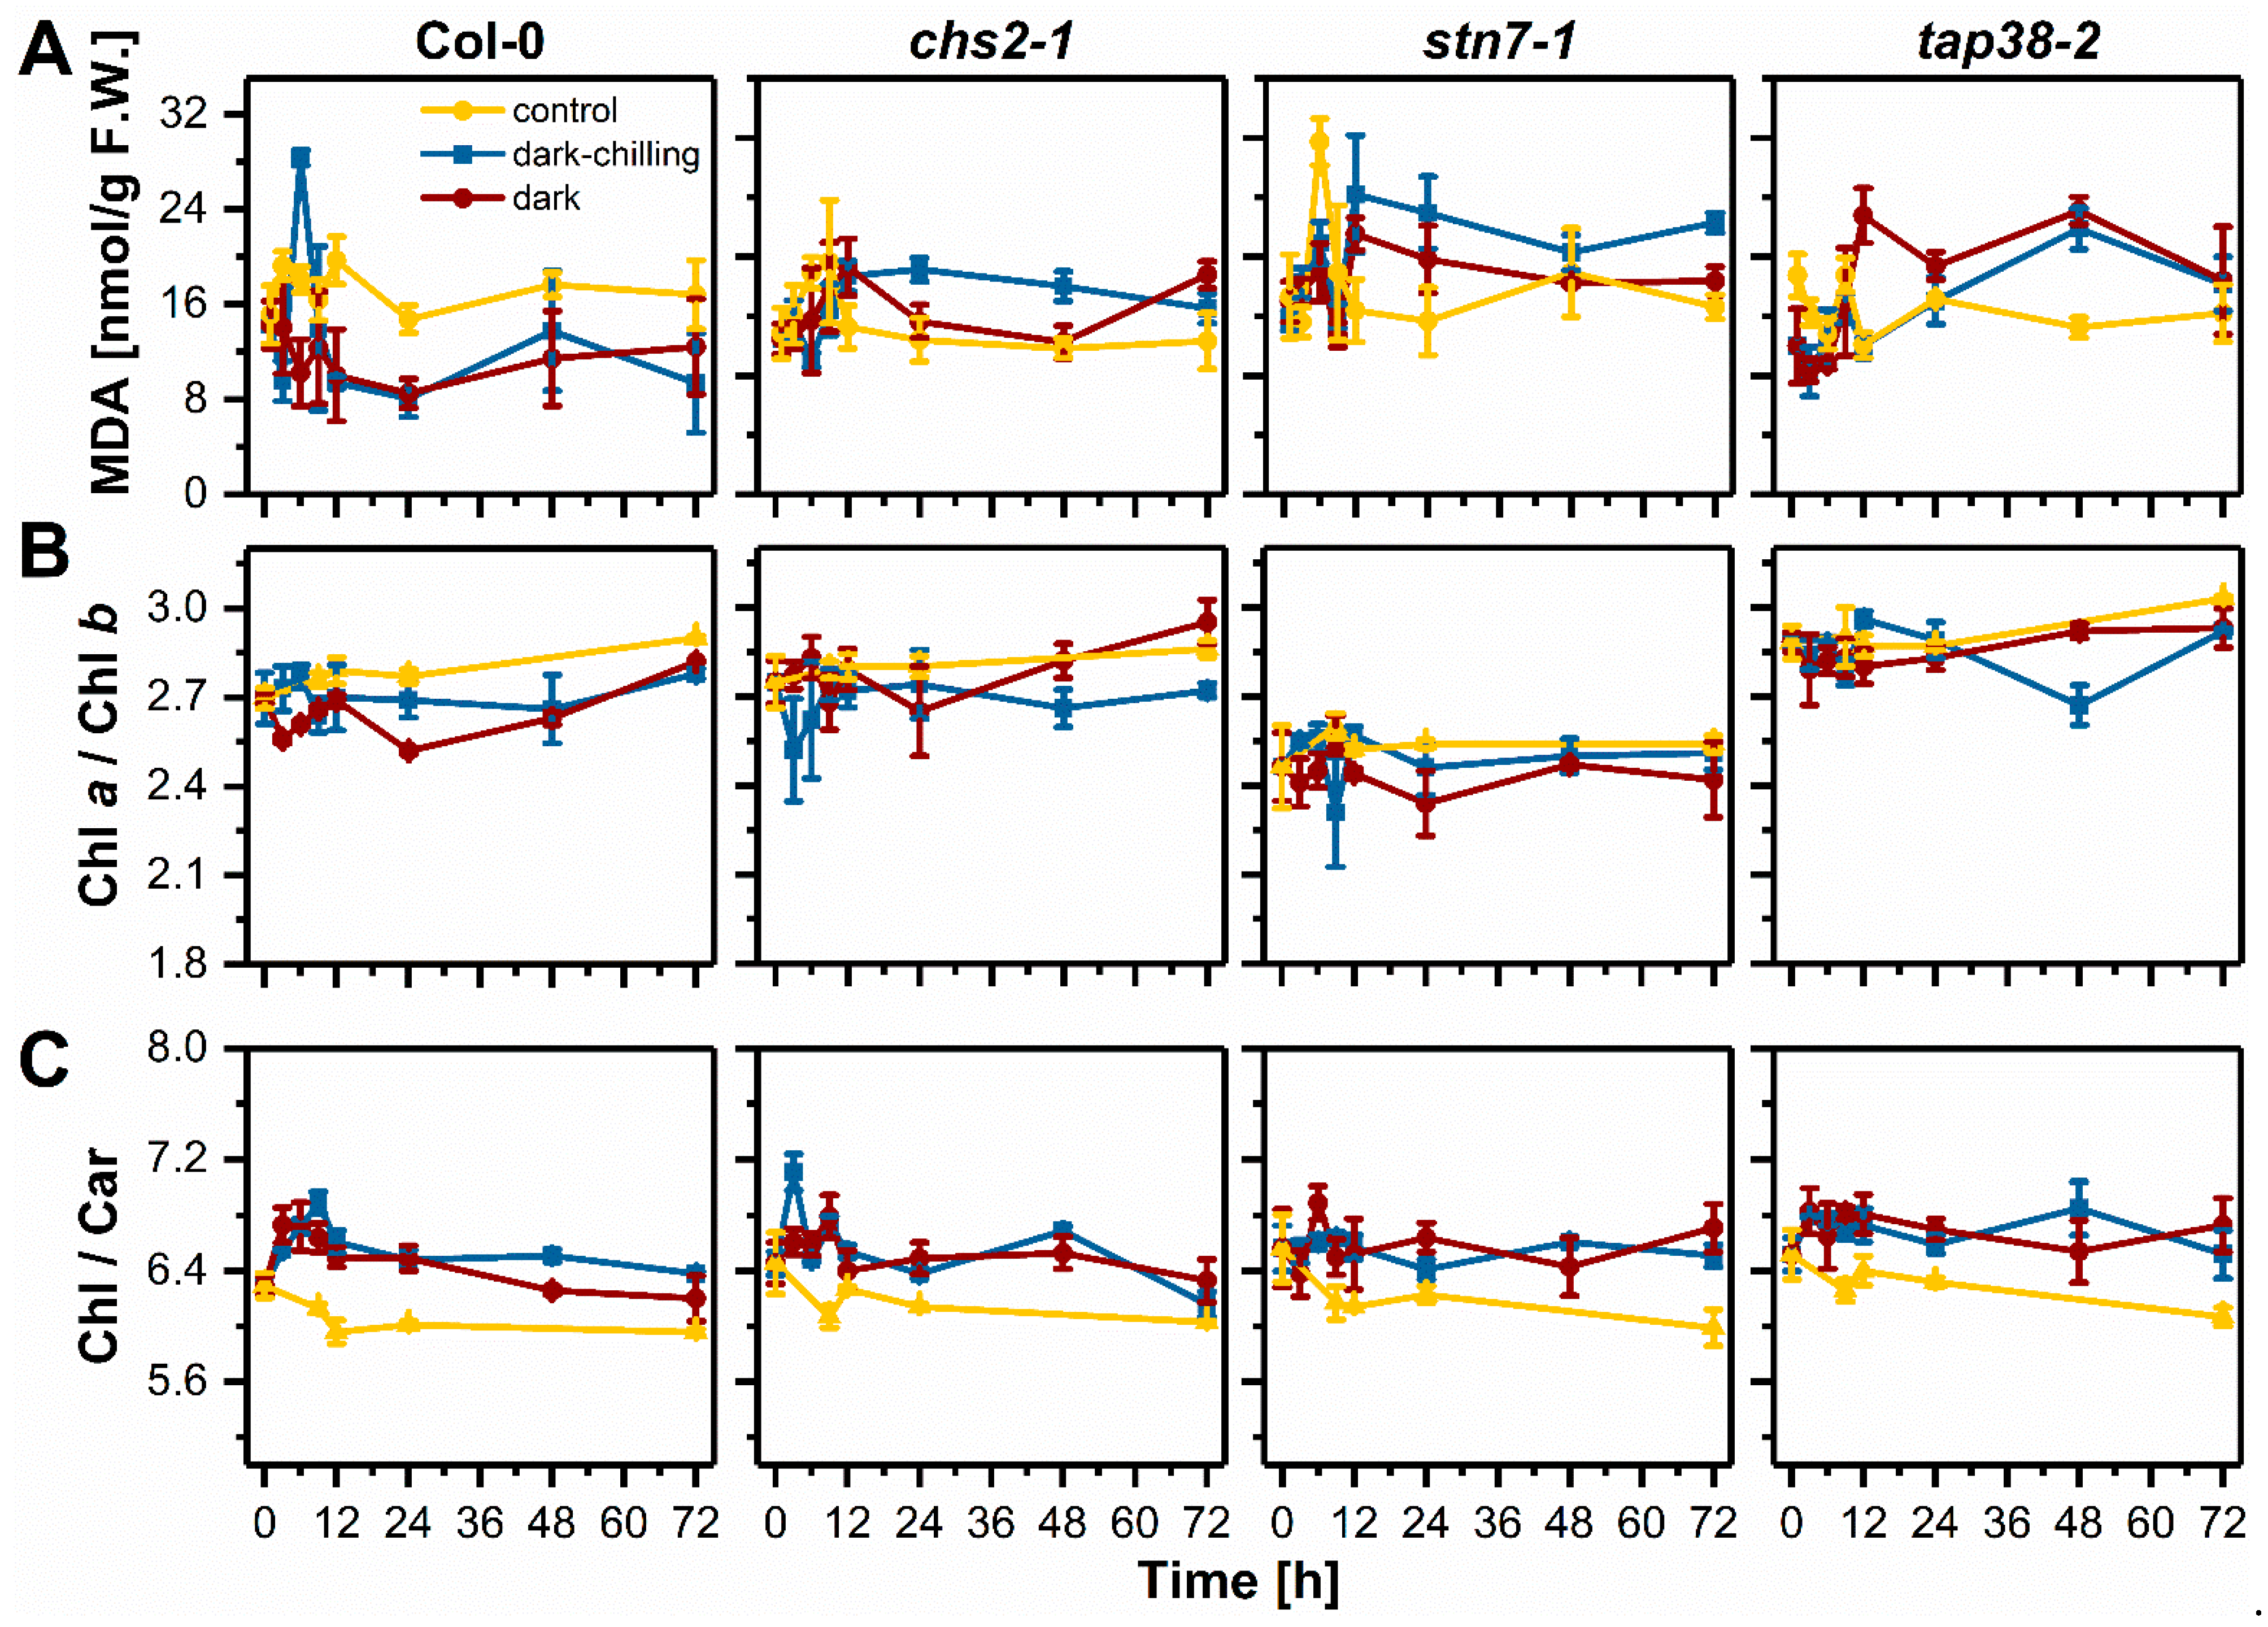
2.3. Lipid Peroxidation and Photosynthetic Pigments Content under Dark-Chilling and Dark Conditions
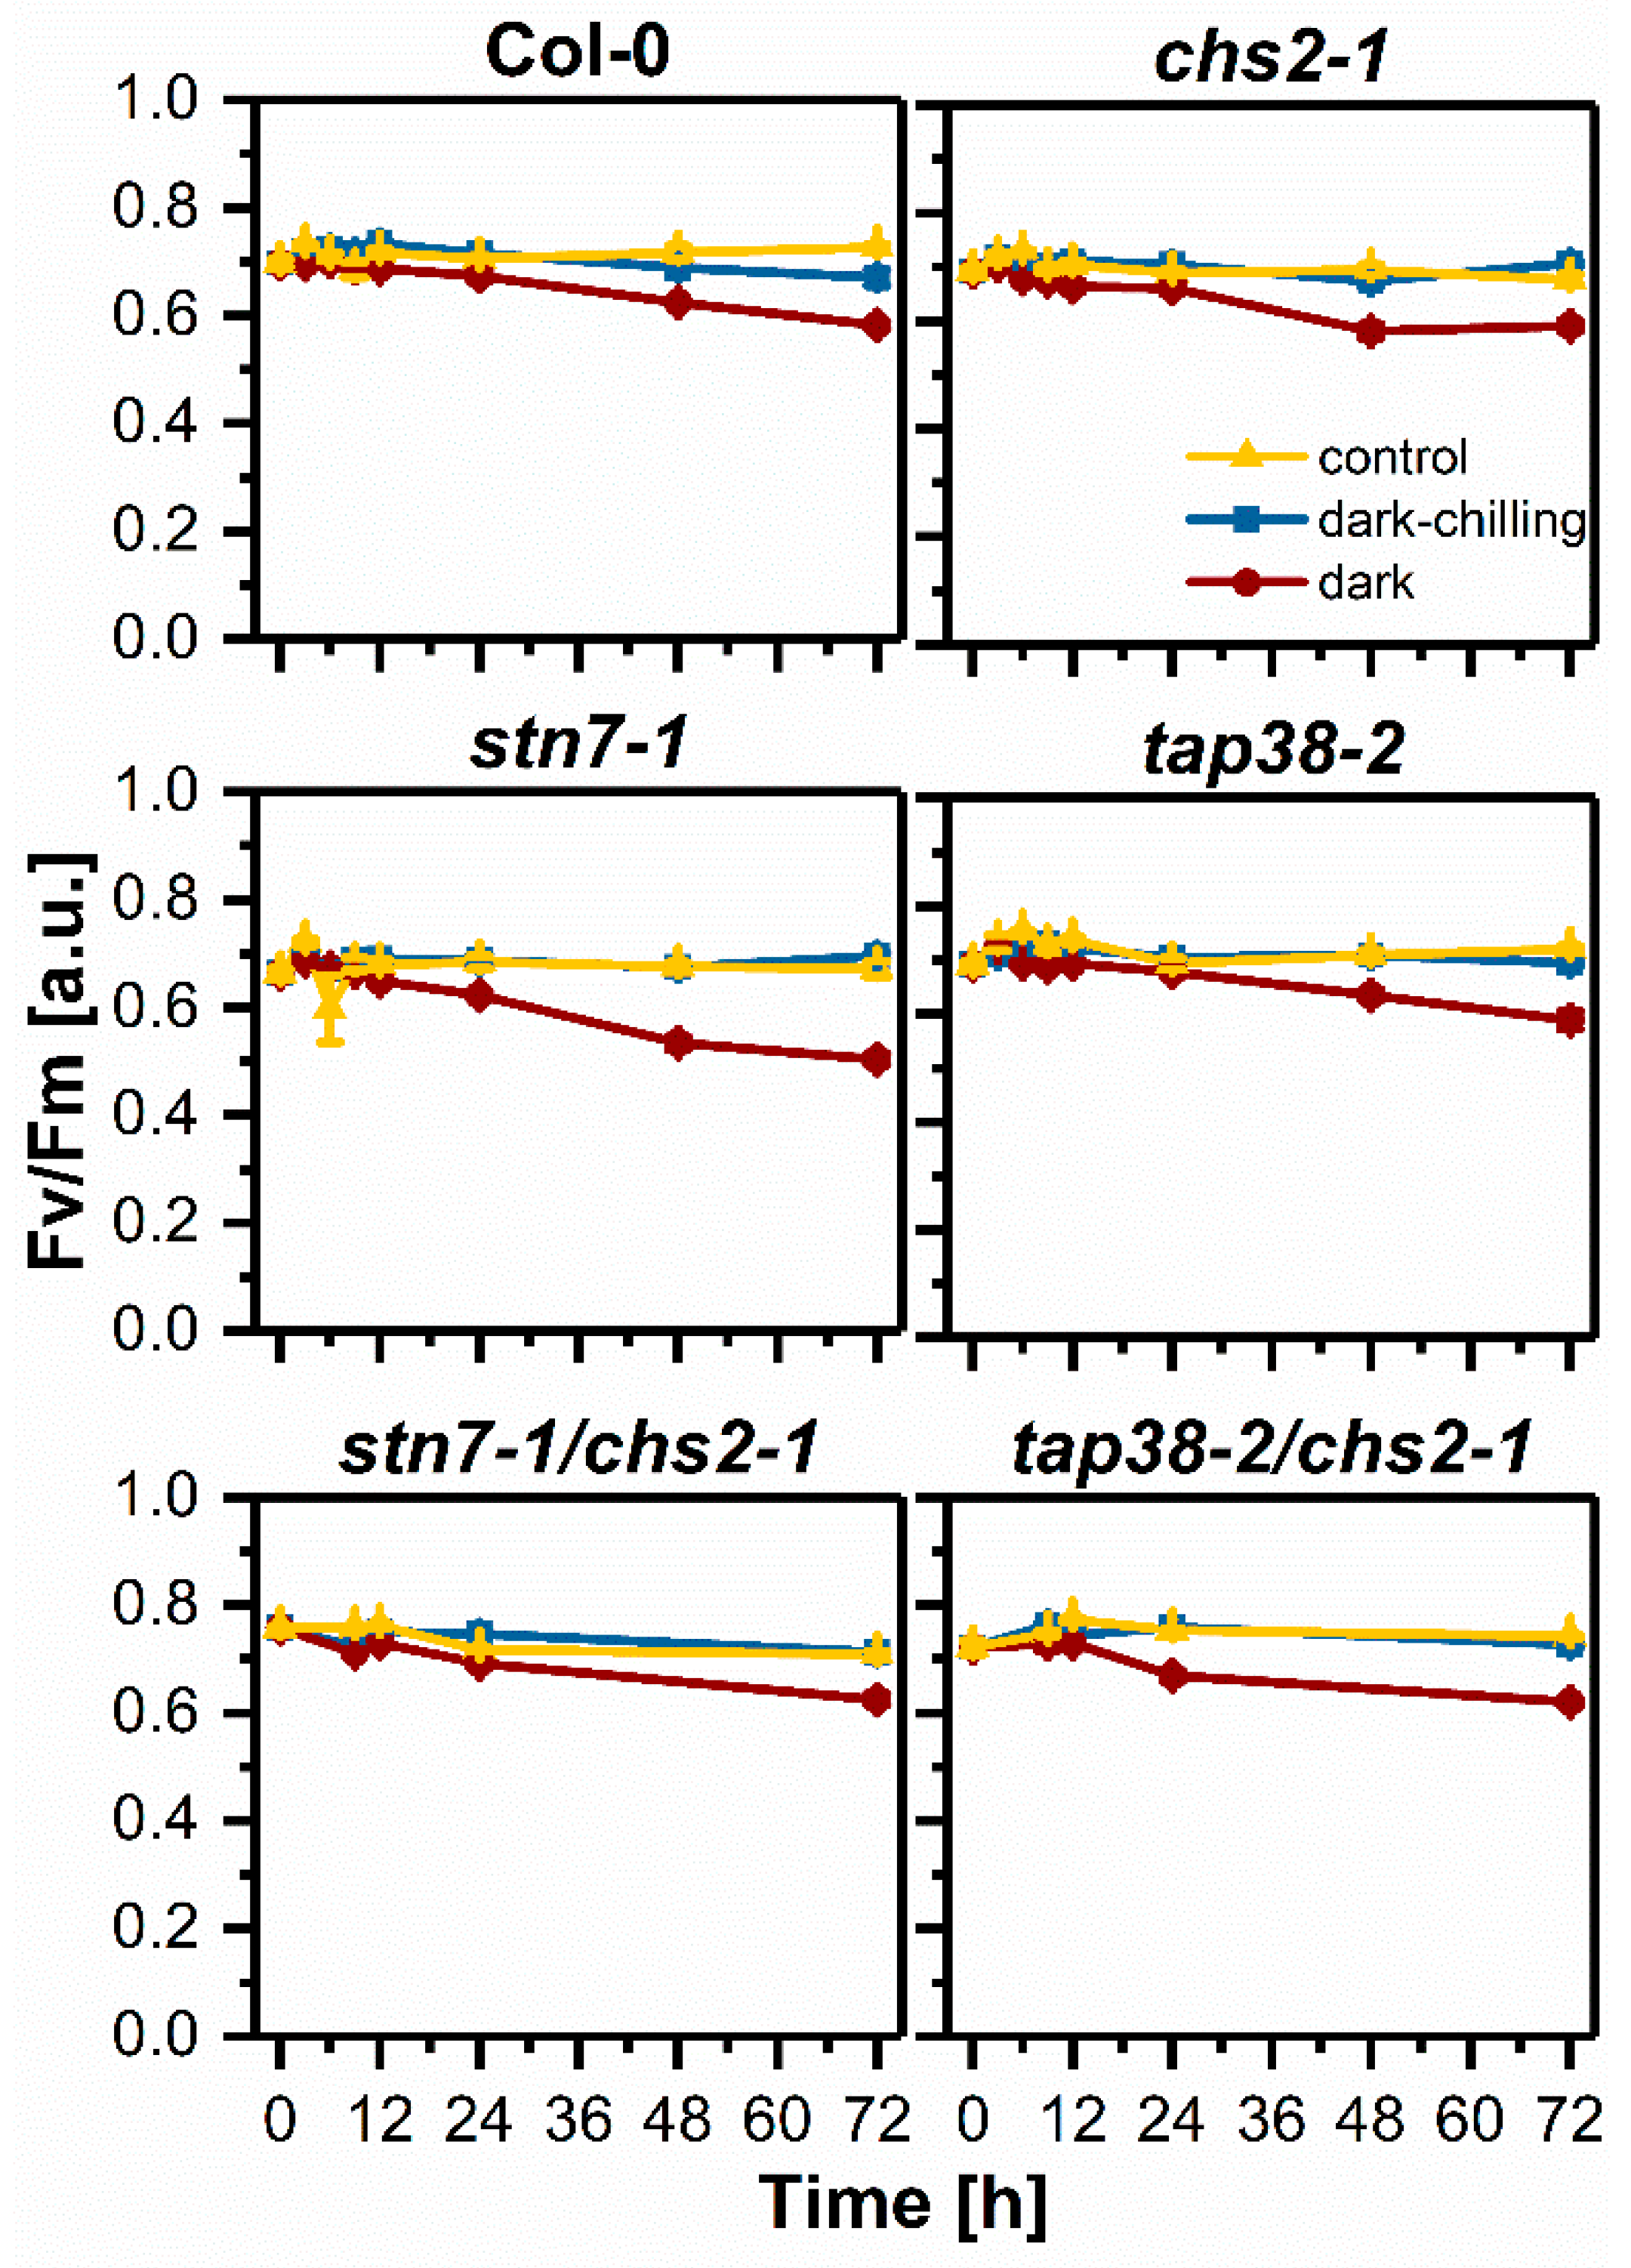
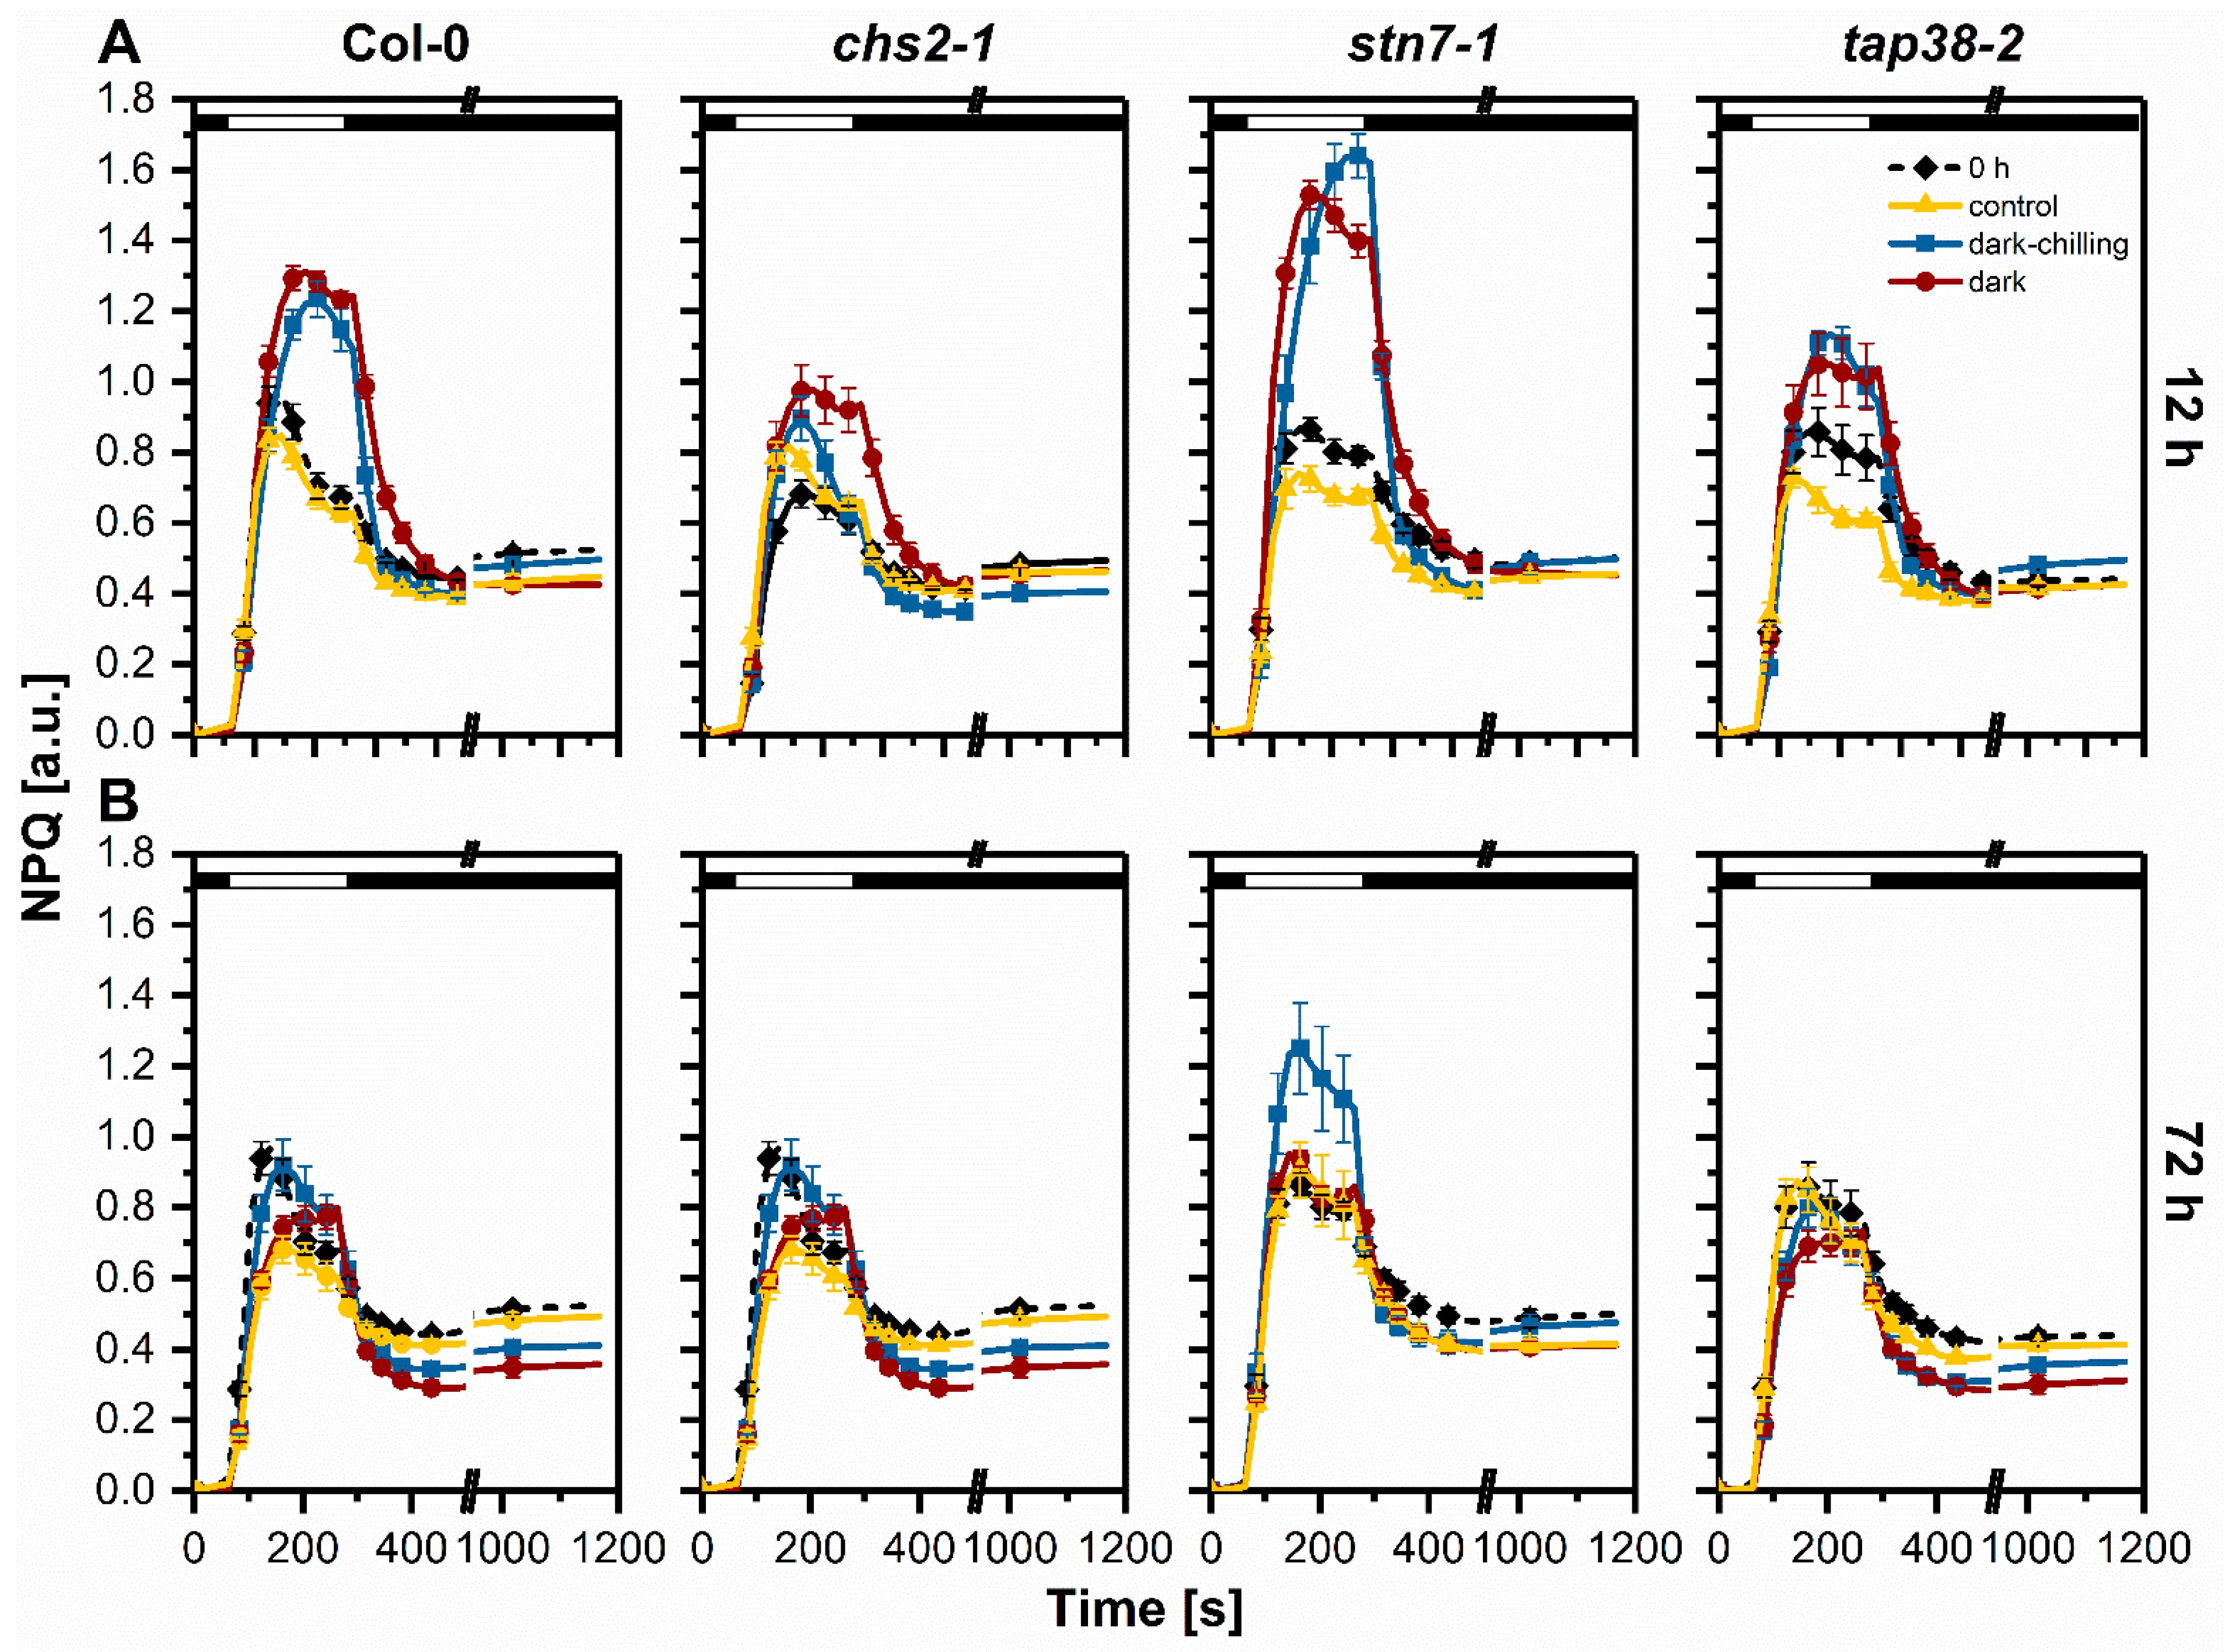
2.4. Photochemical Efficiency under Dark-Chilling and Dark Conditions
3. Discussion
4. Materials and Methods
4.1. Plant Lines, Growing Conditions, and Dark-Chilling Treatment
4.2. Preparation of Thylakoid Membranes
4.3. Electrophoretic Techniques
4.4. Two-Layer Phos-TagTM PAGE
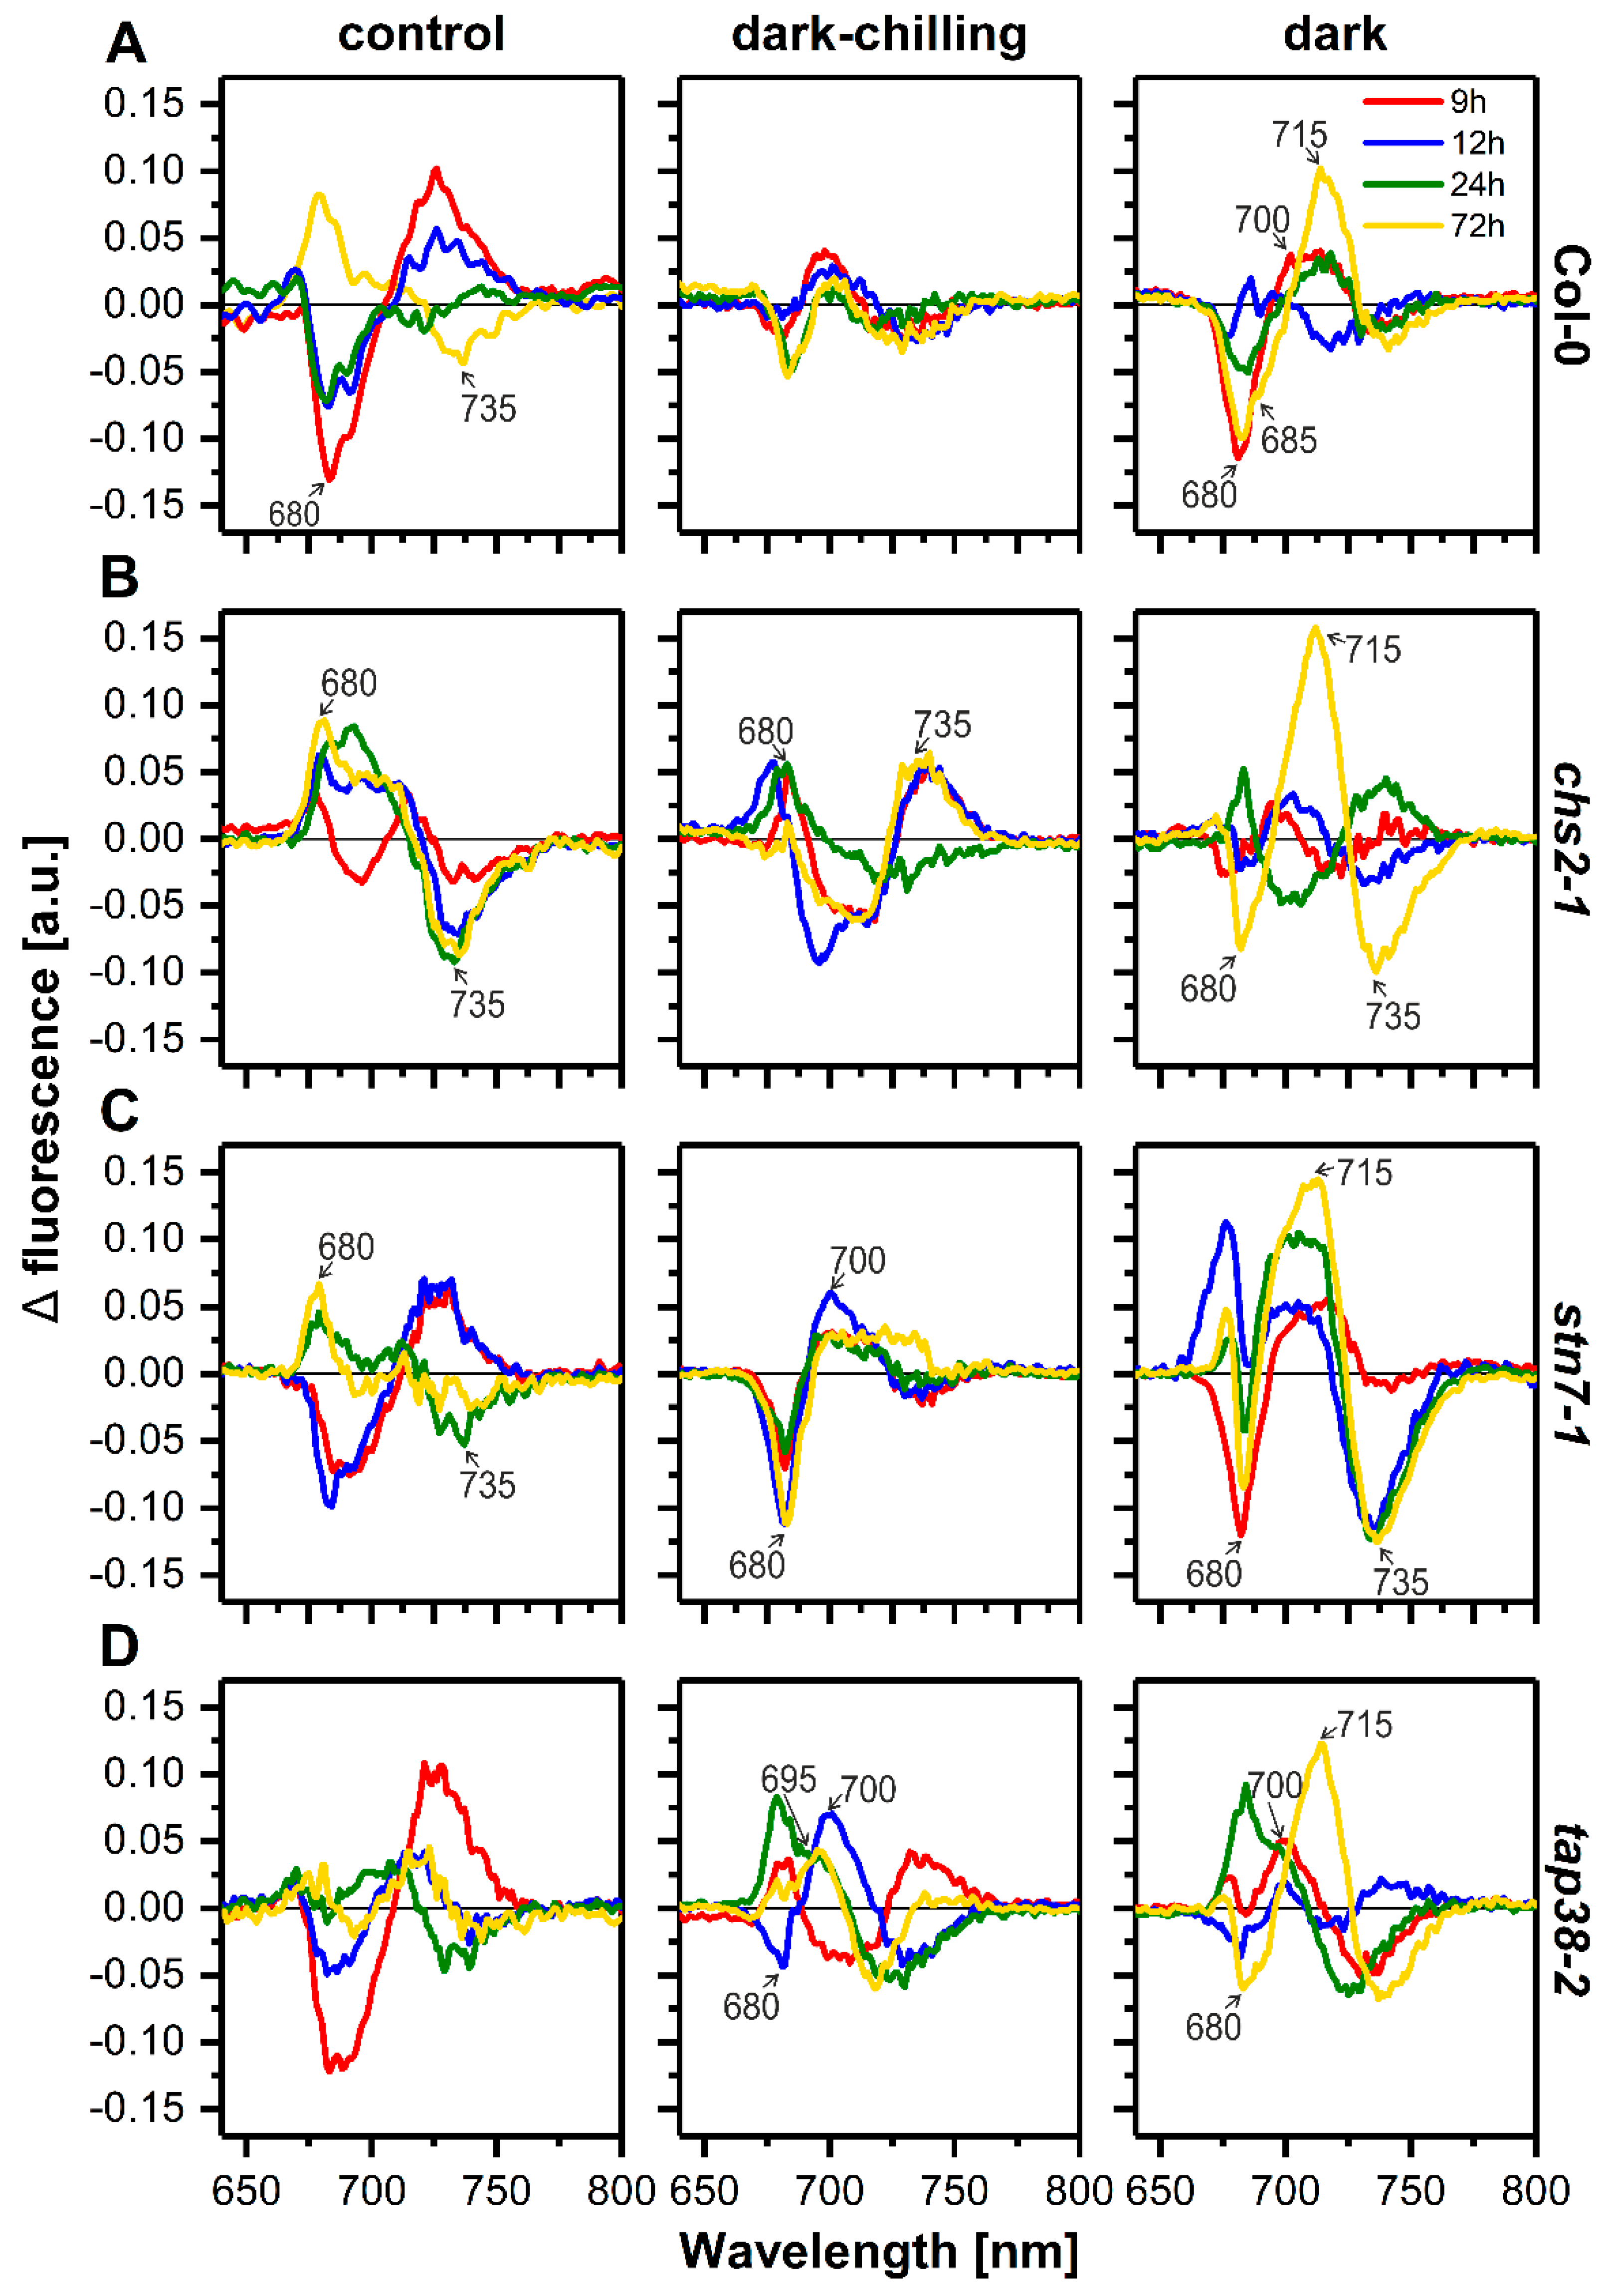
4.5. Low-Temperature Fluorescence Measurements
4.6. Chlorophyll a Fluorescence Measurements
4.7. Thiobarbituric Acid-Reactive Substances (TBARS) Assay
4.8. Statistical Analysis
Supplementary Materials
Author Contributions
Funding
Institutional Review Board Statement
Informed Consent Statement
Data Availability Statement
Acknowledgments
Conflicts of Interest
References
- Puthiyaveetil, S.; Kirchhoff, H.; Höhner, R. Structural and Functional Dynamics of the Thylakoid Membrane System. In Chloroplasts: Current Research and Future Trends; Kirchhoff, H., Ed.; Caister Academic Press: Poole, UK, 2016; pp. 59–88. [Google Scholar]
- Pribil, M.; Labs, M.; Leister, D. Structure and dynamics of thylakoids in land plants. J. Exp. Bot. 2014, 65, 1955–1972. [Google Scholar] [CrossRef] [PubMed] [Green Version]
- Ruban, A.V.; Johnson, M.P. Visualizing the dynamic structure of the plant photosynthetic membrane. Nat. Plants 2015, 1, 15161. [Google Scholar] [CrossRef] [PubMed]
- Koochak, H.; Puthiyaveetil, S.; Mullendore, D.L.; Li, M.; Kirchhoff, H. The structural and functional domains of plant thylakoid membranes. Plant J. 2019, 97, 412–429. [Google Scholar] [CrossRef] [PubMed] [Green Version]
- Allahverdiyeva, Y.; Suorsa, M.; Tikkanen, M.; Aro, E.M. Photoprotection of photosystems in fluctuating light intensities. J. Exp. Bot. 2015, 66, 2427–2436. [Google Scholar] [CrossRef] [PubMed]
- Nikkanen, L.; Rintamäki, E. Chloroplast thioredoxin systems dynamically regulate photosynthesis in plants. Biochem. J. 2019, 476, 1159–1172. [Google Scholar] [CrossRef] [PubMed] [Green Version]
- Johnson, M.P.; Wientjes, E. The relevance of dynamic thylakoid organisation to photosynthetic regulation. Biochim. Biophys. Acta (BBA)-Bioenerg. 2020, 1861, 148039. [Google Scholar] [CrossRef] [PubMed]
- Tikkanen, M.; Grieco, M.; Nurmi, M.; Rantala, M.; Suorsa, M.; Aro, E.M. Regulation of the photosynthetic apparatus under fluctuating growth light. Philos. Trans. R. Soc. Lond. B Biol. Sci. 2012, 367, 3486–3493. [Google Scholar] [CrossRef] [Green Version]
- Longoni, F.P.; Goldschmidt-Clermont, M. Thylakoid Protein Phosphorylation in Chloroplasts. Plant Cell Physiol. 2021, 62, 1094–1107. [Google Scholar] [CrossRef]
- Bellafiore, S.; Barneche, F.; Peltier, G.; Rochaix, J.-D. State transitions and light adaptation require chloroplast thylakoid protein kinase STN7. Nature 2005, 433, 892–895. [Google Scholar] [CrossRef]
- Trotta, A.; Suorsa, M.; Rantala, M.; Lundin, B.; Aro, E.M. Serine and threonine residues of plant STN7 kinase are differentially phosphorylated upon changing light conditions and specifically influence the activity and stability of the kinase. Plant J. 2016, 87, 484–494. [Google Scholar] [CrossRef]
- Shapiguzov, A.; Chai, X.; Fucile, G.; Longoni, P.; Zhang, L.; Rochaix, J.-D. Activation of the Stt7/STN7 Kinase through Dynamic Interactions with the Cytochrome b6f Complex. Plant Physiol. 2016, 171, 82–92. [Google Scholar] [CrossRef] [PubMed] [Green Version]
- Galka, P.; Santabarbara, S.; Khuong, T.T.; Degand, H.; Morsomme, P.; Jennings, R.C.; Boekema, E.J.; Caffarri, S. Functional analyses of the plant photosystem I-light-harvesting complex II supercomplex reveal that light-harvesting complex II loosely bound to photosystem II is a very efficient antenna for photosystem I in state II. Plant Cell 2012, 24, 2963–2978. [Google Scholar] [CrossRef] [PubMed] [Green Version]
- Longoni, P.; Douchi, D.; Cariti, F.; Fucile, G.; Goldschmidt-Clermont, M. Phosphorylation of the Light-Harvesting Complex II Isoform Lhcb2 Is Central to State Transitions. Plant Physiol. 2015, 169, 2874–2883. [Google Scholar] [CrossRef] [PubMed]
- Pan, X.; Ma, J.; Su, X.; Cao, P.; Chang, W.; Liu, Z.; Zhang, X.; Li, M. Structure of the maize photosystem I supercomplex with light-harvesting complexes I and II. Science 2018, 360, 1109–1113. [Google Scholar] [CrossRef] [PubMed] [Green Version]
- Cui, Z.; Wang, Y.; Zhang, A.; Zhang, L. Regulation of Reversible Dissociation of LHCII from PSII by Phosphorylation in Plants. Am. J. Plant Sci. 2014, 5, 241. [Google Scholar] [CrossRef] [Green Version]
- Wood, W.H.J.; Barnett, S.F.H.; Flannery, S.; Hunter, C.N.; Johnson, M.P. Dynamic Thylakoid Stacking Is Regulated by LHCII Phosphorylation but Not Its interaction with PSI. Plant Physiol. 2019, 180, 2152–2166. [Google Scholar] [CrossRef] [Green Version]
- Wood, W.H.J.; Johnson, M.P. Modeling the Role of LHCII-LHCII, PSII-LHCII, and PSI-LHCII Interactions in State Transitions. Biophys. J. 2020, 119, 287–299. [Google Scholar] [CrossRef]
- Shapiguzov, A.; Ingelsson, B.; Samol, I.; Andres, C.; Kessler, F.; Rochaix, J.-D.; Vener, A.V.; Goldschmidt-Clermont, M. The PPH1 phosphatase is specifically involved in LHCII dephosphorylation and state transitions in Arabidopsis. Proc. Natl. Acad. Sci. USA 2010, 107, 4782–4787. [Google Scholar] [CrossRef] [Green Version]
- Pribil, M.; Pesaresi, P.; Hertle, A.; Barbato, R.; Leister, D. Role of plastid protein phosphatase TAP38 in LHCII dephosphorylation and thylakoid electron flow. PLoS Biol. 2010, 8, e1000288. [Google Scholar] [CrossRef] [Green Version]
- Chen, Y.-E.; Cui, J.-M.; Su, Y.-Q.; Zhang, C.-M.; Ma, J.; Zhang, Z.-W.; Yuan, M.; Liu, W.-J.; Zhang, H.-Y.; Yuan, S. Comparison of phosphorylation and assembly of photosystem complexes and redox homeostasis in two wheat cultivars with different drought resistance. Sci. Rep. 2017, 7, 12718. [Google Scholar] [CrossRef] [Green Version]
- Grieco, M.; Roustan, V.; Dermendjiev, G.; Rantala, S.; Jain, A.; Leonardelli, M.; Neumann, K.; Berger, V.; Engelmeier, D.; Bachmann, G.; et al. Adjustment of photosynthetic activity to drought and fluctuating light in wheat. Plant Cell Environ. 2020, 43, 1484–1500. [Google Scholar] [CrossRef] [PubMed] [Green Version]
- Mazur, R.; Maszkowska, J.; Anielska-Mazur, A.; Garstka, M.; Polkowska-Kowalczyk, L.; Czajkowska, A.; Zmienko, A.; Dobrowolska, G.; Kulik, A. The SnRK2.10 kinase mitigates the adverse effects of salinity by protecting photosynthetic machinery. Plant Physiol. 2021, 187, 2785–2802. [Google Scholar] [CrossRef] [PubMed]
- Marutani, Y.; Yamauchi, Y.; Higashiyama, M.; Miyoshi, A.; Akimoto, S.; Inoue, K.; Ikeda, K.I.; Mizutani, M.; Sugimoto, Y. Essential role of the PSI-LHCII supercomplex in photosystem acclimation to light and/or heat conditions by state transitions. Photosynth. Res. 2017, 131, 41–50. [Google Scholar] [CrossRef] [PubMed]
- Nellaepalli, S.; Mekala, N.R.; Zsiros, O.; Mohanty, P.; Subramanyam, R. Moderate heat stress induces state transitions in Arabidopsis thaliana. Biochim. Biophys. Acta 2011, 1807, 1177–1184. [Google Scholar] [CrossRef] [Green Version]
- Nellaepalli, S.; Kodru, S.; Raghavendra, A.S.; Subramanyam, R. Antimycin A sensitive pathway independent from PGR5 cyclic electron transfer triggers non-photochemical reduction of PQ pool and state transitions in Arabidopsis thaliana. J. Photochem. Photobiol. B 2015, 146, 24–33. [Google Scholar] [CrossRef] [PubMed]
- Nellaepalli, S.; Kodru, S.; Tirupathi, M.; Subramanyam, R. Anaerobiosis induced state transition: A non photochemical reduction of PQ pool mediated by NDH in Arabidopsis thaliana. PLoS ONE 2012, 7, e49839. [Google Scholar] [CrossRef]
- Nellaepalli, S.; Kodru, S.; Subramanyam, R. Effect of cold temperature on regulation of state transitions in Arabidopsis thaliana. J. Photochem. Photobiol. B 2012, 112, 23–30. [Google Scholar] [CrossRef]
- Mazur, R.; Gieczewska, K.; Kowalewska, Ł.; Kuta, A.; Proboszcz, M.; Gruszecki, W.I.; Mostowska, A.; Garstka, M. Specific Composition of Lipid Phases Allows Retaining an Optimal Thylakoid Membrane Fluidity in Plant Response to Low-Temperature Treatment. Front. Plant Sci. 2020, 11, 723. [Google Scholar] [CrossRef]
- Suorsa, M.; Rantala, M.; Mamedov, F.; Lespinasse, M.; Trotta, A.; Grieco, M.; Vuorio, E.; Tikkanen, M.; Järvi, S.; Aro, E.-M. Light acclimation involves dynamic re-organization of the pigment–protein megacomplexes in non-appressed thylakoid domains. Plant J. 2015, 84, 360–373. [Google Scholar] [CrossRef]
- Rantala, M.; Lehtimäki, N.; Aro, E.-M.; Suorsa, M. Downregulation of TAP38/PPH1 enables LHCII hyperphosphorylation in Arabidopsis mutant lacking LHCII docking site in PSI. FEBS Lett. 2016, 590, 787–794. [Google Scholar] [CrossRef] [Green Version]
- Wei, X.; Guo, J.; Li, M.; Liu, Z. Structural Mechanism Underlying the Specific Recognition between the Arabidopsis State-Transition Phosphatase TAP38/PPH1 and Phosphorylated Light-Harvesting Complex Protein Lhcb1. Plant Cell 2015, 27, 1113–1127. [Google Scholar] [CrossRef] [PubMed] [Green Version]
- Longoni, P.; Samol, I.; Goldschmidt-Clermont, M. The Kinase STATE TRANSITION 8 Phosphorylates Light Harvesting Complex II and Contributes to Light Acclimation in Arabidopsis thaliana. Front. Plant Sci. 2019, 10, 1156. [Google Scholar] [CrossRef] [PubMed]
- Rogowski, P.; Wasilewska-Dębowska, W.; Krupnik, T.; Drożak, A.; Zienkiewicz, M.; Krysiak, M.; Romanowska, E. Photosynthesis and organization of maize mesophyll and bundle sheath thylakoids of plants grown in various light intensities. Environ. Exp. Bot. 2019, 162, 72–86. [Google Scholar] [CrossRef]
- Zhang, X.-H.; Zheng, X.-T.; Sun, B.-Y.; Peng, C.-L.; Chow, W.S. Over-expression of the CHS gene enhances resistance of Arabidopsis leaves to high light. Environ. Exp. Bot. 2018, 154, 33–43. [Google Scholar] [CrossRef] [Green Version]
- Mekala, N.R.; Suorsa, M.; Rantala, M.; Aro, E.-M.; Tikkanen, M. Plants Actively Avoid State Transitions upon Changes in Light Intensity: Role of Light-Harvesting Complex II Protein Dephosphorylation in High Light. Plant Physiol. 2015, 168, 721–734. [Google Scholar] [CrossRef] [Green Version]
- Muller, P.; Li, X.-P.; Niyogi, K.K. Non-Photochemical Quenching. A Response to Excess Light Energy1. Plant Physiol. 2001, 125, 1558–1566. [Google Scholar] [CrossRef] [Green Version]
- Allen, D.J.; Ort, D.R. Impacts of chilling temperatures on photosynthesis in warm-climate plants. Trends Plant Sci. 2001, 6, 36–42. [Google Scholar] [CrossRef]
- Liu, X.; Zhou, Y.; Xiao, J.; Bao, F. Effects of Chilling on the Structure, Function and Development of Chloroplasts. Front. Plant Sci. 2018, 9, 1715. [Google Scholar] [CrossRef] [Green Version]
- Gan, P.; Liu, F.; Li, R.; Wang, S.; Luo, J. Chloroplasts—Beyond Energy Capture and Carbon Fixation: Tuning of Photosynthesis in Response to Chilling Stress. Int. J. Mol. Sci. 2019, 20, 5046. [Google Scholar] [CrossRef] [Green Version]
- Soitamo, A.J.; Piippo, M.; Allahverdiyeva, Y.; Battchikova, N.; Aro, E.M. Light has a specific role in modulating Arabidopsis gene expression at low temperature. BMC Plant Biol. 2008, 8, 13. [Google Scholar] [CrossRef] [Green Version]
- Tikkanen, M.; Aro, E.M. Thylakoid protein phosphorylation in dynamic regulation of photosystem II in higher plants. Biochim. Biophys. Acta 2012, 1817, 232–238. [Google Scholar] [CrossRef] [PubMed] [Green Version]
- Leyva, A.; Jarillo, J.A.; Salinas, J.; Martinez-Zapater, J.M. Low Temperature Induces the Accumulation of Phenylalanine Ammonia-Lyase and Chalcone Synthase mRNAs of Arabidopsis thaliana in a Light-Dependent Manner. Plant Physiol. 1995, 108, 39–46. [Google Scholar] [CrossRef] [PubMed]
- Christie, P.J.; Alfenito, M.R.; Walbot, V. Impact of low-temperature stress on general phenylpropanoid and anthocyanin pathways: Enhancement of transcript abundance and anthocyanin pigmentation in maize seedlings. Planta 1994, 194, 541–549. [Google Scholar] [CrossRef]
- Calzadilla, P.I.; Maiale, S.J.; Ruiz, O.A.; Escaray, F.J. Transcriptome Response Mediated by Cold Stress in Lotus japonicus. Front. Plant Sci. 2016, 7, 374. [Google Scholar] [CrossRef] [Green Version]
- Zheng, X.-T.; Yu, Z.-C.; Tang, J.-W.; Cai, M.-L.; Chen, Y.-L.; Yang, C.-W.; Chow, W.S.; Peng, C.-L. The major photoprotective role of anthocyanins in leaves of Arabidopsis thaliana under long-term high light treatment: Antioxidant or light attenuator? Photosynth. Res. 2021, 149, 25–40. [Google Scholar] [CrossRef]
- Garstka, M.; Drozak, A.; Rosiak, M.; Venema, J.H.; Kierdaszuk, B.; Simeonova, E.; van Hasselt, P.R.; Dobrucki, J.; Mostowska, A. Light-dependent reversal of dark-chilling induced changes in chloroplast structure and arrangement of chlorophyll-protein complexes in bean thylakoid membranes. Biochim. Biophys. Acta 2005, 1710, 13–23. [Google Scholar] [CrossRef] [Green Version]
- Garstka, M.; Venema, J.H.; Rumak, I.; Gieczewska, K.; Rosiak, M.; Koziol-Lipinska, J.; Kierdaszuk, B.; Vredenberg, W.J.; Mostowska, A. Contrasting effect of dark-chilling on chloroplast structure and arrangement of chlorophyll-protein complexes in pea and tomato: Plants with a different susceptibility to non-freezing temperature. Planta 2007, 226, 1165–1181. [Google Scholar] [CrossRef]
- Maksimov, E.G.; Mironov, K.S.; Trofimova, M.S.; Nechaeva, N.L.; Todorenko, D.A.; Klementiev, K.E.; Tsoraev, G.V.; Tyutyaev, E.V.; Zorina, A.A.; Feduraev, P.V.; et al. Membrane fluidity controls redox-regulated cold stress responses in cyanobacteria. Photosynth. Res. 2017, 133, 215–223. [Google Scholar] [CrossRef]
- Goral, T.K.; Johnson, M.P.; Brain, A.P.R.; Kirchhoff, H.; Ruban, A.V.; Mullineaux, C.W. Visualizing the mobility and distribution of chlorophyll proteins in higher plant thylakoid membranes: Effects of photoinhibition and protein phosphorylation. Plant J. 2010, 62, 948–959. [Google Scholar] [CrossRef] [Green Version]
- Desplats, C.; Mus, F.; Cuine, S.; Billon, E.; Cournac, L.; Peltier, G. Characterization of Nda2, a plastoquinone-reducing type II NAD(P)H dehydrogenase in chlamydomonas chloroplasts. J. Biol. Chem. 2009, 284, 4148–4157. [Google Scholar] [CrossRef] [Green Version]
- Hou, C.X.; Rintamäki, E.; Aro, E.M. Ascorbate-mediated LHCII protein phosphorylation—LHCII kinase regulation in light and in darkness. Biochemistry 2003, 42, 5828–5836. [Google Scholar] [CrossRef] [PubMed]
- Neuhaus, H.E.; Emes, M.J. NONPHOTOSYNTHETIC METABOLISM IN PLASTIDS. Annu. Rev. Plant Physiol. Plant Mol. Biol. 2000, 51, 111–140. [Google Scholar] [CrossRef] [PubMed]
- Van Heerden, P.D.R.; De Villiers, M.F.; Van Staden, J.; Krüger, G.H.J. Dark chilling increases glucose-6-phosphate dehydrogenase activity in soybean leaves. Physiol. Plant. 2003, 119, 221–230. [Google Scholar] [CrossRef]
- Gibon, Y.; Bläsing, O.E.; Palacios-Rojas, N.; Pankovic, D.; Hendriks, J.H.M.; Fisahn, J.; Höhne, M.; Günther, M.; Stitt, M. Adjustment of diurnal starch turnover to short days: Depletion of sugar during the night leads to a temporary inhibition of carbohydrate utilization, accumulation of sugars and post-translational activation of ADP-glucose pyrophosphorylase in the following light period. Plant J. 2004, 39, 847–862. [Google Scholar] [CrossRef]
- Golding, A.J.; Finazzi, G.; Johnson, G.N. Reduction of the thylakoid electron transport chain by stromal reductants—Evidence for activation of cyclic electron transport upon dark adaptation or under drought. Planta 2004, 220, 356–363. [Google Scholar] [CrossRef]
- Nikkanen, L.; Toivola, J.; Trotta, A.; Diaz, M.G.; Tikkanen, M.; Aro, E.M.; Rintamäki, E. Regulation of cyclic electron flow by chloroplast NADPH-dependent thioredoxin system. Plant Direct 2018, 2, e00093. [Google Scholar] [CrossRef] [Green Version]
- Belgio, E.; Johnson, M.P.; Juric, S.; Ruban, A.V. Higher plant photosystem II light-harvesting antenna, not the reaction center, determines the excited-state lifetime-both the maximum and the nonphotochemically quenched. Biophys. J. 2012, 102, 2761–2771. [Google Scholar] [CrossRef] [Green Version]
- Tikkanen, M.; Gollan, P.J.; Mekala, N.R.; Isojarvi, J.; Aro, E.M. Light-harvesting mutants show differential gene expression upon shift to high light as a consequence of photosynthetic redox and reactive oxygen species metabolism. Philos. Trans. R. Soc. Lond. B Biol. Sci. 2014, 369, 20130229. [Google Scholar] [CrossRef] [Green Version]
- Fristedt, R.; Vener, A.V. High light induced disassembly of photosystem II supercomplexes in Arabidopsis requires STN7-dependent phosphorylation of CP29. PLoS ONE 2011, 6, e24565. [Google Scholar] [CrossRef]
- Schönberg, A.; Rödiger, A.; Mehwald, W.; Galonska, J.; Christ, G.; Helm, S.; Thieme, D.; Majovsky, P.; Hoehenwarter, W.; Baginsky, S. Identification of STN7/STN8 kinase targets reveals connections between electron transport, metabolism and gene expression. Plant J. 2017, 90, 1176–1186. [Google Scholar] [CrossRef] [Green Version]
- Schneider, J.C.; Suzanne, H.; Somerville, C.R. Chilling-sensitive mutants of arabidopsis. Plant Mol. Biol. Report. 1995, 13, 11–17. [Google Scholar] [CrossRef]
- Rumak, I.; Mazur, R.; Gieczewska, K.; Koziol-Lipinska, J.; Kierdaszuk, B.; Michalski, W.P.; Shiell, B.J.; Venema, J.H.; Vredenberg, W.J.; Mostowska, A.; et al. Correlation between spatial (3D) structure of pea and bean thylakoid membranes and arrangement of chlorophyll-protein complexes. BMC Plant Biol. 2012, 12, 72. [Google Scholar] [CrossRef] [PubMed] [Green Version]
- Lichtenthaler, H. Chlorophylls and carotenoids-pigments of photosynthetic biomembranes. Methods Enzymol. 1987, 148, 350–382. [Google Scholar]
- Andreeva, A.; Stoitchkova, K.; Busheva, M.; Apostolova, E. Changes in the energy distribution between chlorophyll–protein complexes of thylakoid membranes from pea mutants with modified pigment content. J. Photochem. Photobiol. B Biol. 2003, 70, 153–162. [Google Scholar] [CrossRef]
- Hodges, D.M.; DeLong, J.M.; Forney, C.F.; Prange, R.K. Improving the thiobarbituric acid-reactive-substances assay for estimating lipid peroxidation in plant tissues containing anthocyanin and other interfering compounds. Planta 1999, 207, 604–611. [Google Scholar] [CrossRef]


Publisher’s Note: MDPI stays neutral with regard to jurisdictional claims in published maps and institutional affiliations. |
© 2022 by the authors. Licensee MDPI, Basel, Switzerland. This article is an open access article distributed under the terms and conditions of the Creative Commons Attribution (CC BY) license (https://creativecommons.org/licenses/by/4.0/).
Share and Cite
Węgrzyn, A.; Krysiak, M.; Kulik, A.; Gieczewska, K.B.; Mazur, R. STN7 Kinase Is Essential for Arabidopsis thaliana Fitness under Prolonged Darkness but Not under Dark-Chilling Conditions. Int. J. Mol. Sci. 2022, 23, 4531. https://0-doi-org.brum.beds.ac.uk/10.3390/ijms23094531
Węgrzyn A, Krysiak M, Kulik A, Gieczewska KB, Mazur R. STN7 Kinase Is Essential for Arabidopsis thaliana Fitness under Prolonged Darkness but Not under Dark-Chilling Conditions. International Journal of Molecular Sciences. 2022; 23(9):4531. https://0-doi-org.brum.beds.ac.uk/10.3390/ijms23094531
Chicago/Turabian StyleWęgrzyn, Anna, Małgorzata Krysiak, Anna Kulik, Katarzyna B. Gieczewska, and Radosław Mazur. 2022. "STN7 Kinase Is Essential for Arabidopsis thaliana Fitness under Prolonged Darkness but Not under Dark-Chilling Conditions" International Journal of Molecular Sciences 23, no. 9: 4531. https://0-doi-org.brum.beds.ac.uk/10.3390/ijms23094531