
Mammalian Cell Interaction with Periodic Surface Nanostructures

 , ,
, ,
Abstract
:1. Introduction
2. Results and Discussion
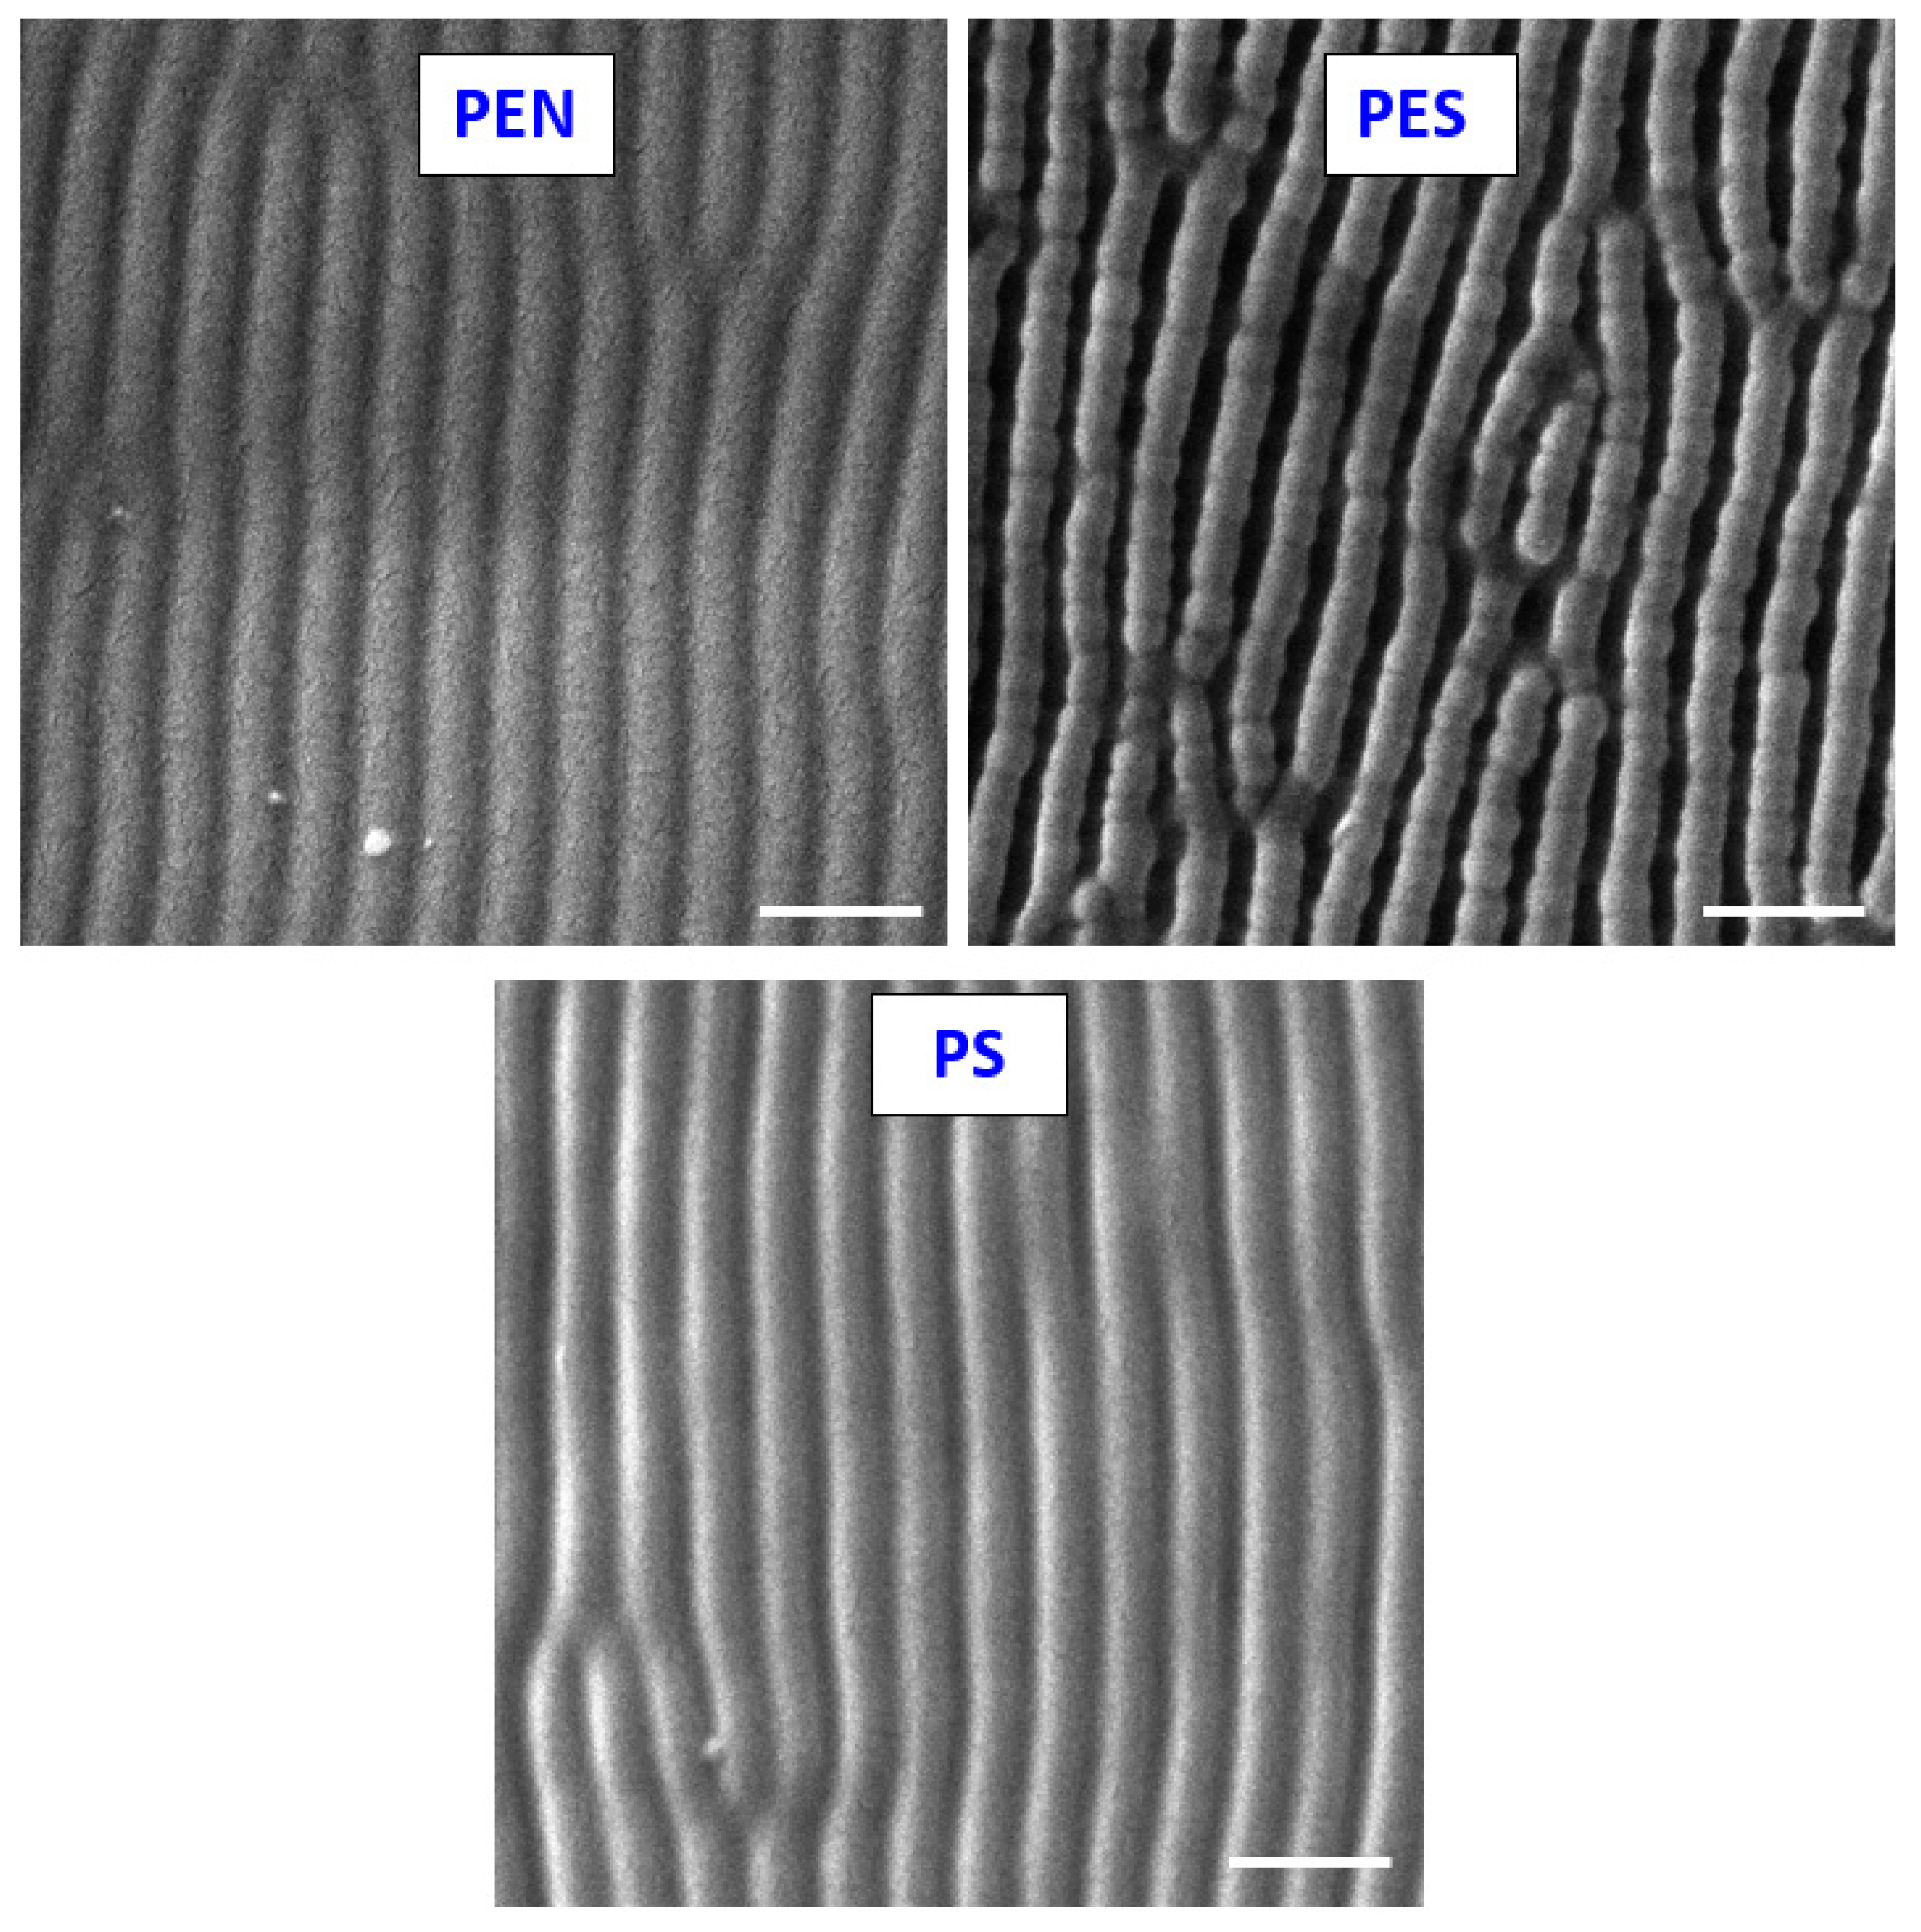
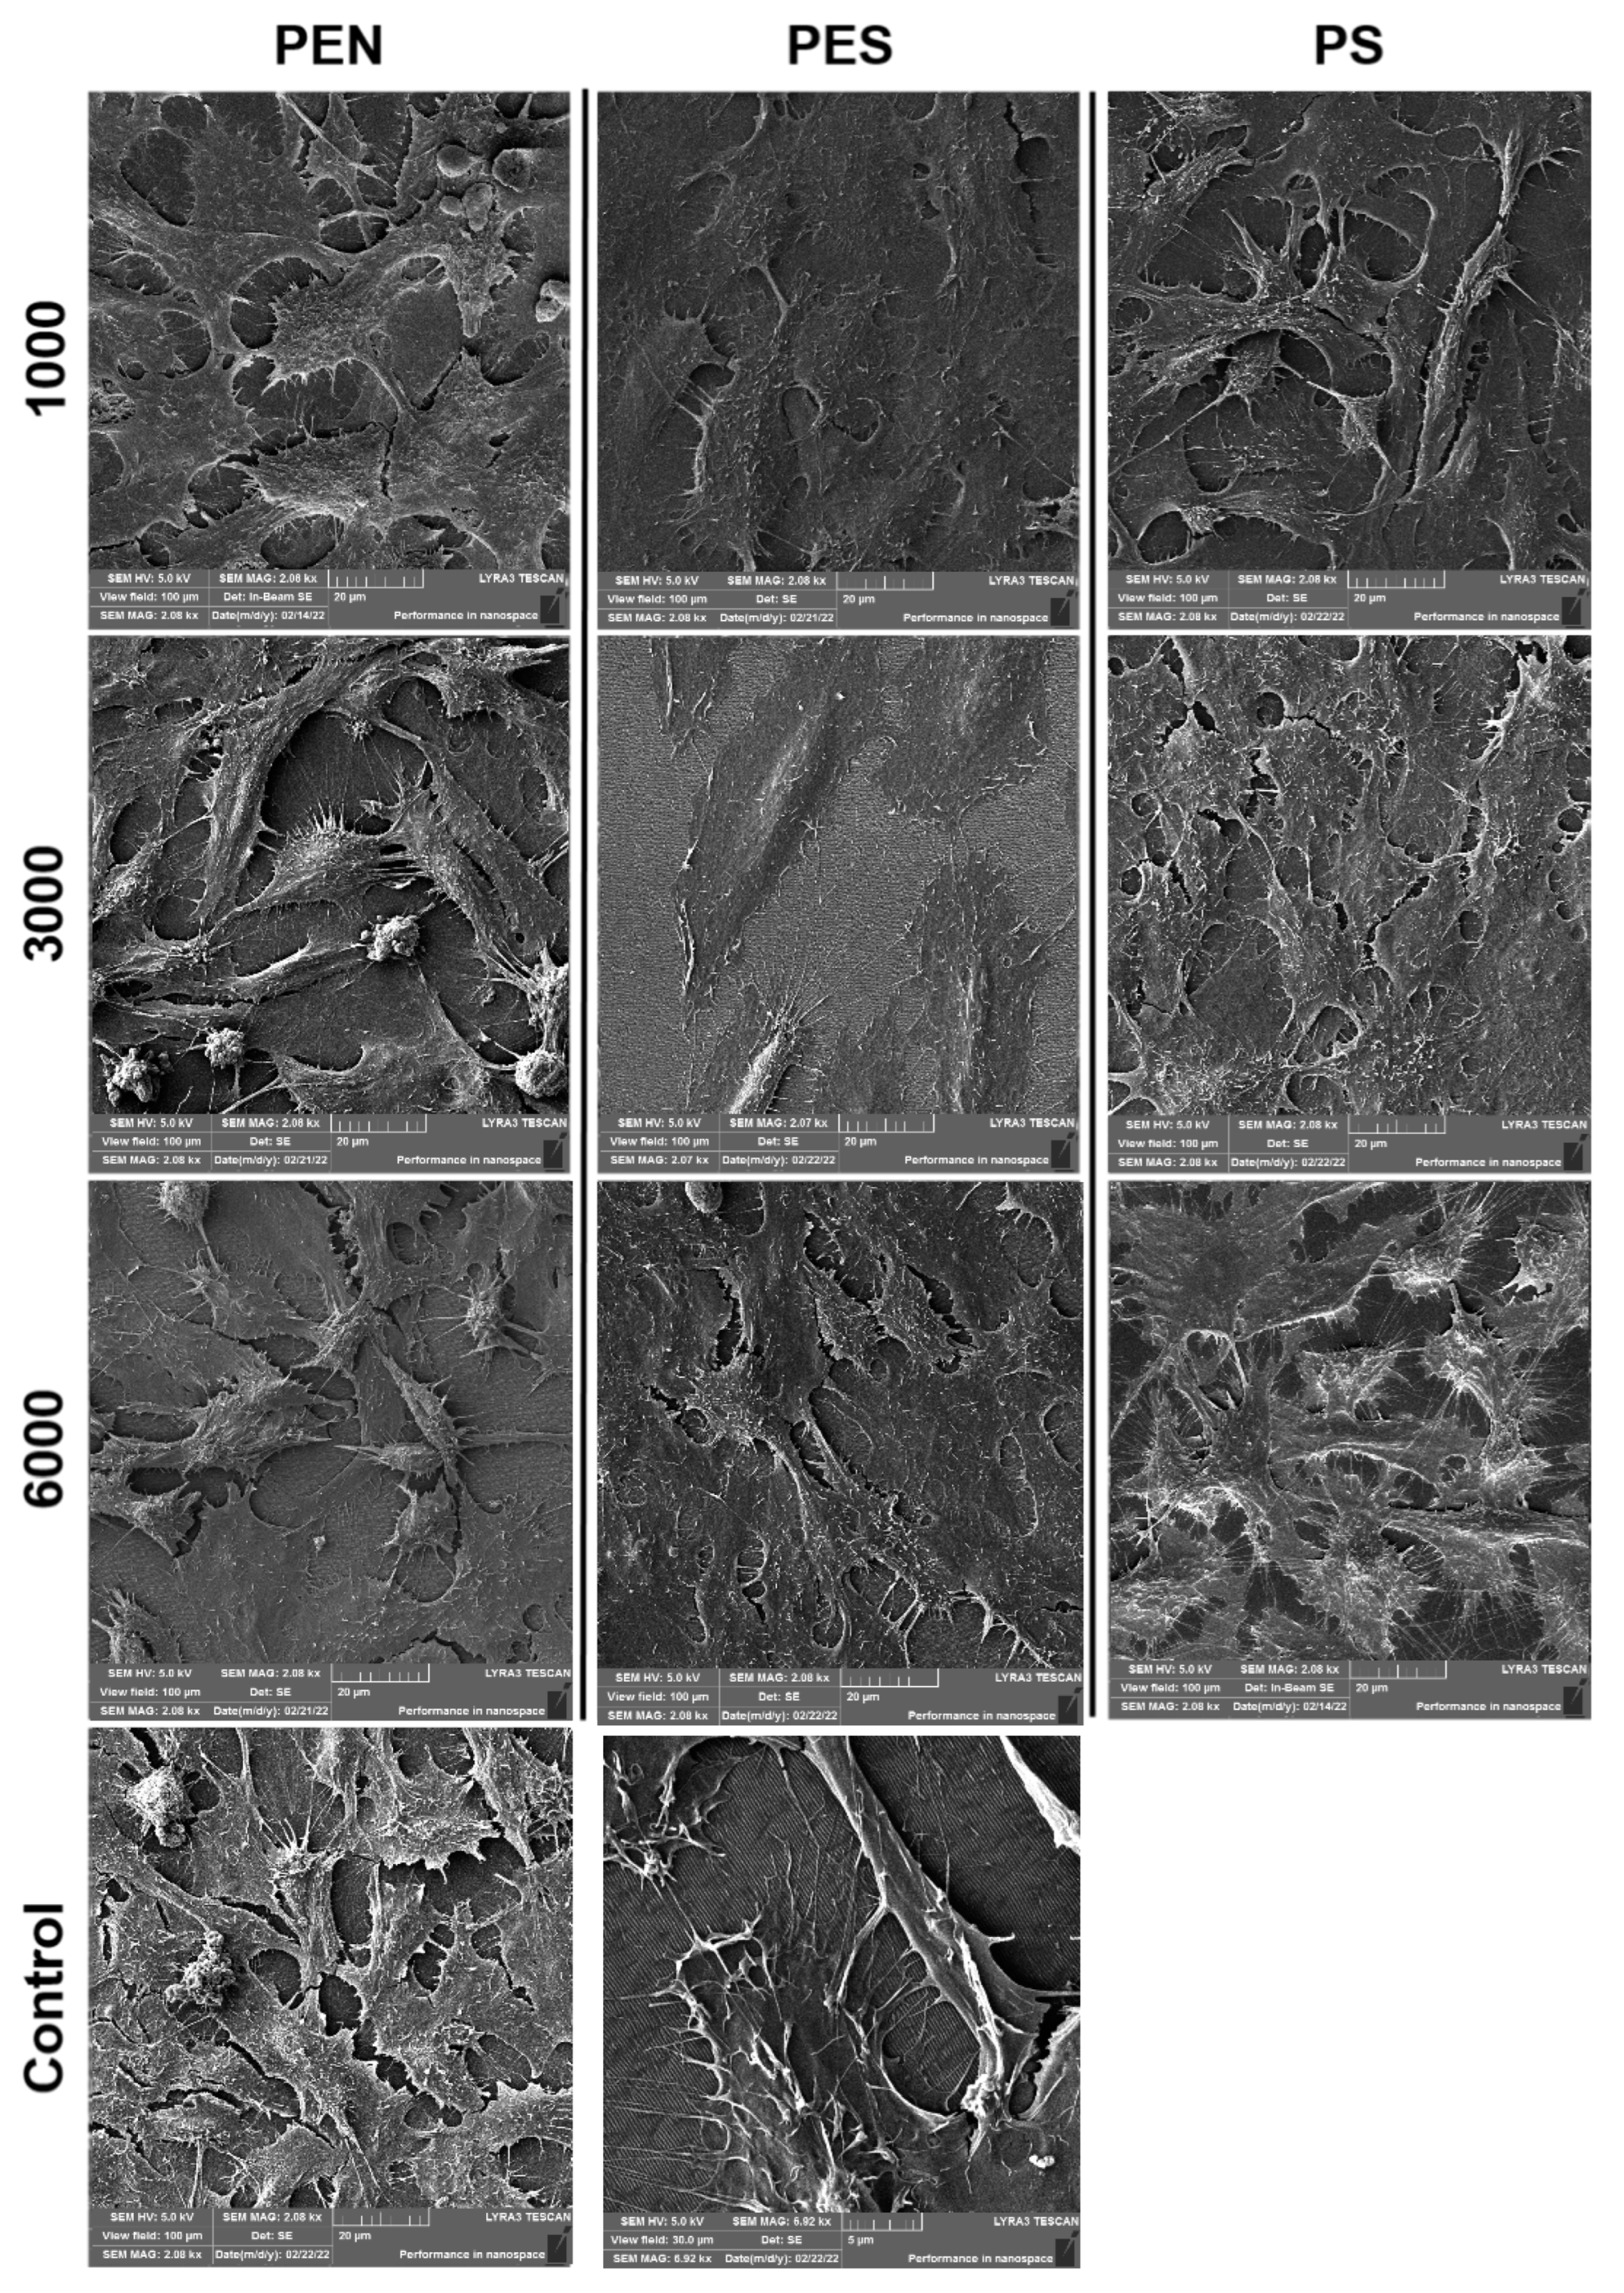
2.1. Scanning Electron Microscopy
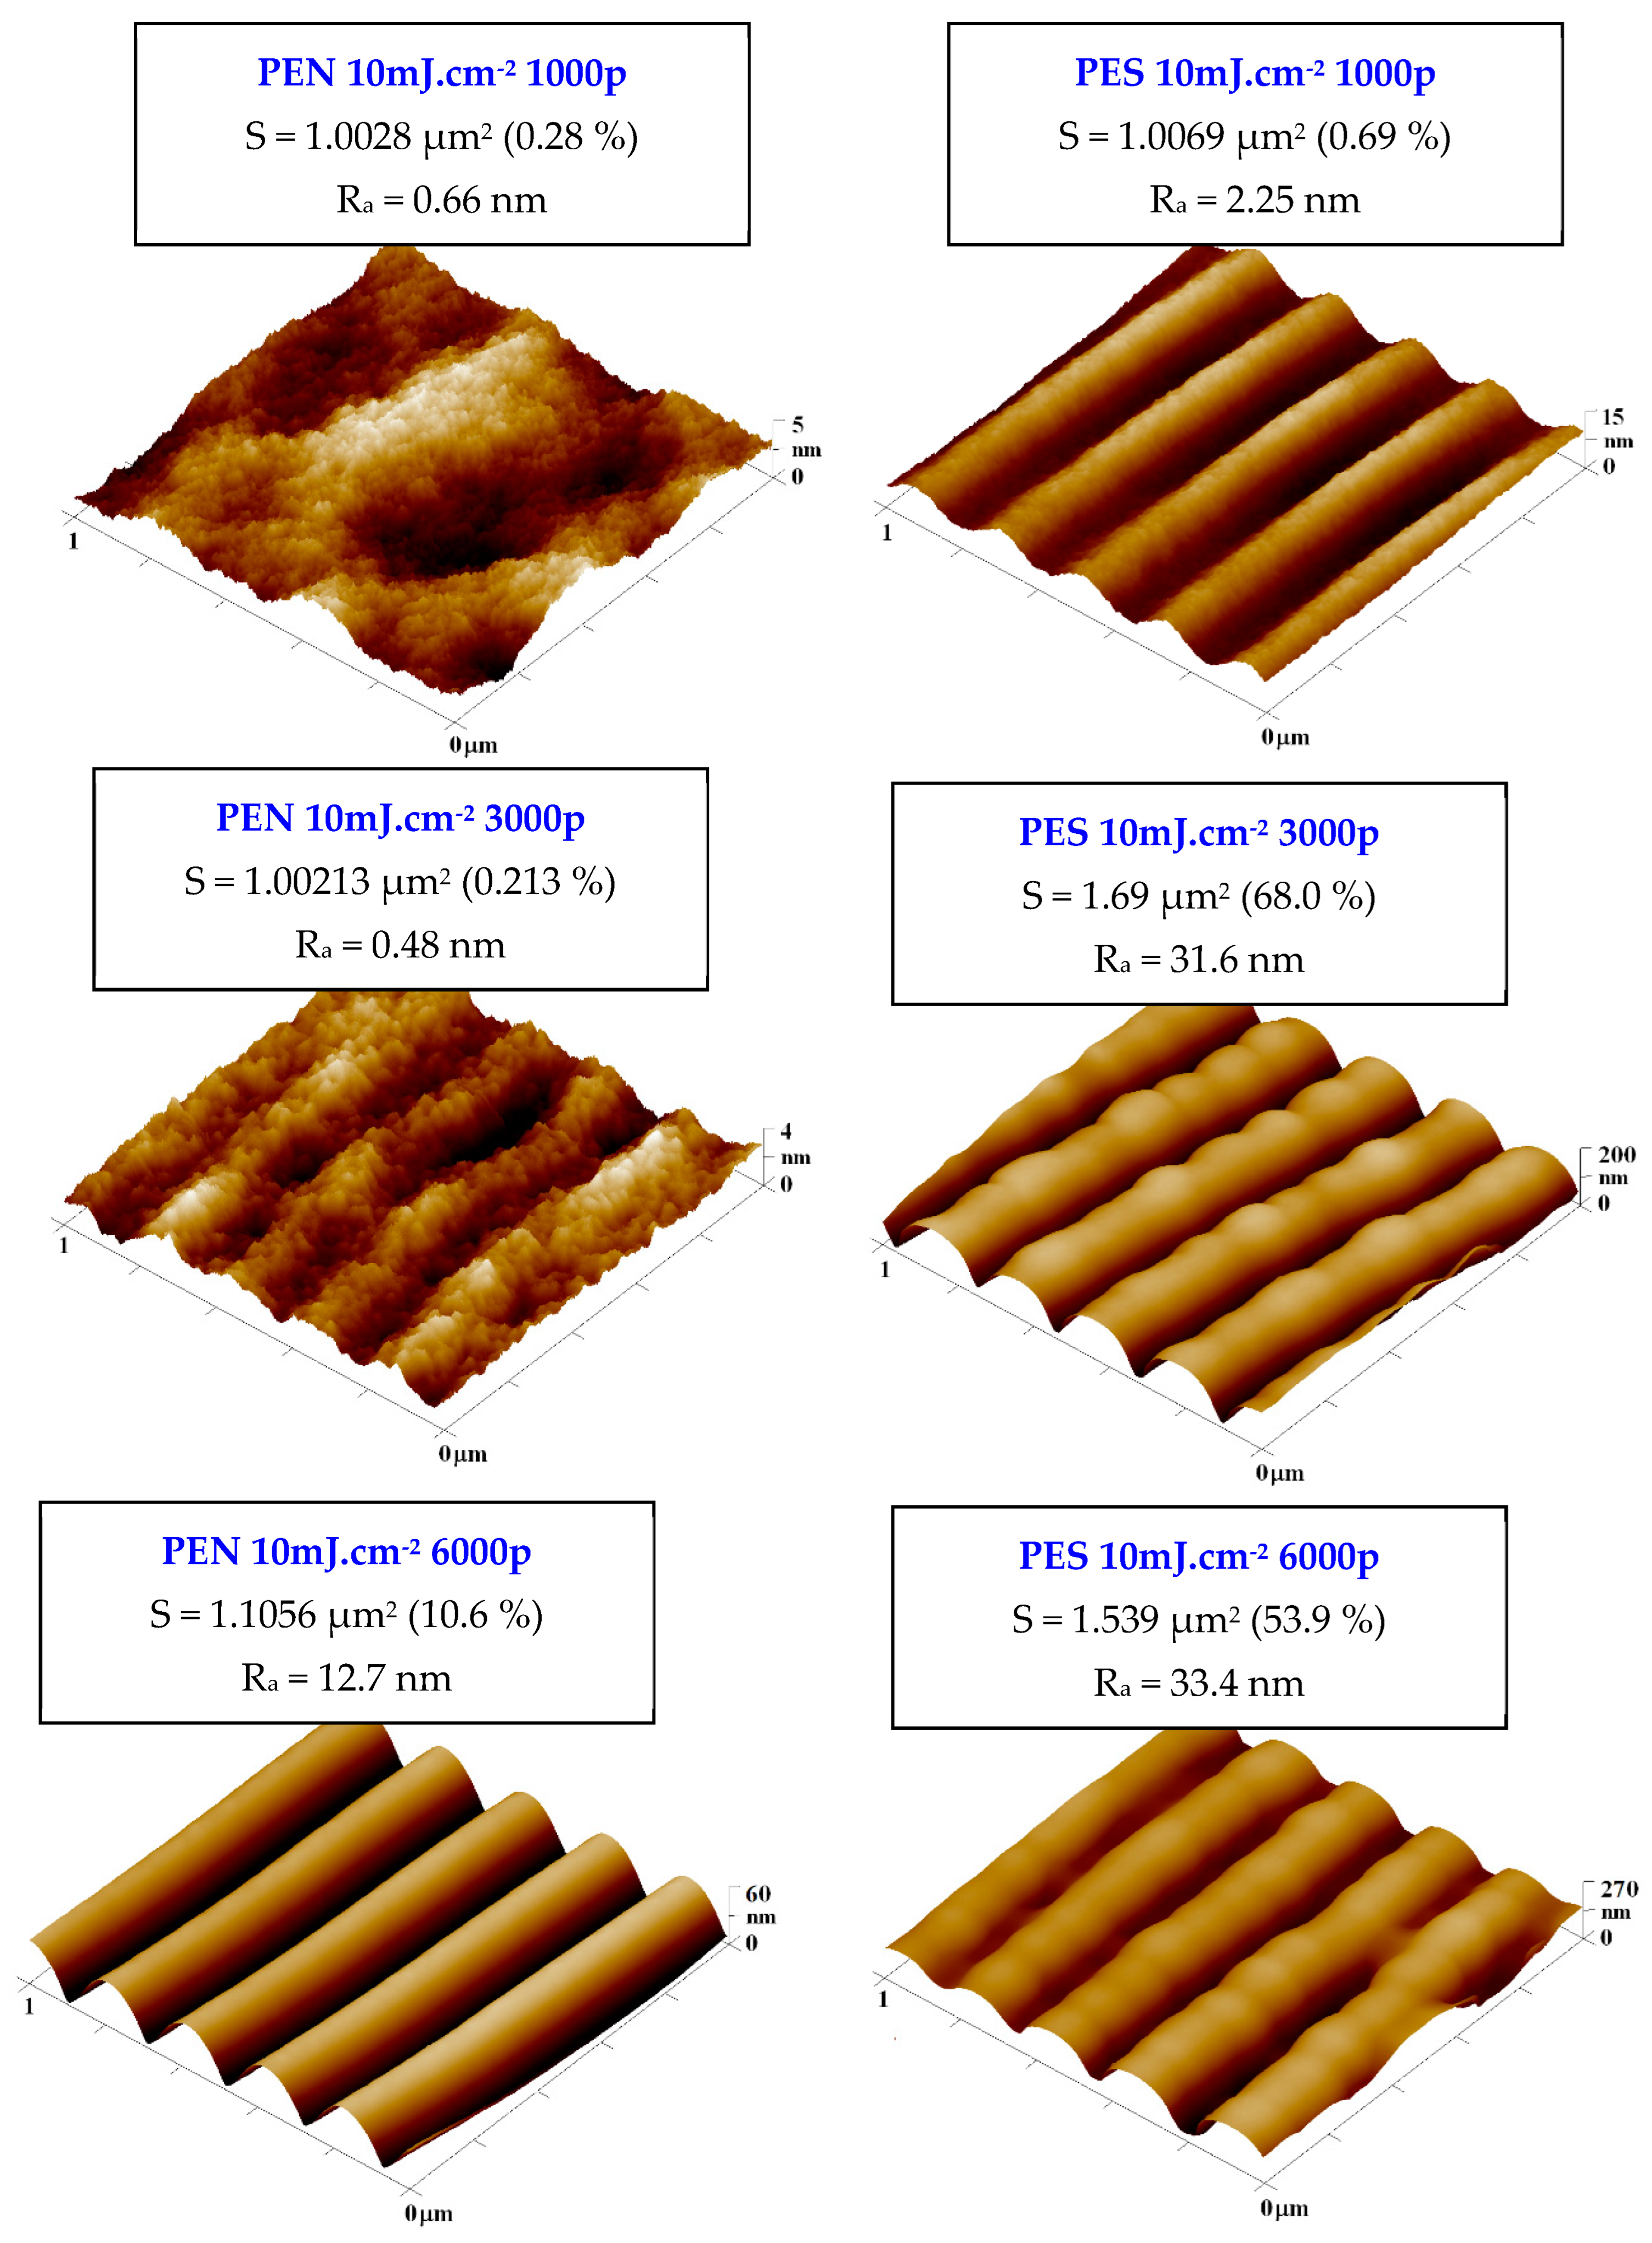
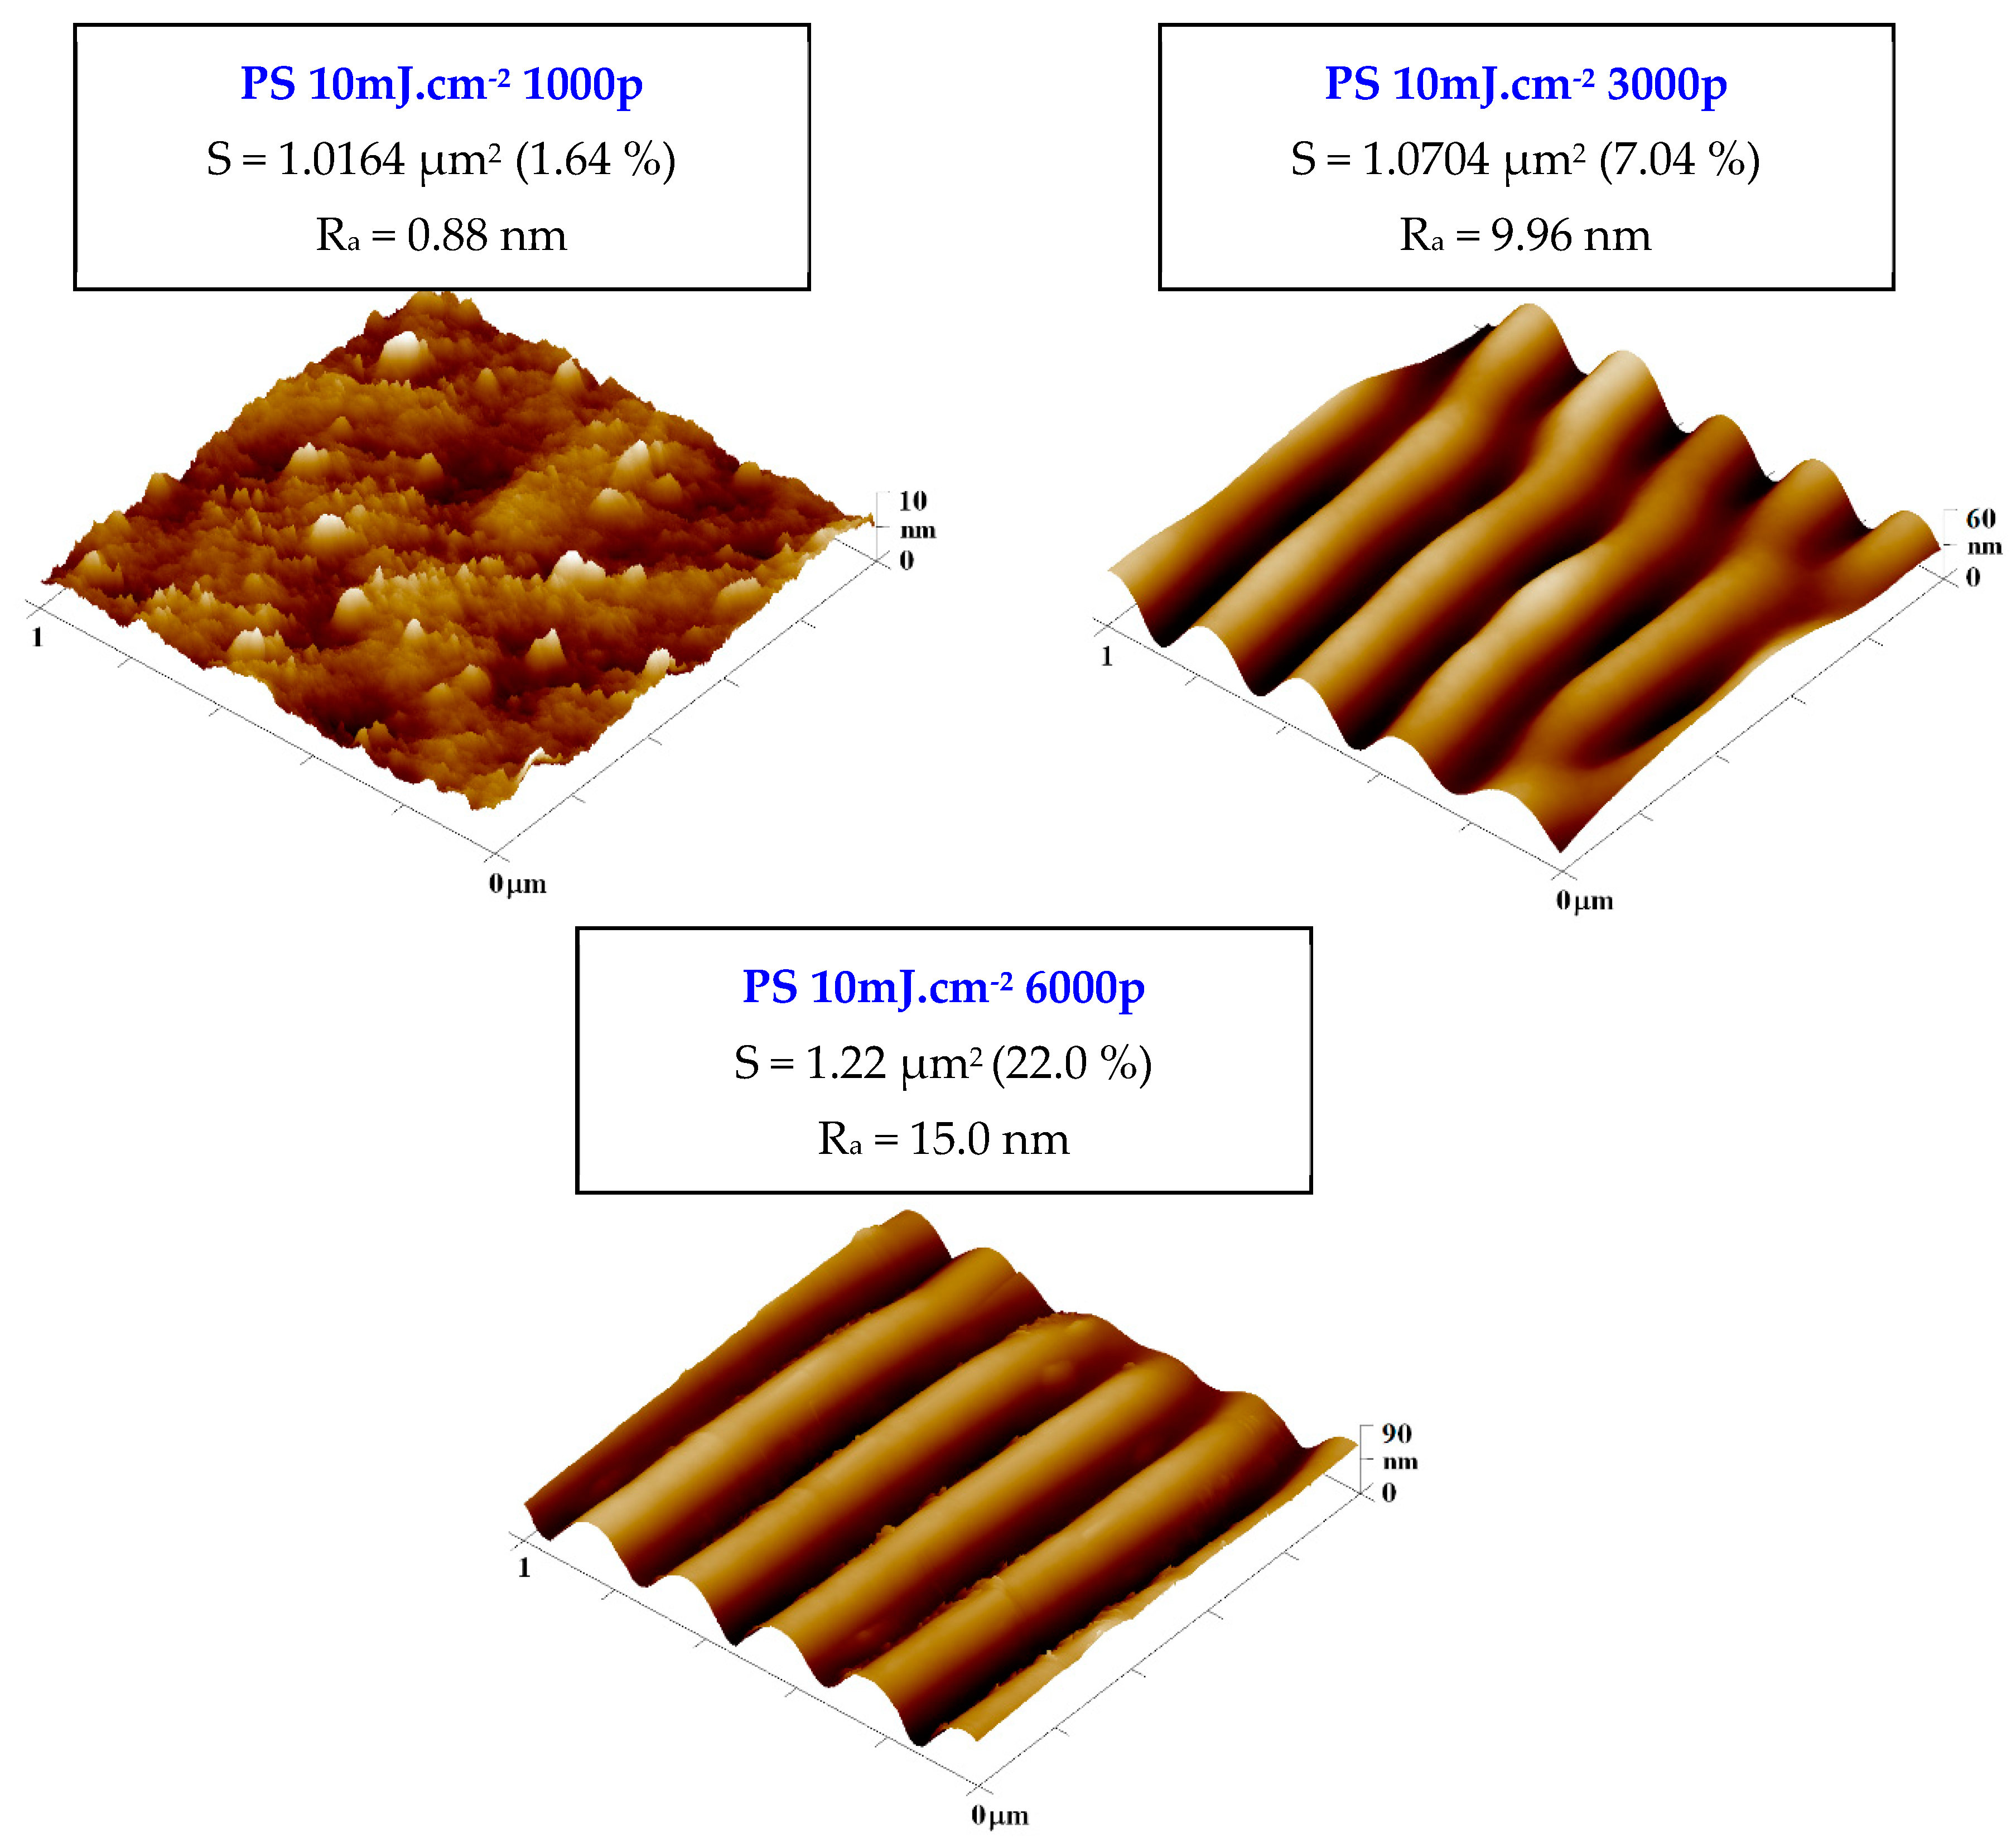
2.2. Atomic Force Microscopy
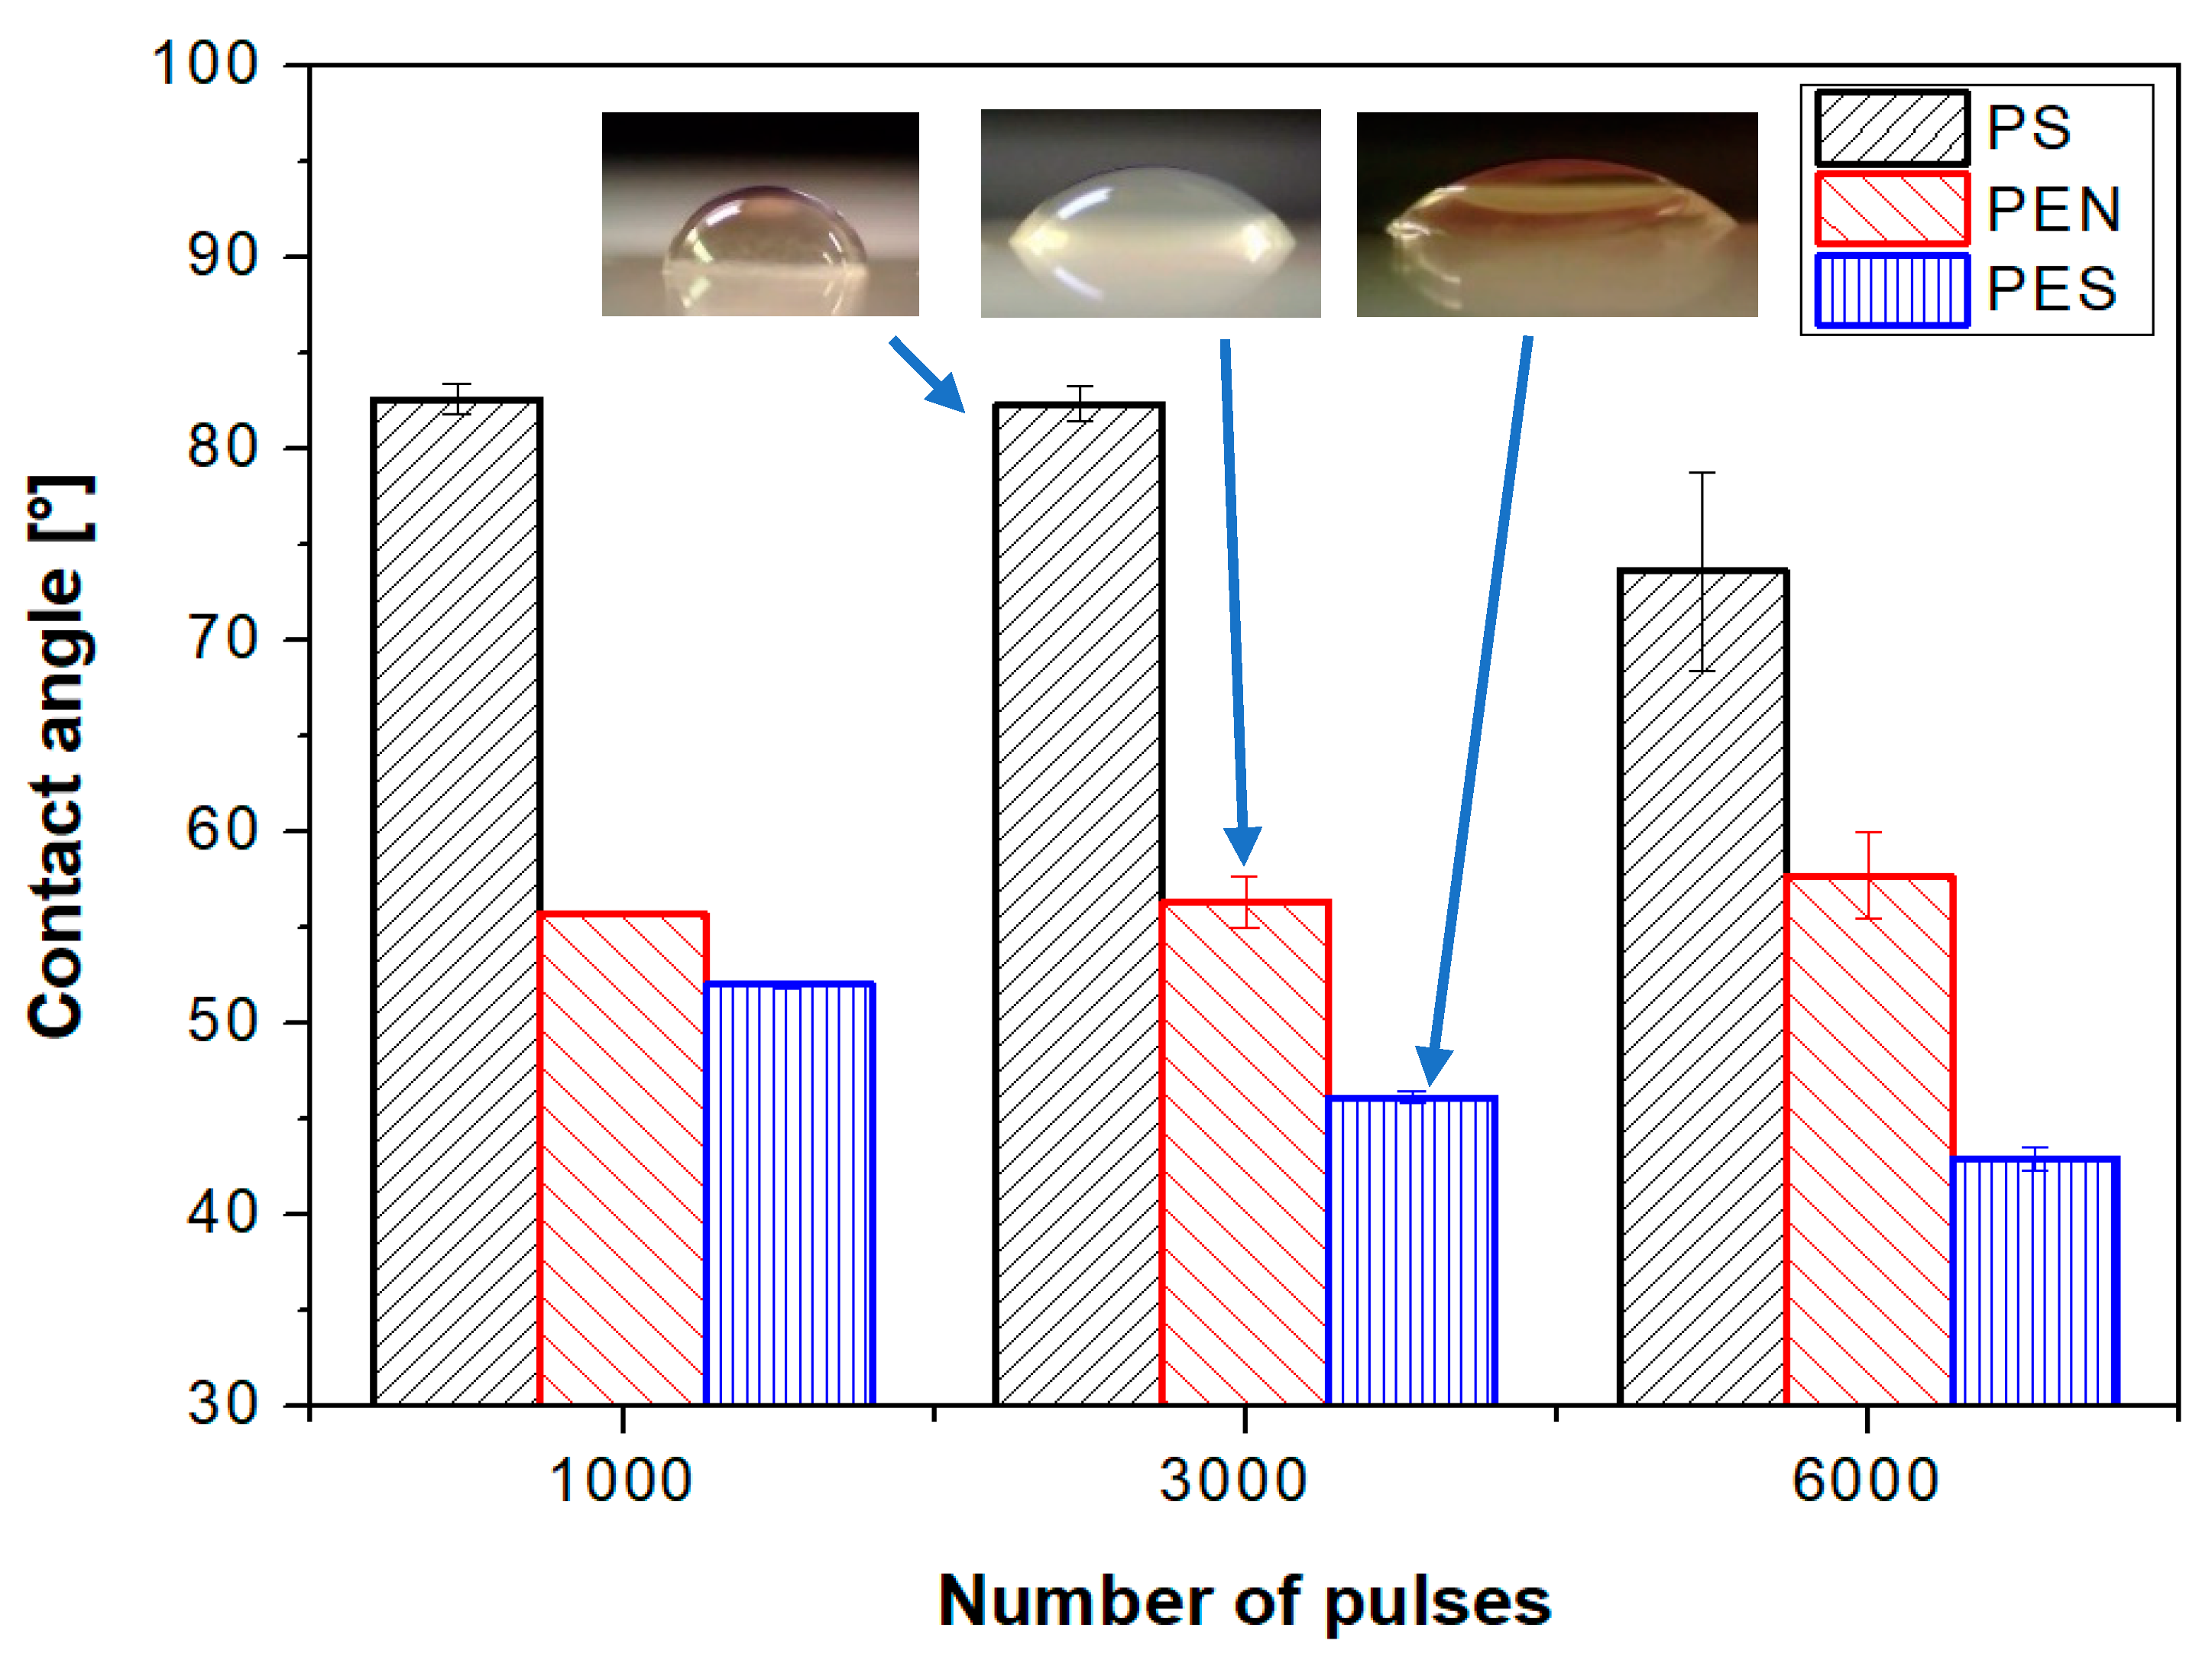
2.3. Wettability
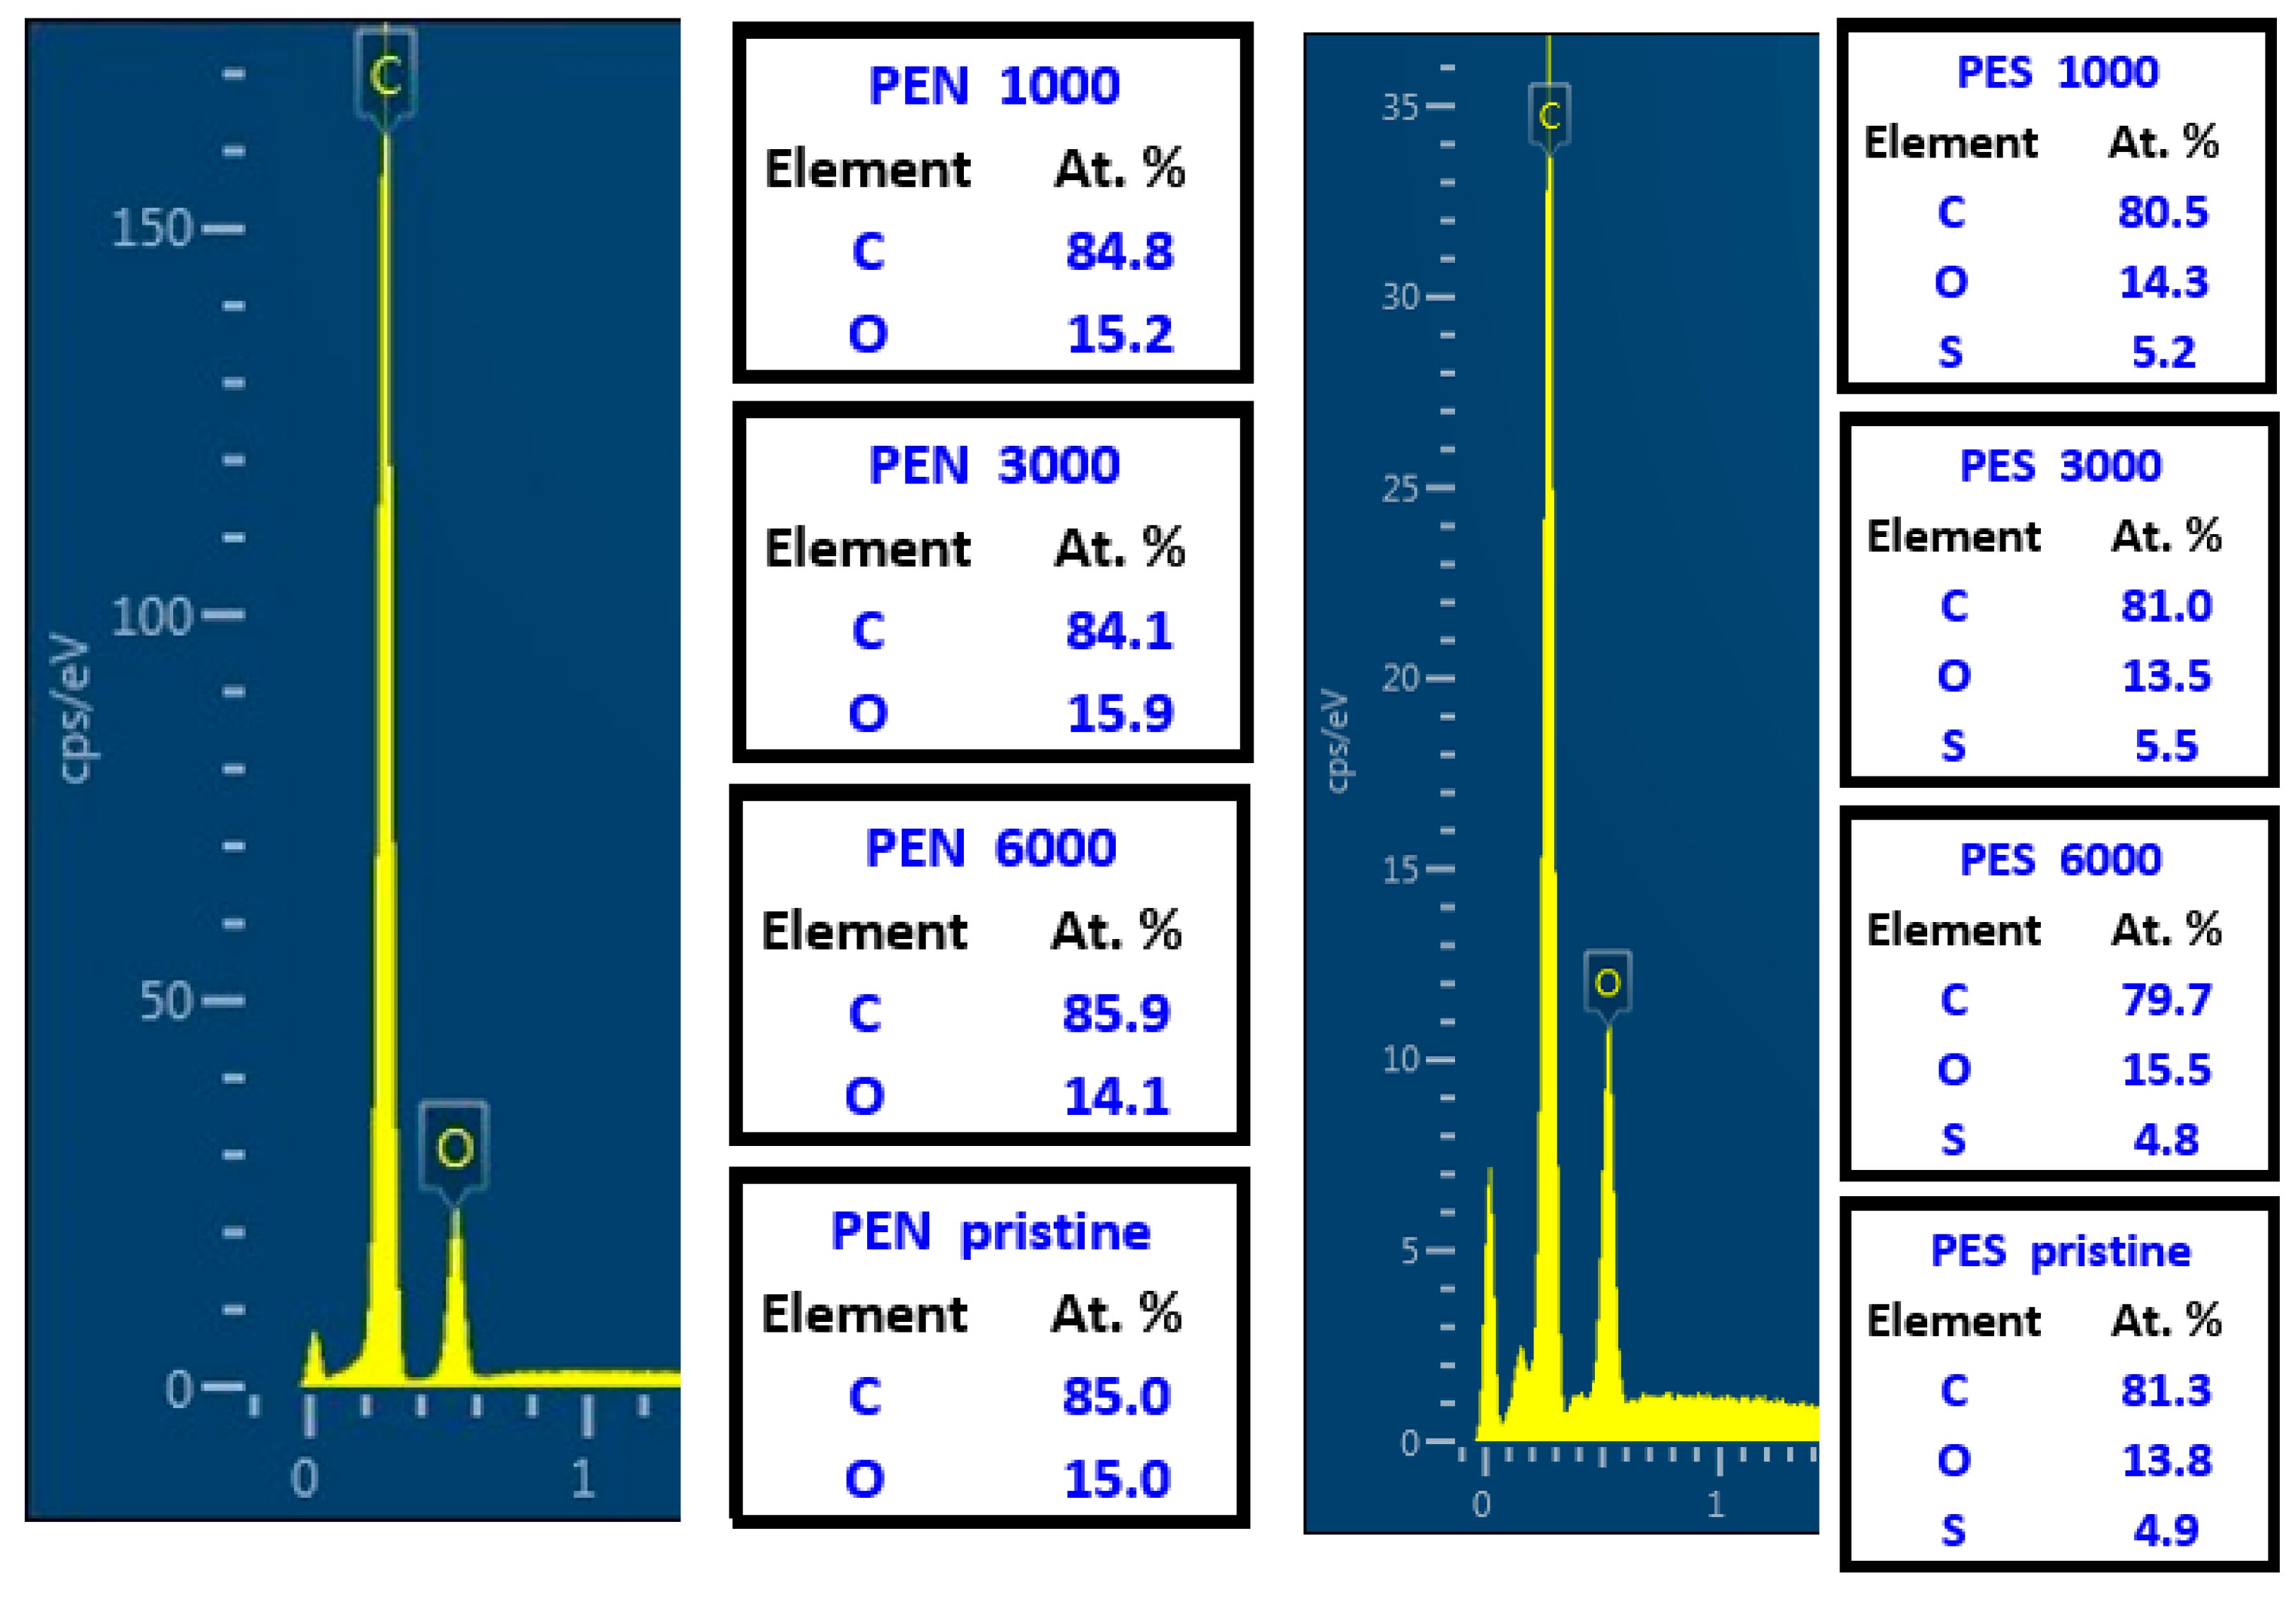
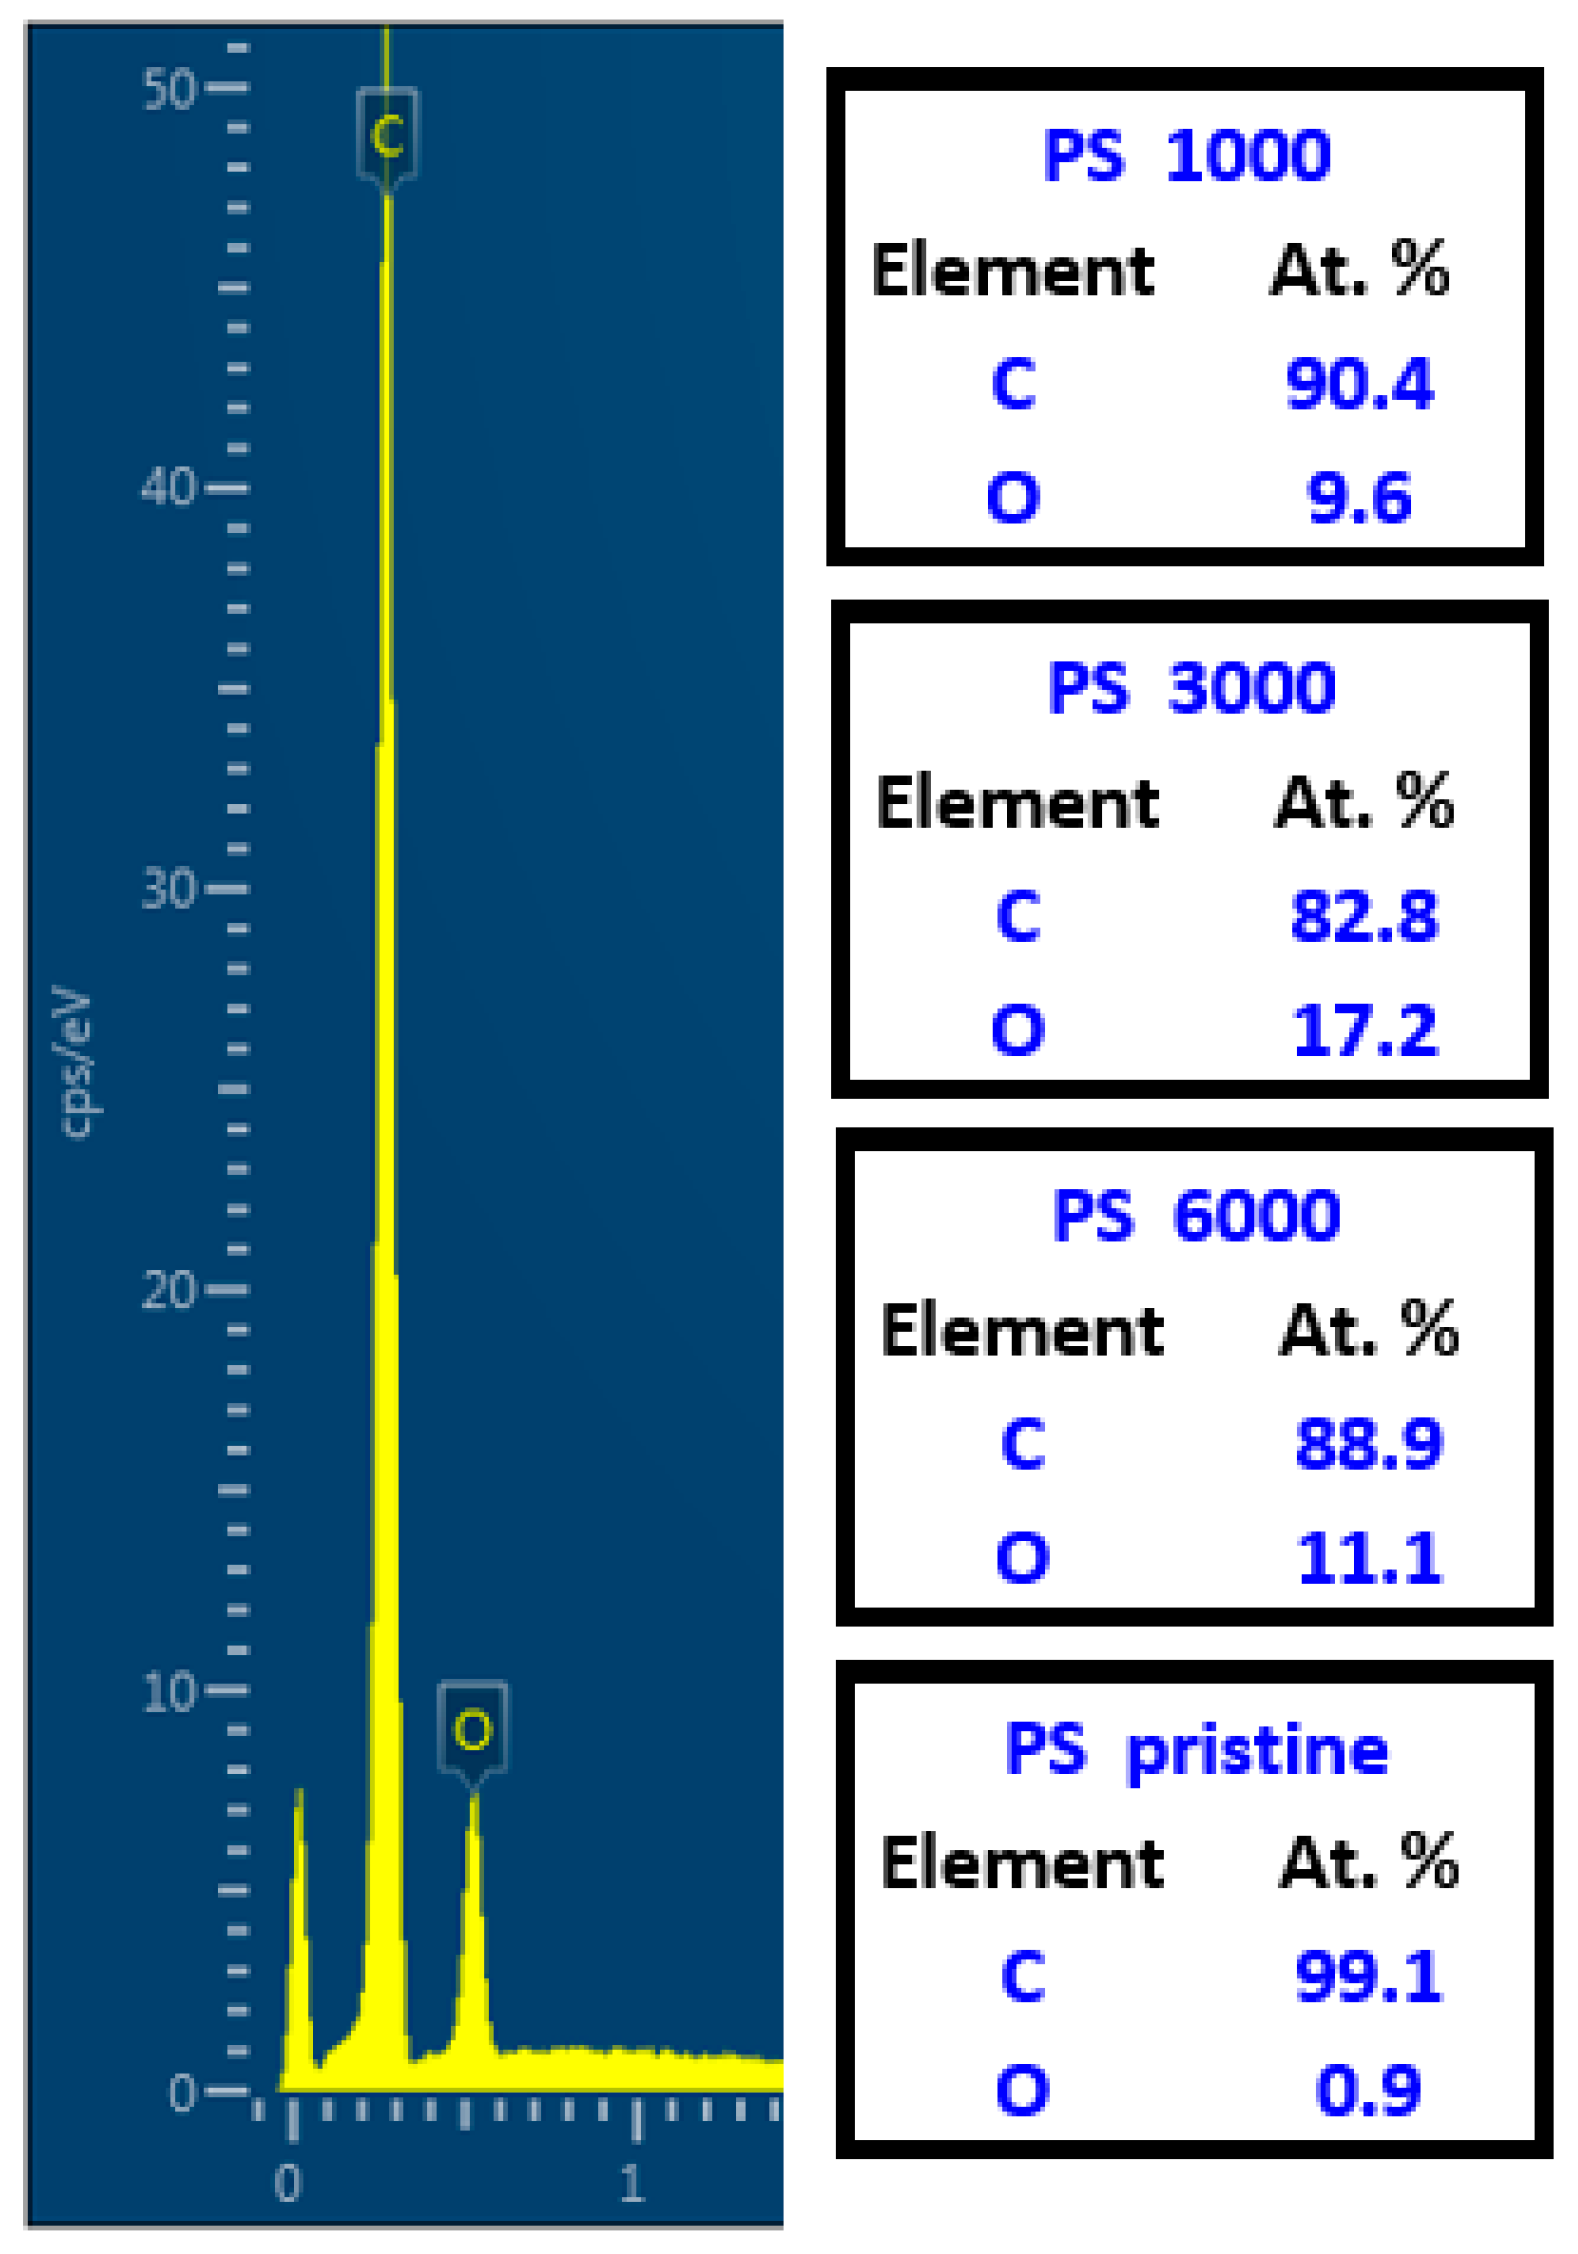
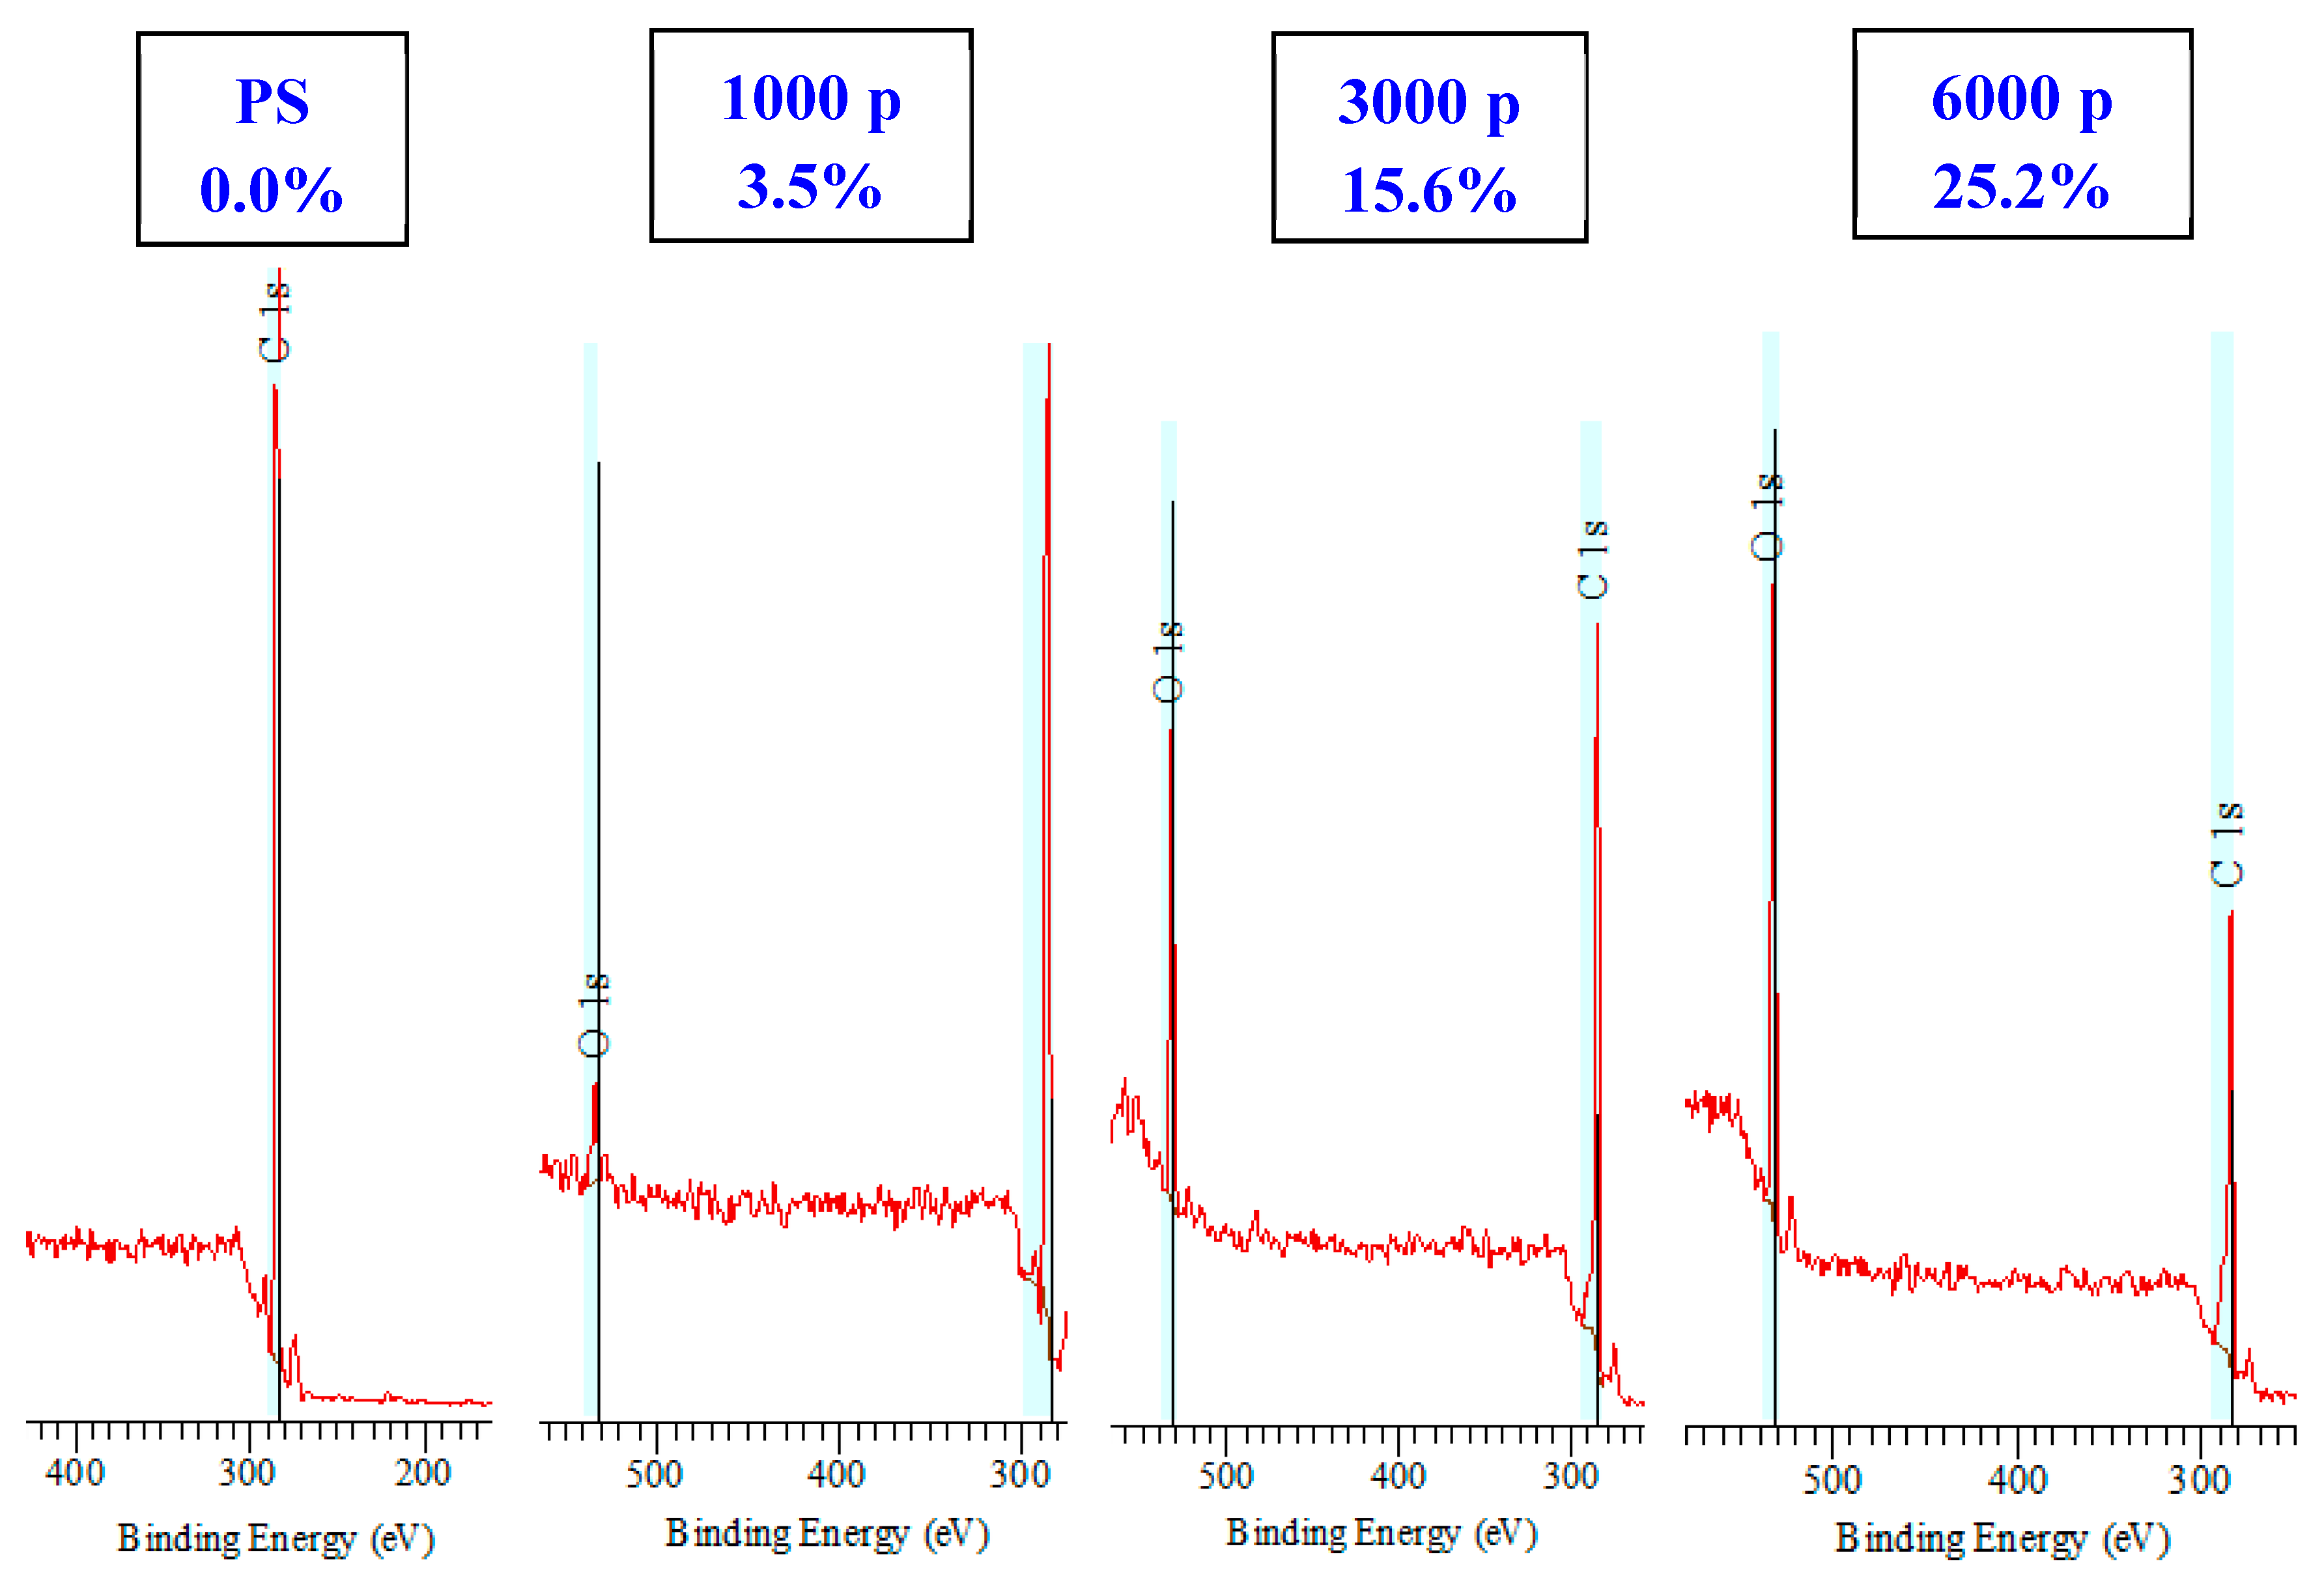
2.4. XPS Analysis
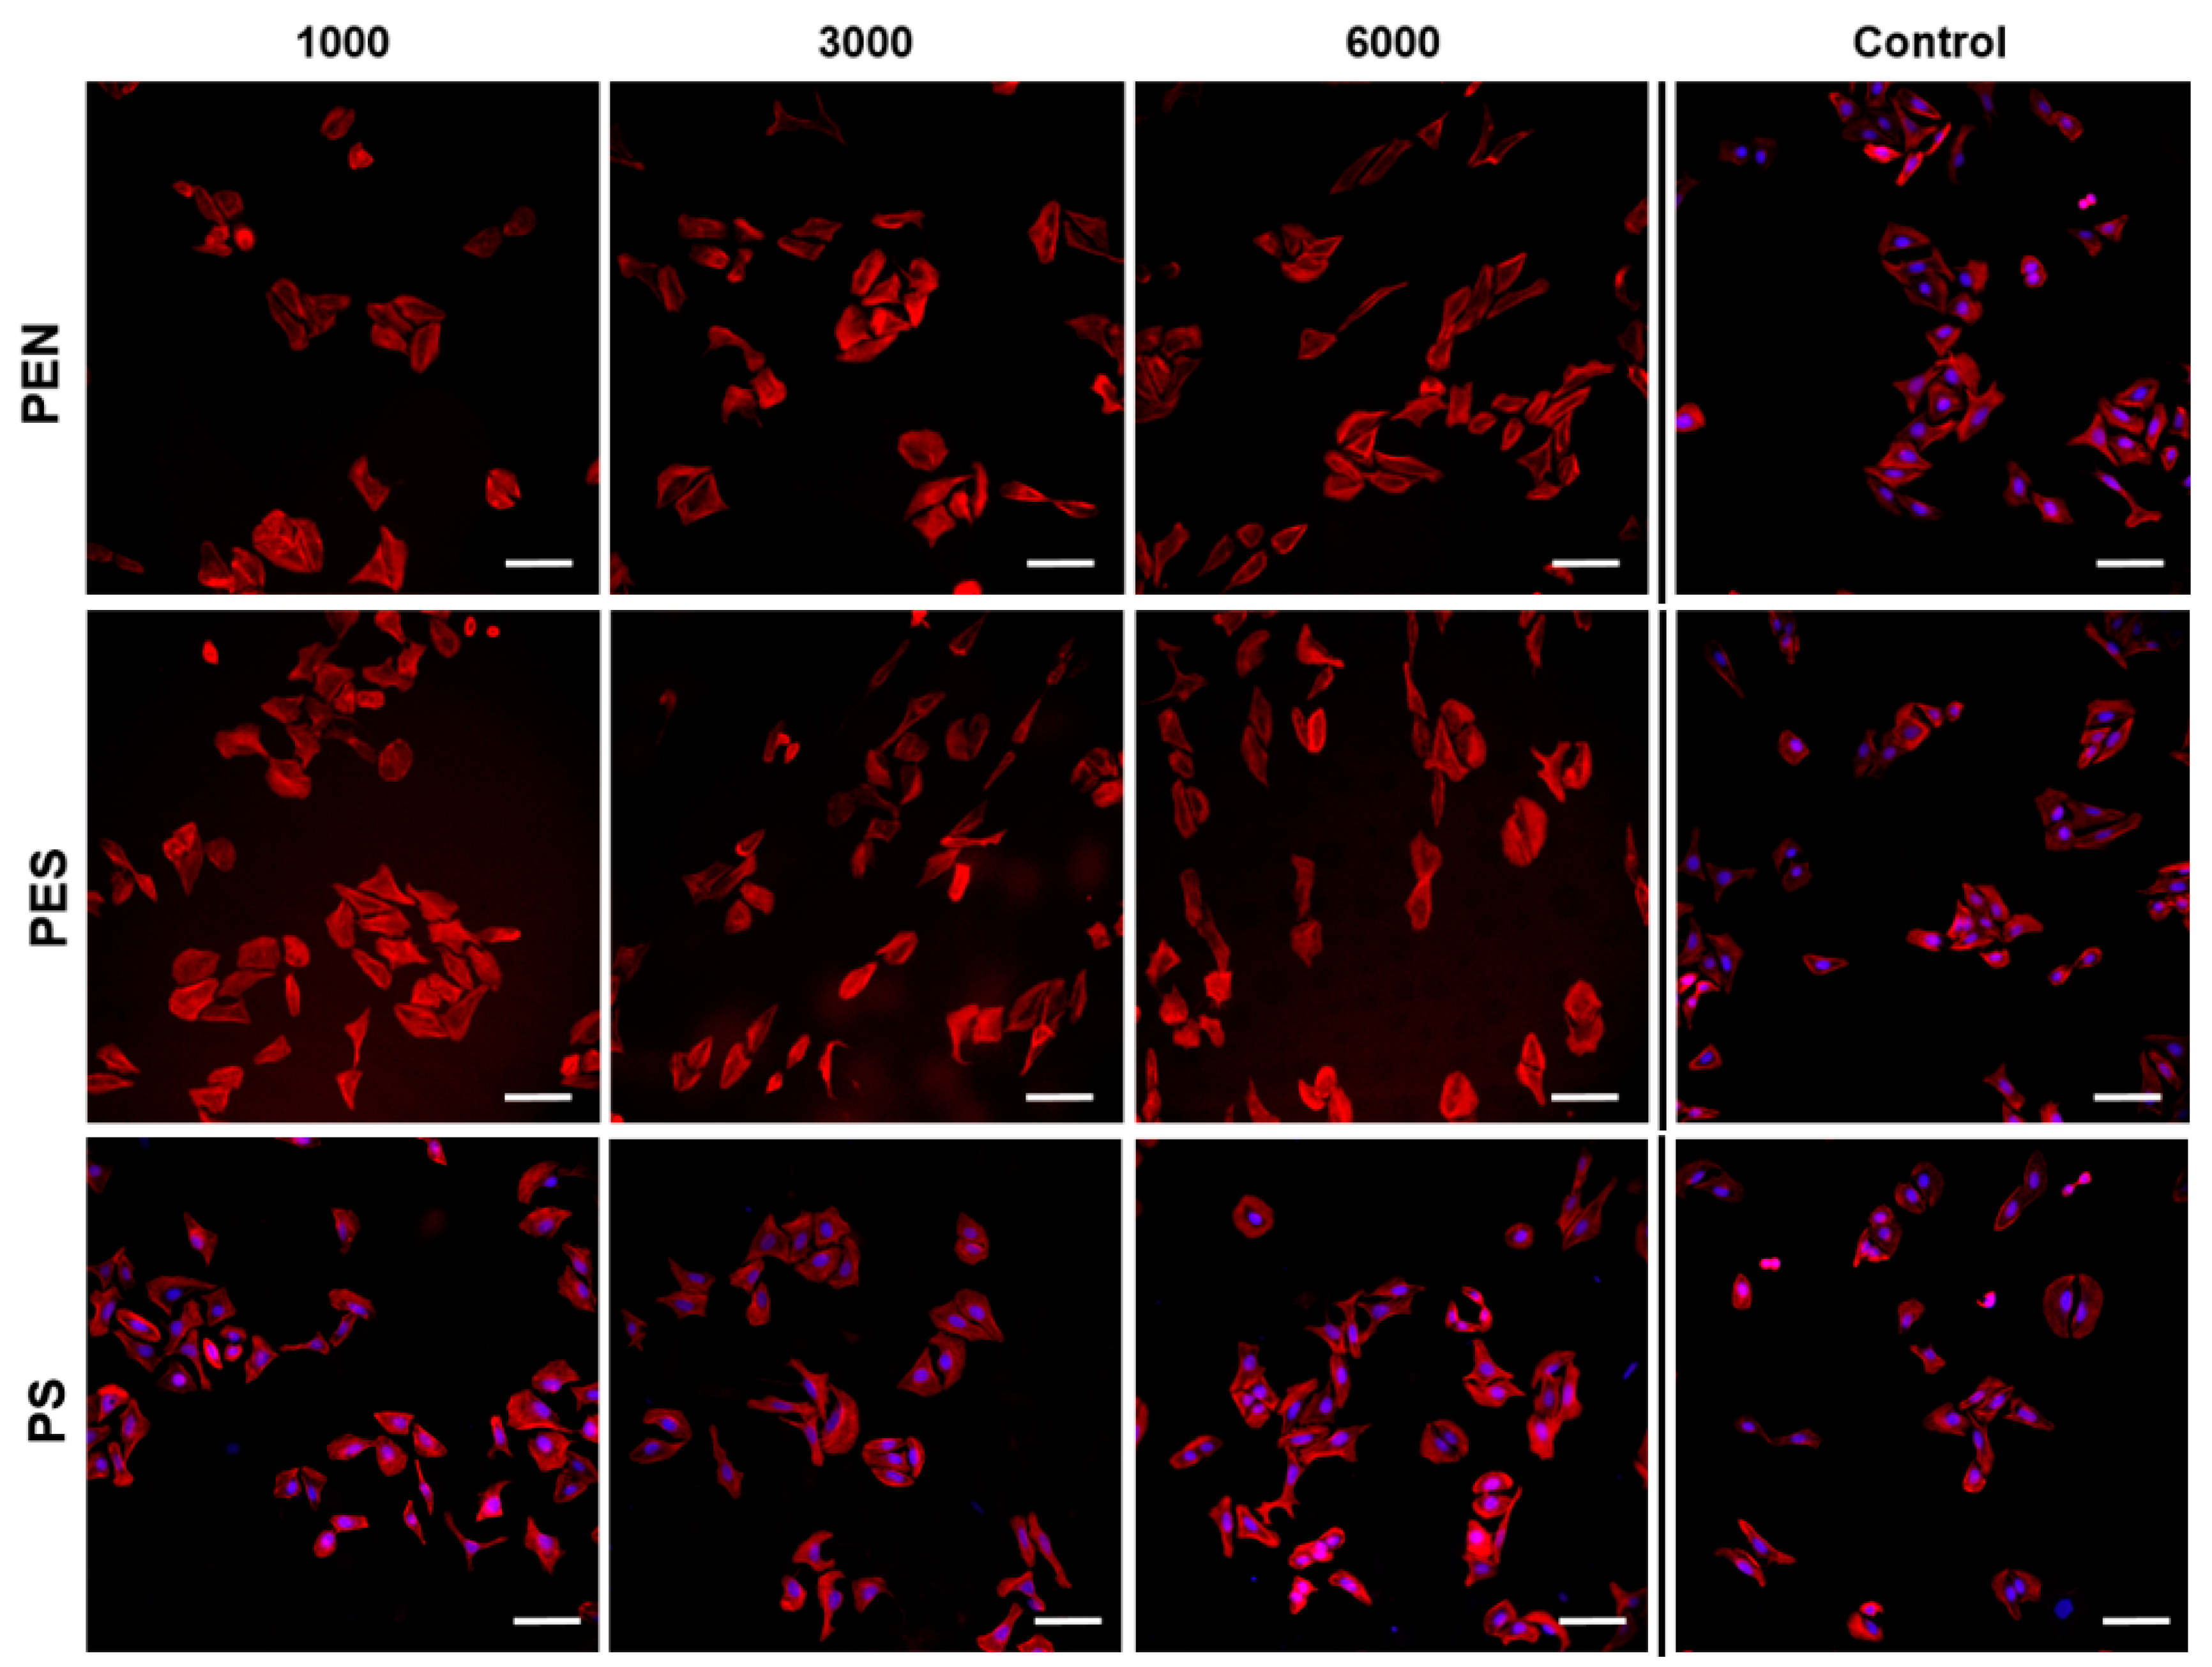
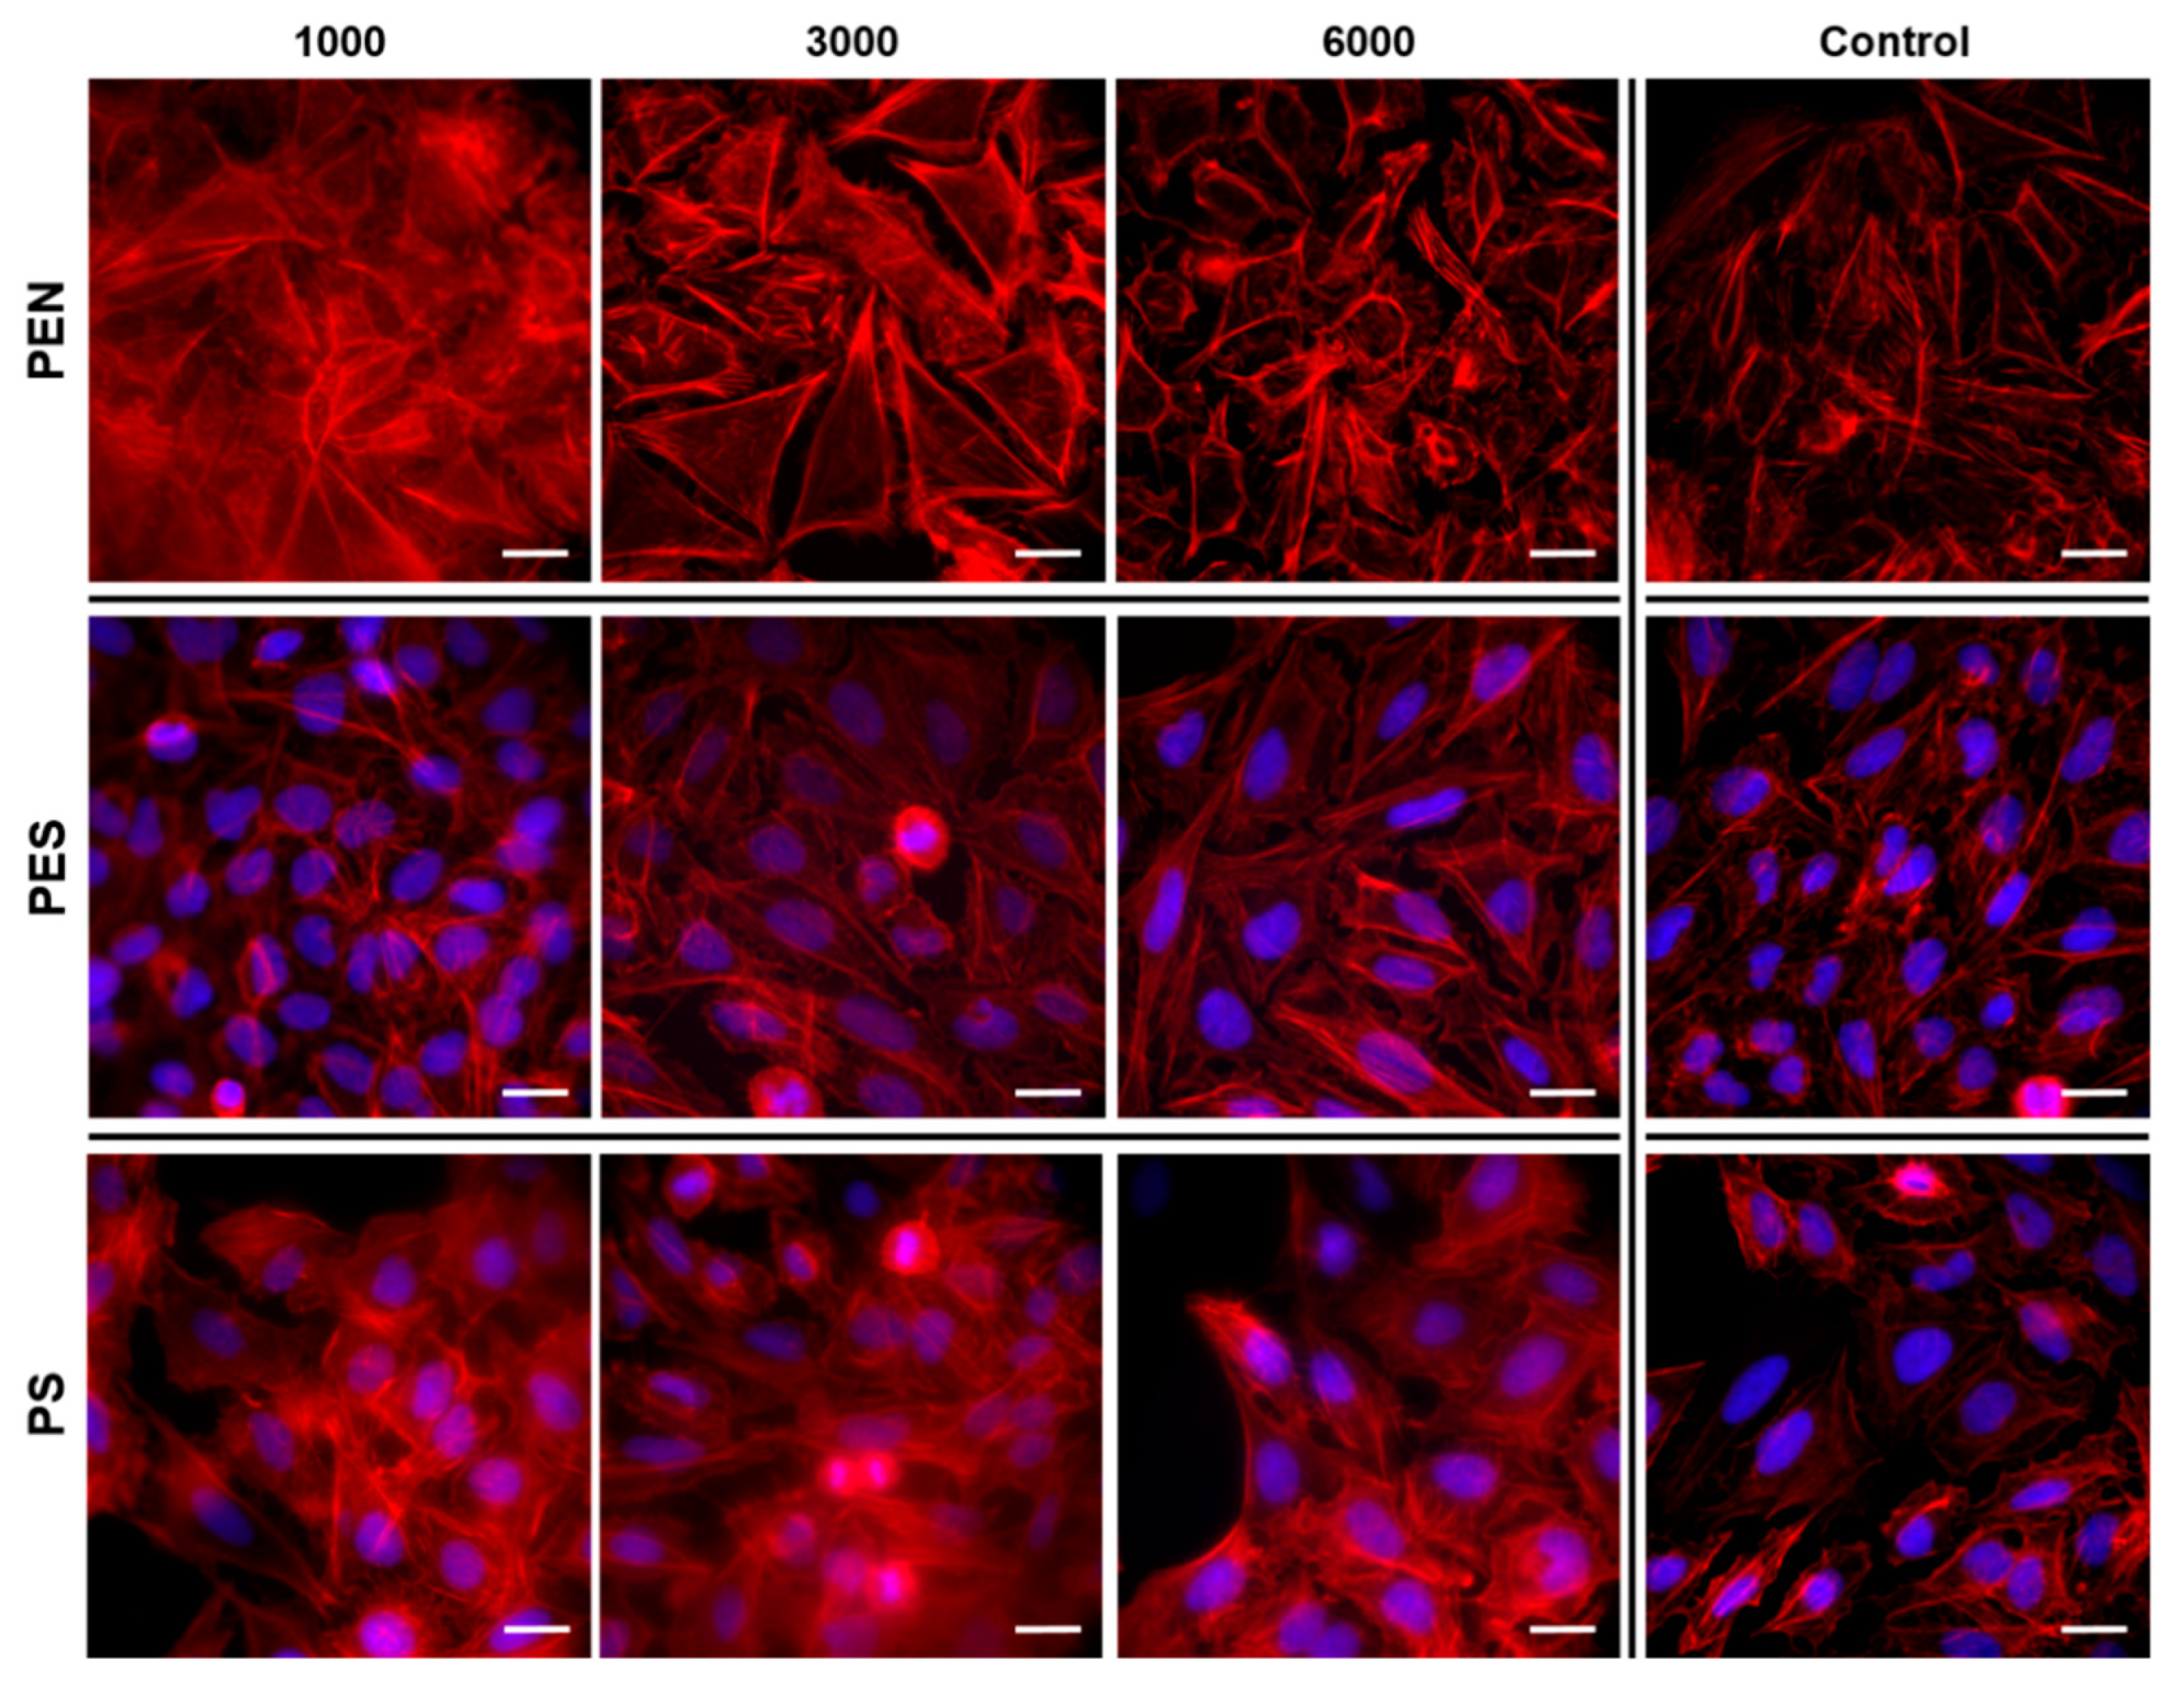
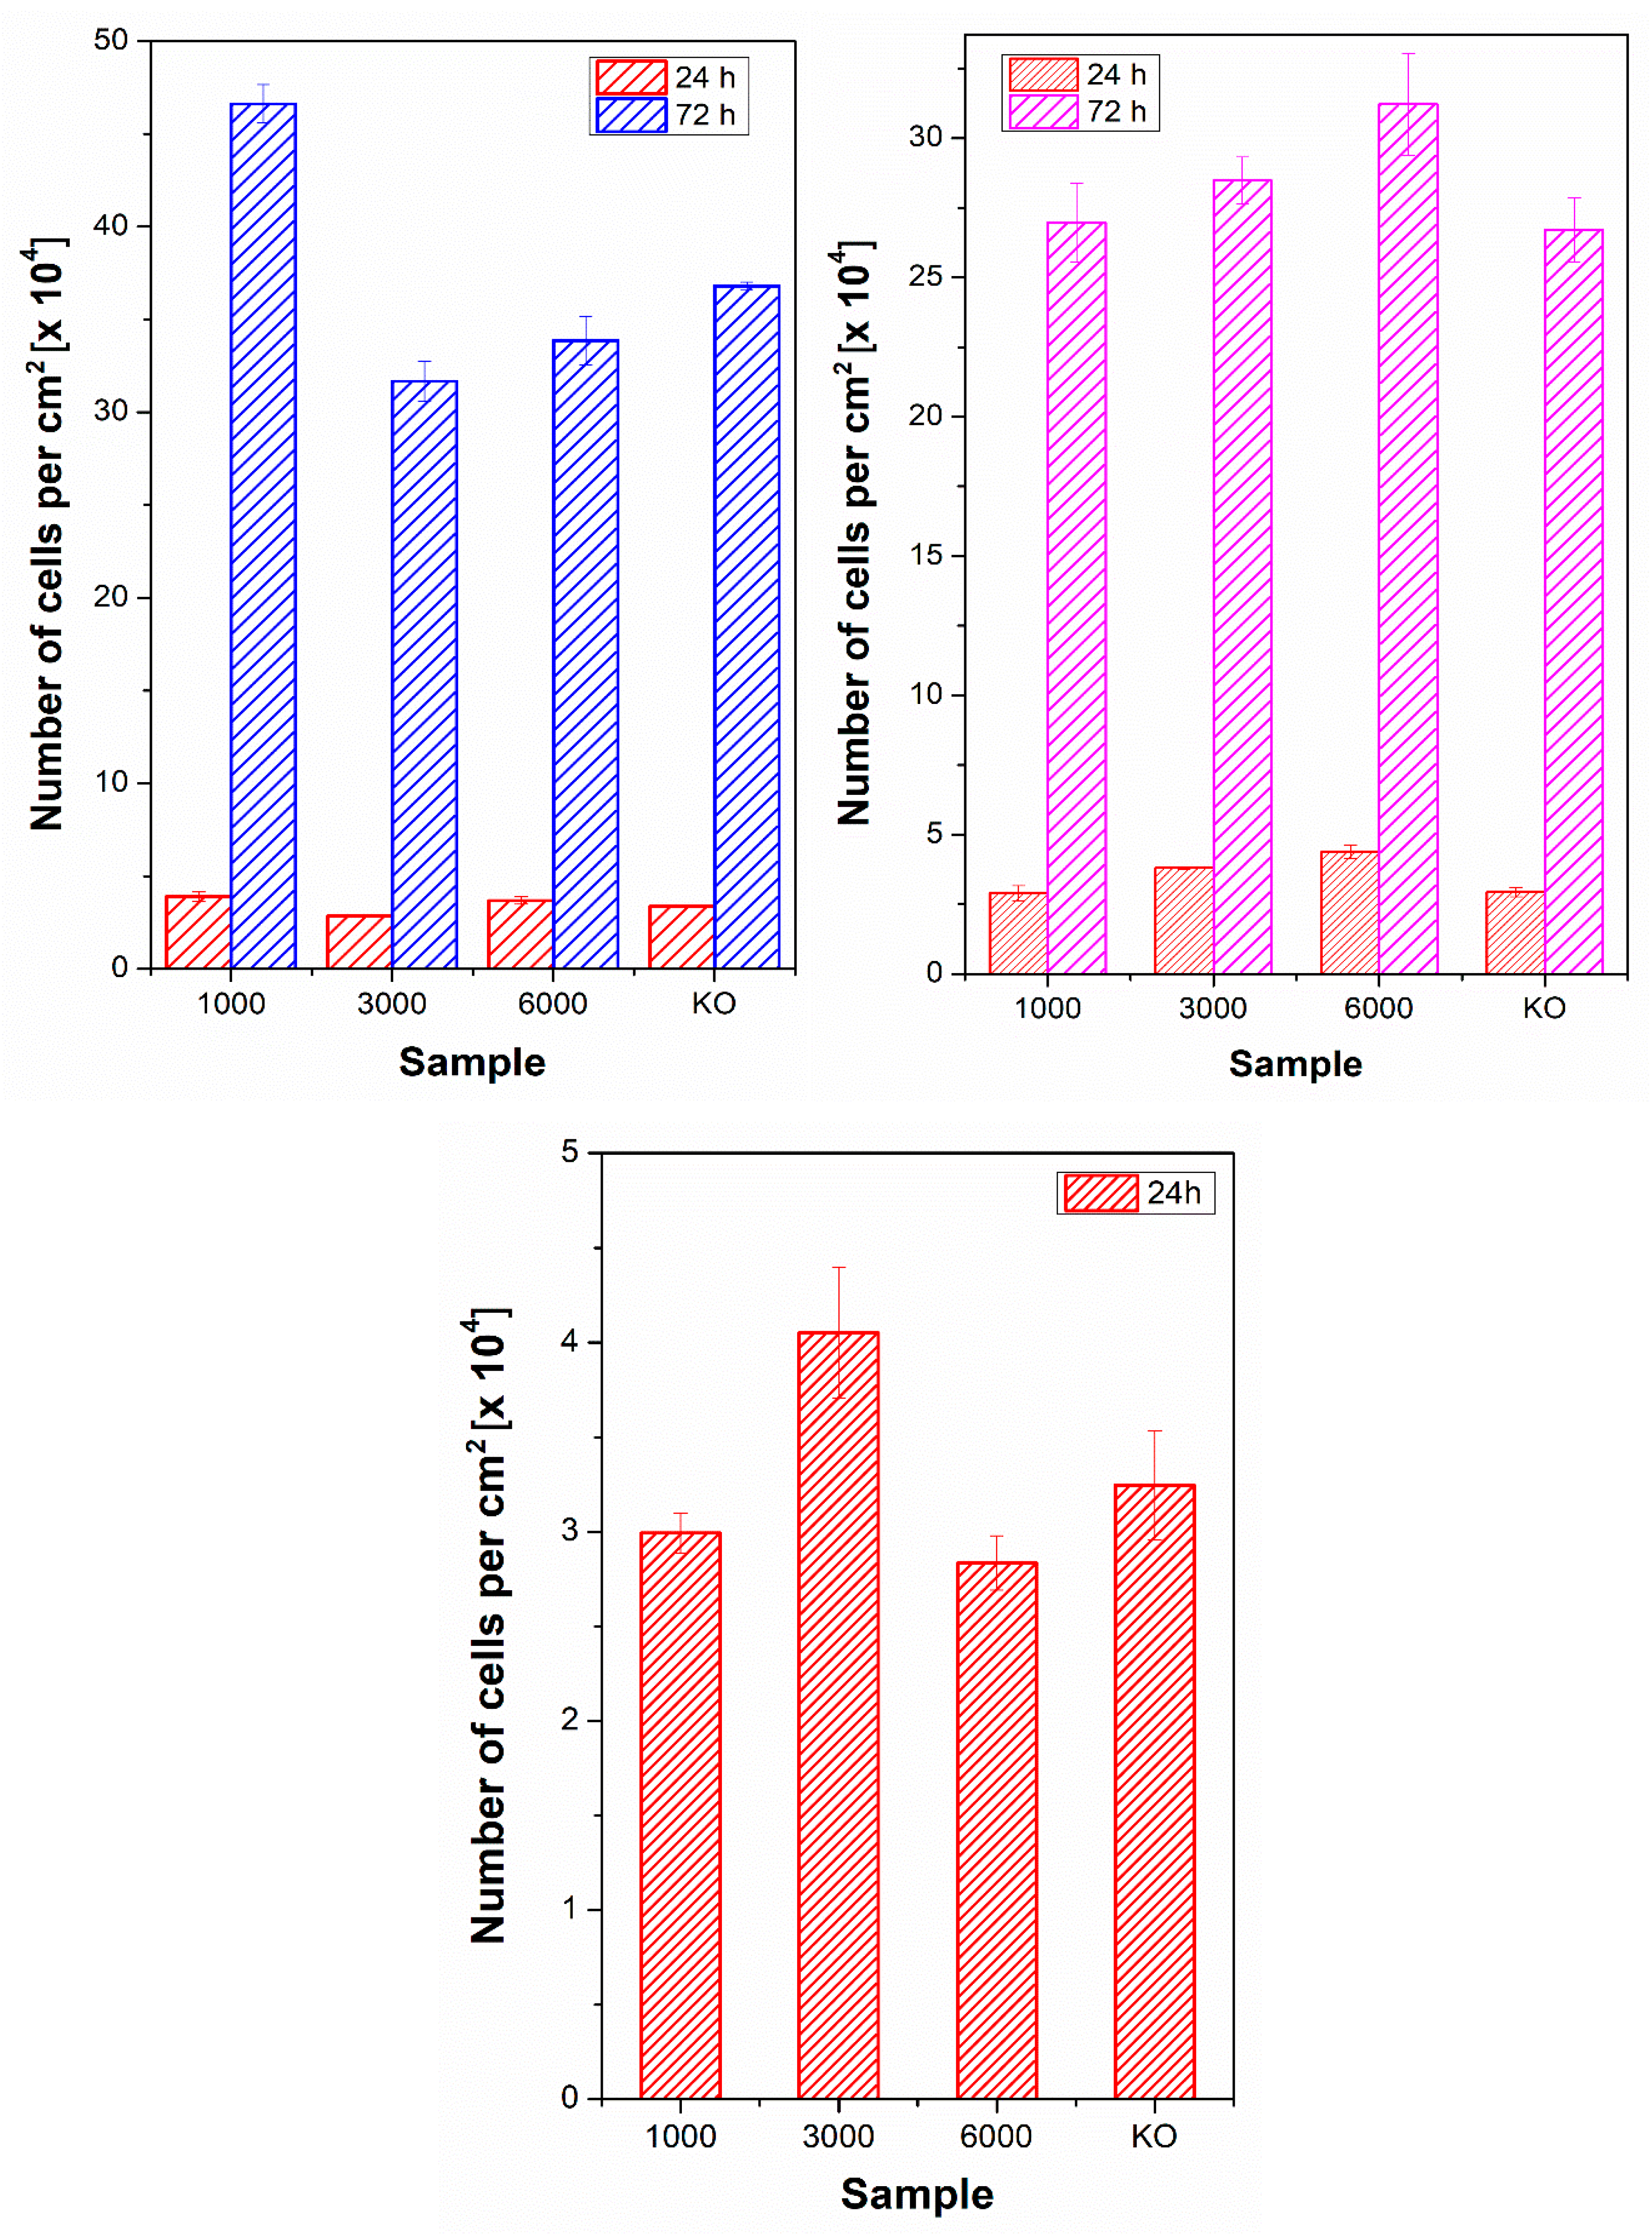
2.5. Cell−Material Interaction
3. Materials and Methods
3.1. Materials and Chemicals
3.2. Exposure of Substrates
3.3. Characterization of Substrates
3.4. Cell Cultivation
3.5. Sample Preparation for Fluorescence Microscopy
3.6. Fluorescence Microscopy
4. Conclusions
Supplementary Materials
Author Contributions
Funding
Data Availability Statement
Conflicts of Interest
References
- Ruiz, A.; Zychowicz, M.; Ceriotti, L.; Mehn, D.; Sirghi, L.; Rauscher, H.; Mannelli, I.; Colpo, P.; Buzanska, L.; Rossi, F. Microcontact printing and micro spotting as methods for direct protein patterning on plasma deposited polyethylene oxide: Application to stem cell patterning. Biomed. Microdevices 2013, 15, 495–507. [Google Scholar] [CrossRef] [PubMed]
- Priest, D.G.; Tanaka, N.; Tanaka, Y.; Taniguch, Y. Micro-patterned agarose gel devices for single-cell high-throughput microscopy of E. coli cells. Sci. Rep. 2017, 7, 17750. [Google Scholar] [CrossRef] [PubMed] [Green Version]
- Karimi, M.; Yazdi, F.T.; Mortazavi, S.A.; Shahabi-Ghahfarrokhi, I.; Chamani, J. Development of active antimicrobial poly (l-glutamic) acid-poly (l-lysine) packaging material to protect probiotic bacterium. Polym. Test. 2020, 83, 106338. [Google Scholar] [CrossRef]
- Ren, D.; Xia, Y.; Wang, J.; You, Z. Micropatterning of single-cell arrays using the PEG-Silane and biotin–(strept)avidin system with photolithography and chemical vapor deposition. Sens. Actuators B Chem. 2013, 188, 340–346. [Google Scholar] [CrossRef]
- Wang, Z.; Zhang, P.; Kirkland, B.; Liu, Y.; Guan, J. Microcontact printing of polyelectrolytes on PEG using an unmodified PDMS stamp for micropatterning nanoparticles, DNA, proteins, and cells. Soft Matter. 2012, 8, 7630. [Google Scholar] [CrossRef]
- Beckwith, K.M.; Sikorski, P. Patterned cell arrays and patterned co-cultures on polydopamine-modified poly(vinyl alcohol) hydrogels. Biofabrication 2013, 5, 045009. [Google Scholar] [CrossRef] [Green Version]
- Chen, Z.; Li, Y.; Liu, W.; Zhang, D.; Zhao, Y.; Yuan, B.; Jiang, X. Patterning mammalian cells for modeling three types of naturally occurring cell-cell interactions. Angew. Chem. Int. Ed. Engl. 2009, 48, 8303–8305. [Google Scholar] [CrossRef]
- Yang, T.; Gao, D.; Jin, F.; Jiang, Y.; Liu, H. Surface-printed microdot array chips coupled with matrix-assisted laser desorption/ionization mass spectrometry for high-throughput single-cell patterning and phospholipid analysis. Rapid Commun. Mass Spectrom. 2016, 30, 73–79. [Google Scholar] [CrossRef] [Green Version]
- Korenaga, A.; Chen, F.; Li, H.; Uchiyama, K.; Lin, J.M. Inkjet automated single cells and matrices printing system for matrix-assisted laser desorption/ionization mass spectrometry. Talanta 2017, 162, 474–478. [Google Scholar] [CrossRef]
- Custodio, C.A.; Miguel-Arranz, V.S.; Gropeanu, R.A.; Gropeanu, M.; Wirkner, M.; Reis, R.L.; Mano, J.F.; del Campo, A. Photopatterned antibodies for selective cell attachment. Langmuir 2014, 30, 10066–10071. [Google Scholar] [CrossRef] [Green Version]
- Bolivara, J.M.; Nidetzky, B. On the relationship between structure and catalytic effectiveness in solid surface-immobilized enzymes: Advances in methodology and the quest for a single-molecule perspective. BBA-Proteins Proteom. 2020, 1868, 140333. [Google Scholar] [CrossRef] [PubMed]
- Kasálková Slepičková, N.; Slepička, P.; Kolská, Z.; Hodačová, P.; Kučková, Š.; Švorčík, V. Grafting of bovine serum albumin proteins on plasma-modified polymers for potential application in tissue engineering. Nanoscale Res. Lett. 2014, 9, 161–167. [Google Scholar] [CrossRef] [PubMed] [Green Version]
- Mu, J.; He, L.; Huang, P.; Chen, X. Engineering of nanoscale coordination polymers with biomolecules for advanced applications. Coord. Chem. Rev. 2019, 399, 213039. [Google Scholar] [CrossRef] [PubMed]
- Ermis, M.; Antmena, E.; Hasirci, V. Micro and Nanofabrication methods to control cell-substrate interaction and cell behavior: A review from the tissue engineering perspective. Bioact. Mater. 2018, 3, 355–369. [Google Scholar] [CrossRef]
- Zhang, K.; Yang, Q.; Fan, Z.; Zhao, J.; Li, H. Platelet-driven formation of interface peptide nano-network biosensor enabling a non-invasive means for early detection of Alzheimer’s disease. Biosens. Bioelectron. 2019, 145, 111701. [Google Scholar] [CrossRef]
- Zeng, Y.; Zhou, J.; Wang, X.; Cai, Z.; Shao, Y. Wavelength-scanning surface plasmon resonance microscopy: A novel tool for real times sensing of cell-substrate interactions. Biosens. Bioelectron. 2019, 1451, 111717. [Google Scholar] [CrossRef]
- Kaimlová, M.; Nemogová, I.; Kolářová, K.; Slepička, P.; Švorčík, V.; Siegel, J. Optimization of silver nanowire formation on laser processed PEN: Surface properties and antibacterial effects. Appl. Surf. Sci. 2019, 473, 516–526. [Google Scholar] [CrossRef]
- Lišková, J.; Kasálková Slepičková, N.; Slepička, P.; Švorčík, V.; Bačáková, L. Heat-treated carbon coatings on poly (L-lactide) foils for tissue engineering. Mater. Sci. Eng. C 2019, 100, 117–128. [Google Scholar] [CrossRef]
- Slepicka, P.; Kasalkova Slepickova, N.; Siegel, J.; Kolska, Z.; Bacakova, L.; Svorcik, V. Nano-structured and functionalized surfaces for cytocompatibility improvement and bactericidal action. Biotechnol. Adv. 2015, 33, 1120–1129. [Google Scholar] [CrossRef]
- Su, J.; Satchell, S.C.; Wertheim, J.A.; Shah, R.N. Poly(ethylene glycol)-crosslinked gelatin hydrogel substrates with conjugated bioactive peptides influence endothelial cell behavior. Biomaterials 2019, 201, 99–112. [Google Scholar] [CrossRef] [Green Version]
- Friedmann, A.; Hoess, A.; Cismak, A.; Heilmann, A. Investigation of cell-substrate interactions by focused ion beam preparation and scanning electron microscopy. Acta Biomater. 2011, 7, 2499–2507. [Google Scholar] [CrossRef] [PubMed]
- Sazonova, O.V.; Lee, K.L.; Isenberg, B.C.; Rich, C.B.; Nugent, M.A.; Wong, J.Y. Cell-Cell Interactions Mediate the Response of Vascular Smooth Muscle Cells to Substrate Stiffness. Biophys. J. 2011, 101, 622–630. [Google Scholar] [CrossRef] [PubMed] [Green Version]
- Schultz, S.; Smith, D.R.; Mock, J.J.; Schultz, D.A. Single-target molecule detection with nonbleaching multicolor optical immunolabels. Proc. Natl. Acad. Sci. USA 2000, 97, 996. [Google Scholar] [CrossRef] [PubMed] [Green Version]
- de Aberasturi, D.J.; Montenegro, J.-M.; de Larramendi, I.R.; Rojo, T.; Klar, T.A.; Alvarez-Puebla, R.A.; Liz-Marzan, L.M.; Parak, W.J. Optical Sensing of Small Ions with Colloidal Nanoparticles. Chem. Mater. 2012, 24, 738. [Google Scholar] [CrossRef]
- Saha, K.; Agasti, S.S.; Kim, C.; Li, X.; Rotello, V.M. Gold Nanoparticles in Chemical and Biological Sensing. Chem. Rev. 2012, 112, 2739. [Google Scholar] [CrossRef] [Green Version]
- Castillejo, M.; Ezquerra, T.A.; Martin, M.; Oujja, M.; Perez, S.; Rebollar, E. Laser Nanostructuring of Polymers: Ripples and Applications. AIP Conf. Proc. 2012, 1464, 372. [Google Scholar]
- Huang, X.; Jain, P.K.; El-Sayed, I.H.; El-Sayed, M.A. Plasmonic photothermal therapy (PPTT) using gold nanoparticles. Lasers Med. Sci. 2008, 23, 217. [Google Scholar] [CrossRef]
- Michaljaničová, I.; Slepička, P.; Rimpelová, S.; Kasálková Slepičková, N.; Švorčík, V. Regular pattern formation on surface of aromatic polymers and its cytocompatibility. Appl. Surf. Sci. 2016, 370, 131–141. [Google Scholar] [CrossRef]
- Michaljaničová, I.; Slepička, P.; Veselý, M.; Kolská, Z.; Švorčík, V. Nanowires and nanodots prepared with polarized KrF laser on polyethersulphone. Mater. Lett. 2015, 144, 15–18. [Google Scholar] [CrossRef]
- Slepička, P.; Neznalová, K.; Fajstavr, D.; Kasálková Slepičková, N.; Švorčík, V. Honeycomb-like pattern formation on perfluoroethylenepropylene enhanced by plasma treatment. Plasma Proc. Polym. 2019, 16, 1900063. [Google Scholar] [CrossRef]
- Villanueva-Flores, F.; Castro-Lugo, A.; Ramírez, O.T.; Palomares, L.A. Understanding cellular interactions with nanomaterials: Towards a rational design of medical nanodevices. Nanotechnology 2020, 31, 132002. [Google Scholar] [CrossRef] [PubMed]
- Chung, K.; DeQuach, J.A.; Christman, K.L. Nanopatterned interfaces for controlling cell behavior. Nano Life 2010, 1, 63–77. [Google Scholar] [CrossRef] [PubMed] [Green Version]
- Garoli, D.; Lovato, L.; della Giustina, G.; Oliverio, M.; Francardi, M.; Zanchetta, E.; Brusatin, G.; de Angelis, F. Directly nanopatternable nanoporous titania—Application to cell growth engineering. Microelectron. Eng. 2016, 155, 102–106. [Google Scholar] [CrossRef]
- Bacakova, L.; Novotna, K.; Hadraba, D.; Musilkova, J.; Slepicka, P.; Beran, M. Influence of Biomimetically Mineralized Collagen Scaffolds on Bone Cell Proliferation and Immune Activation. Polymers 2022, 14, 602–628. [Google Scholar]
- Yim, E.K.F.; Reano, R.M.; Pang, S.W.; Yee, A.F.; Chen, C.S.; Leong, K.W. Nanopattern-induced changes in morphology and motility of smooth muscle cells. Biomaterials 2005, 26, 5405–5413. [Google Scholar] [CrossRef] [Green Version]
- Han, S.S.; Cho, M.O.; Huh, K.M.; Kang, S.W. Effects of nanopatterned-surface dishes on chondrocyte growth and cell cycle progression. RSC Adv. 2021, 11, 39–47. [Google Scholar] [CrossRef]
- Sousa, M.P.; Caridade, S.G.; Mano, J.F. Control of Cell Alignment and Morphology by Redesigning ECM-Mimetic Nanotopography on Multilayer Membranes. Adv. Healthc. Mater. 2017, 6, 1601462. [Google Scholar] [CrossRef]
- Casanellas, I.; Lagunas, A.; Vida, Y.; Pérez-Inestrosa, E.; Andrades, J.A.; Becerra, J.; Samitier, J. Matrix Nanopatterning Regulates Mesenchymal Differentiation through Focal Adhesion Size and Distribution According to Cell Fate. Biomimetics 2019, 4, 43. [Google Scholar] [CrossRef] [Green Version]
- Bäuerle, D. Laser Processing and Chemistry, 4th ed.; Springer: Berlin/Heidelberg, Germany, 2011; ISBN 9783642176128. [Google Scholar]
- Slepička, P.; Chaloupka, A.; Sajdl, P.; Heitz, J.; Hnatowicz, V.; Švorčík, V. Angle dependent laser nanopatterning of poly(ethylene terephthalate) surfaces. Appl. Surf. Sci. 2011, 257, 6021–6025. [Google Scholar] [CrossRef]
- Slepička, P.; Neděla, O.; Sajdl, P.; Kolská, Z.; Švorčík, V. Polyethylene naphthalate as an excellent candidate for ripple nanopatterning. Appl. Surf. Sci. 2013, 285, 885–892. [Google Scholar] [CrossRef]
- Neděla, O.; Slepička, P.; Kasalkova Slepickova, N.; Sajdl, P.; Kolská, Z.; Rimpelová, S.; Švorčík, V. Antibacterial properties of angle-dependent nanopatterns on polystyrene. React. Funct. Polym. 2019, 136, 173–180. [Google Scholar] [CrossRef]
- Slepicka, P.; Siegel, J.; Lyutakov, O.; Kasalkova Slepickova, N.; Kolska, Z.; Bacakova, L.; Svorcik, V. Polymer nanostructures for bioapplications induced by laser treatment. Biotechnol. Adv. 2018, 36, 839–855. [Google Scholar] [CrossRef] [PubMed]
- Perez, S.; Rebollar, E.; Oujja, M.; Martin, M.; Castillejo, M. Laser-induced periodicsurface structuring of biopolymers. Appl. Phys. A: Mater. Sci. Process. 2013, 110, 683–690. [Google Scholar] [CrossRef]
- Bolle, M.; Lazare, S. Submicron periodic structures produced on polymer surfaces with polarized excimer laser ultraviolet radiation. Appl. Surf. Sci. 1993, 65, 349–354. [Google Scholar] [CrossRef]
- Rebollar, E.; Perez, S.; Hernandez, M.; Domingo, C.; Tiberio, M.; Ezquerra, T.A.; Garcia-Ruiz, J.P.; Castillejo, M. Physicochemical modifications accompanying UV laser-induced surface structures on poly(ethylene terephthalate) and their effect on adhesion of mesenchymal cells. Phys. Chem. Chem. Phys. 2014, 16, 17551–17559. [Google Scholar] [CrossRef]
- Bauer, S.; Schmuki, P.; von der Mark, K.; Park, J. Engineering biocompatible implant surfaces: Part I: Materials and surfaces. Prog. Mater. Sci. 2013, 58, 261–326. [Google Scholar] [CrossRef]


| Pristine | 1000 | 3000 | 6000 | |
|---|---|---|---|---|
| PS | 0 | 3.5 | 15.6 | 25.2 |
| PES | 20 | 22.9 | 19.8 | 20.8 |
| PEN | 19.8 | 27.3 | 31.8 | 31.9 |
Publisher’s Note: MDPI stays neutral with regard to jurisdictional claims in published maps and institutional affiliations. |
© 2022 by the authors. Licensee MDPI, Basel, Switzerland. This article is an open access article distributed under the terms and conditions of the Creative Commons Attribution (CC BY) license (https://creativecommons.org/licenses/by/4.0/).
Share and Cite
Slepička, P.; Rimpelová, S.; Svobodová Pavlíčková, V.; Slepičková Kasálková, N.; Hurtuková, K.; Fajstavr, D.; Švorčík, V. Mammalian Cell Interaction with Periodic Surface Nanostructures. Int. J. Mol. Sci. 2022, 23, 4676. https://0-doi-org.brum.beds.ac.uk/10.3390/ijms23094676
Slepička P, Rimpelová S, Svobodová Pavlíčková V, Slepičková Kasálková N, Hurtuková K, Fajstavr D, Švorčík V. Mammalian Cell Interaction with Periodic Surface Nanostructures. International Journal of Molecular Sciences. 2022; 23(9):4676. https://0-doi-org.brum.beds.ac.uk/10.3390/ijms23094676
Chicago/Turabian StyleSlepička, Petr, Silvie Rimpelová, Vladimíra Svobodová Pavlíčková, Nikola Slepičková Kasálková, Klaudia Hurtuková, Dominik Fajstavr, and Václav Švorčík. 2022. "Mammalian Cell Interaction with Periodic Surface Nanostructures" International Journal of Molecular Sciences 23, no. 9: 4676. https://0-doi-org.brum.beds.ac.uk/10.3390/ijms23094676