Article

Contrasting Health Effects of Bacteroidetes and Firmicutes Lies in Their Genomes: Analysis of P450s, Ferredoxins, and Secondary Metabolite Clusters

by
Bridget Valeria Zinhle Nkosi
1,
Tiara Padayachee
1,
Dominik Gront
2,
David R. Nelson
3,* and
Khajamohiddin Syed
1,*
1
Department of Biochemistry and Microbiology, Faculty of Science and Agriculture, University of Zululand, KwaDlangezwa 3886, South Africa
2
Biological and Chemical Research Center, Faculty of Chemistry, University of Warsaw, Pasteura 1, 02-093 Warsaw, Poland
3
Department of Microbiology, Immunology and Biochemistry, University of Tennessee Health Science Center, Memphis, TN 38163, USA
*
Authors to whom correspondence should be addressed.
Int. J. Mol. Sci. 2022, 23(9), 5057; https://0-doi-org.brum.beds.ac.uk/10.3390/ijms23095057
Submission received: 8 April 2022 / Revised: 29 April 2022 / Accepted: 29 April 2022 / Published: 2 May 2022
(This article belongs to the Special Issue Recent Advances in Molecular Research of Metabolic Disorders)

Abstract

:
Species belonging to the bacterial phyla Bacteroidetes and Firmicutes represent over 90% of the gastrointestinal microbiota. Changes in the ratio of these two bacterial groups were found to have contrasting health effects, including obesity and inflammatory diseases. Despite the availability of many bacterial genomes, comparative genomic studies on the gene pools of these two bacterial groups concerning cytochrome P450 monooxygenases (P450s), ferredoxins, and secondary metabolite biosynthetic gene clusters (smBGCs) are not reported. This study is aimed to address this research gap. The study revealed the presence of diverse sets of P450s, ferredoxins, and smBGCs in their genomes. Bacteroidetes species have the highest number of P450 families, ferredoxin cluster-types, and smBGCs compared to Firmicutes species. Only four P450 families, three ferredoxin cluster types, and five smBGCs are commonly shared between these two bacterial groups. Considering the above facts, we propose that the contrasting effects of these two bacterial groups on the host are partly due to the distinct nature of secondary metabolites produced by these organisms. Thus, the cause of the contrasting health effects of these two bacterial groups lies in their gene pools.

1. Introduction

The bacterial phylum Bacteroidetes consists of gram-negative bacteria, primarily degraders of carbohydrates [1,2]. They provide energy for their host by breaking down the polysaccharides that their host cannot digest [1,2]. These bacterial species can be found in all ecosystems, including fresh water and soil [2,3]. In humans, they are predominantly found in the gastrointestinal tract, inhabiting the distal gut [4]. They play a significant role in the gastrointestinal tract by interacting with the gut immune system, inhibiting the colonization of potential pathogens [5]. Gut Bacteroidetes species produce acids, such as acetic acid, propionic acid, and succinic acid, as final products of their metabolism, which help kill the pathogens [5].
This bacterial phylum consists of 130 genera [6]; Bacteroides is known for producing skimmed or low-fat milk and displaying postbiotic activities, such as promoting health and well-being [7]. Zobellia galactanivorans, a flavobacterium, degrades algal biomass [8]. Spirosoma species produce valuable human compounds with neuroprotective, anti-tumorigenic, and anti-inflammatory properties, among others [9]. Some of the secondary metabolites produced by these species and their biological properties are listed in Table 1. In addition to the many beneficial bacteria, this phylum also has pathogenic species. Species belonging to the genus Empedobacter are human pathogens. In humans, they cause meningitis, endophthalmitis, urinary tract infection, and bacteremia [10,11]. Bacteroides fragilis and other members of the Bacteroides genus were shown to be the primary causes of anaerobic septicemia [12]. The genus Elizabethkingia consists of novel species such as E. anophelis and E. meningosepta, which are gram-negative, non-spore-forming, nonmotile, and rod-shaped, and depict natural resistance to multiple known antibiotics [13].
For quite some time, Bacteroidetes, in association with other bacterial species belonging to the phylum Firmicutes, have been in focus due to their impact on human health. These two bacterial groups represent 90% of the gut microbiota [22], indicating their importance in human health. As expected, due to their abundance in the human gut, the ratio of Firmicutes and Bacteroidetes was found to have contrasting effects on human health, including in obesity and inflammatory disease [23,24], albeit with some uncertainties [25]. These two bacterial groups produce secondary metabolites that ultimately affect human health.
Despite the availability of many species genomes belonging to these two phyla, comparative analyses of the gene pools responsible for these two bacterial groups’ behavior and health effects on humans are scarcely reported. Genome-wide comparative analysis of a few species revealed that Firmicutes species have smaller genomes and a disproportionately smaller number of glycan degrading enzymes than Bacteroidetes species [26]. A subsequent study involving 60 Bacteroidetes and 197 Firmicutes on host-synthesized mucin glycans revealed different glycosyl hydrolases patterns between Bacteroidetes and Firmicutes, indicating some preference for cleaved mucin glycans in the host [27]. Analysis of chicken caecum gut microbiome revealed that Bacteroidetes and Firmicutes follow different strategies for colonization and coexistence in the intestinal tract [28]. A study detailing the genomic blueprint of the human gut microbiota revealed a large number of uncultured Firmicutes compared to Bacteroidetes [29]. The study also reported novel secondary metabolite biosynthetic gene clusters (smBGCs) coding for undiscovered natural compounds produced by the intestinal microbiota [29].
In a recent study, Firmicutes species were found to have a large number of cytochrome P450 monooxygenases (CYPs/P450s) [30] and their redox proteins, ferredoxins [31], in their genomes. P450s are heme–thiolate enzymes known to play a role in an organism’s primary and secondary metabolism. These enzymes are found in species across the biological kingdoms, including in nonliving entities such as viruses [32,33]. It is now well-established that the P450 contingent of organisms is indicative of their lifestyle, because the lifestyle of an organism was found to affect the P450 gene pool in its genome [30,34,35,36,37,38,39,40,41,42]. P450s were found to help organisms adapt to ecological niches, and organisms with parasitic, commensal, or adapted living on simple carbon sources were found to have the lowest number of P450s in their genome [30,34,35,36,37,38,39,40,41]. P450s need electrons to perform their enzymatic reactions, and these electrons are supplied by redox proteins such as ferredoxins [43,44]. A recent study revealed many ferredoxins in Firmicutes species [31]. The study also suggested unique ferredoxins in Firmicutes species indicative of characteristics of the species in this phylum [31]. It is well-known that P450s, due to their regio- and stereo-specific oxidation capabilities, play a crucial role in producing secondary metabolites per se, contributing to the diversity of the secondary metabolites in an organism [45,46]. In a recent study, many P450s were part of smBGCs, indicating their role in secondary metabolite production in Firmicutes species [30].
Considering the above facts, especially the P450s and ferredoxins gene pools as characteristics of an organism’s lifestyle and their role in the production of secondary metabolites, in this study, we selected these two sets of genes for comparative analysis of the gene pools of Bacteroidetes and Firmicutes. These two bacterial groups are known to produce secondary metabolites (Table 1) [30], and it is well-known that these secondary metabolites affect human health [47,48,49]. Thus, we performed a comprehensive comparative analysis of smBGCs to understand the rationale behind these two bacterial groups’ distinct effects on human health regarding their secondary metabolism.

2. Results and Discussion

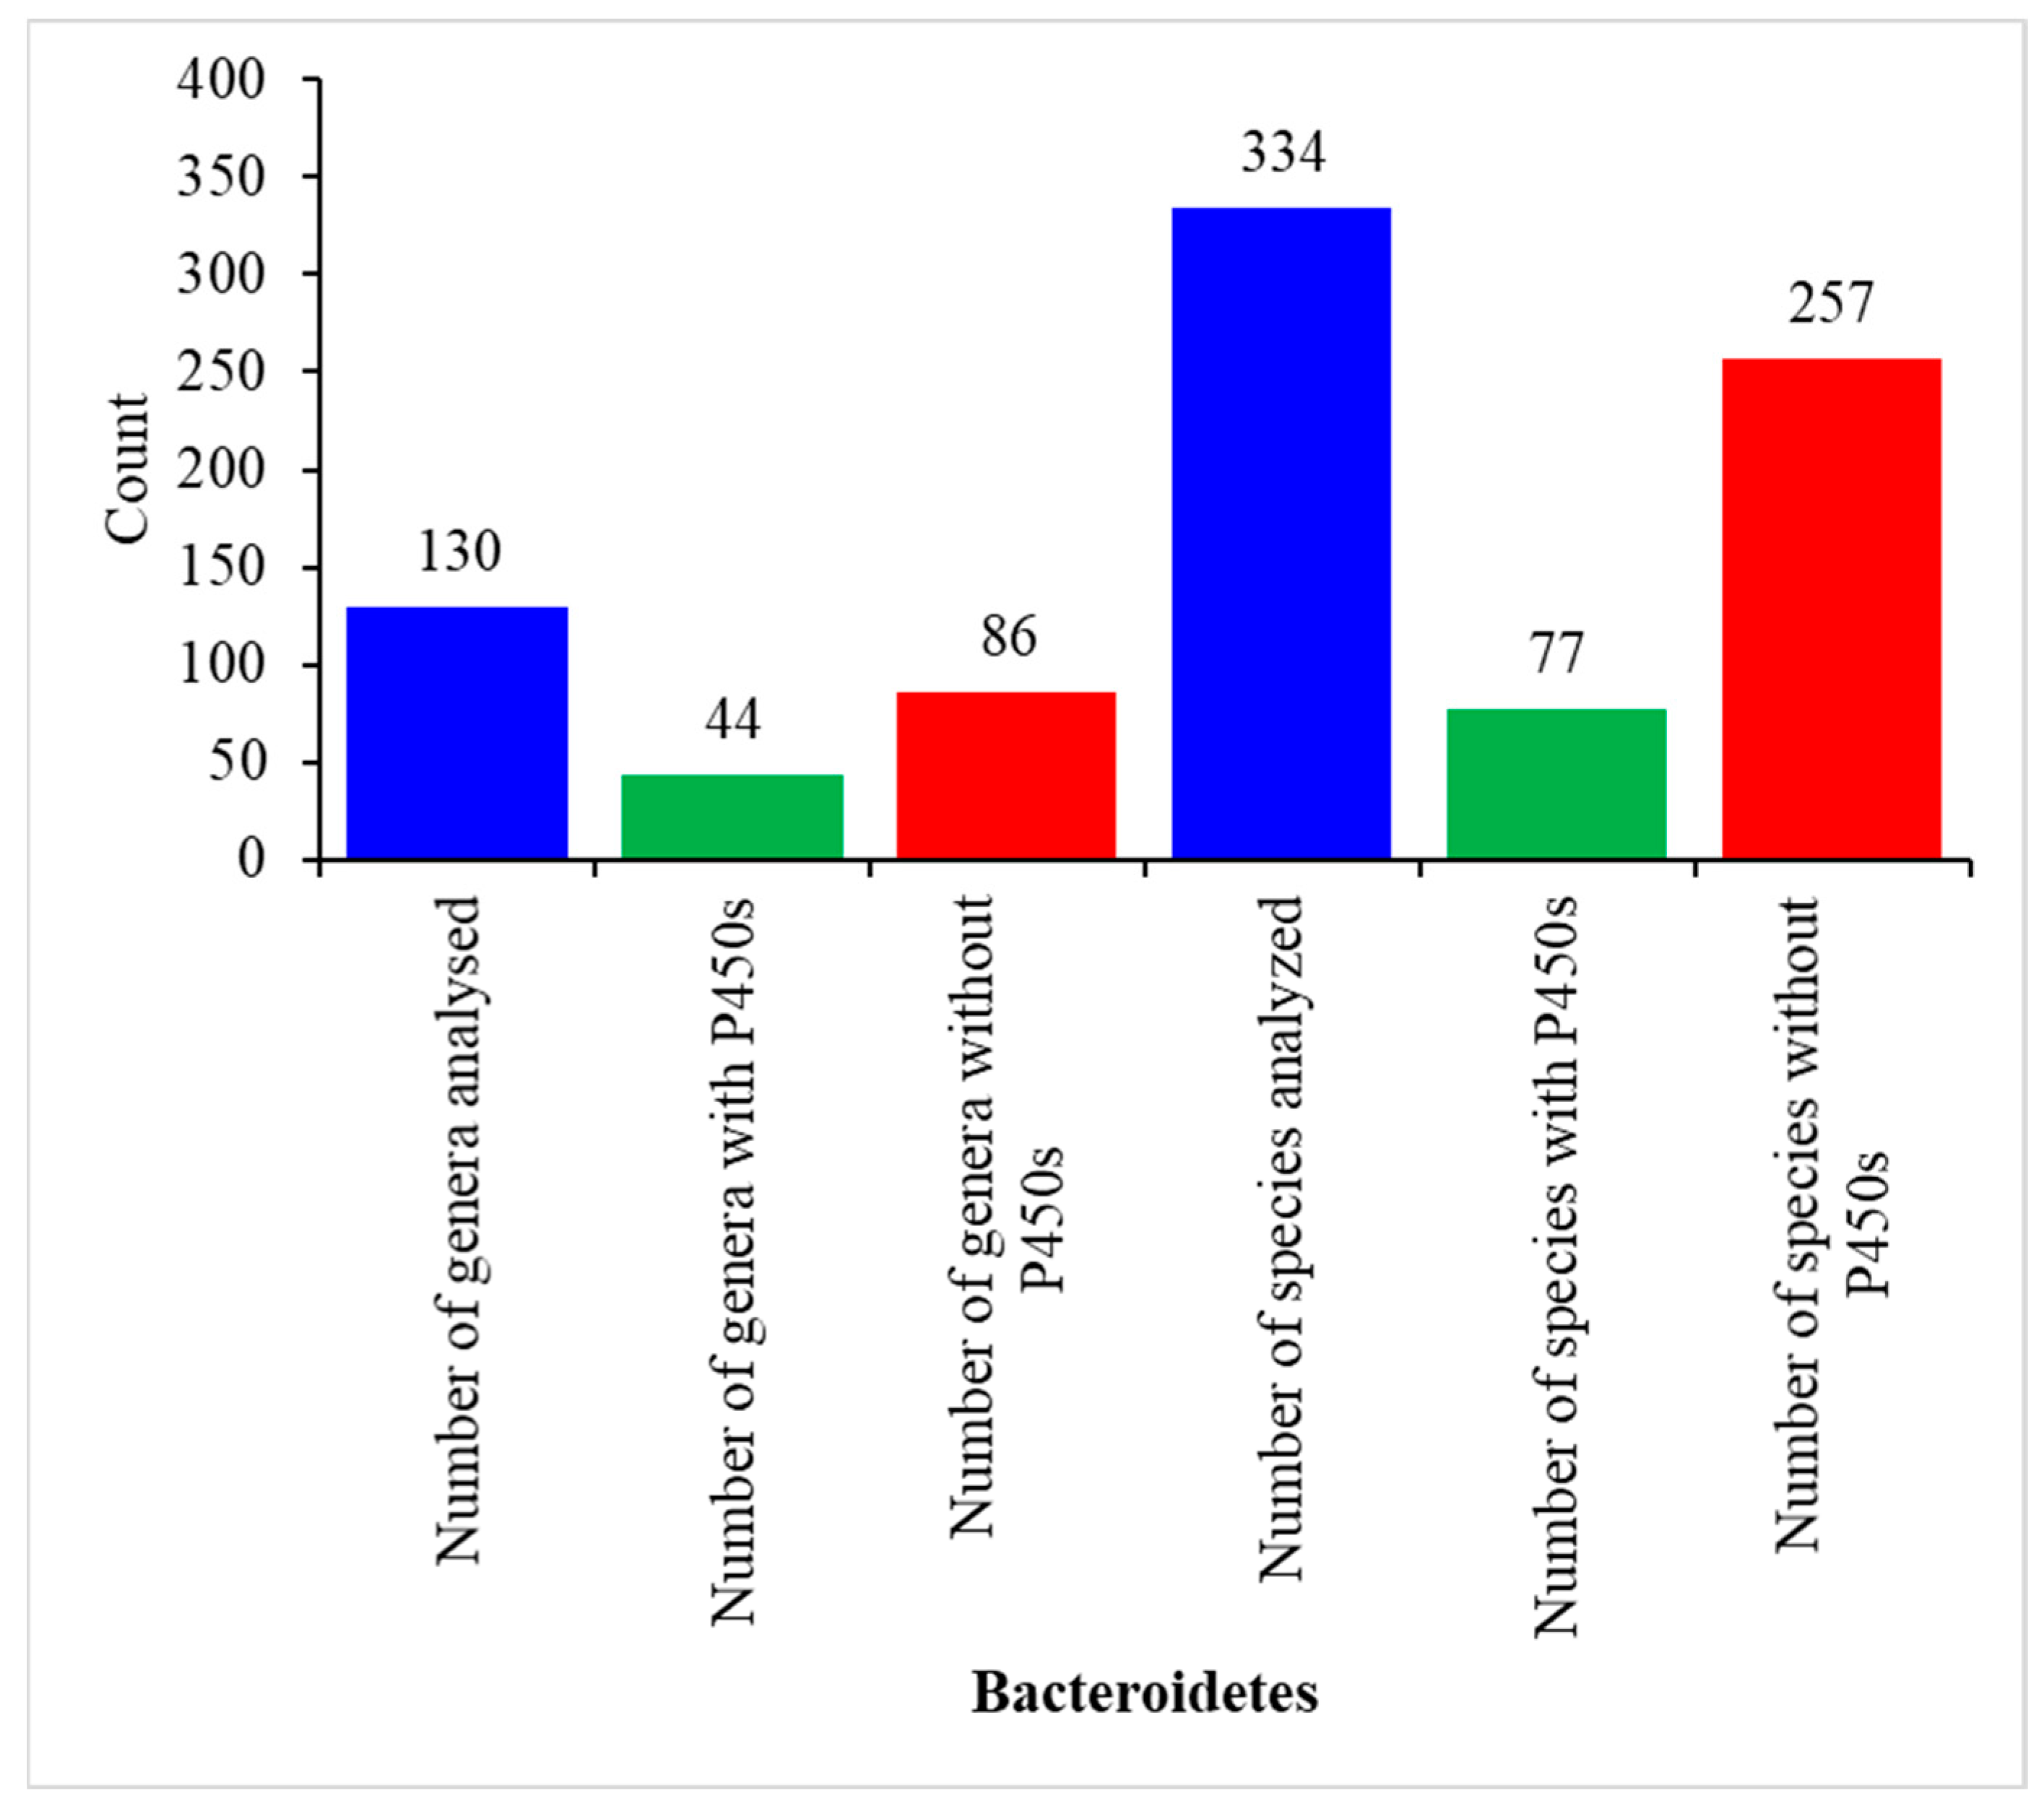
2.1. Only a Few Bacteroidetes Species Have P450s

Genome-wide analysis of P450s in 334 Bacteroidetes species belonging to 130 genera revealed the presence of P450s only in 77 Bacteroidetes species, indicating most of the species do not have P450s in their genome (Figure 1 and Table S1). This shows only 23% of Bacteroidetes species have P450s in their genomes. Interestingly, 23% of Firmicutes species had P450s in their genomes [30], indicating most of the species belonging to these two phyla do not have P450s. Analysis of Bacteroidetes genera disclosed that of the 130 genera, species belonging to 44 genera have P450s in their genomes (Figure 1 and Table S1). A point to be noted is that only a few species genomes are available in the 130 genera. Sometimes only a single species genome is available, and thus future availability of more species genomes will provide more accurate information on P450s in these genera (Figure 1 and Table S1). However, this study analyzed a significant number of species belonging to genera such as Bacteroides, Capnocytophaga, and Prevotella, and no P450s were found, suggesting that species in these genera probably do not have P450s (Figure 1 and Table S1).
Analysis of P450s in 77 Bacteroidetes species revealed the presence of 98 P450s in their genomes (Figure 2 and Table S1). The P450 count in the Bacteroidetes species ranged from a single P450 to three P450s; Zunongwangia profunda and Flavivirga eckloniae had the highest number of P450s (three P450s) in their genomes (Table S1). Bacteroidetes species were found to have the highest average number of P450s in their genomes compared to Gammaproteobacterial species, but the lowest compared to other bacterial species (Table 2). Bacteroidetes species P450s identified in this study and their protein sequences and species are presented in Supplementary Dataset S1.

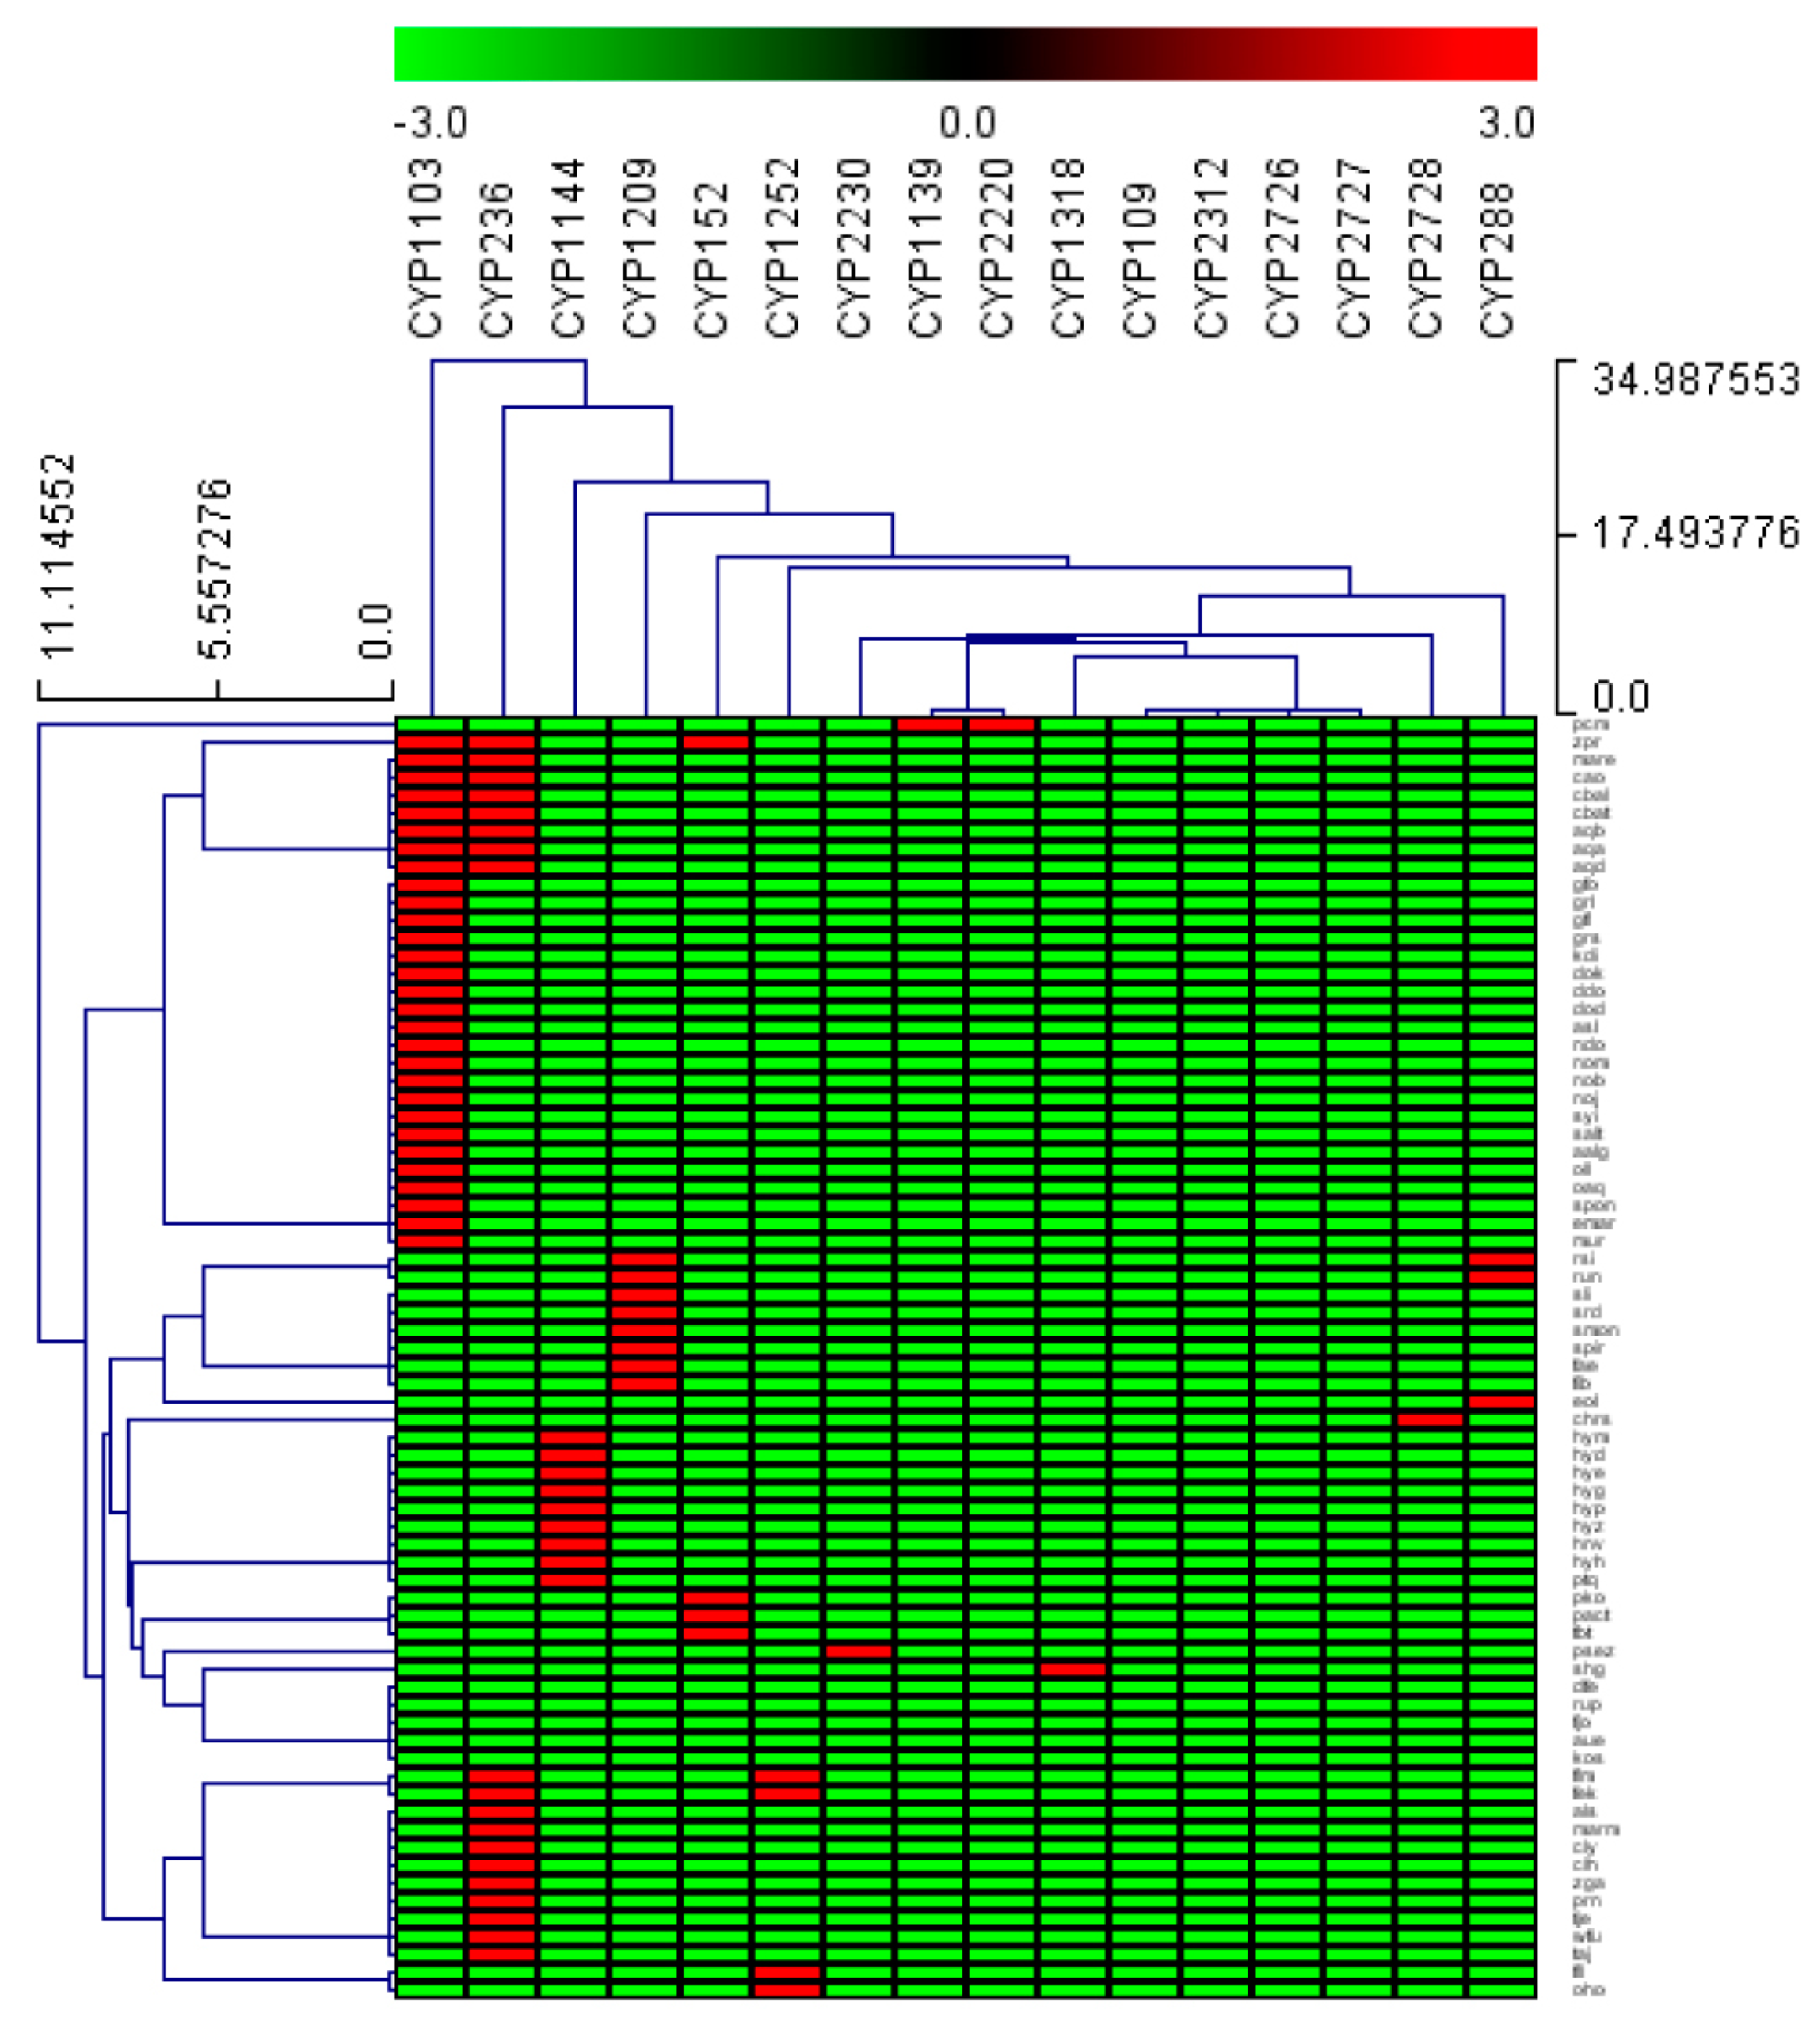
2.2. Bacteroidetes Species Have the Highest P450 Diversity

Based on the International P450 Nomenclature Committee rules, i.e., percentage identity of >40% for a family and >55% for a subfamily [53,54,55], and following the phylogenetic analysis of P450s, where P450s belonging to the same family are grouped (Figure 2), 98 P450s of Bacteroidetes species can be grouped into 21 P450 families and 28 P450 subfamilies (Table 3). The number of P450 families in Bacteroidetes species was found to be higher compared to Firmicutes species (Table 2). However, the number of P450 families in Bacteroidetes species was lowest compared to Gammaproteobacterial species, mycobacterial species and cyanobacterial species, and Streptomyces species (Table 2). The comparative analysis of P450 diversity percentage among different bacterial groups revealed that Bacteroidetes species have the highest P450 diversity and Firmicutes species have the lowest P450 diversity (Table 2).
Among P450 families, the CYP1103 has the highest number of members, with 29 P450s contributing 30% of total P450s in Bacteroidetes species (Table 3), followed by CYP236 (20 P450s contributing 20%), and CYP1144 (10 P450s contributing 10%) (Table 3). The number of members in the remaining 18 P450 families ranged from one to eight members (Table 3). This indicates that the P450 families CYP1103, CYP236 and CYP1144 were expanded in Bacteroidetes species. The P450 family expansion was also observed in other bacterial species belonging to Firmicutes [30] and Gammaproteobacteria [39]. Comparative analysis of dominant P450 families across different bacterial species revealed that the CYP107 family was dominant in Firmicutes and Streptomyces species (Table 2). In contrast, different P450 families were prevalent in other bacterial groups (Table 2). Interestingly, P450 families such as CYP102, CYP107, and CYP109 had only one P450 each in Bacteroidetes species, although these are quite large families in other species [30,35,50,51,52]. The analysis of the P450 subfamilies revealed that 12 out of 21 P450 families had a single subfamily (Table 3). The P450 families with the most subfamilies were CYP1103 and CYP152, with three subfamilies each (Table 3). They were followed by P450 families such as CYP1099, CYP1209, and CYP1252, each having two subfamilies (Table 3). A particular subfamily was dominant when analyzing the P450 subfamilies in a specific family. In CYP1103 and CYP1252 families, the subfamily ‘A’ was predominant, and in the CYP152 family, the subfamily ‘AP’ was dominant (Table 3). The heat map analysis of P450 family profiles revealed no P450 family conserved across the Bacteroidetes species (Figure 3). However, based on the heat-map profile of P450 families, the P450 families CYP1103 and CYP236 were found to have co-presence in eight Bacteroidetes species (Figure 3).

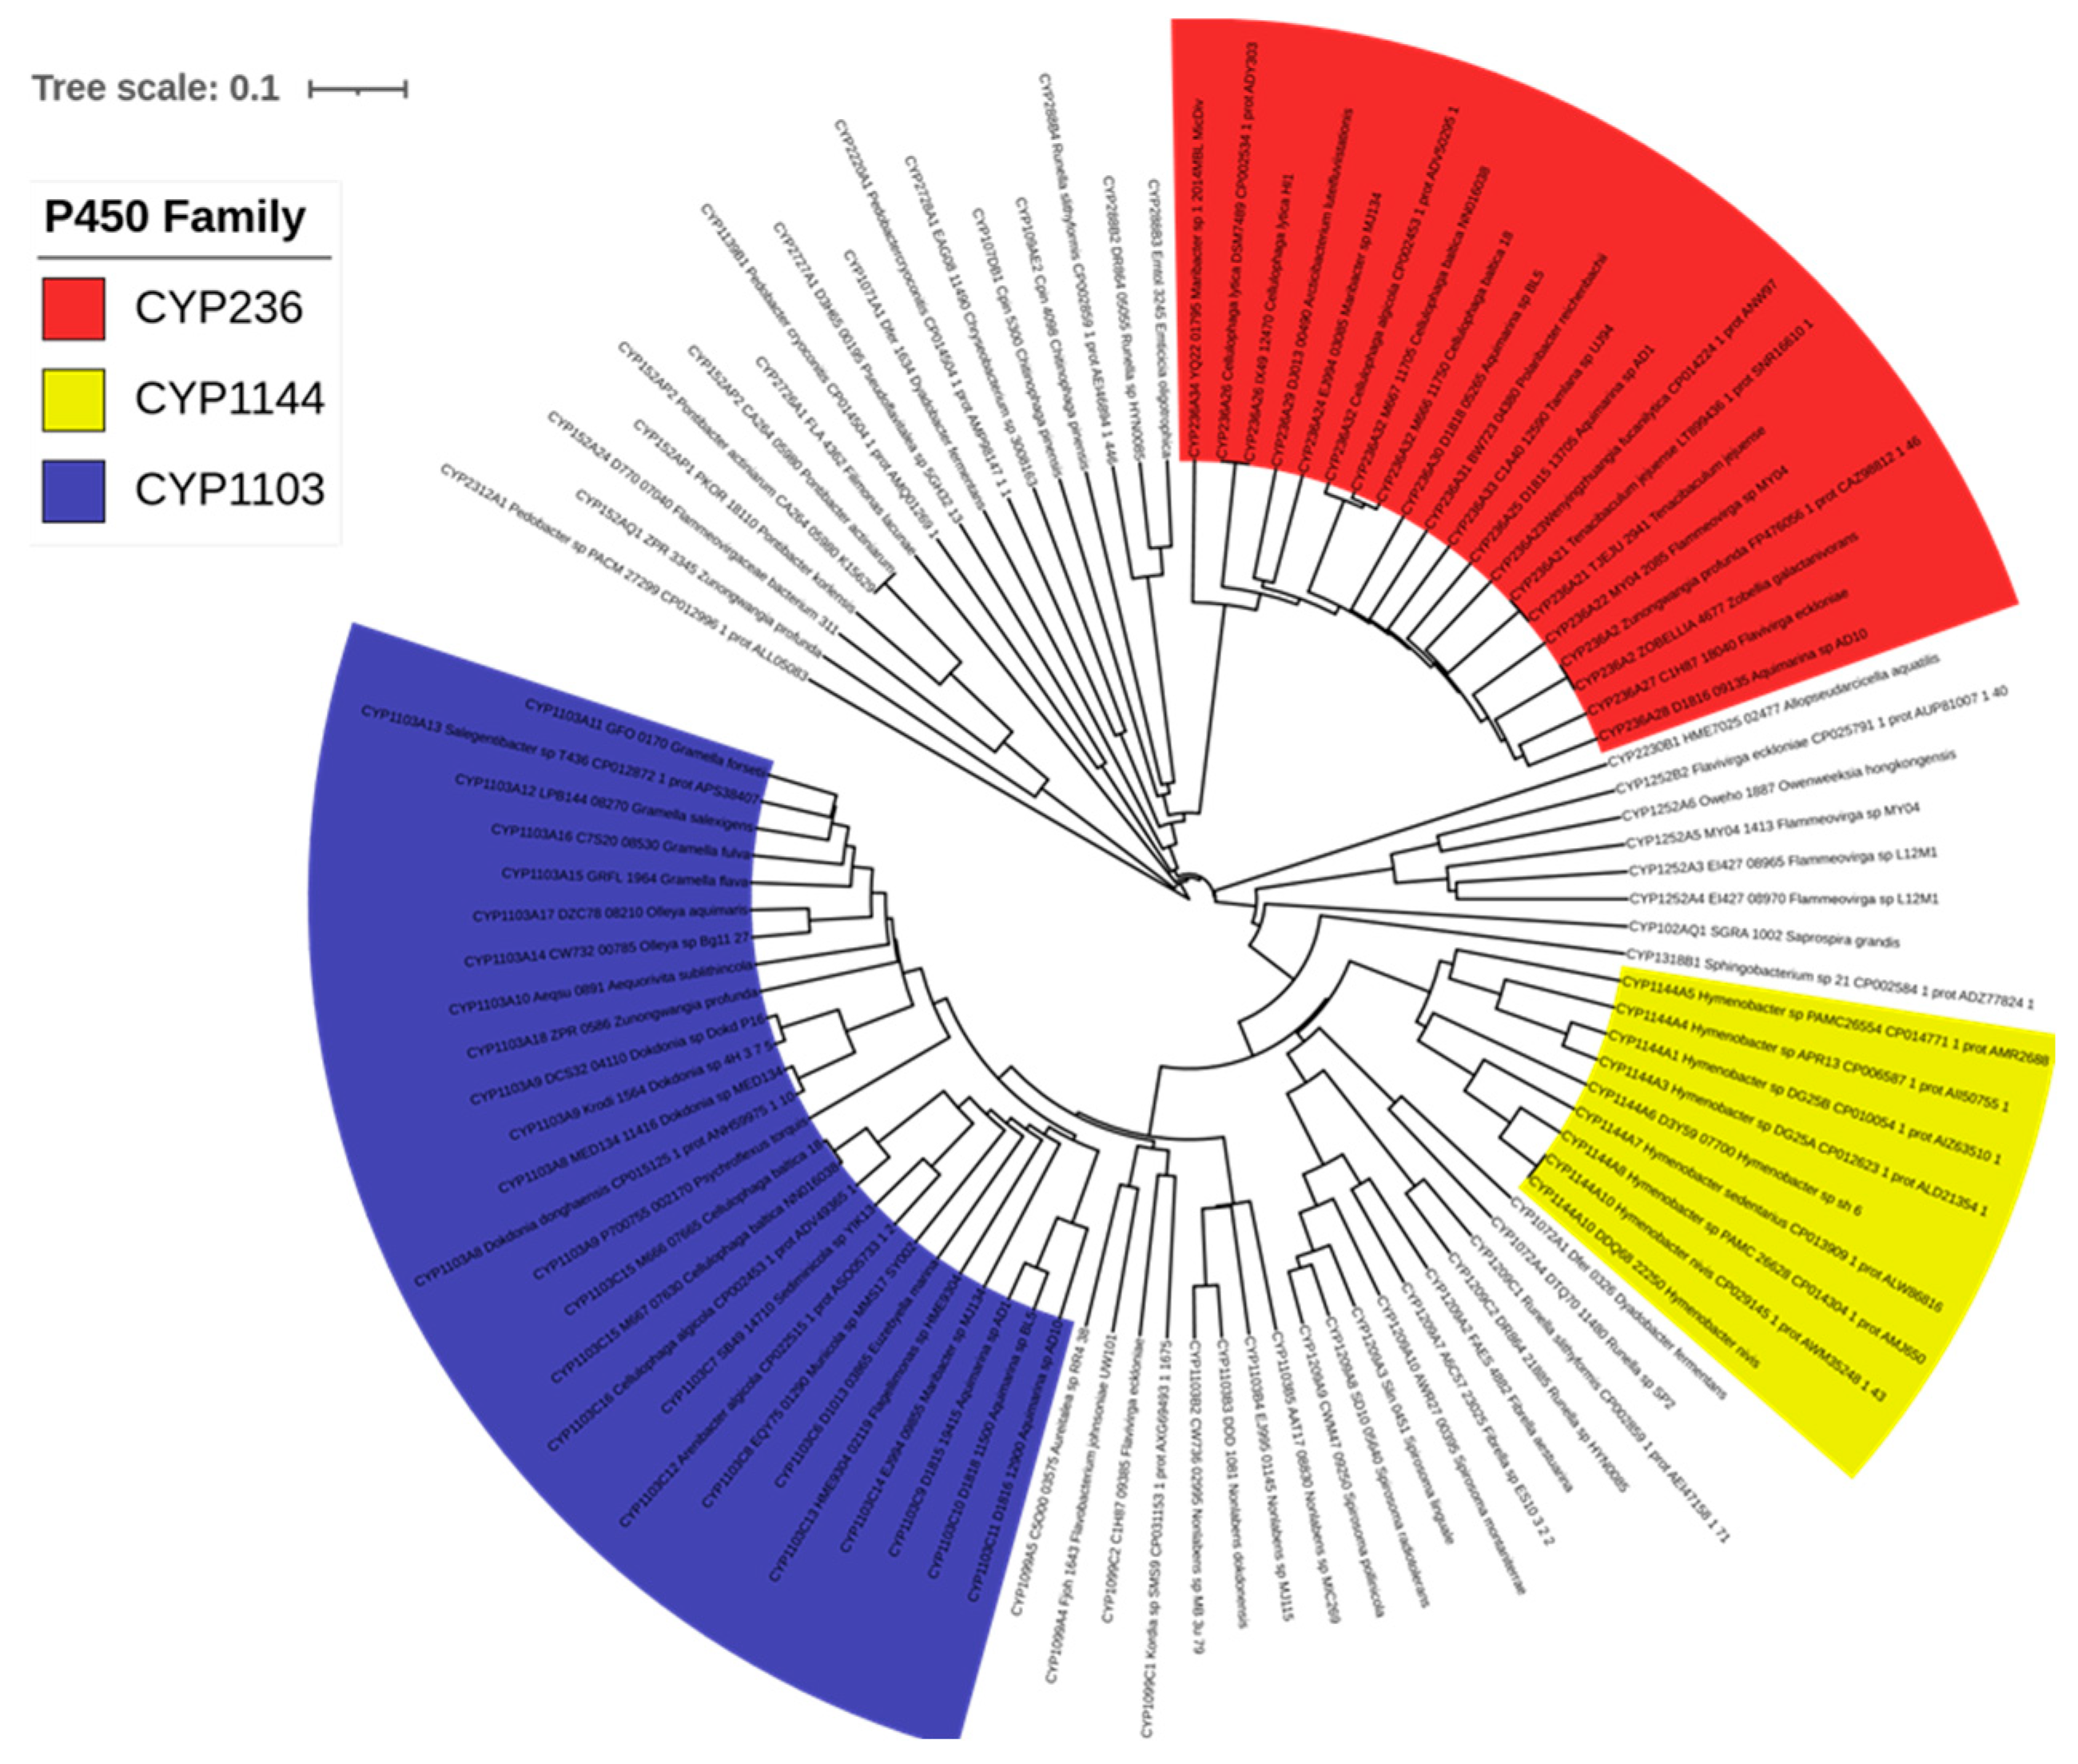
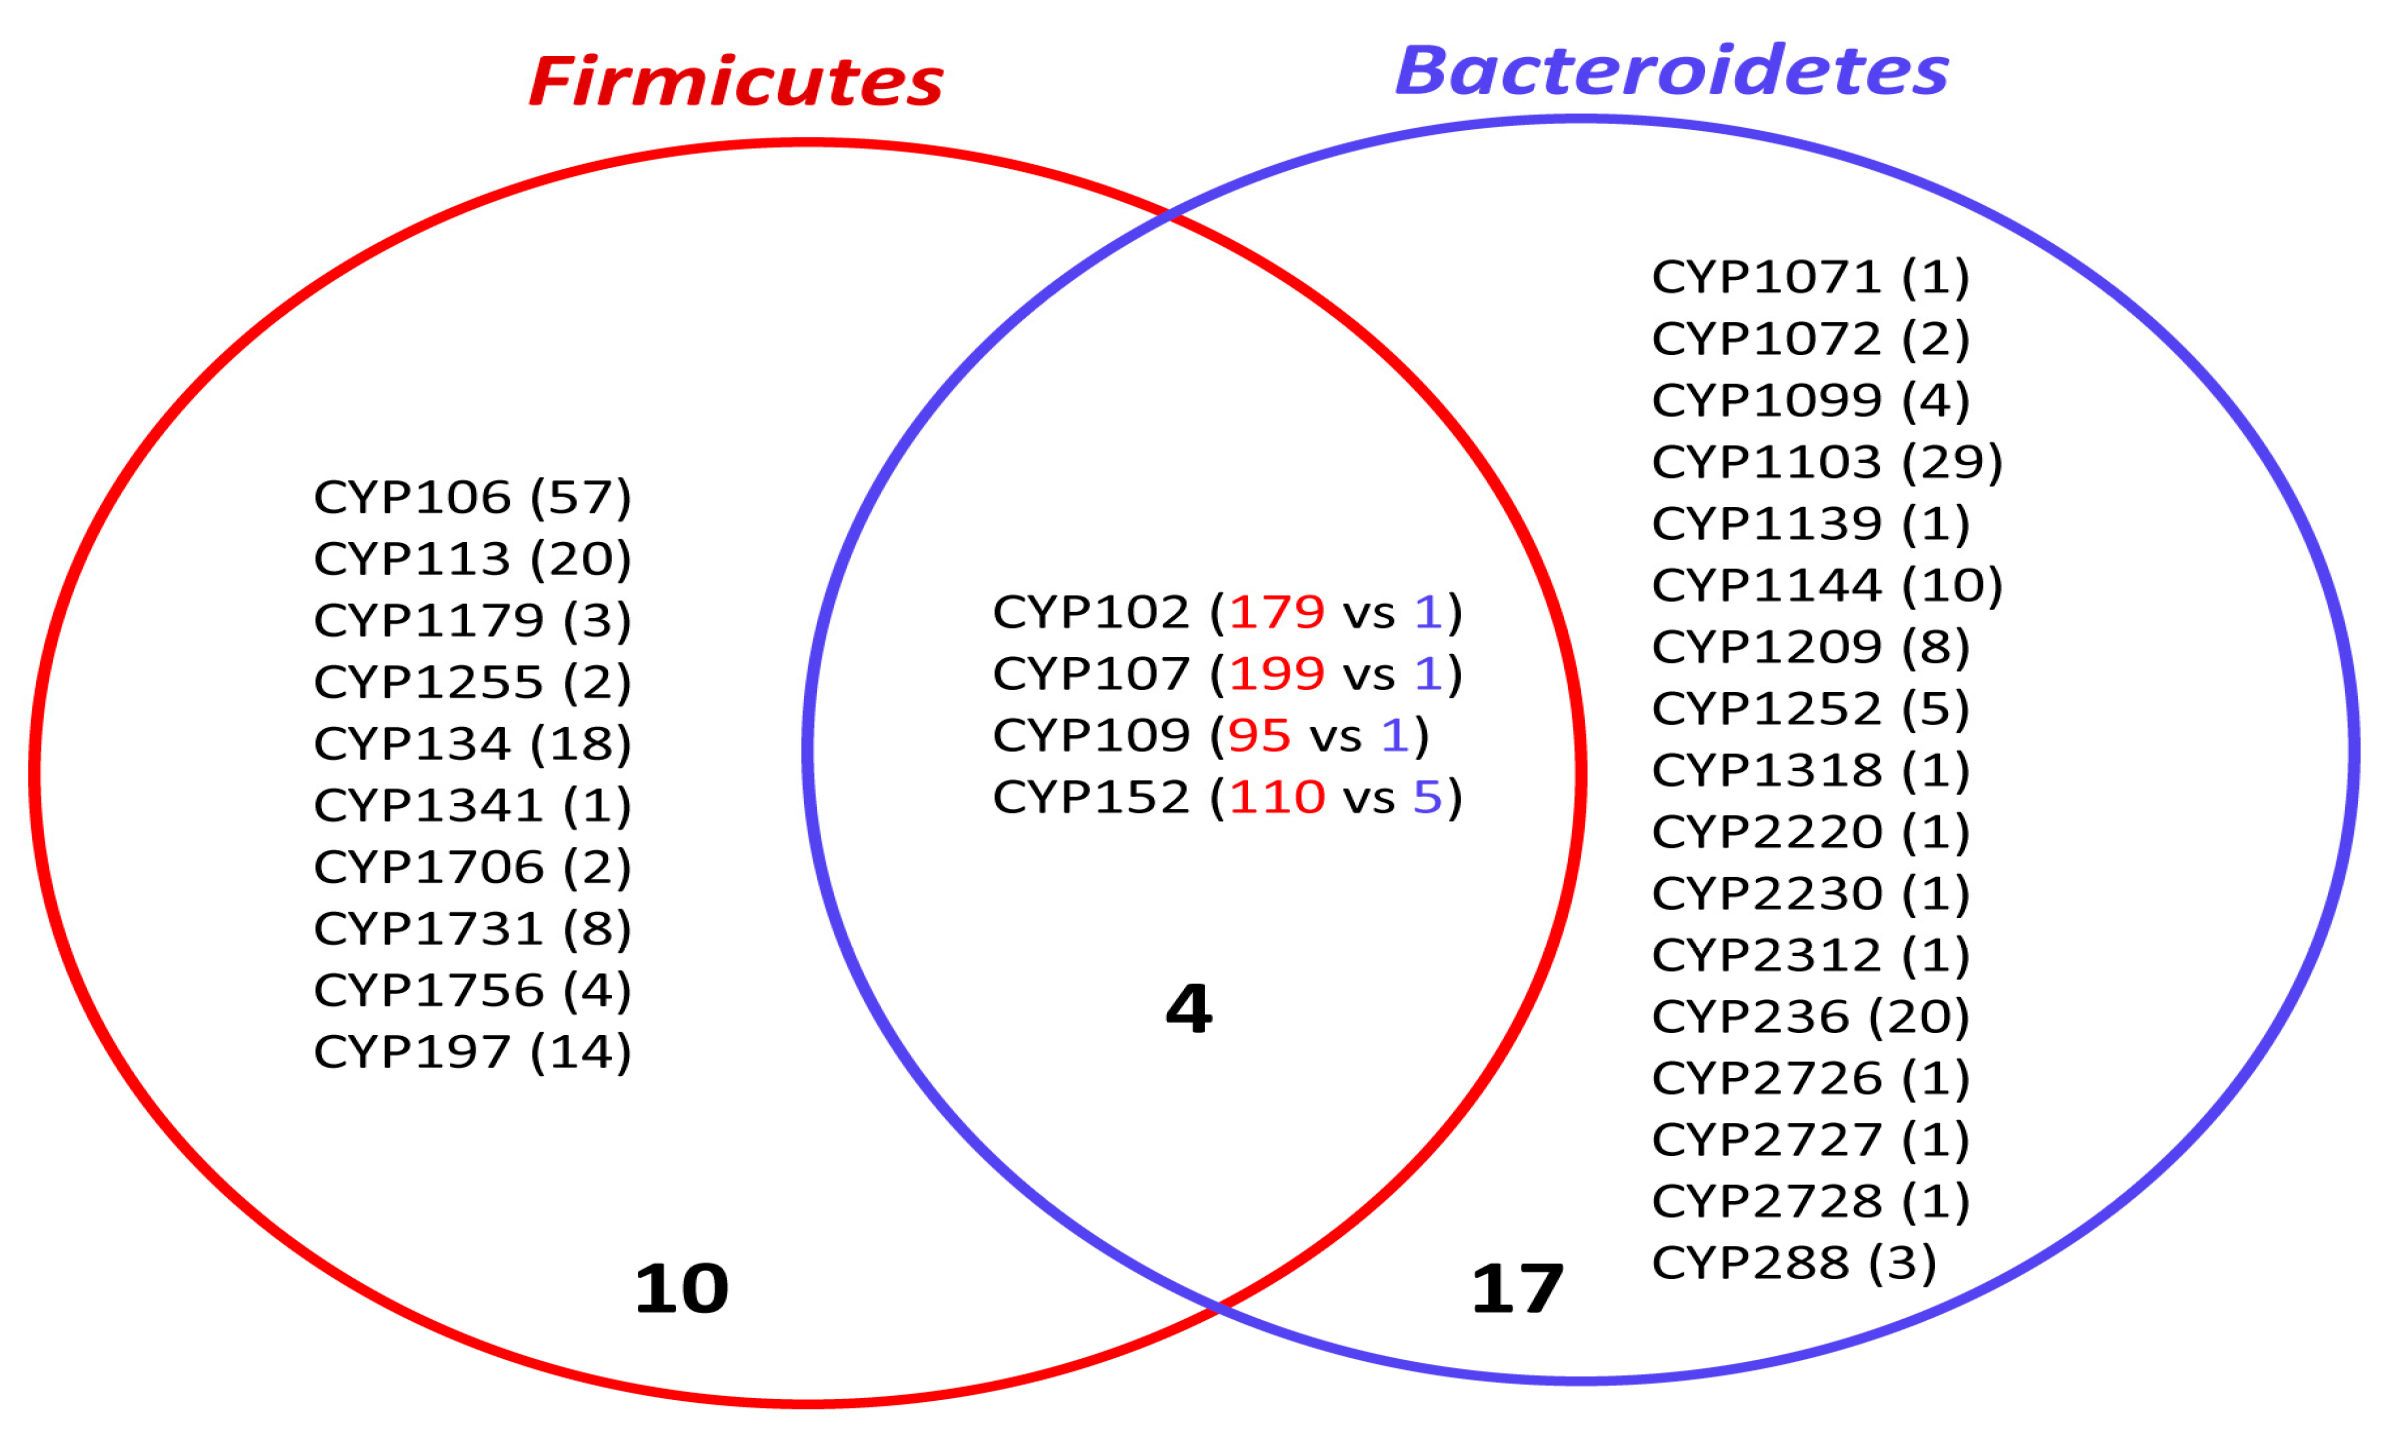
2.3. Bacteroidetes-, and Firmicutes-Species Have Diverse P450 Families in Their Genome

The P450 family level comparative analysis revealed that only four P450 families are commonly shared between Bacteroidetes- and Firmicutes-species (Figure 4), indicating these two bacterial groups have a diverse set of P450s in their genomes. In addition to this, the number of members in the commonly shared P450 families was found to be highly expanded in Firmicutes species, whereas in Bacteroidetes species, one (CYP102, CYP107, CYP109) to five members (CYP152) are present (Figure 4). This suggests that these two bacterial groups have different P450s in their genomes, indicating that P450s play different roles in their physiology, including producing different secondary metabolites.

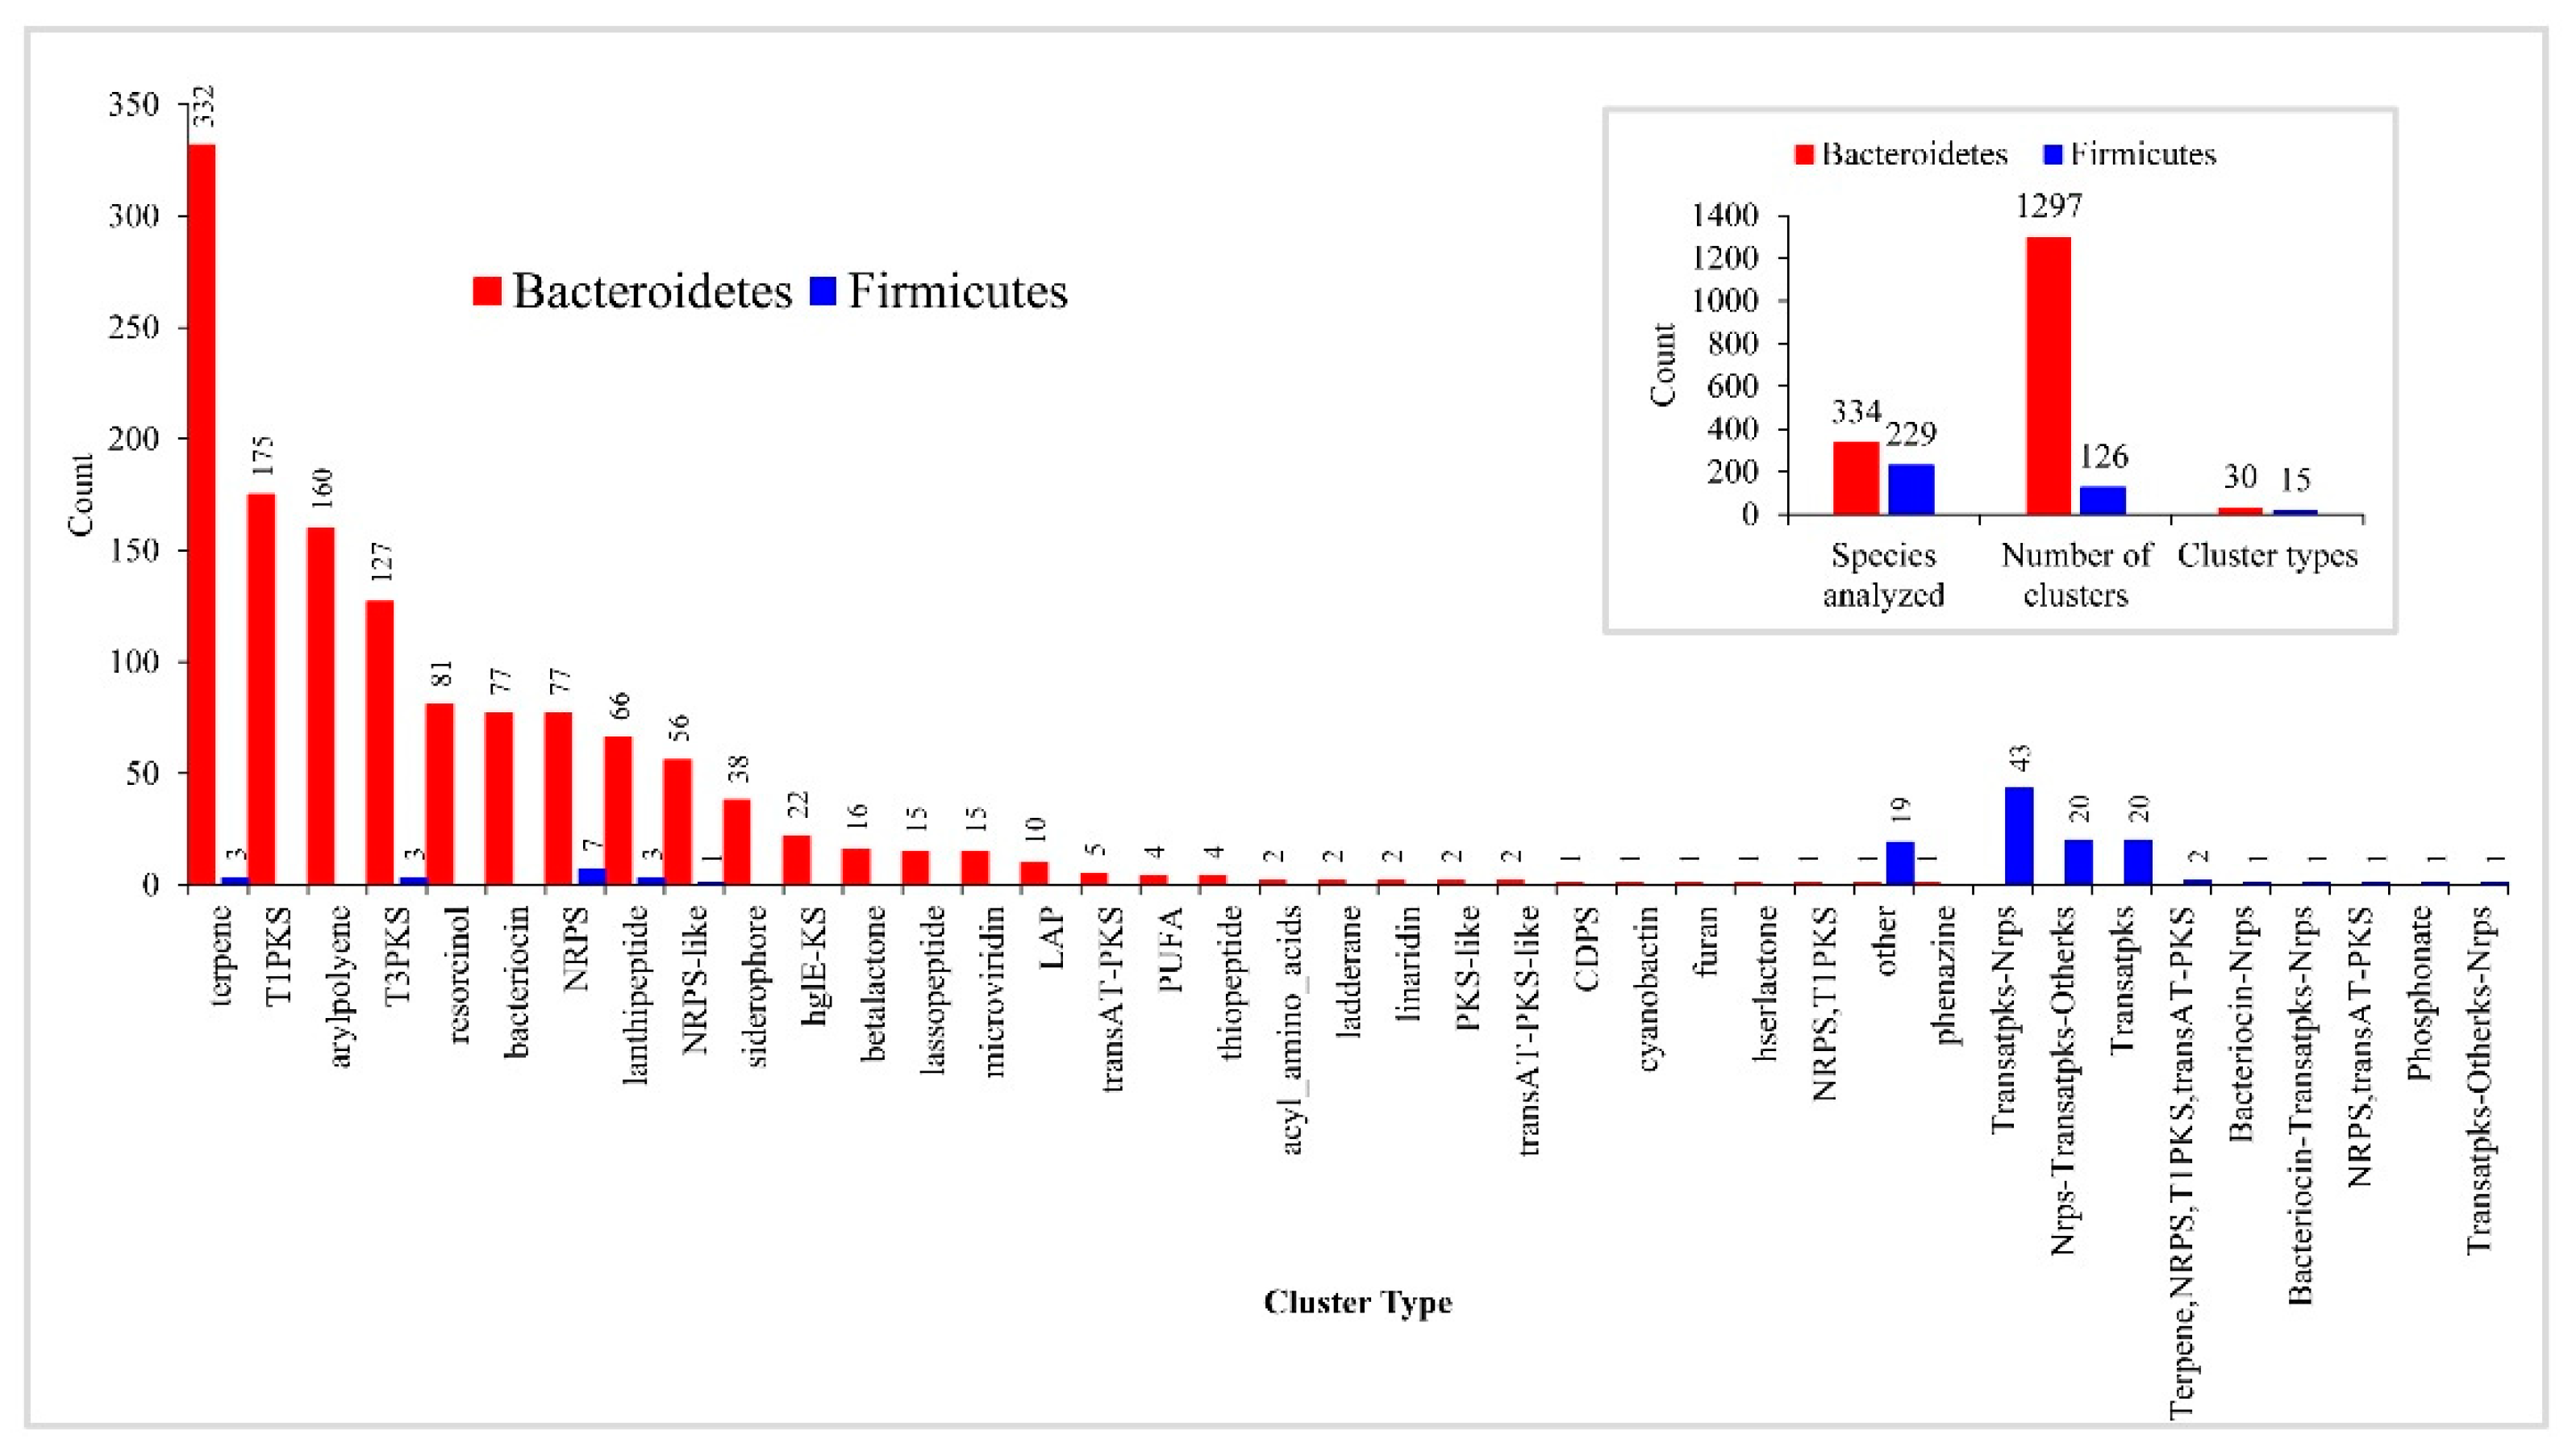
2.4. Bacteroidetes Species Have a Large and Diverse Number of Secondary Metabolite BGCs

The analysis of secondary metabolite biosynthetic gene clusters (smBGCs) revealed many smBGCs in Bacteroidetes species compared to Firmicutes species (Figure 5). In total, 269 Bacteroidetes species have 1297 smBGCs, with an average of 4.8 smBGCs in their genome, whereas 229 Firmicutes species have 126 smBGCs, with an average of 0.5 smBGCs in their genome, indicating the lowest number of smBGCs in Firmicutes species. This suggests that Bacteroidetes species produce more secondary metabolites compared to Firmicutes species. Analysis of smBGCs revealed the presence of 30 cluster types in Bacteroidetes species, compared to only 15 cluster types in Firmicutes species (Figure 5). This further indicates that Bacteroidetes species produce numerous highly diverse secondary metabolites compared to Firmicutes species.
Among 30 types of smBGCs found in Bacteroidetes species, terpene was dominant, followed by T1PKS (Type I PKS (Polyketide synthase)), arylpolyene (Aryl polyene cluster), T3PKS (Type III PKS) (Figure 5). Altogether, these four cluster types contribute to 60% of smBGCs in Bacteroidetes species (Figure 5). Among 15 types of smBGCs found in Firmicutes species, Transatpks-Nrps (Trans-AT PKS- Non-ribosomal peptide synthetase cluster) was dominant, followed by Nrps-Transatpks-Otherks and Transatpks (Figure 5). The smBGCs abbreviations used here are the standard abbreviations that were proposed by anti-SMASH [56].
The comparative analysis of cluster types revealed that Bacteroidetes species and Firmicutes species only share six cluster types, indicating the distinct nature of smBGCs between these two bacterial groups (Figure 5). However, the number of smBGCs in these six cluster types was found to be very different between these species. In the case of the terpene cluster type, 332 smBGCs were found in Bacteroidetes species, whereas only three smBGCs were found in Firmicutes species. The difference was also evident for cluster types T3PKS, NRPS, lanthipeptide, and NRPS-like, where many smBGCs were found in Bacteroidetes species. In contrast, smBGCs were limited to a single digit in Firmicutes species (Figure 5). Most of the smBGCs have no similarity to known smBGCs, indicating Bacteroidetes species smBGCs encode novel secondary metabolites.
Considering the above facts, we propose that the contrasting effects of these two bacterial groups on hosts and organisms are partly due to the distinct nature of secondary metabolites produced by these organisms.

2.5. Bacteroidetes Species P450s Has a Minor Role in Secondary Metabolism

Analysis of the P450s part of smBGCs revealed that only eight P450s (8%) are part of these clusters (Table 4), indicating P450s play a minor role in secondary metabolism in Bacteroidetes species. In contrast to Bacteroidetes species’ P450s, 18% of Firmicutes species’ P450s were part of smBGCs (Table 2), indicating Firmicutes species P450s play a significant role in secondary metabolism. The percentage of the P450s part of smBGCs in Bacteroidetes species was found to be the lowest compared to other bacterial groups (Table 2). Out of the 21 P450 families, only 5 formed part of the smBGCs in Bacteroidetes species (Table 4). Among these families, four members were from the CYP1209 family. Only a single member from each of the P450 families, CYP109, CYP109, CYP1139, and CYP1318, was part of smBGCs (Table 4). The connection between Bacteroidetes species’ P450 families and secondary metabolite cluster type revealed that the P450 family CYP1209 is mainly associated with biosynthetic gene cluster terpene (Table 4). Two P450s, CYP109 and CYP107, from the same species, Chitinophaga pinensis, were part of different cluster types (Table 4), indicating their association in producing different secondary metabolites.

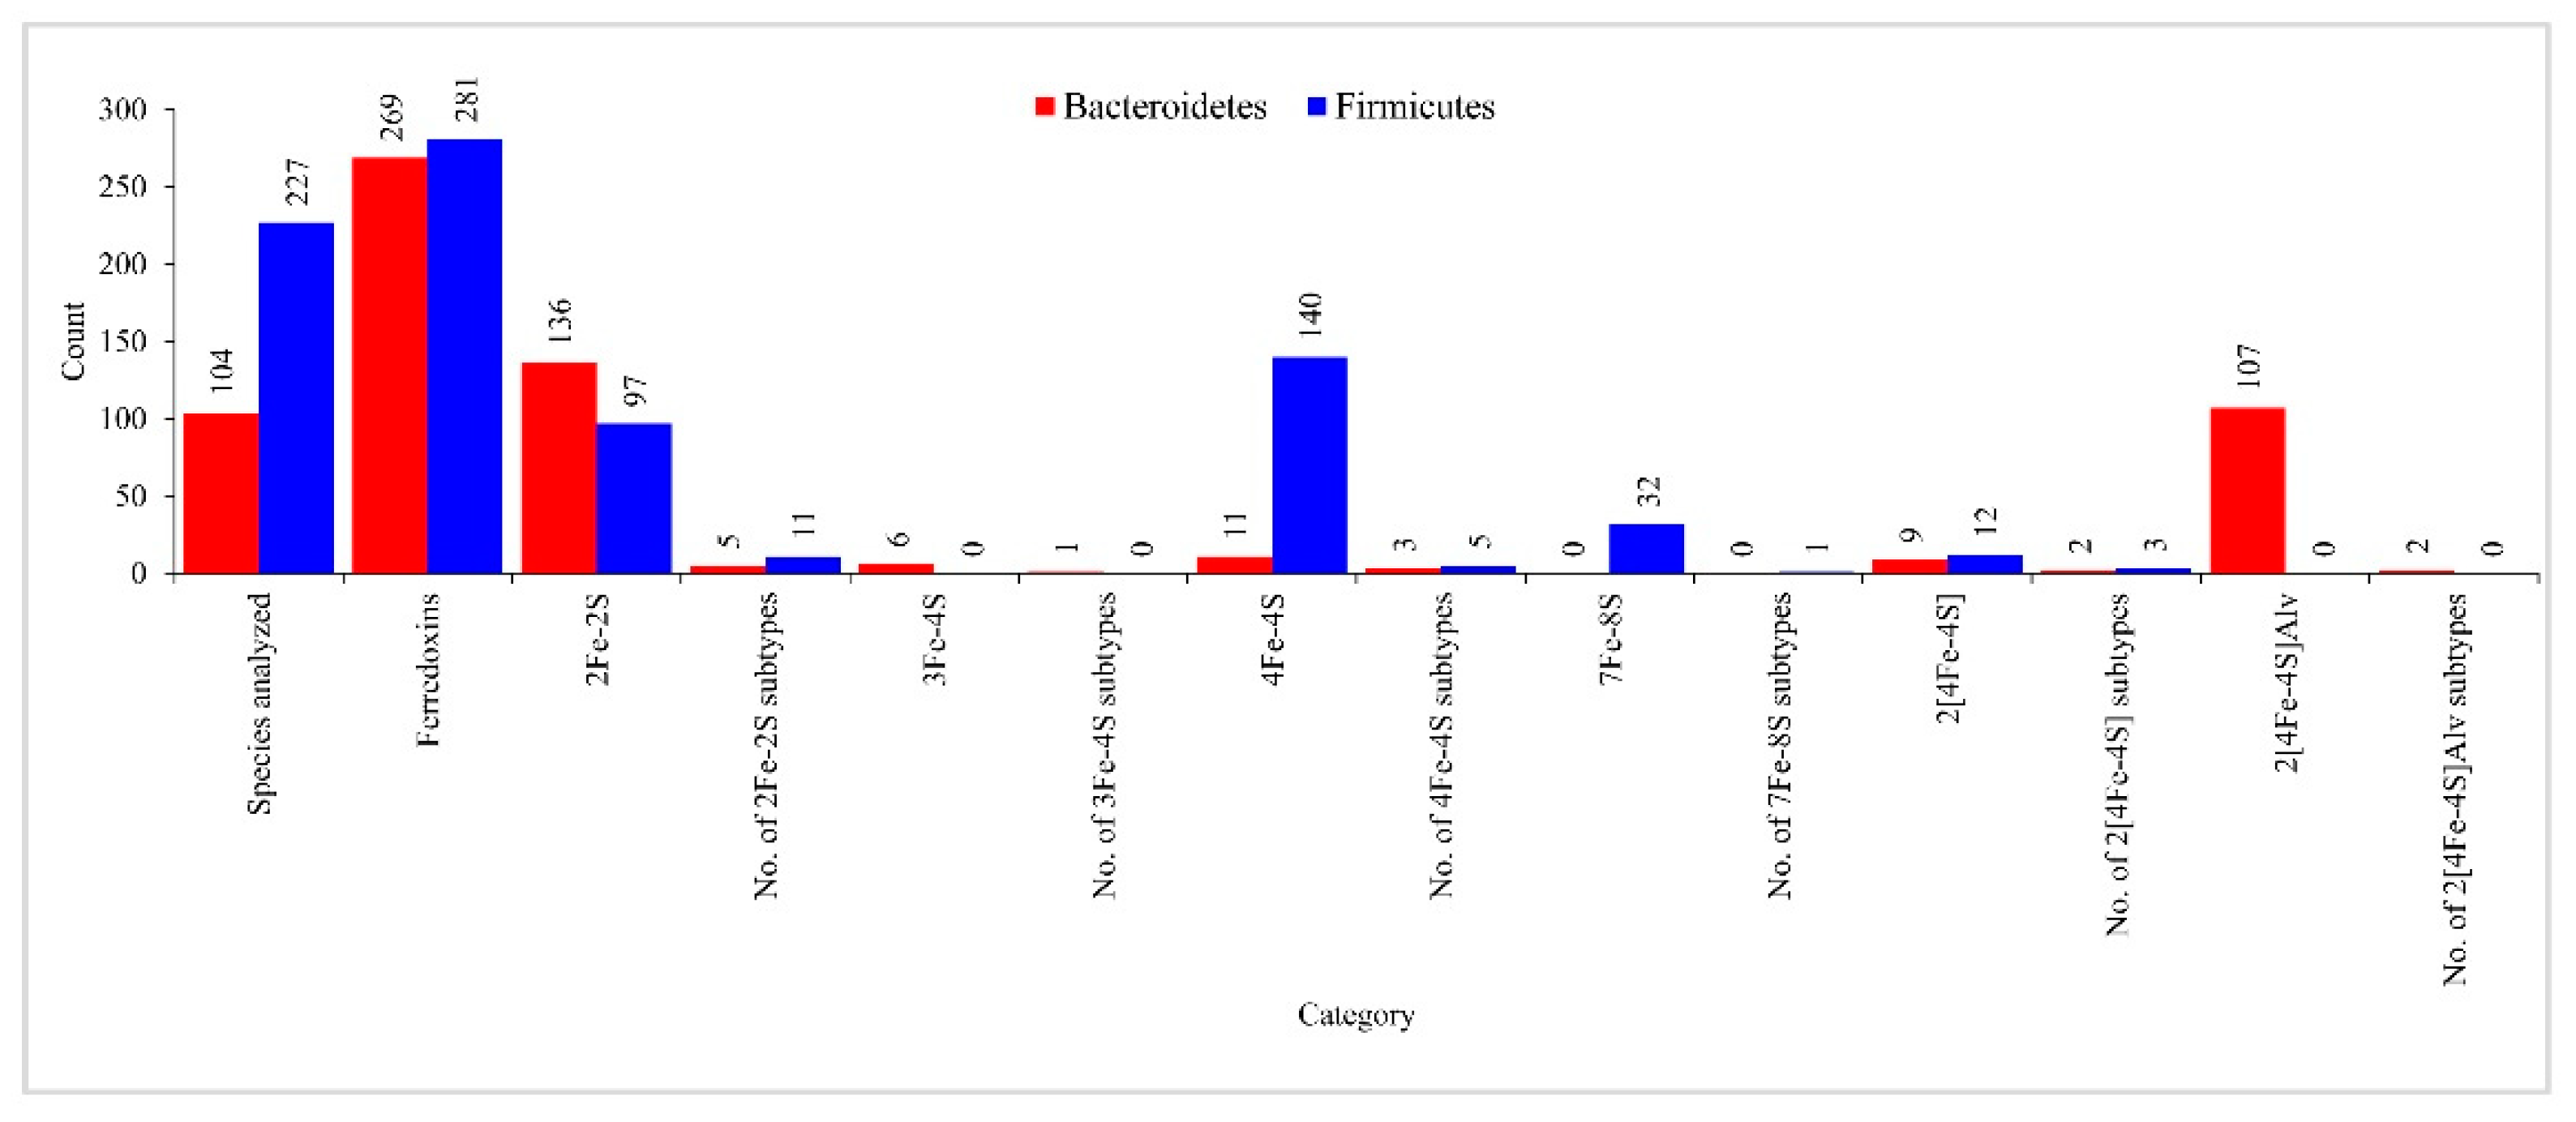
2.6. Bacteroidetes- and Firmicutes-Species Have Highly Diverse Ferredoxins in Their Genomes

Genome data mining and annotation of ferredoxins in 104 Bacteroidetes species revealed the presence of 269 ferredoxins in their genomes (Figure 6 and Table S2). Among Bacteroidetes species, Tenacibaculum jejuense has the highest number of six ferredoxins (Table S2). Bacteroidetes species were found to have double the number of ferredoxins in their genomes compared to Firmicutes species, as the average number of ferredoxins was found to be 2.6 in Bacteroidetes species compared to 1.2 in Firmicutes species [30]. The 269 ferredoxins found in Bacteroidetes species can be grouped into five Fe-S cluster types: 2Fe-2S, 3Fe-4S, 4Fe-4S, 2[4Fe-4S], and 2[4Fe-4S]Alv (Figure 6 and Table S2). 7Fe-8S cluster-type ferredoxins were not found in Bacteroidetes species analyzed in this study. Of the five Fe-S cluster types found in Bacteroidetes species, the 2Fe-2S was the most abundant, with 136 ferredoxins, followed by 2[4Fe-4S]Alv, with 107 ferredoxins (Figure 6). In comparison to Bacteroidetes species, Firmicutes species had only four Fe-S cluster types, such as 2Fe-2S, 4Fe-4S, 7Fe-8S, 2[4Fe-4S], in their genomes (Figure 6), indicating the absence of 3Fe-4S and 2[4Fe-4S]Alv Fe-S cluster ferredoxins. Further differences were observed concerning the number of ferredoxins in the common Fe-S cluster types found in these two bacterial groups (Figure 6). Bacteroidetes species have more 2Fe-2S cluster ferredoxins, whereas Firmicutes species have more 4Fe-4S and 2[4Fe-4S] cluster ferredoxins (Figure 6). Overall, 4Fe-4S cluster-type ferredoxins and 2[4Fe-4S]Alv cluster-type ferredoxins were most abundant in Firmicutes species and Bacteroidetes species, respectively (Figure 6). This suggests that these two bacterial groups have different preferences for Fe-S cluster type.
Based on the amino acid spacing pattern analysis between the cysteine amino acids of the Fe-S cluster binding motif [31], 136 and 97 2Fe-2S ferredoxins of Bacteroidetes and Firmicutes species can be grouped into 5 and 11 subtypes (Figure 6 and Table S3). Among Bacteroidetes species 2Fe-2S ferredoxin subtypes, subtype 18 has the most ferredoxins, followed by subtype 4 (Figure 6), indicating these species highly prefer subtype 18 ferredoxins. The comparative analysis revealed that three subtypes were shared between the Bacteroidetes species and the Firmicutes species (Figure 6), suggesting the common ancestral origin of these ferredoxin subtypes [31]. Six 3Fe-4S ferredoxins found in Bacteroidetes species can be grouped into a single subtype 8 (Table S3).
Eleven 4Fe-4S ferredoxins found in Bacteroidetes species can be grouped into three subtypes (Figure 6 and Table S3). Of the three subtypes, subtype 13 ferredoxins were found in higher numbers (Table S3). Contrary to the 2Fe-2S ferredoxin subtypes, no common 4Fe-4S subtypes were found between these two bacterial groups (Figure 6), indicating that 4Fe-4S ferredoxins are highly diverse in these two bacterial groups. Nine 2[4Fe-4S] ferredoxins found in Bacteroidetes species can be grouped into two subtypes (Table S3). Of the two subtypes, subtype 34 ferredoxins were found in higher numbers (Table S3). There were no common 2[4Fe-4S] subtypes between these two bacterial groups (Table S3). The 107 2[4Fe-4S]Alv ferredoxins of Bacteroidetes species were grouped into two subtypes (Table S3). Of the two subtypes, subtype 11 has more ferredoxins than subtype 12 (Table S3). Ferredoxin sequences identified in this study and their subtypes were presented in Supplementary Dataset S2.

3. Materials and Methods

3.1. Species and Database

Genomes for 334 Bacteroidetes species, available for public use at Kyoto Encyclopedia of Genes and Genomes (KEGG) [6], were used in the study for data mining of P450s, ferredoxins, and smBGCs. Information on genera, species names, species codes, and their genome IDs is presented in Table S1.

3.2. Genome Data Mining and Annotation of P450s

Genome data mining and annotation of P450s were carried out using the standard procedure described previously by our laboratory [30,39]. Briefly, the proteome of each Bacteroidetes species was acquired from KEGG [6] and submitted to the NCBI Batch Web CD-Search Tool [57]. The result was analyzed and proteins that belong to the P450 superfamily were selected and searched for the presence of characteristic P450 motifs, EXXR, and CXG [58,59]. Proteins that were short in amino acid length and lacked one of the motifs were regarded as P450 fragments, and these P450 fragments were not considered for further analysis. The selected P450s were annotated (assigning the P450 family and P450 subfamily) following the International P450 Nomenclature Committee rules [53,54,55]. Proteins with a percentage identity greater than 55% were classified under the same subfamily, whereas those with a percentage identity greater than 40% were classified under the same family. Proteins with a percentage identity lower than 40% were classified under a new family.

3.3. Genome Data Mining and Annotation of Ferredoxins

Genome data mining and annotation of ferredoxins in Bacteroidetes species with P450s were carried out using the procedure recently published by our laboratory [31]. Briefly, each of the Bacteroidetes species genomes was blasted using ferredoxins belonging to different Fe-S cluster types (Table S4), and the hit protein sequences were collected. The hit protein sequences were then subjected to protein BLAST at the National Center for Biotechnology and Information (NCBI) [60] against the Protein Data Bank (PDB) database [61] and analyzed for the presence of characteristic motif of ferredoxins at the Pfam database [62], InterPro database [63], and NCBI Conserved Domains Database (C.D.D.) [64]. Proteins that had a hit against ferredoxins at the PDB database and have ferredoxin motifs, as indicated by different databases, were selected for further annotation. Annotation of ferredoxins (assigning Fe-S cluster subtypes) was carried out based on the characteristic spacing patterns between cysteine amino acids of the Fe-S cluster-binding motif as described previously [31]. Ferredoxins belonging to the new subtypes were assigned a unique subtype number in par with the continuation of ferredoxin subtype numbers published for the species of Alphaproteobacteria and Firmicutes [31]. Some Bacteroidetes species ferredoxins were retrieved from the published article [65] and annotated into different subtypes. These Bacteroidetes species names and their ferredoxins are indicated in Table S2.

3.4. Phylogenetic Analysis of P450s

Phylogenetic analysis of P450s was carried out following the procedure described recently by our laboratory [30,39]. The phylogenetic tree of P450s was constructed using protein sequences (Supplementary Dataset S1). Firstly, the MAFFT v6.864 [66] was used to align the Trex web server’s protein sequences [67]. The alignments were then used to interpret the best tree by the Trex web server [67]. Lastly, a web-based tool, VisuaLife, was used to create, visualize, and color the tree [68].

3.5. Generation of P450 Profile Heat-Maps

The generation of the heat map profile was carried out according to the method previously reported by our laboratory [30,39]. The data were represented as (−3) for P450 family/subtype absence (green) and (3) for P450 family/subtype presence (red). A tab-delimited file was imported into Mev (Multi-experiment viewer) [69]. Hierarchical clustering using a Euclidean distance metric was used to cluster the data. P450 families formed the vertical axis and Bacteroidetes species formed the horizontal axis.

3.6. smBGCs Analysis and P450s Identification

smBGCs and the P450s part of the smBGCs were carried out following the procedure described by our laboratory [30,38]. Briefly, genome IDs of Bacteroidetes species (Table S1) were submitted to anti-SMASH (antibiotics & Secondary Metabolite Analysis Shell) [56] for the identification of secondary metabolite BGCs. Anti-SMASH results were downloaded in gene cluster sequences and Excel spreadsheets representing species-wise cluster information. P450s that formed part of a specific gene cluster were identified by manual data mining of gene cluster sequences. Standard gene cluster abbreviation terminology available in the anti-SMASH database [56] was maintained in this study.

3.7. Data Analysis

All calculations were carried out following the procedure reported previously by our laboratory [39]. The average number of P450s was calculated using the formula: Average number of P450s = Number of P450s/Number of species. The P450 diversity percentage was calculated using the formula: P450 diversity percentage = 100 × Total number of P450 families/Total number of P450s × Number of species with P450s. The percentage of P450s that formed part of BGCs was calculated using the formula: Percentage of P450s part of BGCs = 100 × Number of P450s part of BGCs/Total number of P450s present in species.

3.8. Comparative Analysis of P450s, Ferredoxins, and smBGCs Data

P450s, ferredoxins, and smBGCs data for Firmicutes species were retrieved from published articles [30,31] and used for comparative analysis. Ferredoxins proteins used for data mining were retrieved from published articles [70,71,72,73,74,75,76,77,78,79,80,81,82,83,84].

4. Conclusions

Each organism belonging to a particular group is different because it has a characteristic gene pool that is ultimately responsible for its behavior. This study attempts to understand the gene pools of two different bacterial groups, Bacteroidetes and Firmicutes, that make up more than 90% of the human gut and exert distinct effects on human health. Based on their distinct health effects, one can expect diversity in their gene pools. As expected, these two bacterial groups were found to have a diverse set of cytochrome P450 monooxygenases (CYPs/P450s) and ferredoxins genes in their genome. Annotation and classification of P450s and ferredoxins revealed that Bacteroidetes species have more P450 families and ferredoxin subtypes than Firmicutes species. A point to note is that the Alvin ferredoxins (2[4Fe-4S]Alv) are expanded in Bacteroidetes species, although this is not observed in Firmicutes and Alphaproteobacterial species. This indicates gene pool diversity in these two sets of genes in these organisms. Furthermore, very few P450s were found to be part of secondary metabolism in Bacteroidetes species compared to Firmicutes species. This study strongly supports the hypothesis put forward by our laboratory that organisms’ lifestyles influence the P450 contingent in their genomes. The commensal, pathogenic lifestyle of Bacteroidetes resulted in the loss of P450s in their genomes; a few species have P450s in this phylum. The same phenomenon was observed in Firmicutes species and Betaproteobacterial species. Analysis of secondary metabolites biosynthetic gene clusters (smBGCs) revealed that Bacteroidetes species have many cluster types compared to Firmicutes species, indicating that the former produces a more diverse array of secondary metabolites. Furthermore, the smBGCs in these two bacterial groups were distinct, indicating that these species produce different secondary metabolites and, as a result, distinct health effects on humans. A point to note is that, unlike Firmicutes species smBGCs [30], Bacteroidetes species smBGCs have less or almost no similarity to known smBGCs indicating these clusters encode novel secondary metabolites. Results from this study serve as a reference for further analysis of the gene pools and characterization of secondary metabolites from these two bacterial groups. This study is the first report on a comparative analysis of P450s, ferredoxins, and smBGCs between Bacteroidetes and Firmicutes species.

Supplementary Materials

Author Contributions

Conceptualization, K.S.; methodology, B.V.Z.N., T.P., D.G., D.R.N., and K.S.; software, B.V.Z.N., T.P., D.G., D.R.N., and K.S.; validation, B.V.Z.N., T.P., D.G., D.R.N., and K.S.; formal analysis, B.V.Z.N., T.P., D.G., D.R.N., and K.S.; investigation, B.V.Z.N., T.P., D.G., D.R.N., and K.S.; resources, K.S.; data curation, B.V.Z.N., T.P., D.G., D.R.N., and K.S.; writing—original draft preparation, B.V.Z.N., T.P., D.G., D.R.N., and K.S.; writing—review and editing, B.V.Z.N., T.P., D.G., D.R.N., and K.S.; visualization, B.V.Z.N., T.P., D.G., D.R.N., and K.S.; supervision, K.S.; project administration, K.S.; funding acquisition, K.S. All authors have read and agreed to the published version of the manuscript.

Funding

Khajamohiddin Syed expresses sincere gratitude to the University of Zululand (Grant number C686). Master student Bridget Valeria Zinhle Nkosi and Doctoral Student Tiara Padayachee thank the National Research Foundation (NRF), South Africa, for postgraduate scholarships (Grant numbers MND200527525406 and MND210504599108). Research in Dominik Gront’s laboratory is funded by the National Science Centre (Poland) 2018/29/B/ST6/01989.

Institutional Review Board Statement

Not applicable.

Informed Consent Statement

Not applicable.

Data Availability Statement

Not applicable.

Conflicts of Interest

The authors declare no conflict of interest and the funders had no role in the design of the study; in the collection, analyses, or interpretation of data; in the writing of the manuscript, or in the decision to publish the results.

References

  1. Lapébie, P.; Lombard, V.; Drula, E.; Terrapon, N.; Henrissat, B. Bacteroidetes use thousands of enzyme combinations to break down glycans. Nat. Commun. 2019, 10, 2043. [Google Scholar] [CrossRef] [PubMed]
  2. McKee, L.S.; La Rosa, S.L.; Westereng, B.; Eijsink, V.G.; Pope, P.B.; Larsbrink, J. Polysaccharide degradation by the Bacteroidetes: Mechanisms and nomenclature. Environ. Microbiol. Rep. 2021, 13, 559–581. [Google Scholar] [CrossRef] [PubMed]
  3. Larsbrink, J.; McKee, L.S. Bacteroidetes bacteria in the soil: Glycan acquisition, enzyme secretion, and gliding motility. Adv. Appl. Microbiol. 2020, 110, 63–98. [Google Scholar] [PubMed]
  4. Johnson, E.; Heaver, S.; Walters, W.; Ley, R. Microbiome and metabolic disease: Revisiting the bacterial phylum Bacteroidetes. J. Mol. Med. 2017, 95, 1–8. [Google Scholar] [CrossRef] [Green Version]
  5. Khan, I.; Bai, Y.; Zha, L.; Ullah, N.; Ullah, H.; Shah, S.R.H.; Sun, H.; Zhang, C. Mechanism of the Gut Microbiota Colonization Resistance and Enteric Pathogen Infection. Front. Cell. Infect. Microbiol. 2021, 11, 1273. [Google Scholar] [CrossRef] [PubMed]
  6. Kanehisa, M.; Sato, Y.; Furumichi, M.; Morishima, K.; Tanabe, M. New approach for understanding genome variations in KEGG. Nucleic Acids Res. 2019, 47, D590–D595. [Google Scholar] [CrossRef] [Green Version]
  7. Maria Carmen, C.; Seppo, S.; Vinderola, G. Chapter 11-Postbiotics: Defining the impact of inactivated microbes and their metabolites on promotion of health. In The Human Microbiome in Early Life; Koren, O., Rautava, S., Eds.; Academic Press: Cambridge, CA, USA, 2021; pp. 257–268. [Google Scholar]
  8. Thomas, F.; Barbeyron, T.; Michel, G. Evaluation of reference genes for real-time quantitative PCR in the marine flavobacterium Zobellia galactanivorans. J. Microbiol. Methods 2011, 84, 61–66. [Google Scholar] [CrossRef] [PubMed]
  9. Rojas, J.; Ambika Manirajan, B.; Ratering, S.; Suarez, C.; Schnell, S. Draft Genome Sequences of Spirosoma agri KCTC 52727 and Spirosoma terrae KCTC 52035. Microbiol. Resour. Announc. 2020, 9, e00317–e00320. [Google Scholar] [CrossRef] [PubMed]
  10. Bokhari, S.; Abbas, N.; Singh, M.; Cindrich, R.B.; Zeana, C. Empedobacter brevis bacteremia in a patient infected with HIV: Case report and review of literature. Case Rep. Infect. Dis. 2015, 2015, 813528. [Google Scholar] [PubMed] [Green Version]
  11. Sharma, D.; Patel, A.; Soni, P.; Sharma, P.; Gupta, B. Empedobacter brevis meningitis in a neonate: A very rare case of neonatal meningitis and literature review. Case Rep. Pediatr. 2016, 2016, 7609602. [Google Scholar] [PubMed] [Green Version]
  12. Shanson, D.C. Microbiology in Clinical Practice; Butterworth-Heinemann: Oxford, UK, 2014. [Google Scholar]
  13. Kämpfer, P.; Matthews, H.; Glaeser, S.P.; Martin, K.; Lodders, N.; Faye, I. Elizabethkingia anophelis sp. nov., isolated from the midgut of the mosquito Anopheles gambiae. Int. J. Syst. Evol. Microbiol. 2011, 61, 2670–2675. [Google Scholar] [CrossRef]
  14. Gershenzon, J.; Dudareva, N. The function of terpene natural products in the natural world. Nat. Chem. Biol. 2007, 3, 408–414. [Google Scholar] [CrossRef] [PubMed]
  15. Belimov, A.; Hontzeas, N.; Safronova, V.; Demchinskaya, S.; Piluzza, G.; Bullitta, S.; Glick, B. Cadmium-tolerant plant growth-promoting bacteria associated with the roots of Indian mustard (Brassica juncea L. Czern.). Soil Biol. Biochem. 2005, 37, 241–250. [Google Scholar] [CrossRef]
  16. Katz, L.; Baltz, R.H. Natural product discovery: Past, present, and future. J. Ind. Microbiol. Biotechnol. 2016, 43, 155–176. [Google Scholar] [CrossRef]
  17. McBride, M.J.; Xie, G.; Martens, E.C.; Lapidus, A.; Henrissat, B.; Rhodes, R.G.; Goltsman, E.; Wang, W.; Xu, J.; Hunnicutt, D.W. Novel features of the polysaccharide-digesting gliding bacterium Flavobacterium johnsoniae as revealed by genome sequence analysis. Appl. Environ. Microbiol. 2009, 75, 6864–6875. [Google Scholar] [CrossRef] [PubMed] [Green Version]
  18. Schöner, T.A.; Fuchs, S.W.; Schönau, C.; Bode, H.B. Initiation of the flexirubin biosynthesis in Chitinophaga pinensis. Microb. Biotechnol. 2014, 7, 232–241. [Google Scholar] [CrossRef] [PubMed]
  19. Chaudhary, D.K.; Dahal, R.H.; Kim, D.-U.; Kim, J. Flavobacterium sandaracinum sp. nov., Flavobacterium caseinilyticum sp. nov., and Flavobacterium hiemivividum sp. nov., novel psychrophilic bacteria isolated from Arctic soil. Int. J. Syst. Evol. Microbiol. 2020, 70, 2269–2280. [Google Scholar] [CrossRef]
  20. Walsh, C.J.; Guinane, C.M.; Hill, C.; Ross, R.P.; O’Toole, P.W.; Cotter, P.D. In silico identification of bacteriocin gene clusters in the gastrointestinal tract, based on the Human Microbiome Project’s reference genome database. BMC Microbiol. 2015, 15, 183. [Google Scholar] [CrossRef] [PubMed] [Green Version]
  21. Zhou, K.; Bao, Y.; Zhao, G. Effects of dietary crude protein and tannic acid on rumen fermentation, rumen microbiota and nutrient digestion in beef cattle. Arch. Anim. Nutr. 2019, 73, 30–43. [Google Scholar] [CrossRef]
  22. Rinninella, E.; Raoul, P.; Cintoni, M.; Franceschi, F.; Miggiano, G.A.D.; Gasbarrini, A.; Mele, M.C. What is the healthy gut microbiota composition? A changing ecosystem across age, environment, diet, and diseases. Microorganisms 2019, 7, 14. [Google Scholar] [CrossRef] [Green Version]
  23. Stojanov, S.; Berlec, A.; Štrukelj, B. The influence of probiotics on the firmicutes/bacteroidetes ratio in the treatment of obesity and inflammatory bowel disease. Microorganisms 2020, 8, 1715. [Google Scholar] [CrossRef] [PubMed]
  24. Manor, O.; Dai, C.L.; Kornilov, S.A.; Smith, B.; Price, N.D.; Lovejoy, J.C.; Gibbons, S.M.; Magis, A.T. Health and disease markers correlate with gut microbiome composition across thousands of people. Nat. Commun. 2020, 11, 5206. [Google Scholar] [CrossRef] [PubMed]
  25. Magne, F.; Gotteland, M.; Gauthier, L.; Zazueta, A.; Pesoa, S.; Navarrete, P.; Balamurugan, R. The firmicutes/bacteroidetes ratio: A relevant marker of gut dysbiosis in obese patients? Nutrients 2020, 12, 1474. [Google Scholar] [CrossRef] [PubMed]
  26. Mahowald, M.A.; Rey, F.E.; Seedorf, H.; Turnbaugh, P.J.; Fulton, R.S.; Wollam, A.; Shah, N.; Wang, C.; Magrini, V.; Wilson, R.K. Characterizing a model human gut microbiota composed of members of its two dominant bacterial phyla. Proc. Natl. Acad. Sci. USA 2009, 106, 5859–5864. [Google Scholar] [CrossRef] [Green Version]
  27. Ravcheev, D.A.; Thiele, I. Comparative genomic analysis of the human gut microbiome reveals a broad distribution of metabolic pathways for the degradation of host-synthetized mucin glycans and utilization of mucin-derived monosaccharides. Front. Genet. 2017, 8, 111. [Google Scholar] [CrossRef] [Green Version]
  28. Medvecky, M.; Cejkova, D.; Polansky, O.; Karasova, D.; Kubasova, T.; Cizek, A.; Rychlik, I. Whole genome sequencing and function prediction of 133 gut anaerobes isolated from chicken caecum in pure cultures. BMC Genom. 2018, 19, 561. [Google Scholar] [CrossRef] [Green Version]
  29. Almeida, A.; Mitchell, A.L.; Boland, M.; Forster, S.C.; Gloor, G.B.; Tarkowska, A.; Lawley, T.D.; Finn, R.D. A new genomic blueprint of the human gut microbiota. Nature 2019, 568, 499–504. [Google Scholar] [CrossRef] [Green Version]
  30. Padayachee, T.; Nzuza, N.; Chen, W.; Nelson, D.R.; Syed, K. Impact of lifestyle on cytochrome P450 monooxygenase repertoire is clearly evident in the bacterial phylum Firmicutes. Sci. Rep. 2020, 10, 13982. [Google Scholar] [CrossRef]
  31. Nzuza, N.; Padayachee, T.; Chen, W.; Gront, D.; Nelson, D.R.; Syed, K. Diversification of Ferredoxins across Living Organisms. Curr. Issues Mol. Biol. 2021, 43, 1374–1390. [Google Scholar] [CrossRef]
  32. Nelson, D.R. Cytochrome P450 diversity in the tree of life. Biochim. Biophys. Acta Proteins Proteom. 2018, 1866, 141–154. [Google Scholar] [CrossRef]
  33. Lamb, D.C.; Follmer, A.H.; Goldstone, J.V.; Nelson, D.R.; Warrilow, A.G.; Price, C.L.; True, M.Y.; Kelly, S.L.; Poulos, T.L.; Stegeman, J.J. On the occurrence of cytochrome P450 in viruses. Proc. Natl. Acad. Sci. USA 2019, 116, 12343–12352. [Google Scholar] [CrossRef] [PubMed] [Green Version]
  34. Syed, K.; Shale, K.; Pagadala, N.S.; Tuszynski, J. Systematic identification and evolutionary analysis of catalytically versatile cytochrome P450 monooxygenase families enriched in model basidiomycete fungi. PLoS ONE 2014, 9, e86683. [Google Scholar] [CrossRef] [PubMed]
  35. Khumalo, M.J.N.N.; Padayachee, T.; Chen, W.; Yu, J.-H.; Nelson, D.; Syed, K. Comprehensive analyses of cytochrome P450 monoxygenases and secondary metabolite biosynthetic gene clusters in Cyanobacteria. Int. J. Mol. Sci. 2020, 21, 656. [Google Scholar] [CrossRef] [Green Version]
  36. Kgosiemang, I.K.R.; Syed, K.; Mashele, S.S. Comparative genomics and evolutionary analysis of cytochrome P450 monooxygenases in fungal subphylum Saccharomycotina. J. Pure Appl. Microbiol. 2014, 8, 12. [Google Scholar]
  37. Ngwenya, M.L.; Chen, W.; Basson, A.K.; Shandu, J.S.; Yu, J.H.; Nelson, D.R.; Syed, K. Blooming of unusual cytochrome P450s by tandem duplication in the pathogenic fungus Conidiobolus coronatus. Int. J. Mol. Sci. 2018, 19, 1711. [Google Scholar] [CrossRef] [Green Version]
  38. Nzuza, N.; Padayachee, T.; Syed, P.R.; Kryś, J.D.; Chen, W.; Gront, D.; Nelson, D.R.; Syed, K. Ancient Bacterial Class Alphaproteobacteria Cytochrome P450 Monooxygenases Can Be Found in Other Bacterial Species. Int. J. Mol. Sci. 2021, 22, 5542. [Google Scholar] [CrossRef] [PubMed]
  39. Msomi, N.N.; Padayachee, T.; Nzuza, N.; Syed, P.R.; Kryś, J.D.; Chen, W.; Gront, D.; Nelson, D.R.; Syed, K. In silico analysis of P450s and their role in secondary metabolism in the bacterial class Gammaproteobacteria. Molecules 2021, 26, 1538. [Google Scholar] [CrossRef] [PubMed]
  40. Akapo, O.O.; Padayachee, T.; Chen, W.; Kappo, A.P.; Yu, J.H.; Nelson, D.R.; Syed, K. Distribution and Diversity of Cytochrome P450 Monooxygenases in the Fungal Class Tremellomycetes. Int. J. Mol. Sci. 2019, 20, 2889. [Google Scholar] [CrossRef] [PubMed] [Green Version]
  41. Qhanya, L.B.; Matowane, G.; Chen, W.; Sun, Y.; Letsimo, E.M.; Parvez, M.; Yu, J.H.; Mashele, S.S.; Syed, K. Genome-wide annotation and comparative analysis of cytochrome P450 monooxygenases in Basidiomycete biotrophic plant pathogens. PLoS ONE 2015, 10, e0142100. [Google Scholar]
  42. Malinga, N.A.; Nzuza, N.; Padayachee, T.; Syed, P.R.; Karpoormath, R.; Gront, D.; Nelson, D.R.; Syed, K. An Unprecedented Number of Cytochrome P450s Are Involved in Secondary Metabolism in Salinispora Species. Microorganisms 2022, 10, 871. [Google Scholar] [CrossRef]
  43. Chiliza, Z.E.; Martínez-Oyanedel, J.; Syed, K. An overview of the factors playing a role in cytochrome P450 monooxygenase and ferredoxin interactions. Biophys. Rev. 2020, 12, 1217–1222. [Google Scholar] [CrossRef] [PubMed]
  44. Li, S.; Du, L.; Bernhardt, R. Redox partners: Function modulators of bacterial P450 enzymes. Trends Microbiol. 2020, 28, 445–454. [Google Scholar] [CrossRef] [PubMed]
  45. Podust, L.M.; Sherman, D.H. Diversity of P450 enzymes in the biosynthesis of natural products. Nat. Prod. Rep. 2012, 29, 1251–1266. [Google Scholar] [CrossRef] [PubMed] [Green Version]
  46. Greule, A.; Stok, J.E.; De Voss, J.J.; Cryle, M.J. Unrivalled diversity: The many roles and reactions of bacterial cytochromes P450 in secondary metabolism. Nat. Prod. Rep. 2018, 35, 757–791. [Google Scholar] [CrossRef] [PubMed] [Green Version]
  47. Glowacki, R.W.; Martens, E.C. In sickness and health: Effects of gut microbial metabolites on human physiology. PLoS Pathog. 2020, 16, e1008370. [Google Scholar] [CrossRef] [Green Version]
  48. Sharon, G.; Garg, N.; Debelius, J.; Knight, R.; Dorrestein, P.C.; Mazmanian, S.K. Specialized metabolites from the microbiome in health and disease. Cell Metab. 2014, 20, 719–730. [Google Scholar] [CrossRef] [PubMed] [Green Version]
  49. Man, A.W.; Zhou, Y.; Xia, N.; Li, H. Involvement of gut microbiota, microbial metabolites and interaction with polyphenol in host immunometabolism. Nutrients 2020, 12, 3054. [Google Scholar] [CrossRef] [PubMed]
  50. Senate, L.M.; Tjatji, M.P.; Pillay, K.; Chen, W.; Zondo, N.M.; Syed, P.R.; Mnguni, F.C.; Chiliza, Z.E.; Bamal, H.D.; Karpoormath, R.; et al. Similarities, variations, and evolution of cytochrome P450s in Streptomyces versus Mycobacterium. Sci. Rep. 2019, 9, 3962. [Google Scholar] [CrossRef] [PubMed] [Green Version]
  51. Mnguni, F.C.; Padayachee, T.; Chen, W.; Gront, D.; Yu, J.-H.; Nelson, D.R.; Syed, K. More P450s are involved in secondary metabolite biosynthesis in Streptomyces compared to Bacillus, Cyanobacteria and Mycobacterium. Int. J. Mol. Sci. 2020, 21, 4814. [Google Scholar] [CrossRef] [PubMed]
  52. Parvez, M.; Qhanya, L.B.; Mthakathi, N.T.; Kgosiemang, I.K.; Bamal, H.D.; Pagadala, N.S.; Xie, T.; Yang, H.; Chen, H.; Theron, C.W.; et al. Molecular evolutionary dynamics of cytochrome P450 monooxygenases across kingdoms: Special focus on mycobacterial P450s. Sci. Rep. 2016, 6, 33099. [Google Scholar] [CrossRef] [PubMed] [Green Version]
  53. Nelson, D.R.; Kamataki, T.; Waxman, D.J.; Guengerich, F.P.; Estabrook, R.W.; Feyereisen, R.; Gonzalez, F.J.; Coon, M.J.; Gunsalus, I.C.; Gotoh, O.; et al. The P450 superfamily: Update on new sequences, gene mapping, accession numbers, early trivial names of enzymes, and nomenclature. DNA Cell Biol. 1993, 12, 1–51. [Google Scholar] [CrossRef] [PubMed]
  54. Nelson, D.R. Cytochrome P450 nomenclature, 2004. Methods Mol. Biol. 2006, 320, 1–10. [Google Scholar] [PubMed]
  55. Nelson, D.R. Cytochrome P450 nomenclature. Methods Mol. Biol. 1998, 107, 15–24. [Google Scholar] [PubMed]
  56. Blin, K.; Pascal Andreu, V.; de Los Santos, E.L.C.; Del Carratore, F.; Lee, S.Y.; Medema, M.H.; Weber, T. The antiSMASH database version 2: A comprehensive resource on secondary metabolite biosynthetic gene clusters. Nucleic Acids Res. 2019, 47, D625–D630. [Google Scholar] [CrossRef] [PubMed] [Green Version]
  57. Marchler-Bauer, A.; Bo, Y.; Han, L.; He, J.; Lanczycki, C.J.; Lu, S.; Chitsaz, F.; Derbyshire, M.K.; Geer, R.C.; Gonzales, N.R.; et al. CDD/SPARCLE: Functional classification of proteins via subfamily domain architectures. Nucleic Acids Res. 2017, 45, D200–D203. [Google Scholar] [CrossRef] [PubMed] [Green Version]
  58. Gotoh, O. Substrate recognition sites in cytochrome P450 family 2 (CYP2) proteins inferred from comparative analyses of amino acid and coding nucleotide sequences. J. Biol. Chem. 1992, 267, 83–90. [Google Scholar] [CrossRef]
  59. Syed, K.; Mashele, S.S. Comparative analysis of P450 signature motifs EXXR and CXG in the large and diverse kingdom of fungi: Identification of evolutionarily conserved amino acid patterns characteristic of P450 family. PLoS ONE 2014, 9, e95616. [Google Scholar]
  60. Sayers, E.W.; Beck, J.; Bolton, E.E.; Bourexis, D.; Brister, J.R.; Canese, K.; Comeau, D.C.; Funk, K.; Kim, S.; Klimke, W. Database resources of the national center for biotechnology information. Nucleic Acids Res. 2021, 49, D10. [Google Scholar] [CrossRef]
  61. wwPDB Consortium. Protein Data Bank: The single global archive for 3D macromolecular structure data. Nucleic Acids Res. 2019, 47, D520–D528. [Google Scholar] [CrossRef] [Green Version]
  62. El-Gebali, S.; Mistry, J.; Bateman, A.; Eddy, S.R.; Luciani, A.; Potter, S.C.; Qureshi, M.; Richardson, L.J.; Salazar, G.A.; Smart, A. The Pfam protein families database in 2019. Nucleic Acids Res. 2019, 47, D427–D432. [Google Scholar] [CrossRef]
  63. Mitchell, A.L.; Attwood, T.K.; Babbitt, P.C.; Blum, M.; Bork, P.; Bridge, A.; Brown, S.D.; Chang, H.-Y.; El-Gebali, S.; Fraser, M.I. InterPro in 2019: Improving coverage, classification and access to protein sequence annotations. Nucleic Acids Res. 2019, 47, D351–D360. [Google Scholar] [CrossRef] [PubMed] [Green Version]
  64. Lu, S.; Wang, J.; Chitsaz, F.; Derbyshire, M.K.; Geer, R.C.; Gonzales, N.R.; Gwadz, M.; Hurwitz, D.I.; Marchler, G.H.; Song, J.S. CDD/SPARCLE: The conserved domain database in 2020. Nucleic Acids Res. 2020, 48, D265–D268. [Google Scholar] [CrossRef] [PubMed] [Green Version]
  65. Campbell, I.J.; Bennett, G.N.; Silberg, J.J. Evolutionary relationships between low potential ferredoxin and flavodoxin electron carriers. Front. Energy Res. 2019, 7, 79. [Google Scholar] [CrossRef] [PubMed] [Green Version]
  66. Katoh, K.; Kuma, K.; Toh, H.; Miyata, T. MAFFT version 5: Improvement in accuracy of multiple sequence alignment. Nucleic Acids Res. 2005, 33, 511–518. [Google Scholar] [CrossRef] [PubMed]
  67. Boc, A.; Diallo, A.B.; Makarenkov, V. T-REX: A web server for inferring, validating and visualizing phylogenetic trees and networks. Nucleic Acids Res. 2012, 40, W573–W579. [Google Scholar] [CrossRef] [PubMed] [Green Version]
  68. Kryś, J.D.; Gront, D. VisuaLife: Library for interactive visualization in rich web applications. Bioinformatics 2021, 37, 3662–3663. [Google Scholar] [CrossRef] [PubMed]
  69. Howe, E.A.; Sinha, R.; Schlauch, D.; Quackenbush, J. RNA-Seq analysis in MeV. Bioinformatics 2011, 27, 3209–3210. [Google Scholar] [CrossRef] [Green Version]
  70. Cai, K.; Tonelli, M.; Frederick, R.O.; Markley, J.L. Human Mitochondrial Ferredoxin 1 (FDX1) and Ferredoxin 2 (FDX2) Both Bind Cysteine Desulfurase and Donate Electrons for Iron–Sulfur Cluster Biosynthesis. Biochemistry 2017, 56, 487–499. [Google Scholar] [CrossRef]
  71. Pochapsky, T.C.; Jain, N.U.; Kuti, M.; Lyons, T.A.; Heymont, J. A Refined Model for the Solution Structure of Oxidized Putidaredoxin. Biochemistry 1999, 38, 4681–4690. [Google Scholar] [CrossRef]
  72. Koksharova, O.A.; Klint, J.; Rasmussen, U. The first protein map of Synechococcus sp. strain PCC 7942. Microbiology 2006, 75, 664–672. [Google Scholar] [CrossRef]
  73. Lau, I.C.; Feyereisen, R.; Nelson, D.R.; Bell, S.G. Analysis and preliminary characterisation of the cytochrome P450 monooxygenases from Frankia sp. EuI1c (Frankia inefficax sp.). Arch. Biochem. Biophys. 2019, 669, 11–21. [Google Scholar] [CrossRef] [PubMed]
  74. Child, S.A.; Bradley, J.M.; Pukala, T.L.; Svistunenko, D.A.; Le Brun, N.E.; Bell, S.G. Electron transfer ferredoxins with unusual cluster binding motifs support secondary metabolism in many bacteria. Chem. Sci. 2018, 9, 7948–7957. [Google Scholar] [CrossRef] [PubMed] [Green Version]
  75. Bentley, S.D.; Chater, K.F.; Cerdeño-Tárraga, A.-M.; Challis, G.L.; Thomson, N.R.; James, K.D.; Harris, D.E.; Quail, M.A.; Kieser, H.; Harper, D.; et al. Complete genome sequence of the model actinomycete Streptomyces coelicolor A3(2). Nature 2002, 417, 141–147. [Google Scholar] [CrossRef] [PubMed]
  76. Ugalde, S.O.; de Koning, C.P.; Wallraven, K.; Bruyneel, B.; Vermeulen, N.P.E.; Grossmann, T.N.; Bitter, W.; Commandeur, J.N.M.; Vos, J.C. Linking cytochrome P450 enzymes from Mycobacterium tuberculosis to their cognate ferredoxin partners. Appl. Microbiol. Biotechnol. 2018, 102, 9231–9242. [Google Scholar] [CrossRef] [PubMed] [Green Version]
  77. McLean, K.J.; Warman, A.J.; Seward, H.E.; Marshall, K.R.; Girvan, H.M.; Cheesman, M.R.; Waterman, M.R.; Munro, A.W. Biophysical characterization of the sterol demethylase P450 from Mycobacterium tuberculosis, its cognate ferredoxin, and their interactions. Biochemistry 2006, 45, 8427–8443. [Google Scholar] [CrossRef] [PubMed]
  78. Frazão, C.; Aragão, D.; Coelho, R.; Leal, S.S.; Gomes, C.M.; Teixeira, M.; Carrondo, M.A. Crystallographic analysis of the intact metal centres [3Fe–4S] 1+/0 and [4Fe–4S] 2+/1+ in a Zn2+-containing ferredoxin. FEBS Lett. 2008, 582, 763–767. [Google Scholar] [CrossRef] [Green Version]
  79. Macedo-Ribeiro, S.; Martins, B.M.; Pereira, P.B.; Buse, G.; Huber, R.; Soulimane, T. New insights into the thermostability of bacterial ferredoxins: High-resolution crystal structure of the seven-iron ferredoxin from Thermus thermophilus. JBIC J. Biol. Inorg. Chem. 2001, 6, 663–674. [Google Scholar] [CrossRef]
  80. Saridakis, E.; Giastas, P.; Efthymiou, G.; Thoma, V.; Moulis, J.-M.; Kyritsis, P.; Mavridis, I.M. Insight into the protein and solvent contributions to the reduction potentials of [4Fe–4S] 2+/+ clusters: Crystal structures of the Allochromatium vinosum ferredoxin variants C57A and V13G and the homologous Escherichia coli ferredoxin. JBIC J. Biol. Inorg. Chem. 2009, 14, 783–799. [Google Scholar] [CrossRef]
  81. Dauter, Z.; Wilson, K.S.; Sieker, L.C.; Meyer, J.; Moulis, J.-M. Atomic resolution (0.94 Å) structure of Clostridium acidurici ferredoxin. Detailed geometry of [4Fe-4S] clusters in a protein. Biochemistry 1997, 36, 16065–16073. [Google Scholar] [CrossRef]
  82. Saeki, K.; Suetsugu, Y.; Tokuda, K.-I.; Miyatake, Y.; Young, D.; Marrs, B.; Matsubara, H. Genetic analysis of functional differences among distinct ferredoxins in Rhodobacter capsulatus. J. Biol. Chem. 1991, 266, 12889–12895. [Google Scholar] [CrossRef]
  83. Moulis, J.M.; Sieker, L.C.; Wilson, K.S.; Dauter, Z. Crystal structure of the 2 [4Fe-4S] ferredoxin from Chromatium vinosum: Evolutionary and mechanistic inferences for [3/4Fe-4S] ferredoxins. Protein Sci. 1996, 5, 1765–1775. [Google Scholar] [CrossRef] [PubMed] [Green Version]
  84. Unciuleac, M.; Boll, M.; Warkentin, E.; Ermler, U. Crystallization of 4-hydroxybenzoyl-CoA reductase and the structure of its electron donor ferredoxin. Acta Crystallogr. Sect. D Biol. Crystallogr. 2004, 60, 388–391. [Google Scholar] [CrossRef] [PubMed]
Figure 1. Analysis of P450s in Bacteroidetes species. The number next to the bar indicates the count for that category. Detailed analysis of the species, genera, and P450s are presented in Table S1.
Ijms 23 05057 g001
Figure 2. Phylogenetic analysis of Bacteroidetes species P450s. The P450 families that are expanded in these species are displayed in different colors.
Ijms 23 05057 g002
Figure 3. Analysis of P450 family absence/presence and co-occurrence in Bacteroidetes species. The data have been represented as −3 for family absence (green) and 3 for family presence (red). There are 77 Bacteroidetes species that form the horizontal axis, and 21 P450 families form the vertical axis.
Ijms 23 05057 g003
Figure 4. Comparative analysis of P450 families between Bacteroidetes- and Firmicutes-species. The number in parenthesis indicates the number of members in a P450 family. The numbers indicated with red and blue colors represent the P450 family count for Firmicutes- and Bacteroidetes-species, respectively. Numbers in bold indicate the number of P450 families.
Ijms 23 05057 g004
Figure 5. Comparative analysis of secondary metabolite biosynthetic gene clusters (smBGCs) between Bacteroidetes- and Firmicutes-species. The main panel compares cluster types and the inset panel represents overall features between these two bacterial groups. The number next to the bar indicates the count for that category. The cluster type names and abbreviations used in the figure are the standard abbreviations proposed by anti-SMASH [56].
Ijms 23 05057 g005
Figure 6. Comparative analysis of ferredoxins iron–sulfur (Fe-S) cluster features between Bacteroidetes- and Firmicutes-species. The number next to the bar indicates the count for that category.
Ijms 23 05057 g006
Table 1. Secondary metabolites produced by Bacteroidetes species and their biological functions.
Species (Source)Secondary MetaboliteBiological FunctionReferences
Spirosoma spp. and Sphingobacterium sp. 21TerpeneNeuroprotective, anti-tumorigenic, and anti-inflammatory[9,14]
Flavobacterium spp.SiderophoreIron scavenger and transporter[15]
Spirosoma spp.; Pedobacter cryoconitis; Sphingobacterium sp. 21 and Chitinophaga pinesisT1PKSUseful as agrochemical and pharmaceutical compounds[9,16]
Chinophaga pinesis; Flavobacterium johnsoniae UW10ArylpolyeneShields bacteria from reactive oxidation[17,18]
Spirosoma spp.; Flavobacterium spp.T3PKSInvolved in hypocrellin and kanamycin synthesis[9,19]
Spirosoma spp.; Bacteroides spp.BacteriocinAnti-bacterial activity[9,20]
Prevotella spp.ResorcinolUsed to treat skin disorders[21]
Spirosoma spp.NRPsAntibiotic, immunosuppressant, and cytotoxic properties[9]
Spirosoma spp.LanthipeptideAntimicrobial, antifungal, and antiviral activities[9]
Table 2. Comparative analysis of key features of P450s and their association with secondary metabolism between Bacteroidetes species and different bacterial species. Abbreviations: No.: number, BGCs: biosynthetic gene clusters.
Bacteroidetes SpeciesFirmicutes SpeciesGammaproteobacterial SpeciesStreptomyces SpeciesMycobacterial SpeciesCyanobacterial Species
Total no. of species analyzed3349721 26120360114
No. of species with P450s7722916920360114
No. of P450s9871227754601784341
No. of families2114842537736
No. of subfamilies285310569813279
Dominant P450 familyCYP1103CYP107CYP133CYP107CYP125CYP110
Average no. of P450s130.227303
P450 diversity percentage0.280.010.180.020.070.09
No. of P450s part of BGCs812649123120427
Percentage of P450s part of BGCs8181823118
Reference(s)This work[30][39][50,51][50,52][35]
Table 3. Comparative analysis of P450 families and subfamilies in Bacteroidetes species.
P450 FamilyCountPercentageP450 SubfamilyCount
CYP11032930A13
B4
C12
CYP2362020A20
CYP11441010A10
CYP120988A6
C2
CYP125255A4
B1
CYP15255A1
A.P.3
AQ1
CYP109944A2
C2
CYP28833B3
CYP107222A2
CYP10211AQ1
CYP107111A1
CYP10711DB1
CYP10911AE1
CYP113911B1
CYP131811B1
CYP222011A1
CYP223011B1
CYP231211A1
CYP272611A1
CYP272711A1
CYP272811A1
Table 4. Comparative analysis of P450s involved in secondary metabolism in Bacteroidetes species. The cluster type names/abbreviations used in the table are the standard abbreviations proposed by anti-SMASH [56].
Species NameP450Cluster Type
Chitinophaga pinensisCYP109terpene
CYP107NRPS
Pedobacter cryoconitisCYP1139lanthipeptide
Sphingobacterium sp. 21CYP1318NRPS-like
Spirosoma lingualeCYP1209terpene
Spirosoma radiotoleransCYP1209terpene
Spirosoma montaniterraeCYP1209terpene
Spirosoma pollinicolaCYP1209terpene
Publisher’s Note: MDPI stays neutral with regard to jurisdictional claims in published maps and institutional affiliations.

