
The Energy Transfer Yield between Carotenoids and Chlorophylls in Peridinin Chlorophyll a Protein Is Robust against Mutations


Abstract
:1. Introduction
2. Results and Discussion
3. Materials and Methods
4. Conclusions
Supplementary Materials
Author Contributions
Funding
Institutional Review Board Statement
Informed Consent Statement
Data Availability Statement
Acknowledgments
Conflicts of Interest
References
- Collini, E. Carotenoids in Photosynthesis: The Revenge of the “Accessory” Pigments. Chem 2019, 5, 494–495. [Google Scholar] [CrossRef] [Green Version]
- Hashimoto, H.; Uragami, C.; Yukihira, N.; Gardiner, A.T.; Cogdell, R.J. Understanding/Unravelling Carotenoid Excited Singlet States. J. R. Soc. Interface 2018, 15, 20180026. [Google Scholar] [CrossRef] [PubMed]
- Polívka, T.; Sundström, V. Ultrafast Dynamics of Carotenoid Excited States-from Solution to Natural and Artificial Systems. Chem. Rev. 2004, 104, 2021–2072. [Google Scholar] [CrossRef] [PubMed]
- Polívka, T.; Herek, J.L.; Zigmantas, D.; Åkerlund, H.E.; Sundström, V. Direct Observation of the (Forbidden) S1 State in Carotenoids. Proc. Natl. Acad. Sci. USA 1999, 96, 4914–4917. [Google Scholar] [CrossRef] [PubMed] [Green Version]
- Zigmantas, D.; Polfvka, T.; Killer, R.G.; Yartsev, A.; Sundstrom, V. Spectroscopic and Dynamic Properties of the Peridinin Lowest Singlet Excited States. J. Phys. Chem. A 2001, 105, 10296–10306. [Google Scholar] [CrossRef]
- Fiedor, L.; Heriyanto; Fiedor, J.; Pilch, M. Effects of Molecular Symmetry on the Electronic Transitions in Carotenoids. J. Phys. Chem. Lett. 2016, 7, 1821–1829. [Google Scholar] [CrossRef]
- Enriquez, M.M.; Hananoki, S.; Hasegawa, S.; Kajikawa, T.; Katsumura, S.; Wagner, N.L.; Birge, R.R.; Frank, H.A. Effect of Molecular Symmetry on the Spectra and Dynamics of the Intramolecular Charge Transfer (ICT) State of Peridinin. J. Phys. Chem. B 2012, 116, 10748–10756. [Google Scholar] [CrossRef] [Green Version]
- Niedzwiedzki, D.M.; Chatterjee, N.; Enriquez, M.M.; Kajikawa, T.; Hasegawa, S.; Katsumura, S.; Frank, H.A. Spectroscopic Investigation of Peridinin Analogues Having Different-Electron Conjugated Chain Lengths: Exploring the Nature of the Intramolecular Charge Transfer State. J. Phys. Chem. B 2009, 113, 13604–13612. [Google Scholar] [CrossRef] [Green Version]
- Kusumoto, T.; Horibe, T.; Kajikawa, T.; Hasegawa, S.; Iwashita, T.; Cogdell, R.J.; Birge, R.R.; Frank, H.A.; Katsumura, S.; Hashimoto, H. Stark Absorption Spectroscopy of Peridinin and Allene-Modified Analogues. Chem. Phys. 2010, 373, 71–79. [Google Scholar] [CrossRef] [Green Version]
- Zigmantas, D.; Hiller, R.G.; Sharples, F.P.; Frank, H.A.; Sundström, V.; Polívka, T. Effect of a Conjugated Carbonyl Group on the Photophysical Properties of Carotenoids. Phys. Chem. Chem. Phys. 2004, 6, 3009–3016. [Google Scholar] [CrossRef]
- Wagner, N.L.; Greco, J.A.; Enriquez, M.M.; Frank, H.A.; Birge, R.R. The Nature of the Intramolecular Charge Transfer State in Peridinin. Biophys. J. 2013, 104, 1314–1325. [Google Scholar] [CrossRef] [PubMed] [Green Version]
- Marcolin, G.; Collini, E. Solvent-Dependent Characterization of Fucoxanthin through 2D Electronic Spectroscopy Reveals New Details on the Intramolecular Charge-Transfer State Dynamics. J. Phys. Chem. Lett. 2021, 12, 4833–4840. [Google Scholar] [CrossRef] [PubMed]
- West, R.G.; Fuciman, M.; Staleva-Musto, H.; Šebelík, V.; Bína, D.; Durchan, M.; Kuznetsova, V.; Polívka, T. Equilibration Dependence of Fucoxanthin S1 and ICT Signatures on Polarity, Proticity, and Temperature by Multipulse Femtosecond Absorption Spectroscopy. J. Phys. Chem. B 2018, 122, 7264–7276. [Google Scholar] [CrossRef] [PubMed]
- Redeckas, K.; Voiciuk, V.; Vengris, M. Investigation of the S1/ICT Equilibrium in Fucoxanthin by Ultrafast Pump-Dump-Probe and Femtosecond Stimulated Raman Scattering Spectroscopy. Photosynth. Res. 2016, 128, 169–181. [Google Scholar] [CrossRef]
- Bautista, J.A.; Connors, R.E.; Raju, B.B.; Hiller, R.G.; Sharples, F.P.; Gosztola, D.; Wasielewski, M.R.; Frank, H.A. Excited State Properties of Peridinin: Observation of a Solvent Dependence of the Lowest Excited Singlet State Lifetime and Spectral Behavior Unique among Carotenoids. J. Phys. Chem. B 1999, 103, 8751–8758. [Google Scholar] [CrossRef]
- Polívka, T.; Sundström, V. Dark Excited States of Carotenoids: Consensus and Controversy. Chem. Phys. Lett. 2009, 477, 1–11. [Google Scholar] [CrossRef]
- Bonetti, C.; Alexandre, M.T.A.; Van Stokkum, I.H.M.; Hiller, R.G.; Groot, M.L.; Van Grondelle, R.; Kennis, J.T.M. Identification of Excited-State Energy Transfer and Relaxation Pathways in the Peridinin-Chlorophyll Complex: An Ultrafast Mid-Infrared Study. Phys. Chem. Chem. Phys. 2010, 12, 9256–9266. [Google Scholar] [CrossRef]
- Zigmantas, D.; Hiller, R.G.; Sundström, V.; Polívka, T. Carotenoid to Chlorophyll Energy Transfer in the Peridinin-Chlorophyll-a-Protein Complex Involves an Intramolecular Charge Transfer State. Proc. Natl. Acad. Sci. USA 2002, 99, 16760–16765. [Google Scholar] [CrossRef] [Green Version]
- Polívka, T.; Hofmann, E. Structure-Function Relationship in Peridinin-Chlorophyll Proteins. In The Structural Basis of Biological Energy Generation; Springer: Dordrecht, The Netherlands, 2014. [Google Scholar]
- Polívka, T.; Hiller, R.G.; Frank, H.A. Spectroscopy of the Peridinin-Chlorophyll-a Protein: Insight into Light-Harvesting Strategy of Marine Algae. Arch. Biochem. Biophys. 2007, 458, 111–120. [Google Scholar] [CrossRef]
- Cerullo, G.; Polli, D.; Lanzani, G.; De Silvestri, S.; Hashimoto, H.; Cogdell, R.J. Photosynthetic Light Harvesting by Carotenoids: Detection of an Intermediate Excited State. Science 2002, 298, 2395–2398. [Google Scholar] [CrossRef]
- Gradinaru, C.C.; Kennis, J.T.M.; Papagiannakis, E.; Van Stokkum, I.H.M.; Cogdell, R.J.; Fleming, G.R.; Niederman, R.A.; Van Grondelle, R. An Unusual Pathway of Excitation Energy Deactivation in Carotenoids: Singlet-to-Triplet Conversion on an Ultrafast Timescale in a Photosynthetic Antenna. Proc. Natl. Acad. Sci. USA 2001, 98, 2364. [Google Scholar] [CrossRef] [PubMed] [Green Version]
- Polli, D.; Cerullo, G.; Lanzani, G.; De Silvestri, S.; Yanagi, K.; Hashimoto, H.; Cogdell, R.J. Conjugation Length Dependence of Internal Conversion in Carotenoids: Role of the Intermediate State. Phys. Rev. Lett. 2004, 93, 163002. [Google Scholar] [CrossRef] [PubMed]
- Kosumi, D.; Yanagi, K.; Fujii, R.; Hashimoto, H.; Yoshizawa, M. Conjugation Length Dependence of Relaxation Kinetics in β-Carotene Homologs Probed by Femtosecond Kerr-Gate Fluorescence Spectroscopy. Chem. Phys. Lett. 2006, 425, 66–70. [Google Scholar] [CrossRef]
- Ostroumov, E.E.; Mulvaney, R.M.; Cogdell, R.J.; Scholes, G.D. Broadband 2D Electronic Spectroscopy Reveals a Carotenoid Dark State in Purple Bacteria. Science 2013, 340, 52–56. [Google Scholar] [CrossRef] [PubMed] [Green Version]
- Son, M.; Pinnola, A.; Bassi, R.; Schlau-Cohen, G.S. The Electronic Structure of Lutein 2 Is Optimized for Light Harvesting in Plants. Chem 2019, 5, 575–584. [Google Scholar] [CrossRef] [Green Version]
- Tavan, P.; Schulten, K. Electronic Excitations in Finite and Infinite Polyenes. Phys. Rev. B 1987, 36, 4337. [Google Scholar] [CrossRef]
- Toa, Z.S.D.; Degolian, M.H.; Jumper, C.C.; Hiller, R.G.; Scholes, G.D. Consistent Model of Ultrafast Energy Transfer in Peridinin Chlorophyll- A Protein Using Two-Dimensional Electronic Spectroscopy and Förster Theory. J. Phys. Chem. B 2019, 123, 6410–6420. [Google Scholar] [CrossRef]
- Ghosh, S.; Bishop, M.M.; Roscioli, J.D.; LaFountain, A.M.; Frank, H.A.; Beck, W.F. Excitation Energy Transfer by Coherent and Incoherent Mechanisms in the Peridinin-Chlorophyll a Protein. J. Phys. Chem. Lett. 2017, 8, 463–469. [Google Scholar] [CrossRef]
- Ghosh, S.; Roscioli, J.D.; Bishop, M.M.; Gurchiek, J.K.; Lafountain, A.M.; Frank, H.A.; Beck, W.F. Torsional Dynamics and Intramolecular Charge Transfer in the S2 (11Bu+) Excited State of Peridinin: A Mechanism for Enhanced Mid-Visible Light Harvesting. J. Phys. Chem. Lett. 2016, 7, 3621–3626. [Google Scholar] [CrossRef]
- Ghosh, S.; Bishop, M.M.; Roscioli, J.D.; Mueller, J.J.; Shepherd, N.C.; LaFountain, A.M.; Frank, H.A.; Beck, W.F. Femtosecond Heterodyne Transient-Grating Studies of Nonradiative Decay of the S2 (11Bu+) State of β-Carotene: Contributions from Dark Intermediates and Double-Quantum Coherences. J. Phys. Chem. B 2015, 119, 14905–14924. [Google Scholar] [CrossRef]
- Beck, W.F.; Bishop, M.M.; Roscioli, J.D.; Ghosh, S.; Frank, H.A. Excited State Conformational Dynamics in Carotenoids: Dark Intermediates and Excitation Energy Transfer. Arch. Biochem. Biophys. 2015, 572, 175–183. [Google Scholar] [CrossRef] [PubMed] [Green Version]
- Carbonera, D.; Valentin, M.; Spezia, R.; Mezzetti, A. The Unique Photophysical Properties of the Peridinin-Chlorophyll-a-Protein. Curr. Protein Pept. Sci. 2014, 15, 332–350. [Google Scholar] [CrossRef] [PubMed] [Green Version]
- Hofmann, E.; Wrench, P.M.; Sharples, F.P.; Hiller, R.G.; Welte, W.; Diederichs, K. Structural Basis of Light Harvesting by Carotenoids: Peridinin- Chlorophyll-Protein from Amphidinium Carterae. Science 1996, 272, 1788–1791. [Google Scholar] [CrossRef] [PubMed] [Green Version]
- Ilagan, R.P.; Shima, S.; Melkozernov, A.; Lin, S.; Blankenship, R.E.; Sharples, F.P.; Hiller, R.G.; Birge, R.R.; Frank, H.A. Spectroscopic Properties of the Main-Form and High-Salt Peridinin-Chlorophyll a Proteins from Amphidinium Carterae. Biochemistry 2004, 43, 1478–1487. [Google Scholar] [CrossRef] [PubMed]
- Krueger, B.P.; Lampoura, S.S.; Van Stokkum, I.H.M.; Papagiannakis, E.; Salverda, J.M.; Gradinaru, C.C.; Rutkauskas, D.; Hiller, R.G.; Van Grondelle, R. Energy Transfer in the Peridinin Chlorophyll-a Protein of Amphidinium Carterae Studied by Polarized Transient Absorption and Target Analysis. Biophys. J. 2001, 80, 2843–2855. [Google Scholar] [CrossRef] [Green Version]
- Bránczyk, A.M.; Turner, D.B.; Scholes, G.D.; Brańczyk, A.M.; Turner, D.B.; Scholes, G.D. Crossing Disciplines—A View on Two-Dimensional Optical Spectroscopy. Ann. Phys. 2014, 526, 31–49. [Google Scholar] [CrossRef] [Green Version]
- Collini, E. 2D Electronic Spectroscopic Techniques for Quantum Technology Applications. J. Phys. Chem. C 2021, 125, 13096–13108. [Google Scholar] [CrossRef]
- Gelzinis, A.; Augulis, R.; Butkus, V.; Robert, B.; Valkunas, L. Two-Dimensional Spectroscopy for Non-Specialists. Biochim. Biophys. Acta-Bioenerg. 2019, 1860, 271–285. [Google Scholar] [CrossRef]
- Roscioli, J.D.; Ghosh, S.; LaFountain, A.M.; Frank, H.A.; Beck, W.F. Quantum Coherent Excitation Energy Transfer by Carotenoids in Photosynthetic Light Harvesting. J. Phys. Chem. Lett. 2017, 8, 5141–5147. [Google Scholar] [CrossRef]
- Roscioli, J.D.; Ghosh, S.; LaFountain, A.M.; Frank, H.A.; Beck, W.F. Structural Tuning of Quantum Decoherence and Coherent Energy Transfer in Photosynthetic Light Harvesting. J. Phys. Chem. Lett. 2018, 9, 5071–5077. [Google Scholar] [CrossRef]
- Meneghin, E.; Volpato, A.; Cupellini, L.; Bolzonello, L.; Jurinovich, S.; Mascoli, V.; Carbonera, D.; Mennucci, B.; Collini, E. Coherence in Carotenoid-to-Chlorophyll Energy Transfer. Nat. Commun. 2018, 9, 3160. [Google Scholar] [CrossRef] [PubMed] [Green Version]
- Tilluck, R.W.; Ghosh, S.; Guberman-Pfeffer, M.J.; Roscioli, J.D.; Gurchiek, J.K.; LaFountain, A.M.; Frank, H.A.; Gascón, J.A.; Beck, W.F. Interexciton Nonradiative Relaxation Pathways in the Peridinin-Chlorophyll Protein. Cell Rep. Phys. Sci. 2021, 2, 100380. [Google Scholar] [CrossRef]
- Schulte, T.; Niedzwiedzki, D.M.; Birge, R.R.; Hiller, R.G.; Polívka, T.; Hofmann, E.; Frank, H.A. Identification of a Single Peridinin Sensing Chl-a Excitation in Reconstituted PCP by Crystallography and Spectroscopy. Proc. Natl. Acad. Sci. USA 2009, 106, 20764–20769. [Google Scholar] [CrossRef] [PubMed] [Green Version]
- Schulte, T.; Johanning, S.; Hofmann, E. Structure and Function of Native and Refolded Peridinin-Chlorophyll-Proteins from Dinoflagellates. Eur. J. Cell Biol. 2010, 89, 990–997. [Google Scholar] [CrossRef]
- Agostini, A.; Niklas, J.; Schulte, T.; Di Valentin, M.; Bortolus, M.; Hofmann, E.; Lubitz, W.; Carbonera, D. Changing the Site Energy of Per-614 in the Peridinin-Chlorophyll a-Protein Does Not Alter Its Capability of Chlorophyll Triplet Quenching. Biochim. Biophys. Acta-Bioenerg. 2018, 1859, 612–618. [Google Scholar] [CrossRef]
- Ferretti, M.; Hendrikx, R.; Romero, E.; Southall, J.; Cogdell, R.J.; Novoderezhkin, V.I.; Scholes, G.D.; van Grondelle, R. Dark States in the Light-Harvesting Complex 2 Revealed by Two-Dimensional Electronic Spectroscopy. Sci. Rep. 2016, 6, 20834. [Google Scholar] [CrossRef]
- Tollerud, J.O.; Davis, J.A. Coherent Multi-Dimensional Spectroscopy: Experimental Considerations, Direct Comparisons and New Capabilities. Prog. Quantum Electron. 2017, 55, 1–34. [Google Scholar] [CrossRef]
- Carbonera, D.; Giacometti, G.; Segre, U.; Hofmann, E.; Hiller, R.G. Structure-Based Calculations of the Optical Spectra of the Light-Harvesting Peridinin-Chlorophyll-Protein Complexes from Amphidinium Carterae and Heterocapsa Pygmaea. J. Phys. Chem. B 1999, 103, 6349–6356. [Google Scholar] [CrossRef]
- Guberman-Pfeffer, M.J.; Gascón, J.A. Carotenoid-Chlorophyll Interactions in a Photosynthetic Antenna Protein: A Supramolecular QM/MM Approach. Molecules 2018, 23, 2589. [Google Scholar] [CrossRef] [Green Version]
- Meneghin, E.; Leonardo, C.; Volpato, A.; Bolzonello, L.; Collini, E. Mechanistic Insight into Internal Conversion Process within Q-Bands of Chlorophyll A. Sci. Rep. 2017, 7, 11389. [Google Scholar] [CrossRef]
- Meneghin, E.; Pedron, D.; Collini, E. Raman and 2D Electronic Spectroscopies: A Fruitful Alliance for the Investigation of Ground and Excited State Vibrations in Chlorophyll A. Chem. Phys. 2018, 514, 132–140. [Google Scholar] [CrossRef] [Green Version]
- Volpato, A.; Bolzonello, L.; Meneghin, E.; Collini, E. Global Analysis of Coherence and Population Dynamics in 2D Electronic Spectroscopy. Opt. Express 2016, 24, 24773–24785. [Google Scholar] [CrossRef] [PubMed]
- Turner, D.B.; Dinshaw, R.; Lee, K.K.; Belsley, M.S.; Wilk, K.E.; Curmi, P.M.G.; Scholes, G.D. Quantitative Investigations of Quantum Coherence for a Light-Harvesting Protein at Conditions Simulating Photosynthesis. Phys. Chem. Chem. Phys. 2012, 14, 4857–4874. [Google Scholar] [CrossRef] [PubMed] [Green Version]
- Mangaud, E.; Lasorne, B.; Atabek, O.; Desouter-Lecomte, M. Statistical Distributions of the Tuning and Coupling Collective Modes at a Conical Intersection Using the Hierarchical Equations of Motion. J. Chem. Phys. 2019, 151, 244102. [Google Scholar] [CrossRef]
- Schnedermann, C.; Liebel, M.; Kukura, P. Mode-Specificity of Vibrationally Coherent Internal Conversion in Rhodopsin during the Primary Visual Event. J. Am. Chem. Soc. 2015, 137, 2886–2891. [Google Scholar] [CrossRef]
- Liebel, M.; Schnedermann, C.; Kukura, P. Vibrationally Coherent Crossing and Coupling of Electronic States during Internal Conversion in β-Carotene. Phys. Rev. Lett. 2014, 112, 198302. [Google Scholar] [CrossRef] [Green Version]
- Chen, L.; Gelin, M.F.; Chernyak, V.Y.; Domcke, W.; Zhao, Y. Dissipative Dynamics at Conical Intersections: Simulations with the Hierarchy Equations of Motion Method. Faraday Discuss. 2016, 194, 61–80. [Google Scholar] [CrossRef] [Green Version]
- Kish, E.; Mendes Pinto, M.M.; Bovi, D.; Basire, M.; Guidoni, L.; Vuilleumier, R.; Robert, B.; Spezia, R.; Mezzetti, A. Fermi Resonance as a Tool for Probing Peridinin Environment. J. Phys. Chem. B 2014, 118, 5873–5881. [Google Scholar] [CrossRef]
- Buckup, T.; Motzkus, M. Multidimensional Time-Resolved Spectroscopy of Vibrational Coherence in Biopolyenes. Annu. Rev. Phys. Chem. 2014, 65, 39–57. [Google Scholar] [CrossRef]
- Davis, J.A.; Cannon, E.; Van Dao, L.; Hannaford, P.; Quiney, H.M.; Nugent, K.A. Long-Lived Coherence in Carotenoids. New J. Phys. 2010, 12, 085015. [Google Scholar] [CrossRef]
- Balevičius, V.; Pour, A.G.; Savolainen, J.; Lincoln, C.N.; Lukeš, V.; Riedle, E.; Valkunas, L.; Abramavicius, D.; Hauer, J. Vibronic Energy Relaxation Approach Highlighting Deactivation Pathways in Carotenoids. Phys. Chem. Chem. Phys. 2015, 17, 19491–19499. [Google Scholar] [CrossRef] [PubMed]
- Mohan, T.M.N.; Leslie, C.H.; Sil, S.; Rose, J.B.; Tilluck, R.W.; Beck, W.F. Broadband 2DES Detection of Vibrational Coherence in the Sx State of Canthaxanthin. J. Chem. Phys. 2021, 155, 035103. [Google Scholar] [CrossRef] [PubMed]
- Polli, D.; Altoè, P.; Weingart, O.; Spillane, K.M.; Manzoni, C.; Brida, D.; Tomasello, G.; Orlandi, G.; Kukura, P.; Mathies, R.A.; et al. Conical Intersection Dynamics of the Primary Photoisomerization Event in Vision. Nature 2010, 467, 440–443. [Google Scholar] [CrossRef]
- Bolzonello, L.; Volpato, A.; Meneghin, E.; Collini, E. Versatile Setup for High-Quality Rephasing, Non-Rephasing, and Double Quantum 2D Electronic Spectroscopy. J. Opt. Soc. Am. B 2017, 34, 1223. [Google Scholar] [CrossRef]
- Augulis, R.; Zigmantas, D. Two-Dimensional Electronic Spectroscopy with Double Modulation Lock-in Detection: Enhancement of Sensitivity and Noise Resistance. Opt. Express 2011, 19, 13126–13133. [Google Scholar] [CrossRef]
- Ilagan, R.P.; Chapp, T.W.; Hiller, R.G.; Sharples, F.P.; Polívka, T.; Frank, H.A. Optical Spectroscopic Studies of Light-Harvesting by Pigment-Reconstituted Peridinin-Chlorophyll-Proteins at Cryogenic Temperatures. Photosynth. Res. 2006, 89, 5–15. [Google Scholar] [CrossRef] [PubMed] [Green Version]


| A1 | T1/fs | A2 | T2/fs | |||||
|---|---|---|---|---|---|---|---|---|
| WT | N89L | WT | N89L | WT | N89L | WT | N89L | |
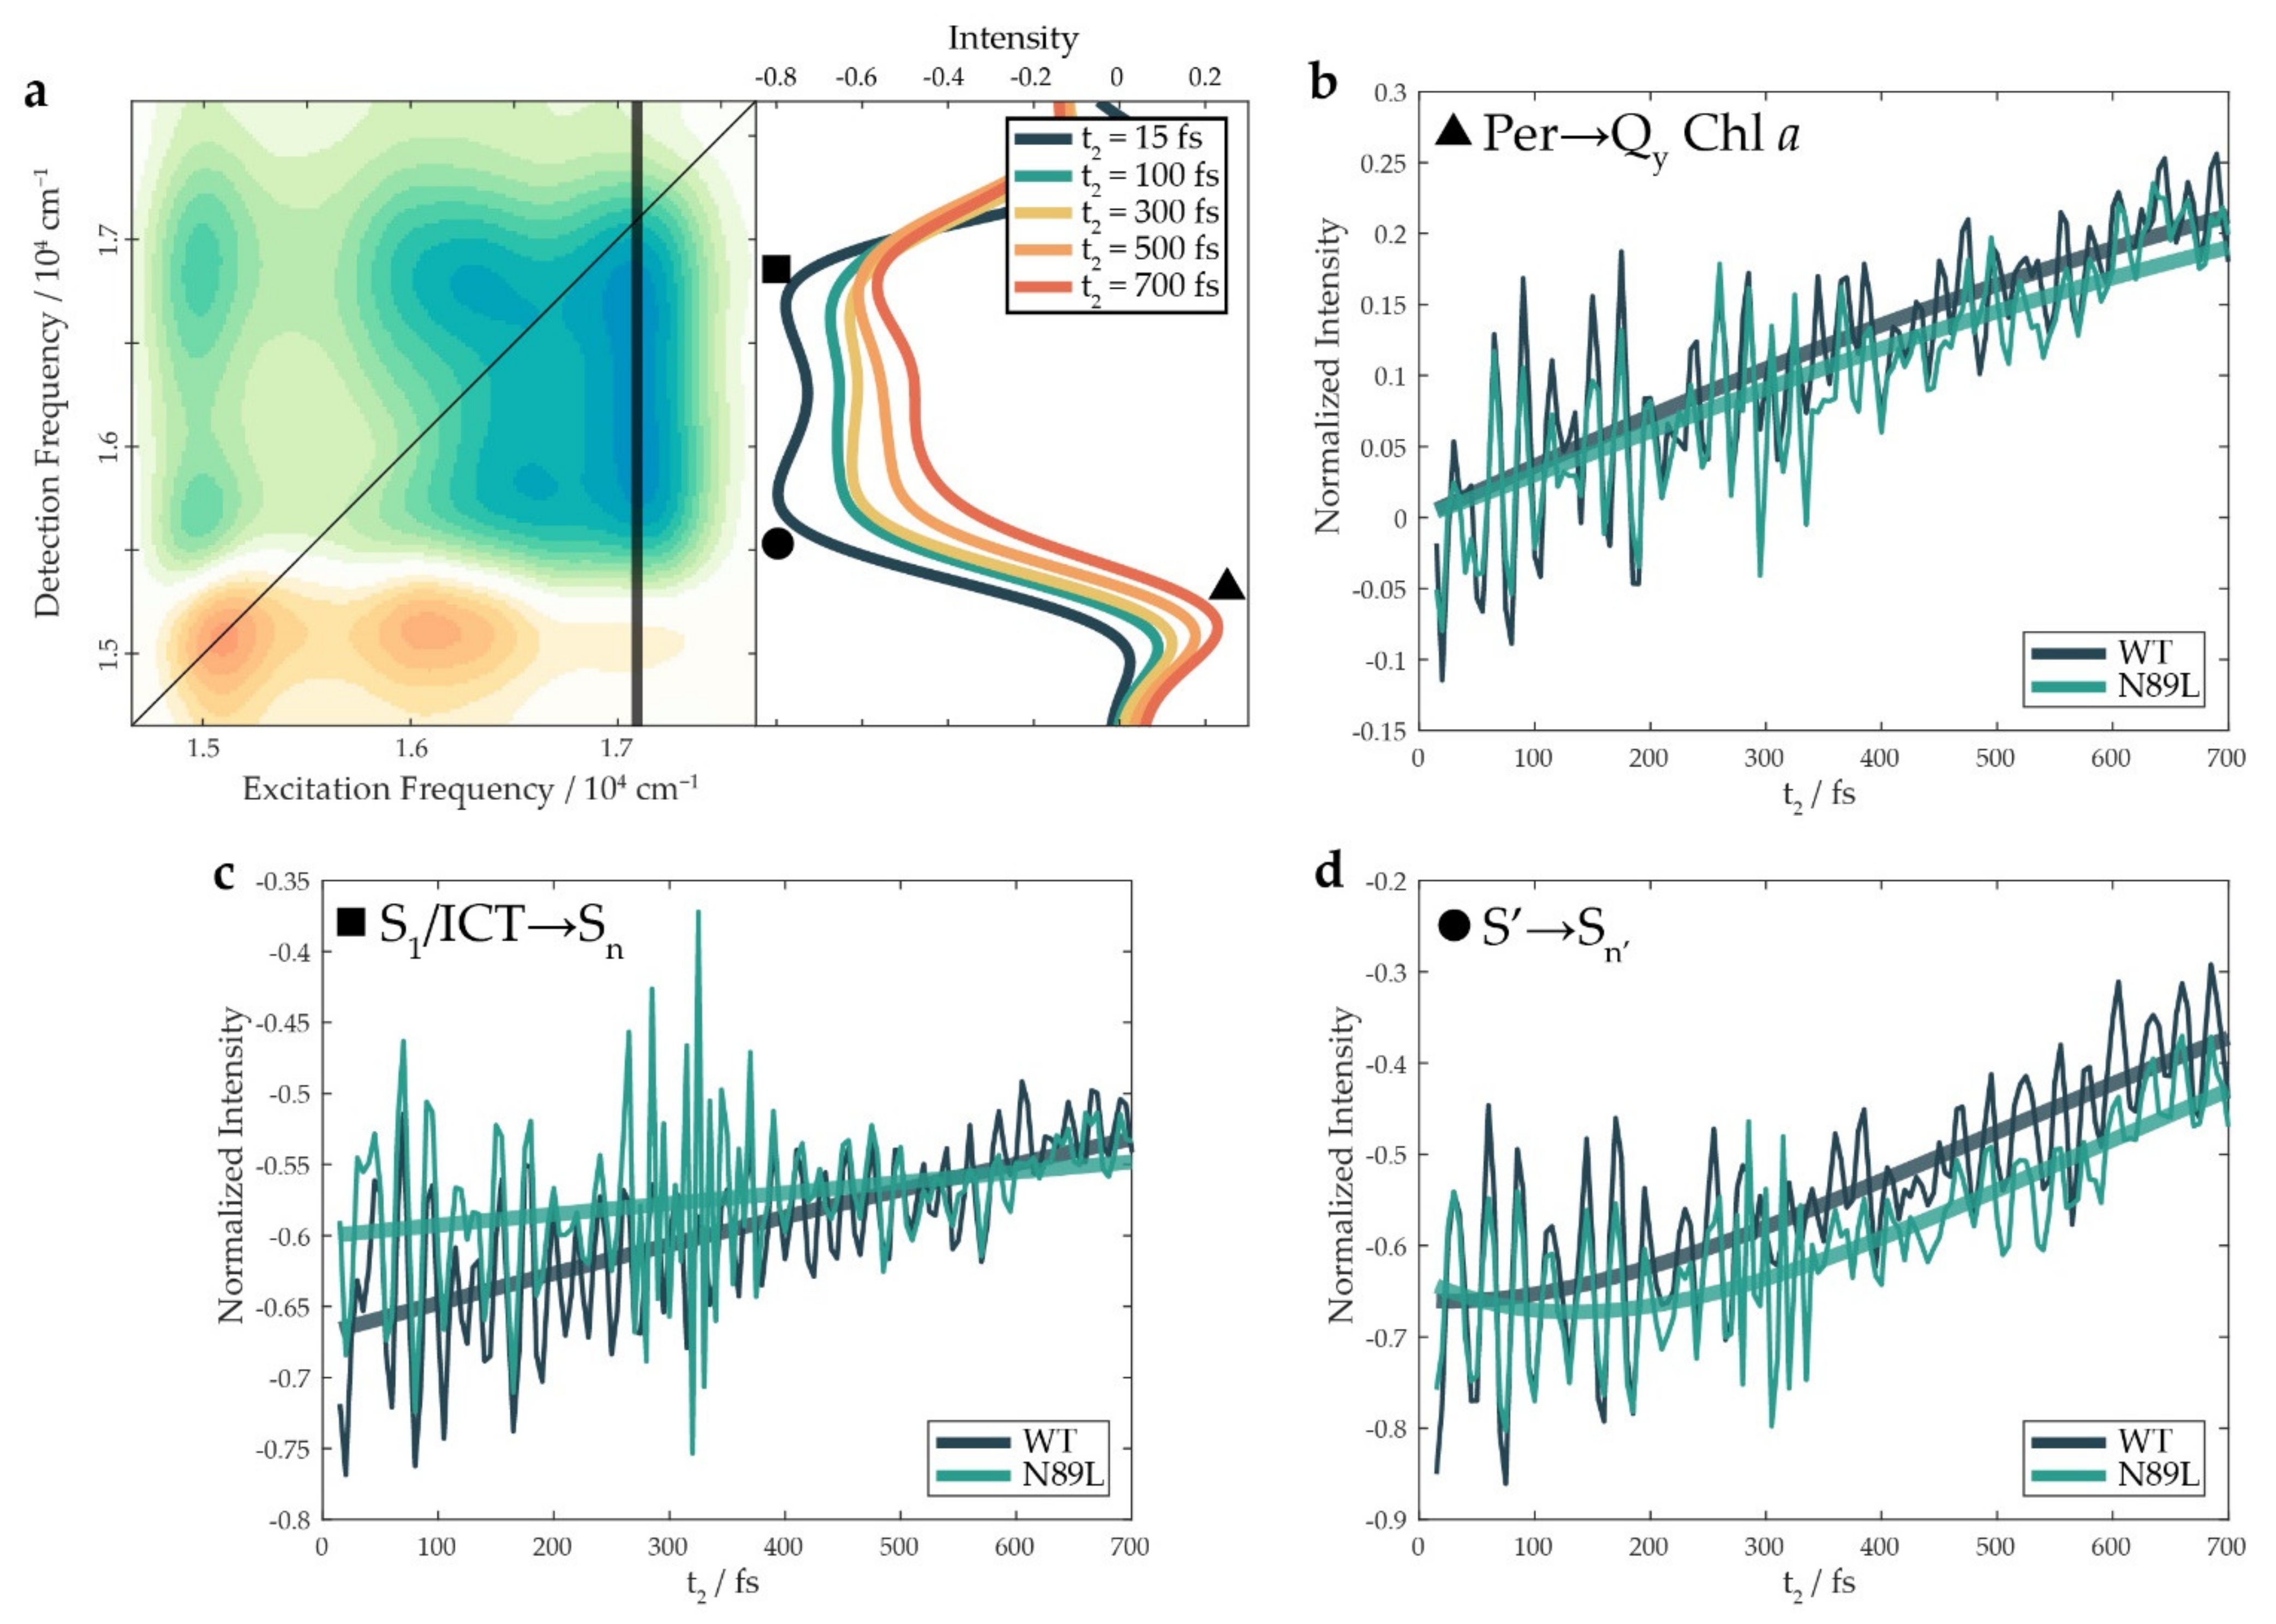
| ▲ ET signal | 0.80 | 0.76 | ||||||
| ∎ Higher ESA | −0.70 | −0.62 | ||||||
| ● Lower ESA | 0.20 | 0.28 | 115 | 112 | −0.67 | −0.65 | 630 | 630 |
Publisher’s Note: MDPI stays neutral with regard to jurisdictional claims in published maps and institutional affiliations. |
© 2022 by the authors. Licensee MDPI, Basel, Switzerland. This article is an open access article distributed under the terms and conditions of the Creative Commons Attribution (CC BY) license (https://creativecommons.org/licenses/by/4.0/).
Share and Cite
Tumbarello, F.; Marcolin, G.; Fresch, E.; Hofmann, E.; Carbonera, D.; Collini, E. The Energy Transfer Yield between Carotenoids and Chlorophylls in Peridinin Chlorophyll a Protein Is Robust against Mutations. Int. J. Mol. Sci. 2022, 23, 5067. https://0-doi-org.brum.beds.ac.uk/10.3390/ijms23095067
Tumbarello F, Marcolin G, Fresch E, Hofmann E, Carbonera D, Collini E. The Energy Transfer Yield between Carotenoids and Chlorophylls in Peridinin Chlorophyll a Protein Is Robust against Mutations. International Journal of Molecular Sciences. 2022; 23(9):5067. https://0-doi-org.brum.beds.ac.uk/10.3390/ijms23095067
Chicago/Turabian StyleTumbarello, Francesco, Giampaolo Marcolin, Elisa Fresch, Eckhard Hofmann, Donatella Carbonera, and Elisabetta Collini. 2022. "The Energy Transfer Yield between Carotenoids and Chlorophylls in Peridinin Chlorophyll a Protein Is Robust against Mutations" International Journal of Molecular Sciences 23, no. 9: 5067. https://0-doi-org.brum.beds.ac.uk/10.3390/ijms23095067