
Nitrogen-Doped Zinc Oxide for Photo-Driven Molecular Hydrogen Production

 , , and
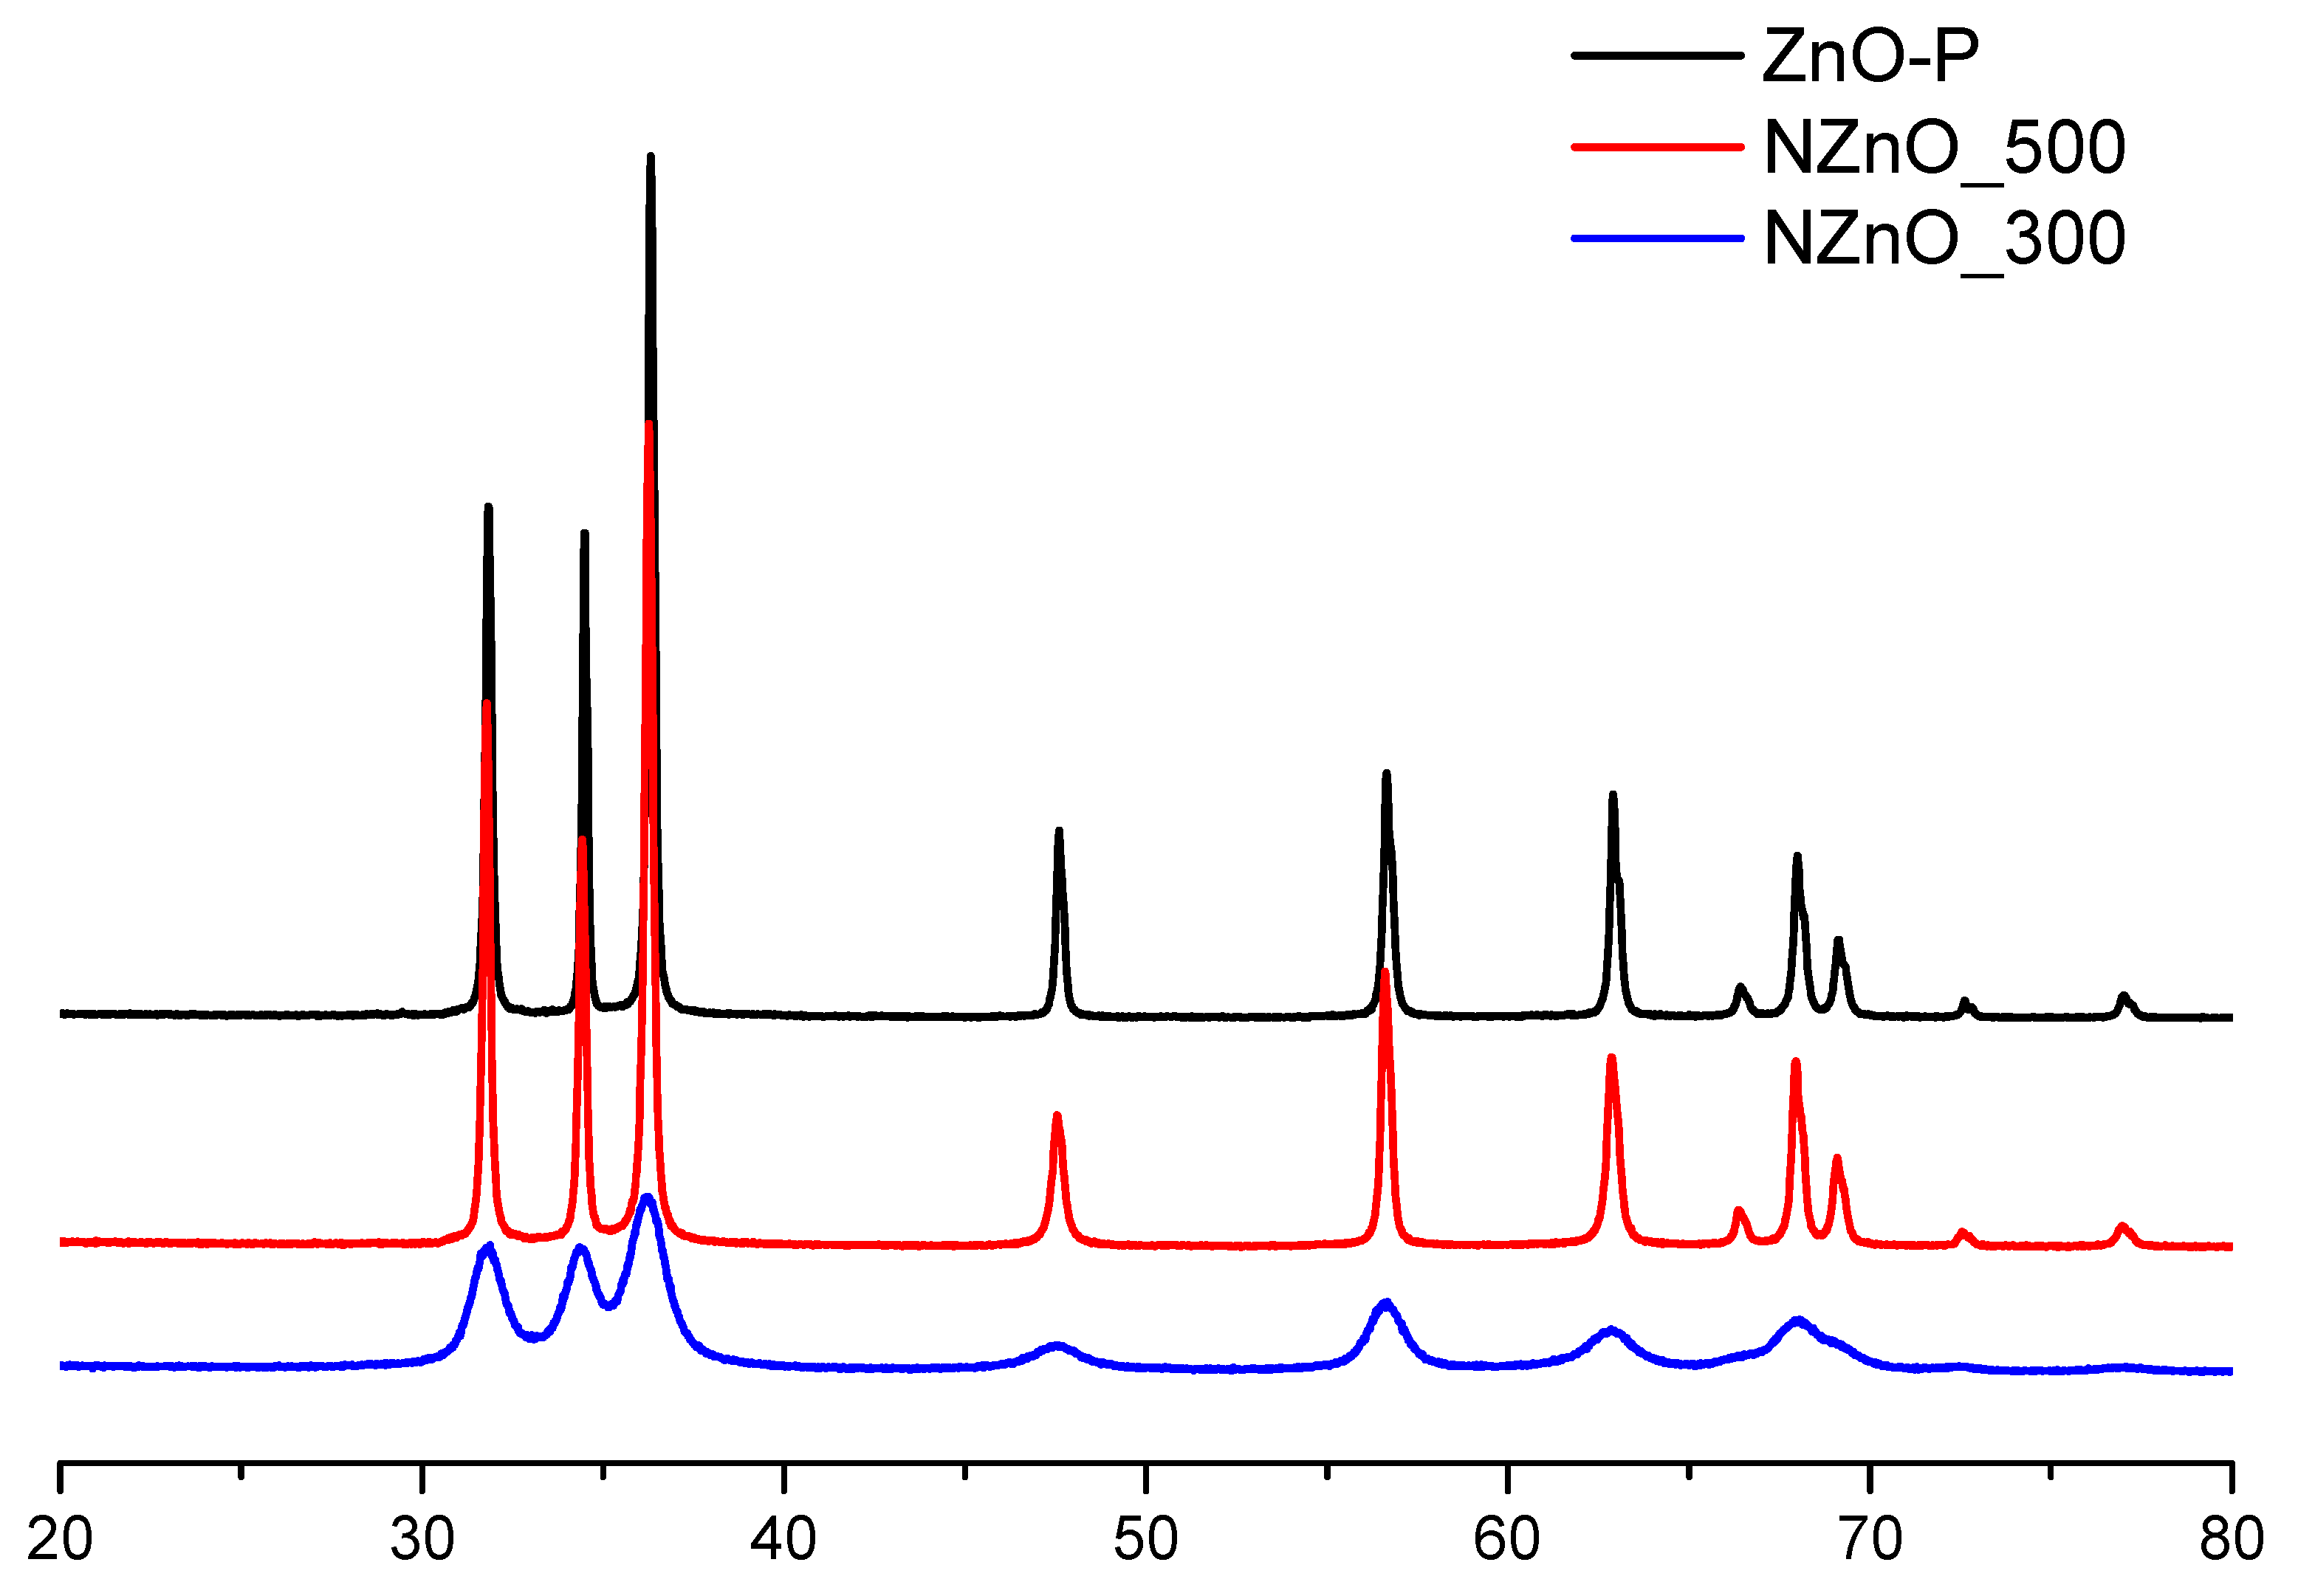
Abstract
:1. Introduction
2. Results
2.1. XRD Characterization
2.2. UV-Vis Diffuse Reflectance
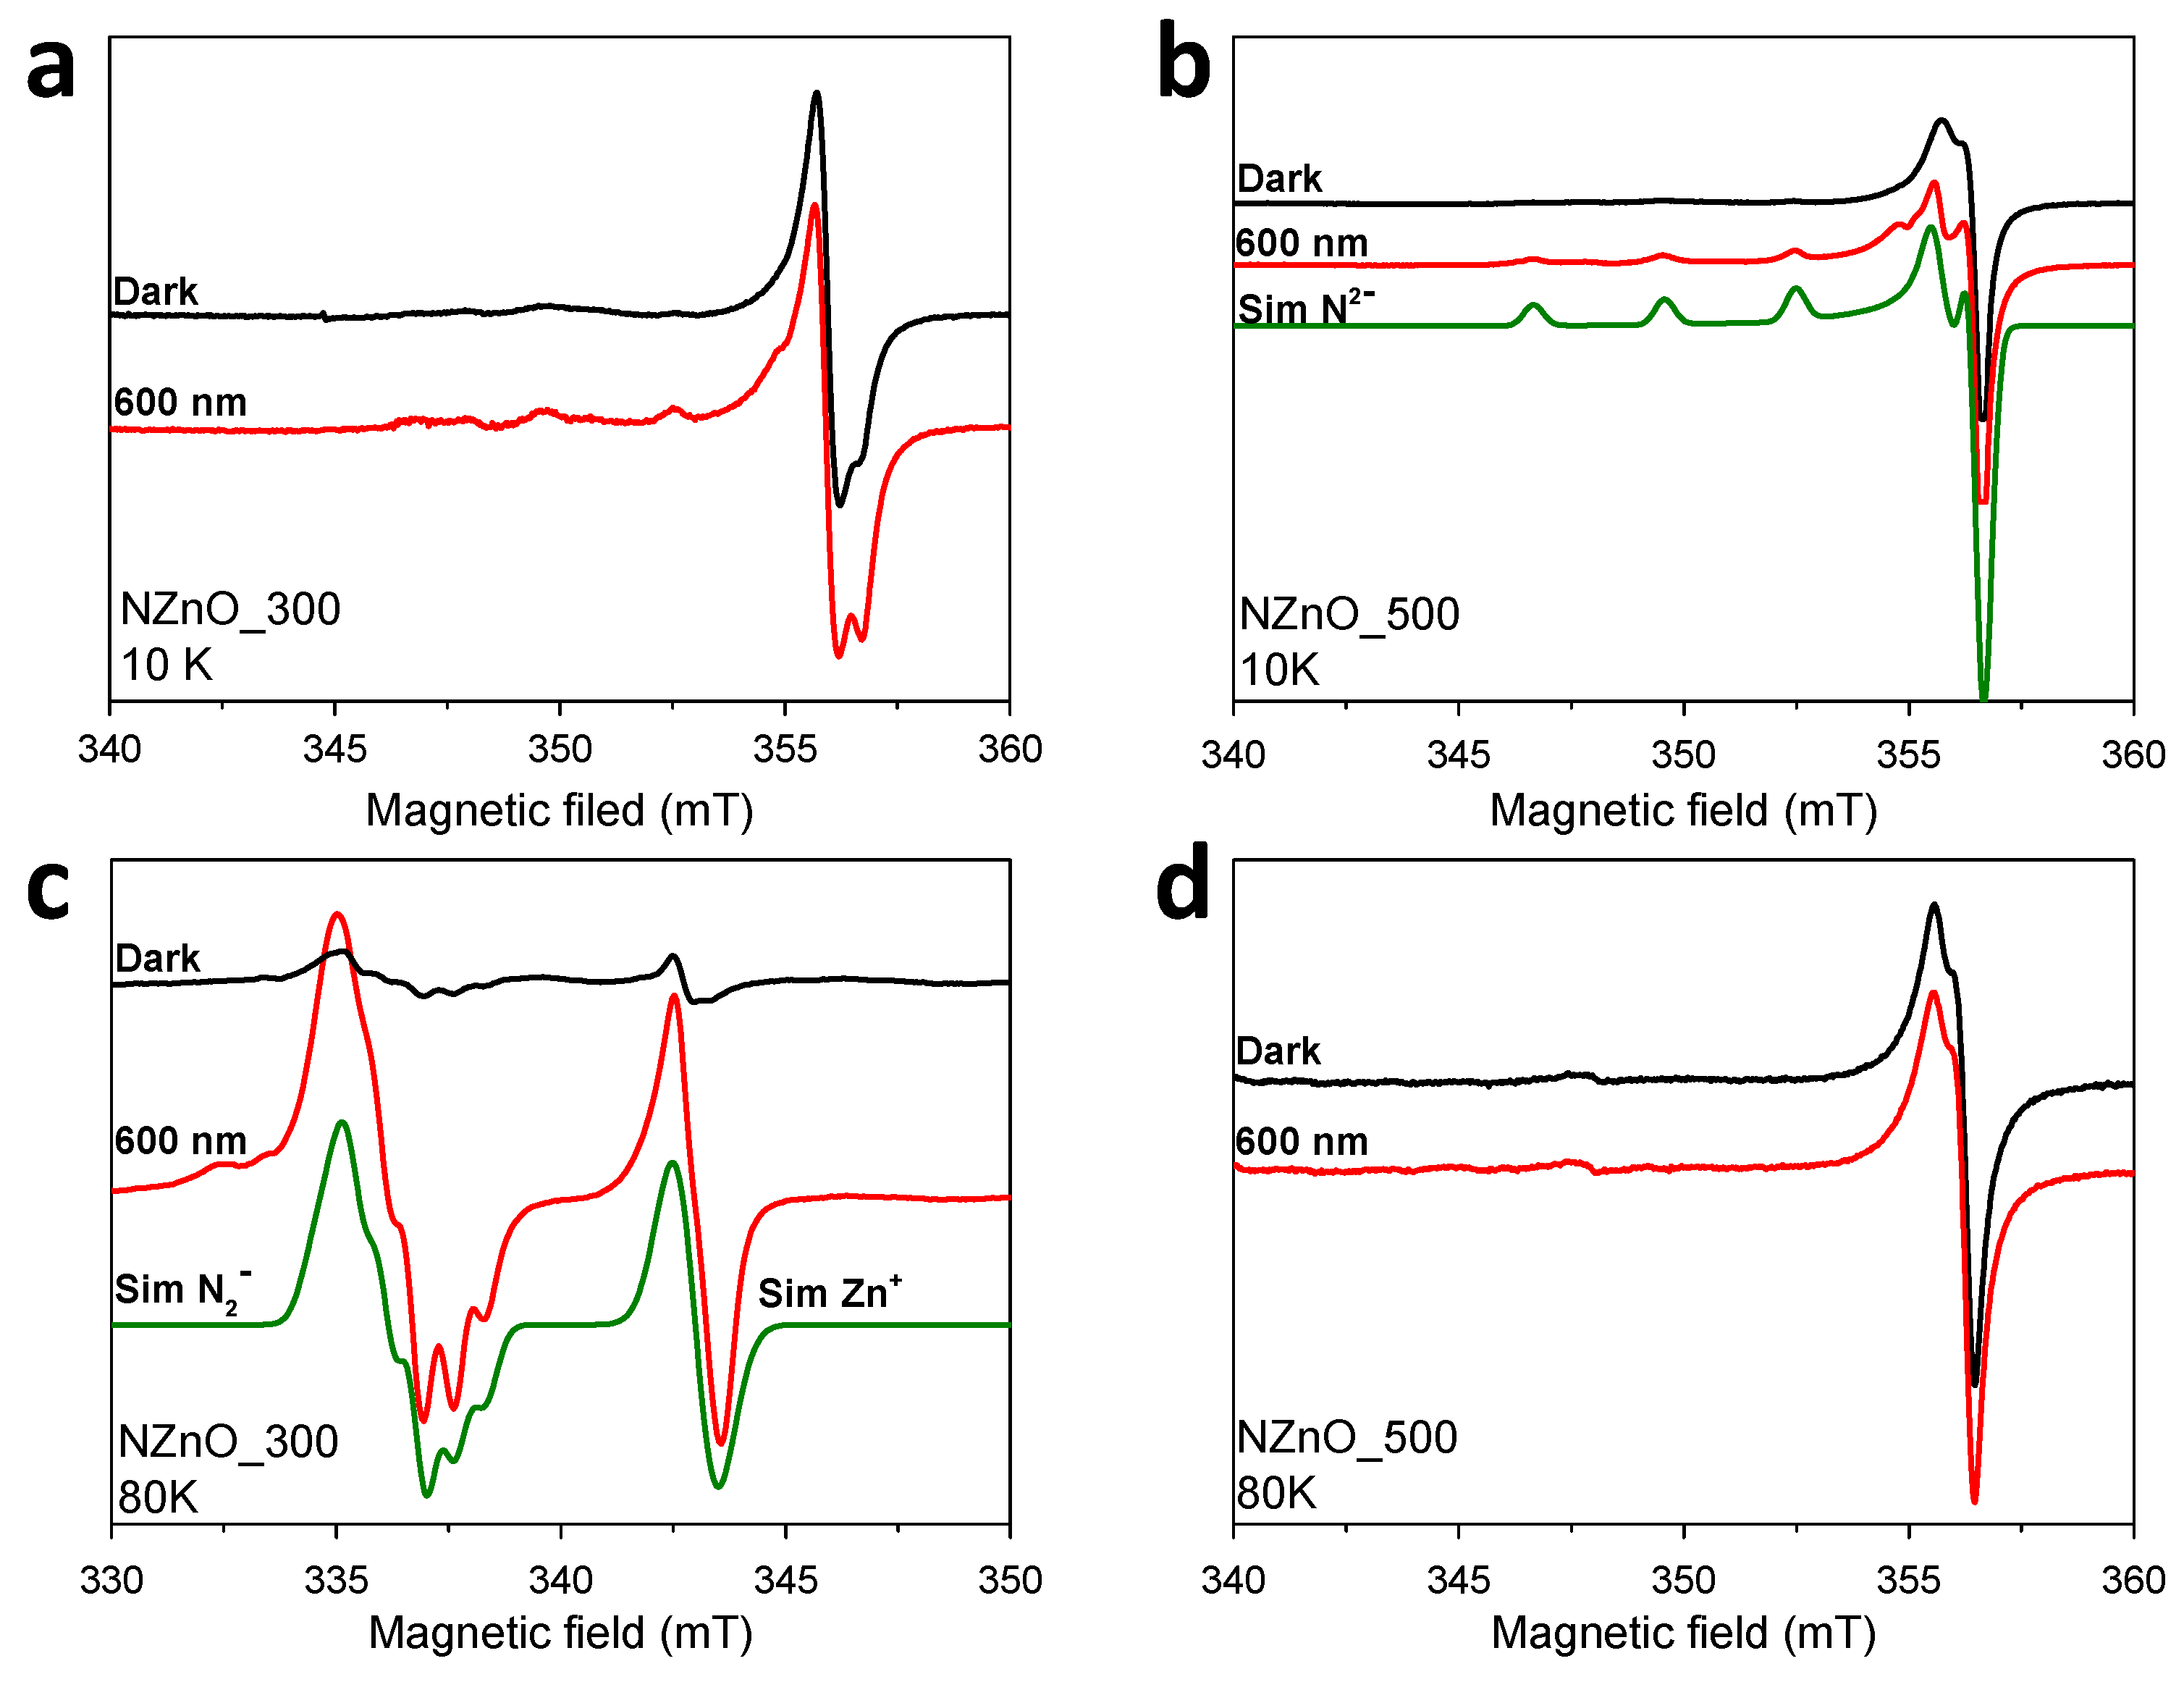
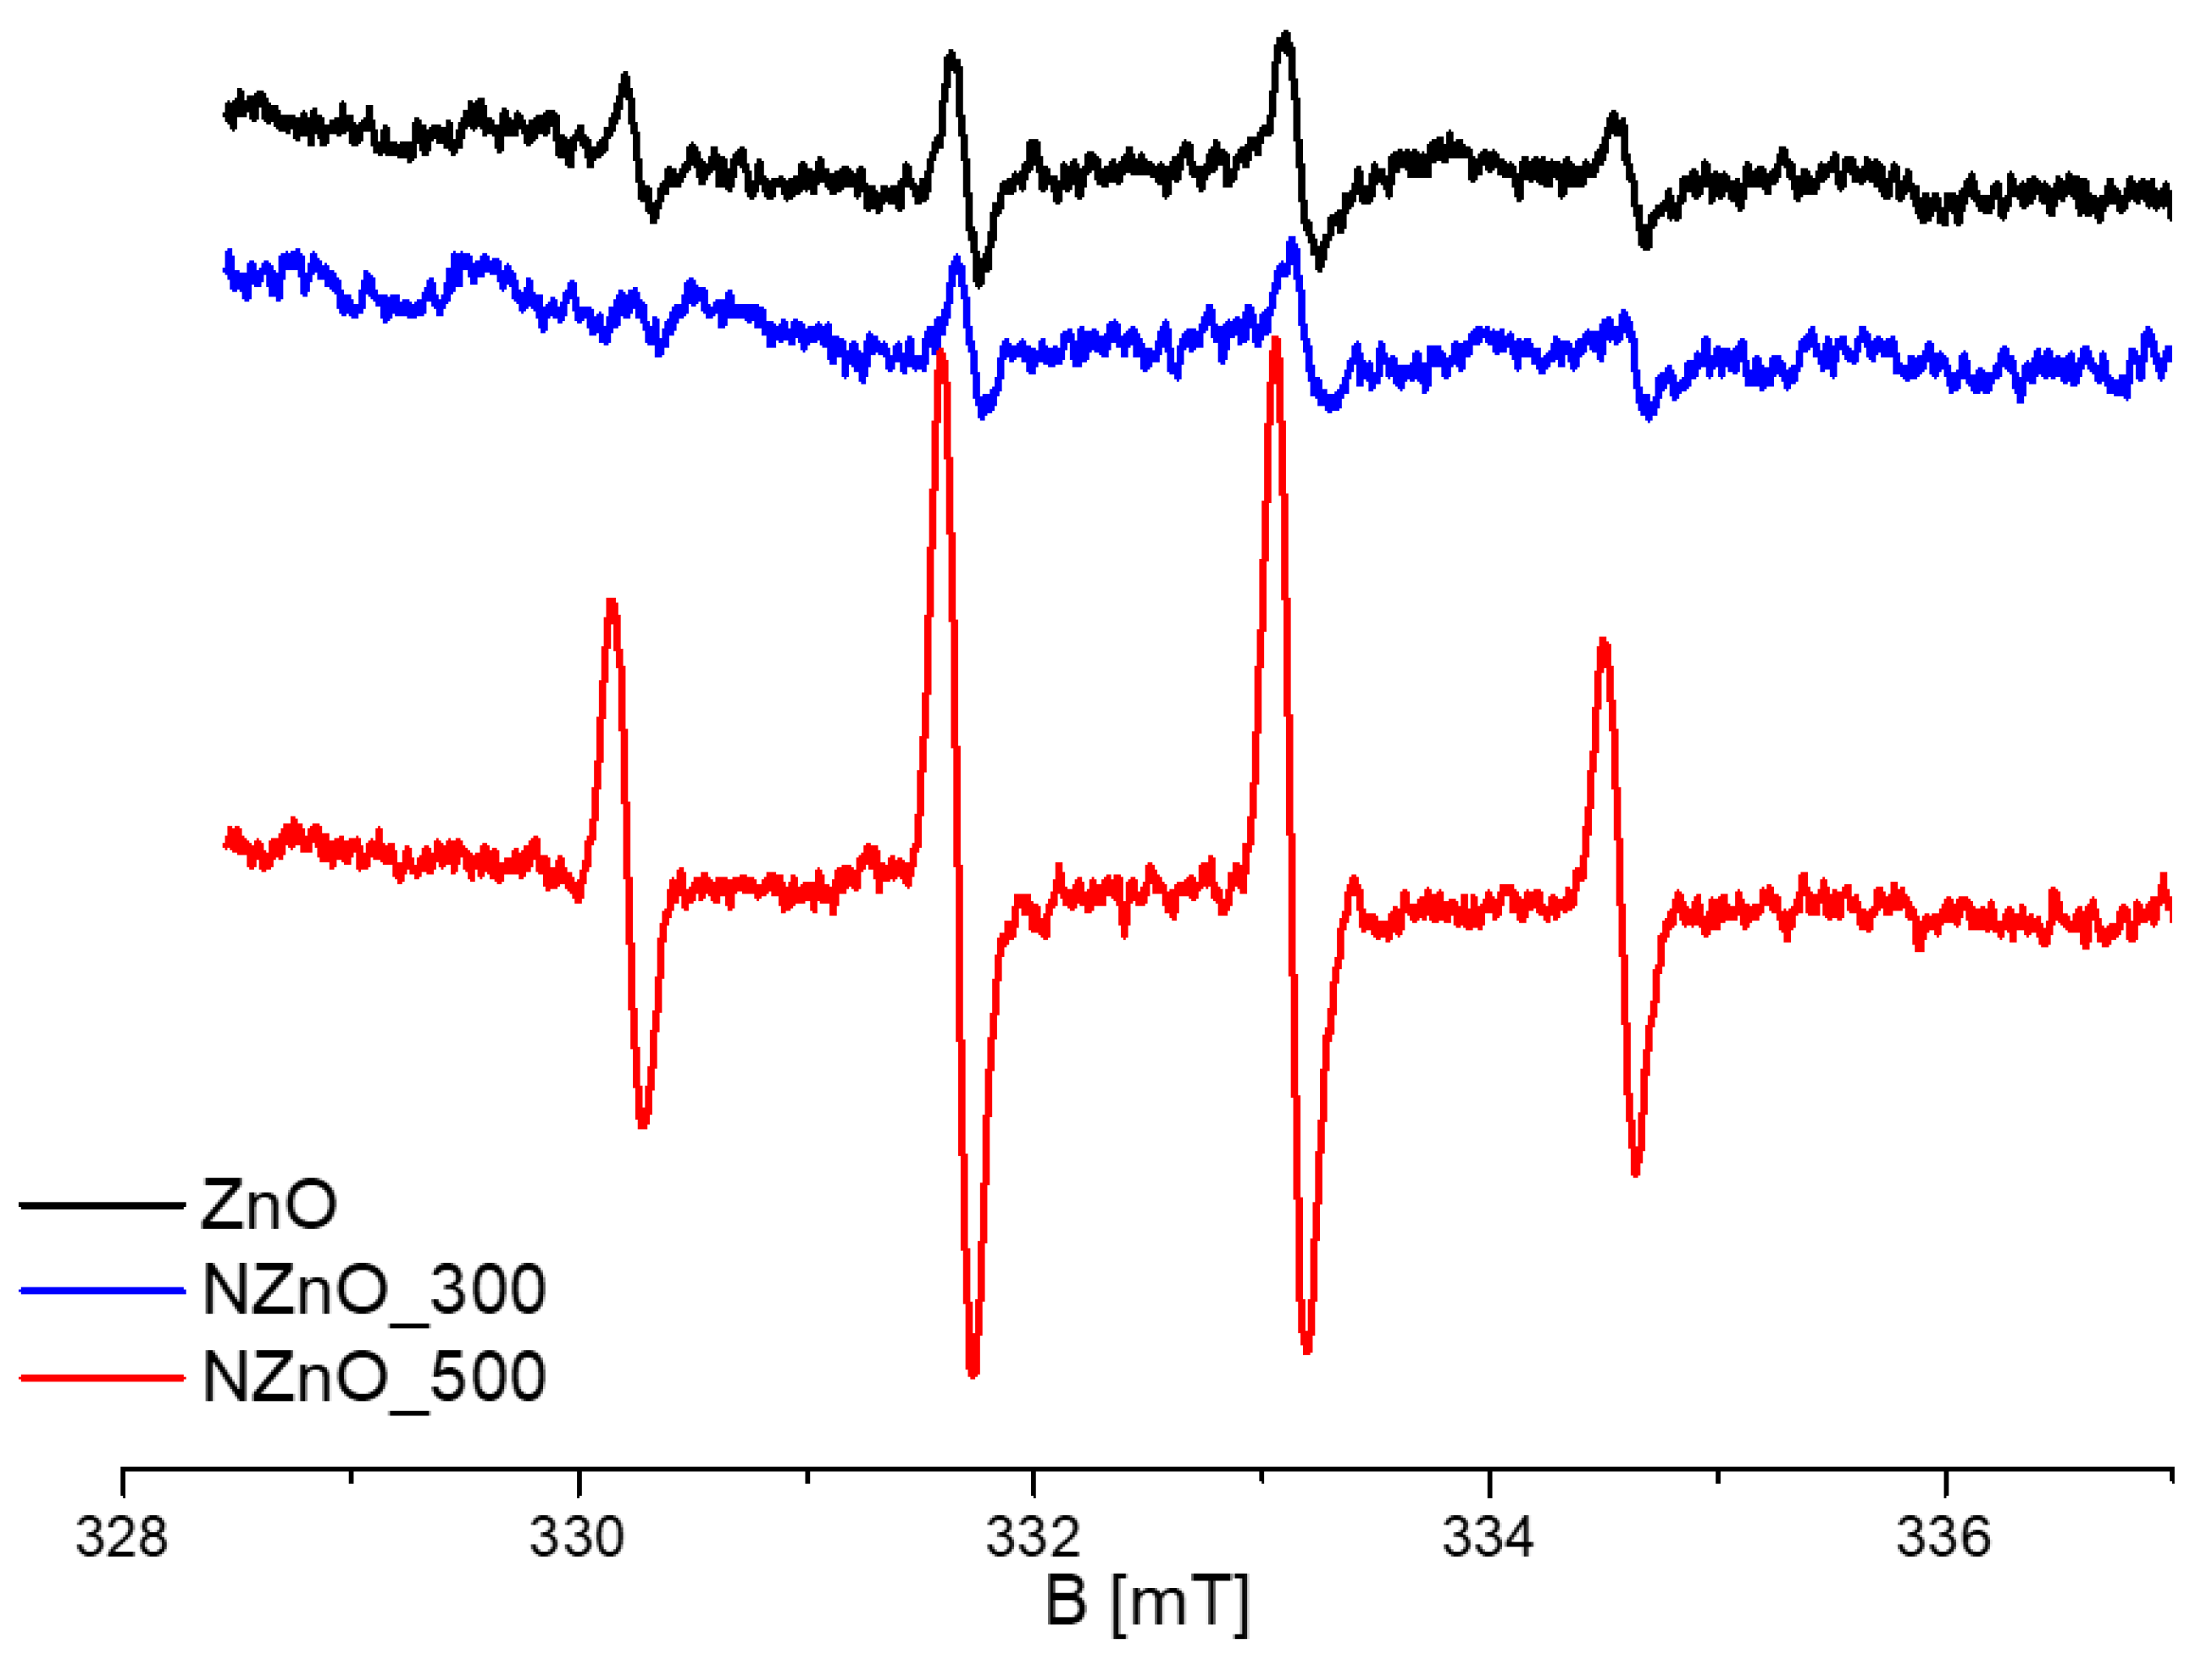
2.3. EPR Spectroscopy
2.4. Spin Trapping
2.5. H2 Production
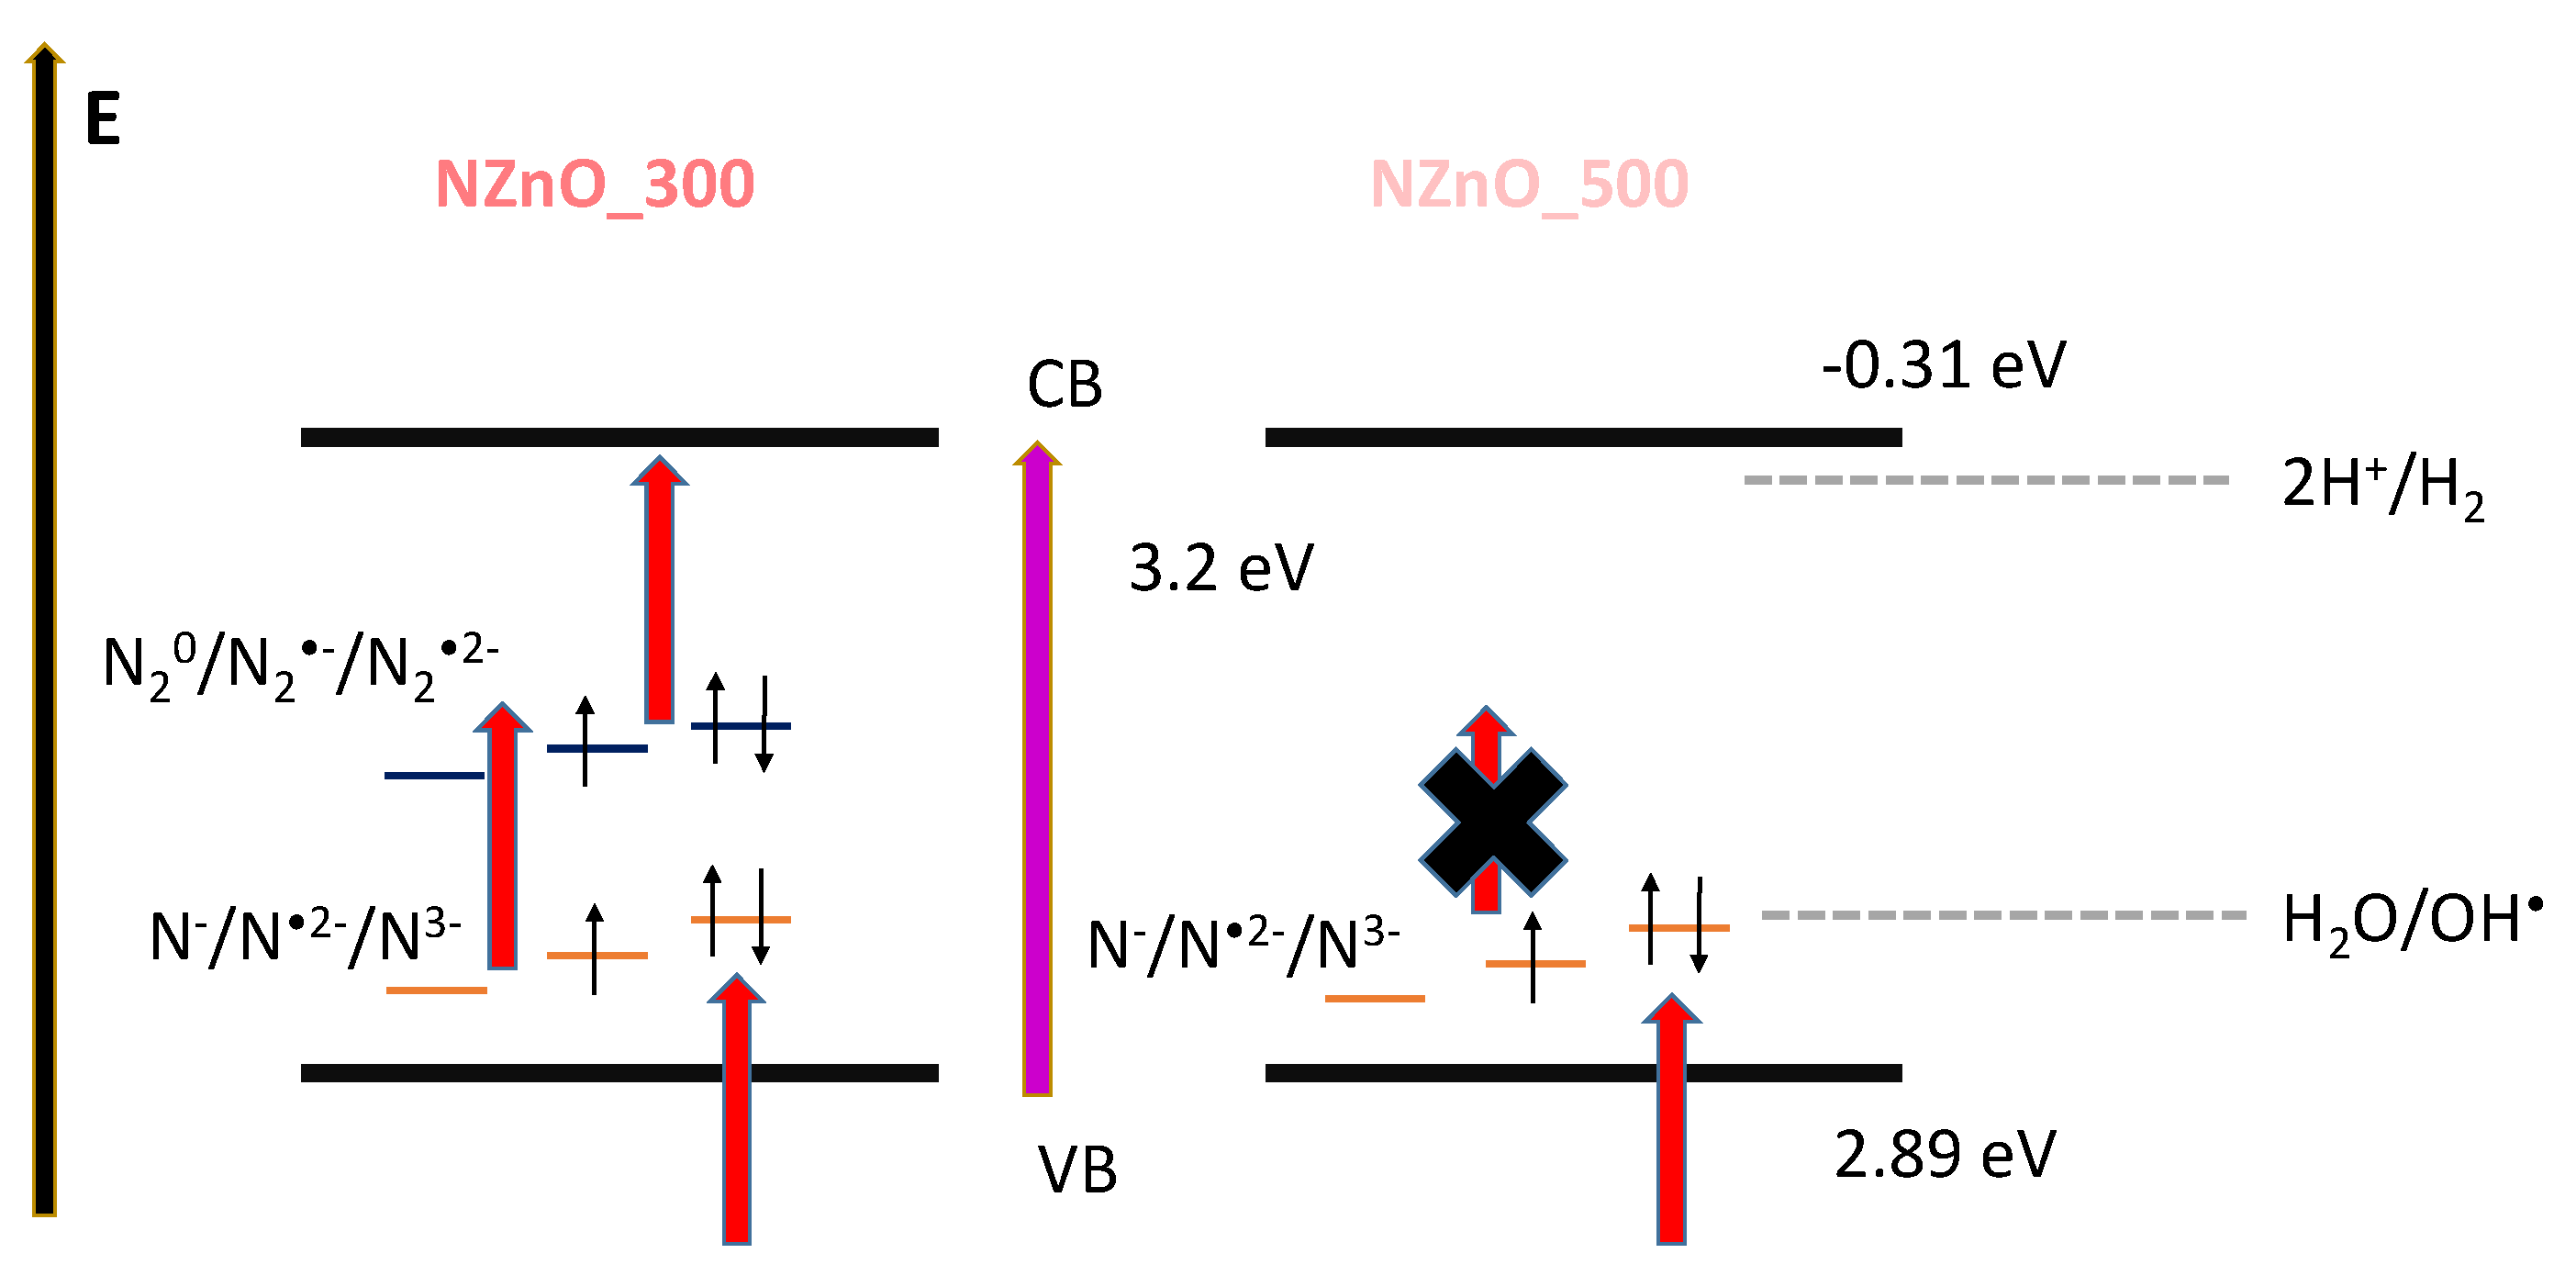
3. Discussion
4. Conclusions
5. Materials and Methods
5.1. N-Doped ZnO Synthesis
5.2. Powder XRD Diffraction and X-ray Photoemission Spectroscopy (XPS)
5.3. UV-Vis Spectroscopy
5.4. EPR Spectroscopy
5.5. Spin Trapping
5.6. Photocatalytic H2 Evolution
Author Contributions
Funding
Institutional Review Board Statement
Informed Consent Statement
Data Availability Statement
Acknowledgments
Conflicts of Interest
References
- Maeda, K.; Domen, K. Photocatalytic Water Splitting: Recent Progress and Future Challenges. J. Phys. Chem. Lett. 2010, 1, 2655–2661. [Google Scholar] [CrossRef]
- Domen, K.; Kondo, J.N.; Hara, M.; Takata, T. Photo- and Mechano-Catalytic Overall Water Splitting Reactions to Form Hydrogen and Oxygen on Heterogeneus Catalyst. Bull. Chem. Soc. Jpn. 2000, 73, 1307–1331. [Google Scholar] [CrossRef]
- Nocera, D.C. The Artificial Leaf. Acc. Chem. Res. 2012, 45, 767–776. [Google Scholar] [CrossRef] [PubMed]
- Livraghi, S.; Paganini, M.C.; Giamello, E.; Selloni, A.; Valentin, C.D.; Pacchioni, G. Origin of Photoactivity of Nitrogen-Doped Titanium Dioxide under Visible Light. J. Am. Chem. Soc. 2006, 128, 15666–15671. [Google Scholar] [CrossRef] [PubMed]
- Yan, Y.; Zhang, S.B.; Pantelides, S.T. Control of Doping by Impurity Chemical Potentials: Predictions for p-type ZnO. Phys. Rev. Lett. 2001, 86, 5723–5726. [Google Scholar] [CrossRef] [PubMed] [Green Version]
- Joseph, M.; Tabata, H.; Saeki, H.; Ueda, K.; Kawai, T. Fabrication of the Low-Resistive p-Type ZnO by Codoping Method. Phys. B 2001, 302–303, 140–148. [Google Scholar] [CrossRef] [Green Version]
- Kegel, J.; Povey, I.M.; Pemble, M.E. Zinc Oxide for Solar Water Splitting: A Brief Review of the Material’s Challenges and Associated Opportunities. Nano Energy 2018, 54, 409–428. [Google Scholar] [CrossRef]
- Gunti, S.; Kumar, A.; Ram, M.K. Nanostructured Photocatalysis in the Visible Spectrum for the Decontamination of Air and Water. Int. Mater. Rev. 2018, 63, 257–282. [Google Scholar] [CrossRef]
- D’Arienzo, M.; Siedl, N.; Sternig, A.; Scotti, R.; Morazzoni, F.; Bernardi, J.; Diwald, O. Solar Light and Dopant-Induced Recombination Effects: Photoactive Nitrogen in TiO2 as a Case Study. J. Phys. Chem. C 2010, 114, 18067–18072. [Google Scholar] [CrossRef]
- Barolo, G.; Livraghi, S.; Chiesa, M.; Paganini, M.C.; Giamello, E. Mechanism of the Photoactivity under Visible Light of N-Doped Titanium Dioxide. Charge Carriers Migration in Irradiated N-TiO2 Investigated by Electron Paramagnetic Resonance. J. Phys. Chem. C 2012, 116, 20887–20894. [Google Scholar] [CrossRef]
- Napoli, F.; Chiesa, M.; Livraghi, S.; Giamello, E.; Agnoli, S.; Granozzi, G.; Pacchioni, G.; Di Valentin, C. The Nitrogen Photoactive Centre in N-doped Titanium Dioxide formed via Interaction of N Atoms with the Solid. Nature and Energy Level of the Species. Chem. Phys. Lett. 2009, 477, 135–138. [Google Scholar] [CrossRef]
- Di Valentin, C.; Finazzi, E.; Pacchioni, G.; Selloni, A.; Livraghi, S.; Paganini, M.C.; Giamello, E. N-doped TiO2: Theory and experiment. Chem. Phys. 2007, 339, 44–56. [Google Scholar] [CrossRef]
- Liu, L.; Xu, J.; Wang, D.; Jiang, M.; Wang, S.; Li, C.; Zhang, Z.; Zhao, D.; Shan, C.; Yao, B.; et al. p-Type Conductivity in N-doped ZnO: The Role of the N(Zn)-V(O) complex. Phys. Rev. Lett. 2012, 108, 215501. [Google Scholar] [CrossRef] [PubMed]
- Yang, X.; Wolcott, A.; Wang, G.; Sobo, A.; Fitzmorris, R.C.; Qian, F.; Zhang, J.Z.; Li, Y. Nitrogen-Doped ZnO Nanowire Arrays for Photoelectrochemical Water Splitting. Nano Lett. 2009, 9, 2331–2336. [Google Scholar] [CrossRef] [PubMed]
- Iwata, K.; Fons, P.; Yamada, A.; Matsubara, K.; Niki, S. Nitrogen-induced Defects in ZnO: N grown on Sapphire substrate by Gas Source MBE. J. Cryst. Growth 2000, 209, 526–531. [Google Scholar] [CrossRef]
- Gallino, F.; Di Valentin, C.; Pacchioni, G.; Chiesa, M.; Giamello, E. Nitrogen Doped Polycrystalline ZnO. A Combined Pulse EPR and DFT Study. J. Mater. Chem. 2010, 20, 689–697. [Google Scholar] [CrossRef]
- Sann, J.; Stehr, J.; Hofstaetter, A.; Hofmann, D.M.; Neumann, A.; Lerch, M.; Haboeck, U.; Hoffmann, A.; Thomsen, C. Zn Interstitial related Donors in Ammonia-treated ZnO Powders. Phys. Rev. B 2007, 76, 1952031–1952036. [Google Scholar] [CrossRef] [Green Version]
- Ye, Z.Z.; Lu, J.G.; Chen, H.H.; Zhang, Y.Z.; Wang, L.; Zhao, B.H.; Huang, J.Y. Preparation and Characteristics of p-type ZnO Films by DC Reactive Magnetron Sputtering. J. Cryst. Growth 2003, 253, 258–264. [Google Scholar] [CrossRef]
- Minegishi, K.; Koiwai, Y.; Kikuchi, Y.; Yano, K.; Kasuga, M.; Shimizu, A. Growth of p-type Zinc Oxide Films by Chemical Vapor Deposition. Jpn. J. Appl. Phys. 1997, 36, L1453–L1455. [Google Scholar] [CrossRef]
- Lu, J. p-type ZnO films deposited by DC reactive magnetron sputtering at different ammonia concentrations. Mater. Lett. 2003, 57, 3311–3314. [Google Scholar] [CrossRef]
- Li, X.; Yan, Y.; Gessert, T.A.; DeHart, C.; Perkins, C.L.; Young, D.; Coutts, T.J. p-Type ZnO Thin Films Formed by CVD Reaction of Diethylzinc and NO Gas. Electrochem. Solid-State Lett. 2003, 6, C56–C62. [Google Scholar] [CrossRef]
- Garces, N.Y.; Giles, N.C.; Halliburton, L.E.; Cantwell, G.; Eason, D.B.; Reynolds, D.C.; Look, D.C. Production of Nitrogen Acceptors in ZnO by Thermal Annealing. Appl. Phys. Lett. 2002, 80, 1334–1336. [Google Scholar] [CrossRef] [Green Version]
- Garces, N.Y.; Wang, L.; Giles, N.C.; Halliburton, L.E.; Cantwell, G.; Eason, D.B. Molecular Nitrogen (N2−) Acceptors and Isolated Nitrogen (N−) Acceptors in ZnO Crystals. J. Appl. Phys. 2003, 94, 519–524. [Google Scholar] [CrossRef]
- Gionco, C.; Fabbri, D.; Calza, P.; Paganini, M.C. Synthesis, Characterization, and Photocatalytic Tests of N-Doped Zinc Oxide: A New Interesting Photocatalyst. J. Nanomater. 2016, 2016, 4129864. [Google Scholar] [CrossRef] [Green Version]
- Sun, L.; Shao, Q.; Zhang, Y.; Jiang, H.; Ge, S.; Lou, S.; Lin, J.; Zhang, J.; Wu, S.; Dong, M.; et al. N Self-Doped ZnO Derived from Microwave Hydrothermal Synthesized Zeolitic Imidazolate Framework-8 toward Enhanced Photocatalytic Degradation of Methylene Blue. J. Colloid Interface Sci. 2020, 565, 142–155. [Google Scholar] [CrossRef] [PubMed]
- Peter, C.N.; Anku, W.W.; Sharma, R.; Joshi, G.M.; Shukla, S.K.; Govender, P.P. N-doped ZnO/Graphene Oxide: A Photostable Photocatalyst for Improved Mineralization and Photodegradation of Organic Dye under Visible Light. Ionics 2018, 25, 327–339. [Google Scholar] [CrossRef]
- Kostova, N.G.; Fabian, M.; Dutkova, E. Mechanochemically Synthesized N-doped ZnO for Photodegradation of Ciprofloxacin. Bulg. Chem. Commun. 2019, 51, 433–438. [Google Scholar] [CrossRef]
- Sudrajat, H.; Hartuti, S. Easily Separable N-doped ZnO Microspheres with High Photocatalytic Activity under Visible Light. Mater. Res. Bull. 2018, 102, 319–323. [Google Scholar] [CrossRef]
- Oliveira, J.A.; Nogueira, A.E.; Gonçalves, M.C.P.; Paris, E.C.; Ribeiro, C.; Poirier, G.Y.; Giraldi, T.R. Photoactivity of N-doped ZnO Nanoparticles in Oxidative and Reductive Reactions. Appl. Surf. Sci. 2018, 433, 879–886. [Google Scholar] [CrossRef]
- Bai, H.; Liu, Z.; Sun, D.D. Hierarchical Nitrogen-doped Flowerlike ZnO Nanostructure and its Multifunctional Environmental Applications. Chem. Asian J. 2012, 7, 1772–1780. [Google Scholar] [CrossRef]
- Qin, H.; Li, W.; Xia, Y.; He, T. Photocatalytic Activity of Heterostructures based on ZnO and N-doped ZnO. ACS Appl. Mater. Interfaces 2011, 3, 3152–3156. [Google Scholar] [CrossRef] [PubMed]
- Özgür, U.; Alivov, Y.I.; Liu, C.; Teke, A.; Reshchikov, M.A.; Doğan, S.; Avrutin, V.; Cho, S.J.; Morkoç, H. A Comprehensive Review of ZnO Materials and Devices. J. Appl. Phys. 2005, 98, 041301–041301103. [Google Scholar] [CrossRef] [Green Version]
- Patterson, A.L. The Scherrer Formula for X-Ray Particle Size Determination. Phys. Rev. 1939, 56, 978–982. [Google Scholar] [CrossRef]
- Klucker, L.; Nelkowski, H.; Park, Y.S.; Skibowski, M.; Wagner, T.S. Optical Anisotropy of ZnO in the Ultraviolet Region. Phys. Status Solidi B 1971, 45, 265–272. [Google Scholar] [CrossRef]
- Tauc, J. The Optical Properties of Solids; Academic Press: New York, NY, USA, 1966. [Google Scholar]
- Mang, A.; Reimann, K.; Rubenacke, S. Band Gaps, Crystald-Field Splitting, Spin-Orbit Coupling, and Exciton Binding Energies in ZnO under Hydrostatic Pressure. Solid State Commun. 1995, 94, 251–254. [Google Scholar] [CrossRef]
- Paganini, M.C.; Cerrato, E. Photoactive Systems based on Semiconducting Metal Oxides. In Material Science in Photocatalysis; Garcıa-Lopez, E.I., Palmisano, L., Eds.; Elsevier: Amsterdam, The Netherlands, 2021; Volume 1, pp. 221–234. [Google Scholar]
- Chiesa, M.; Giamello, E.; Livraghi, S.; Paganini, M.C.; Polliotto, V.; Salvadori, E. Electron Magnetic Resonance in Heterogeneous Photocatalysis Research. J. Phys. Condens. Matter 2019, 31, 444001. [Google Scholar] [CrossRef]
- Chiesa, M.; Livraghi, S.; Paganini, M.C.; Salvadori, E.; Giamello, E. Nitrogen-doped Semiconducting Oxides. Implications on Photochemical, Photocatalytic and Electronic Properties derived from EPR Spectroscopy. Chem. Sci. 2020, 11, 6623–6641. [Google Scholar] [CrossRef]
- Hofmann, D.M.; Hofstaetter, A.; Leiter, F.; Zhou, H.; Henecker, F.; Meyer, B.K.; Orlinskii, S.B.; Schmidt, J.; Baranov, P.G. Hydrogen: A Relevant Shallow Donor in Zinc Oxide. Phys. Rev. Lett. 2002, 88, 0455041–0455044. [Google Scholar] [CrossRef]
- Lunsford, J.H.; Jayne, J.P. Electron Paramagnetic Resonance of Oxygen on ZnO and Ultraviolet Irradiated MgO. J. Chem. Phys. 1966, 44, 1487–1492. [Google Scholar] [CrossRef] [Green Version]
- Sancier, K.M. ESR investigation of photodamage to Zinc Oxide Powders. Appl. Surf. Sci. 1970, 21, 1–11. [Google Scholar] [CrossRef]
- Schneider, J.; Rauber, A. Paramagnetische Resonanz von Donatoren in Zincoxyd. Z. Naturforsch. 1961, 16a, 713–714. [Google Scholar]
- Cerrato, E.; Paganini, M.C.; Giamello, E. Photoactivity under Visible Light of Defective ZnO Investigated by EPR Spectroscopy and Photoluminescence. J. Photochem. Photobiol. A 2020, 397, 112531. [Google Scholar] [CrossRef]
- Halliburton, L.E.; Giles, N.C.; Garces, N.Y.; Luo, M.; Xu, C.; Boatner, L.B.A. Production of Native Donors in ZnO by Annealing at High Temperature in Zn Vapour. Appl. Phys. Lett. 2005, 87, 1721081–1721083. [Google Scholar] [CrossRef]
- Carlos, W.E.; Glasera, E.R.; Look, D.C. Magnetic Resonance Studies of ZnO. Phys. B 2001, 308–310, 976–979. [Google Scholar] [CrossRef]
- Pfisterer, D.; Sann, J.; Hofmann, D.M.; Plana, M.; Neumann, A.; Lerch, M.; Meyer, B.K. Incorporation of Nitrogen Acceptors in ZnO Powder. Phys. Status Solidi B 2006, 243, R1–R3. [Google Scholar] [CrossRef]
- Larach, S.; Turkevich, J. Characterization of Red Zinco Oxide by Electron Paramagnetic Resonance. J. Phys. Chem. Solids 1968, 29, 1519–1522. [Google Scholar] [CrossRef]
- Moribe, S.; Ikoma, T.; Akiyama, K.; Zhang, Q.; Saito, F.; Tero-Kubota, S. EPR Study on Paramagnetic Species in Nitrogen-doped ZnO Powders prepared by a Mechanochemical Method. Chem. Phys. Lett. 2007, 436, 373–377. [Google Scholar] [CrossRef]
- Di Valentin, C.; Pacchioni, G.; Selloni, A.; Livraghi, S.; Giamello, E. Characterization of Paramagnetic Species in N-Doped TiO2 Powders by EPR Spectroscopy and DFT Calculations. J. Phys. Chem. Lett. 2005, 109, 11414–11419. [Google Scholar] [CrossRef]
- Livraghi, S.; Votta, A.; Paganini, M.C.; Giamello, E. The nature of paramagnetic species in nitrogen doped TiO2 active in visible light photocatalysis. Chem. Commun. 2005, 498–500. [Google Scholar] [CrossRef]
- Dvoranová, D.; Brezová, V.; Mazúr, M.; Malati, M.A. Investigations of Metal-Doped Titanium Dioxide Photocatalysts. Appl. Catal. B 2002, 37, 91–105. [Google Scholar] [CrossRef]
- Stoll, S.; Schweiger, A. EasySpin, a Comprehensive Software Package for Spectral Simulation and Analysis in EPR. J. Magn. Reson. 2006, 178, 42–55. [Google Scholar] [CrossRef] [PubMed]


Publisher’s Note: MDPI stays neutral with regard to jurisdictional claims in published maps and institutional affiliations. |
© 2022 by the authors. Licensee MDPI, Basel, Switzerland. This article is an open access article distributed under the terms and conditions of the Creative Commons Attribution (CC BY) license (https://creativecommons.org/licenses/by/4.0/).
Share and Cite
Cerrato, E.; Privitera, A.; Chiesa, M.; Salvadori, E.; Paganini, M.C. Nitrogen-Doped Zinc Oxide for Photo-Driven Molecular Hydrogen Production. Int. J. Mol. Sci. 2022, 23, 5222. https://0-doi-org.brum.beds.ac.uk/10.3390/ijms23095222
Cerrato E, Privitera A, Chiesa M, Salvadori E, Paganini MC. Nitrogen-Doped Zinc Oxide for Photo-Driven Molecular Hydrogen Production. International Journal of Molecular Sciences. 2022; 23(9):5222. https://0-doi-org.brum.beds.ac.uk/10.3390/ijms23095222
Chicago/Turabian StyleCerrato, Erik, Alberto Privitera, Mario Chiesa, Enrico Salvadori, and Maria Cristina Paganini. 2022. "Nitrogen-Doped Zinc Oxide for Photo-Driven Molecular Hydrogen Production" International Journal of Molecular Sciences 23, no. 9: 5222. https://0-doi-org.brum.beds.ac.uk/10.3390/ijms23095222