
Transactive Response DNA-Binding Protein (TARDBP/TDP-43) Regulates Cell Permissivity to HIV-1 Infection by Acting on HDAC6

 , , , , , , ,
  , , , , and
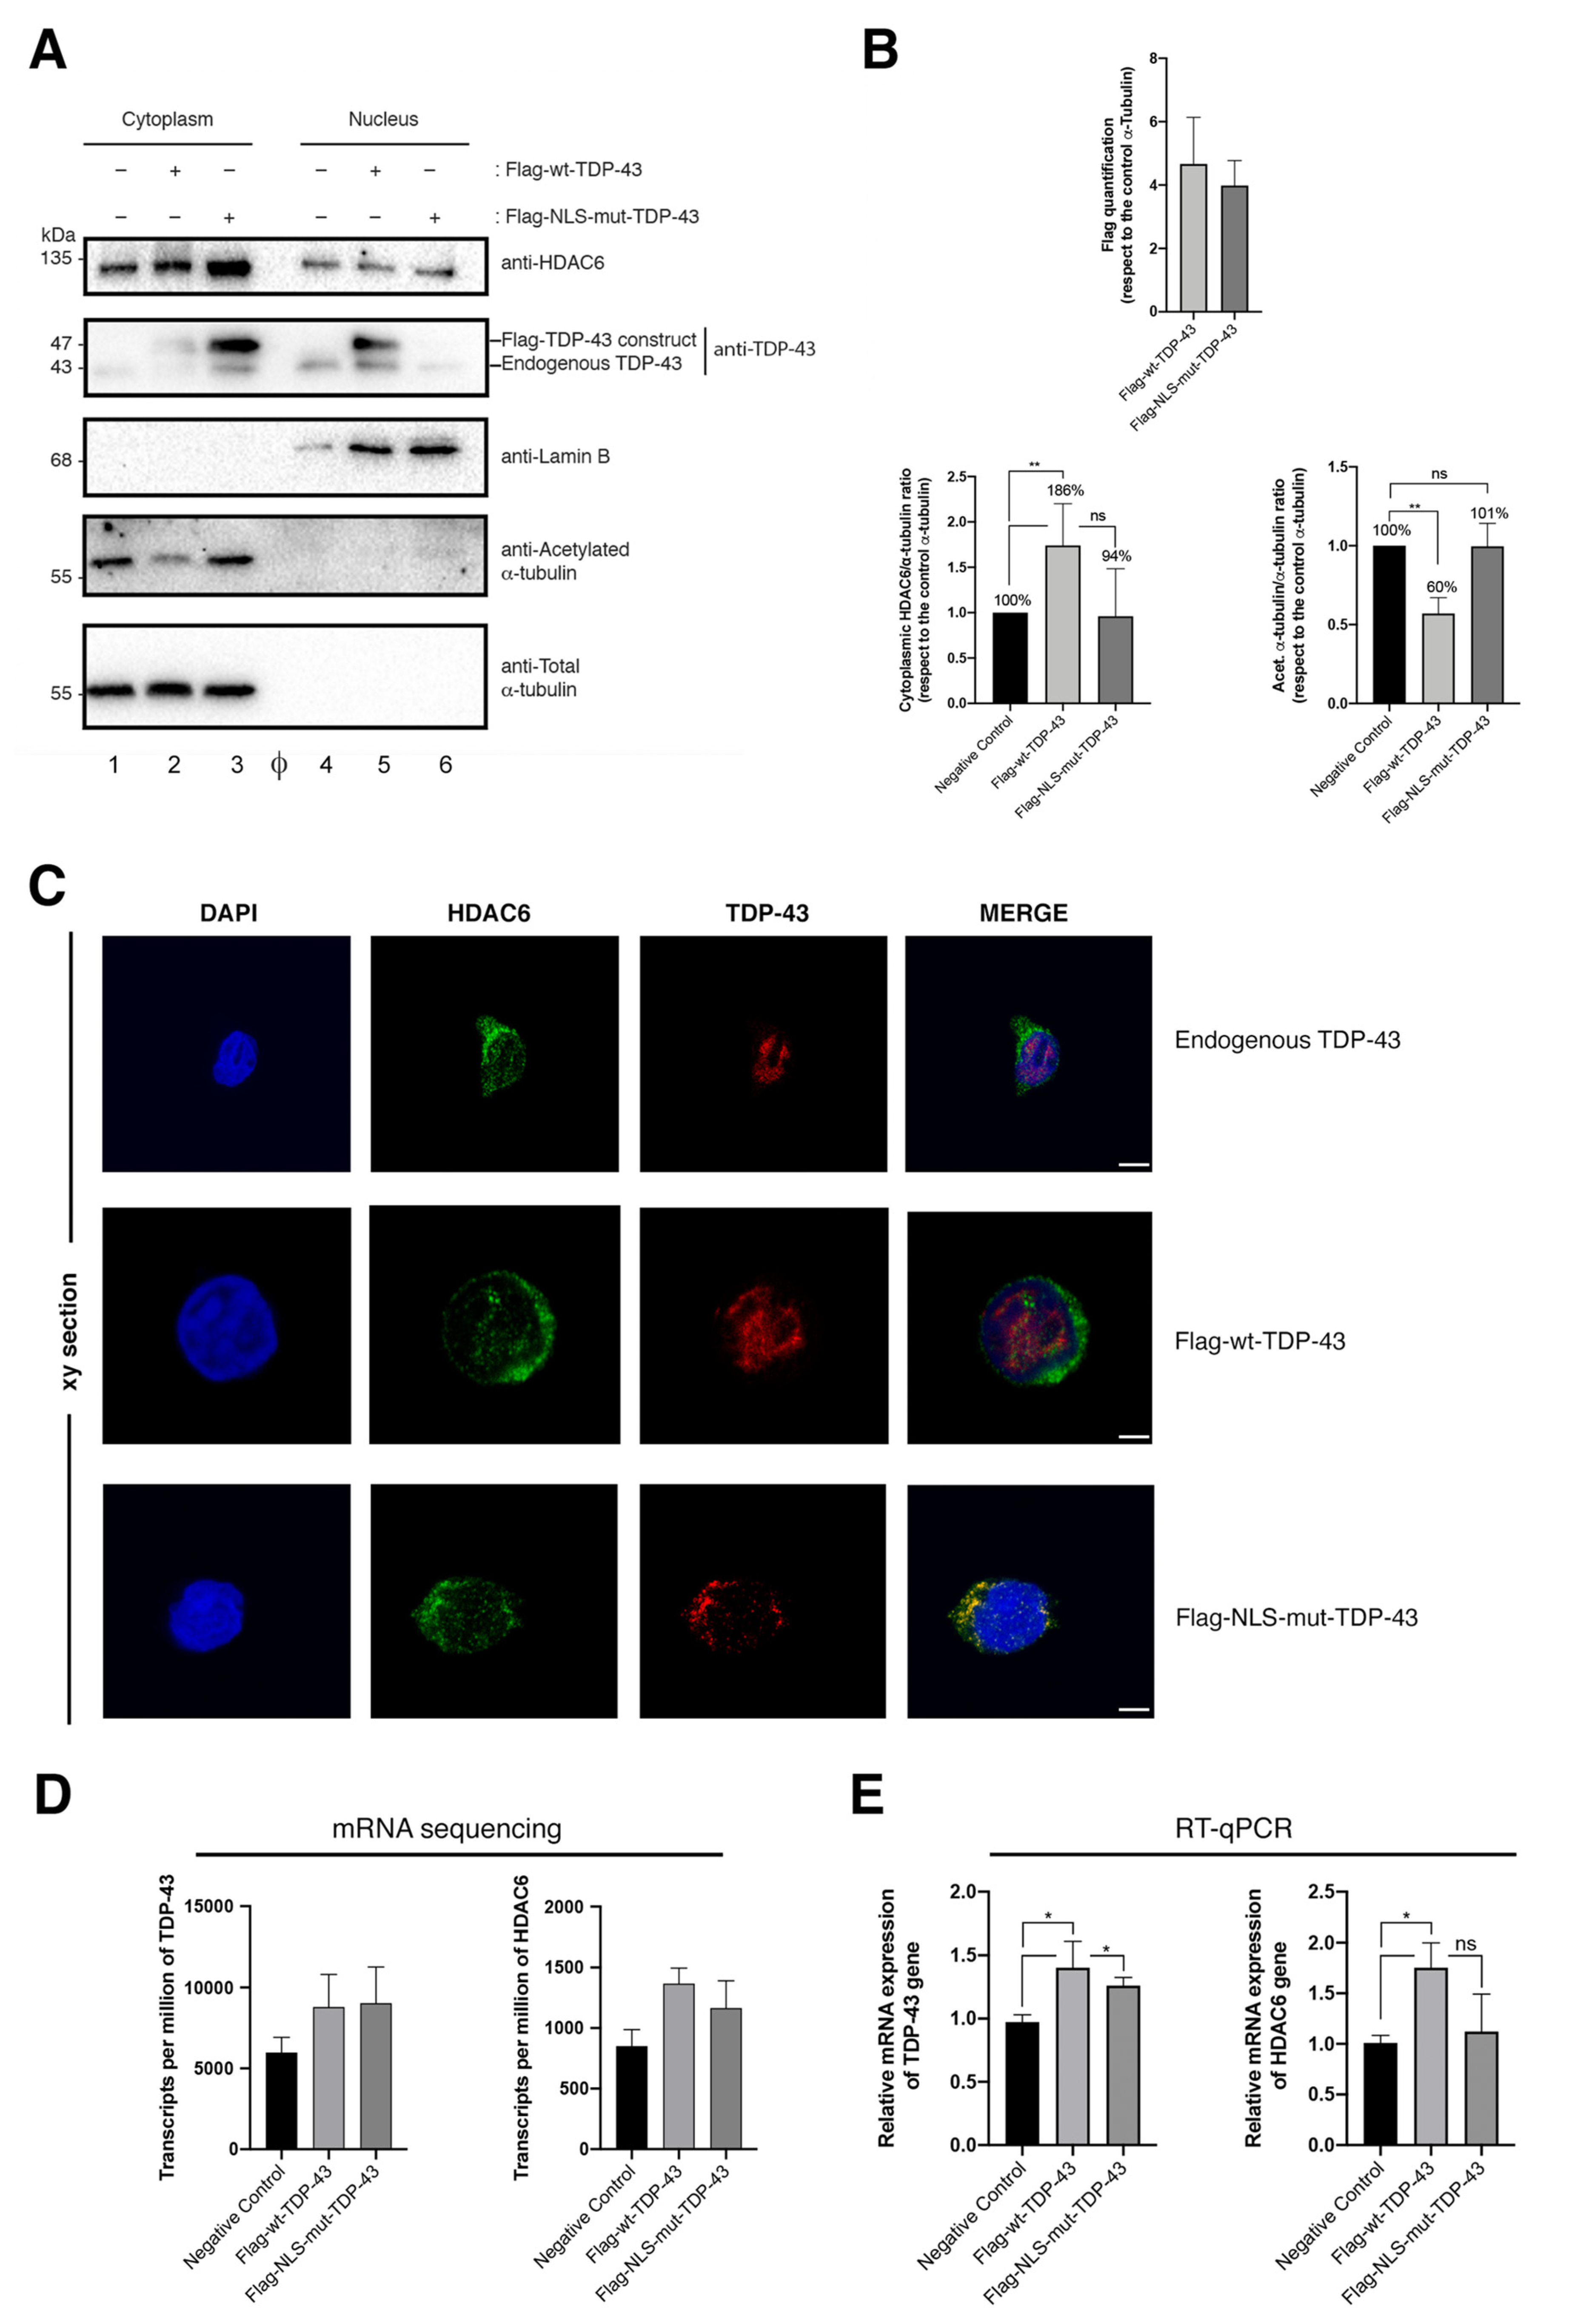
Abstract
:1. Introduction
2. Results
2.1. Characterization of the Expression and Cellular Localization of TDP-43
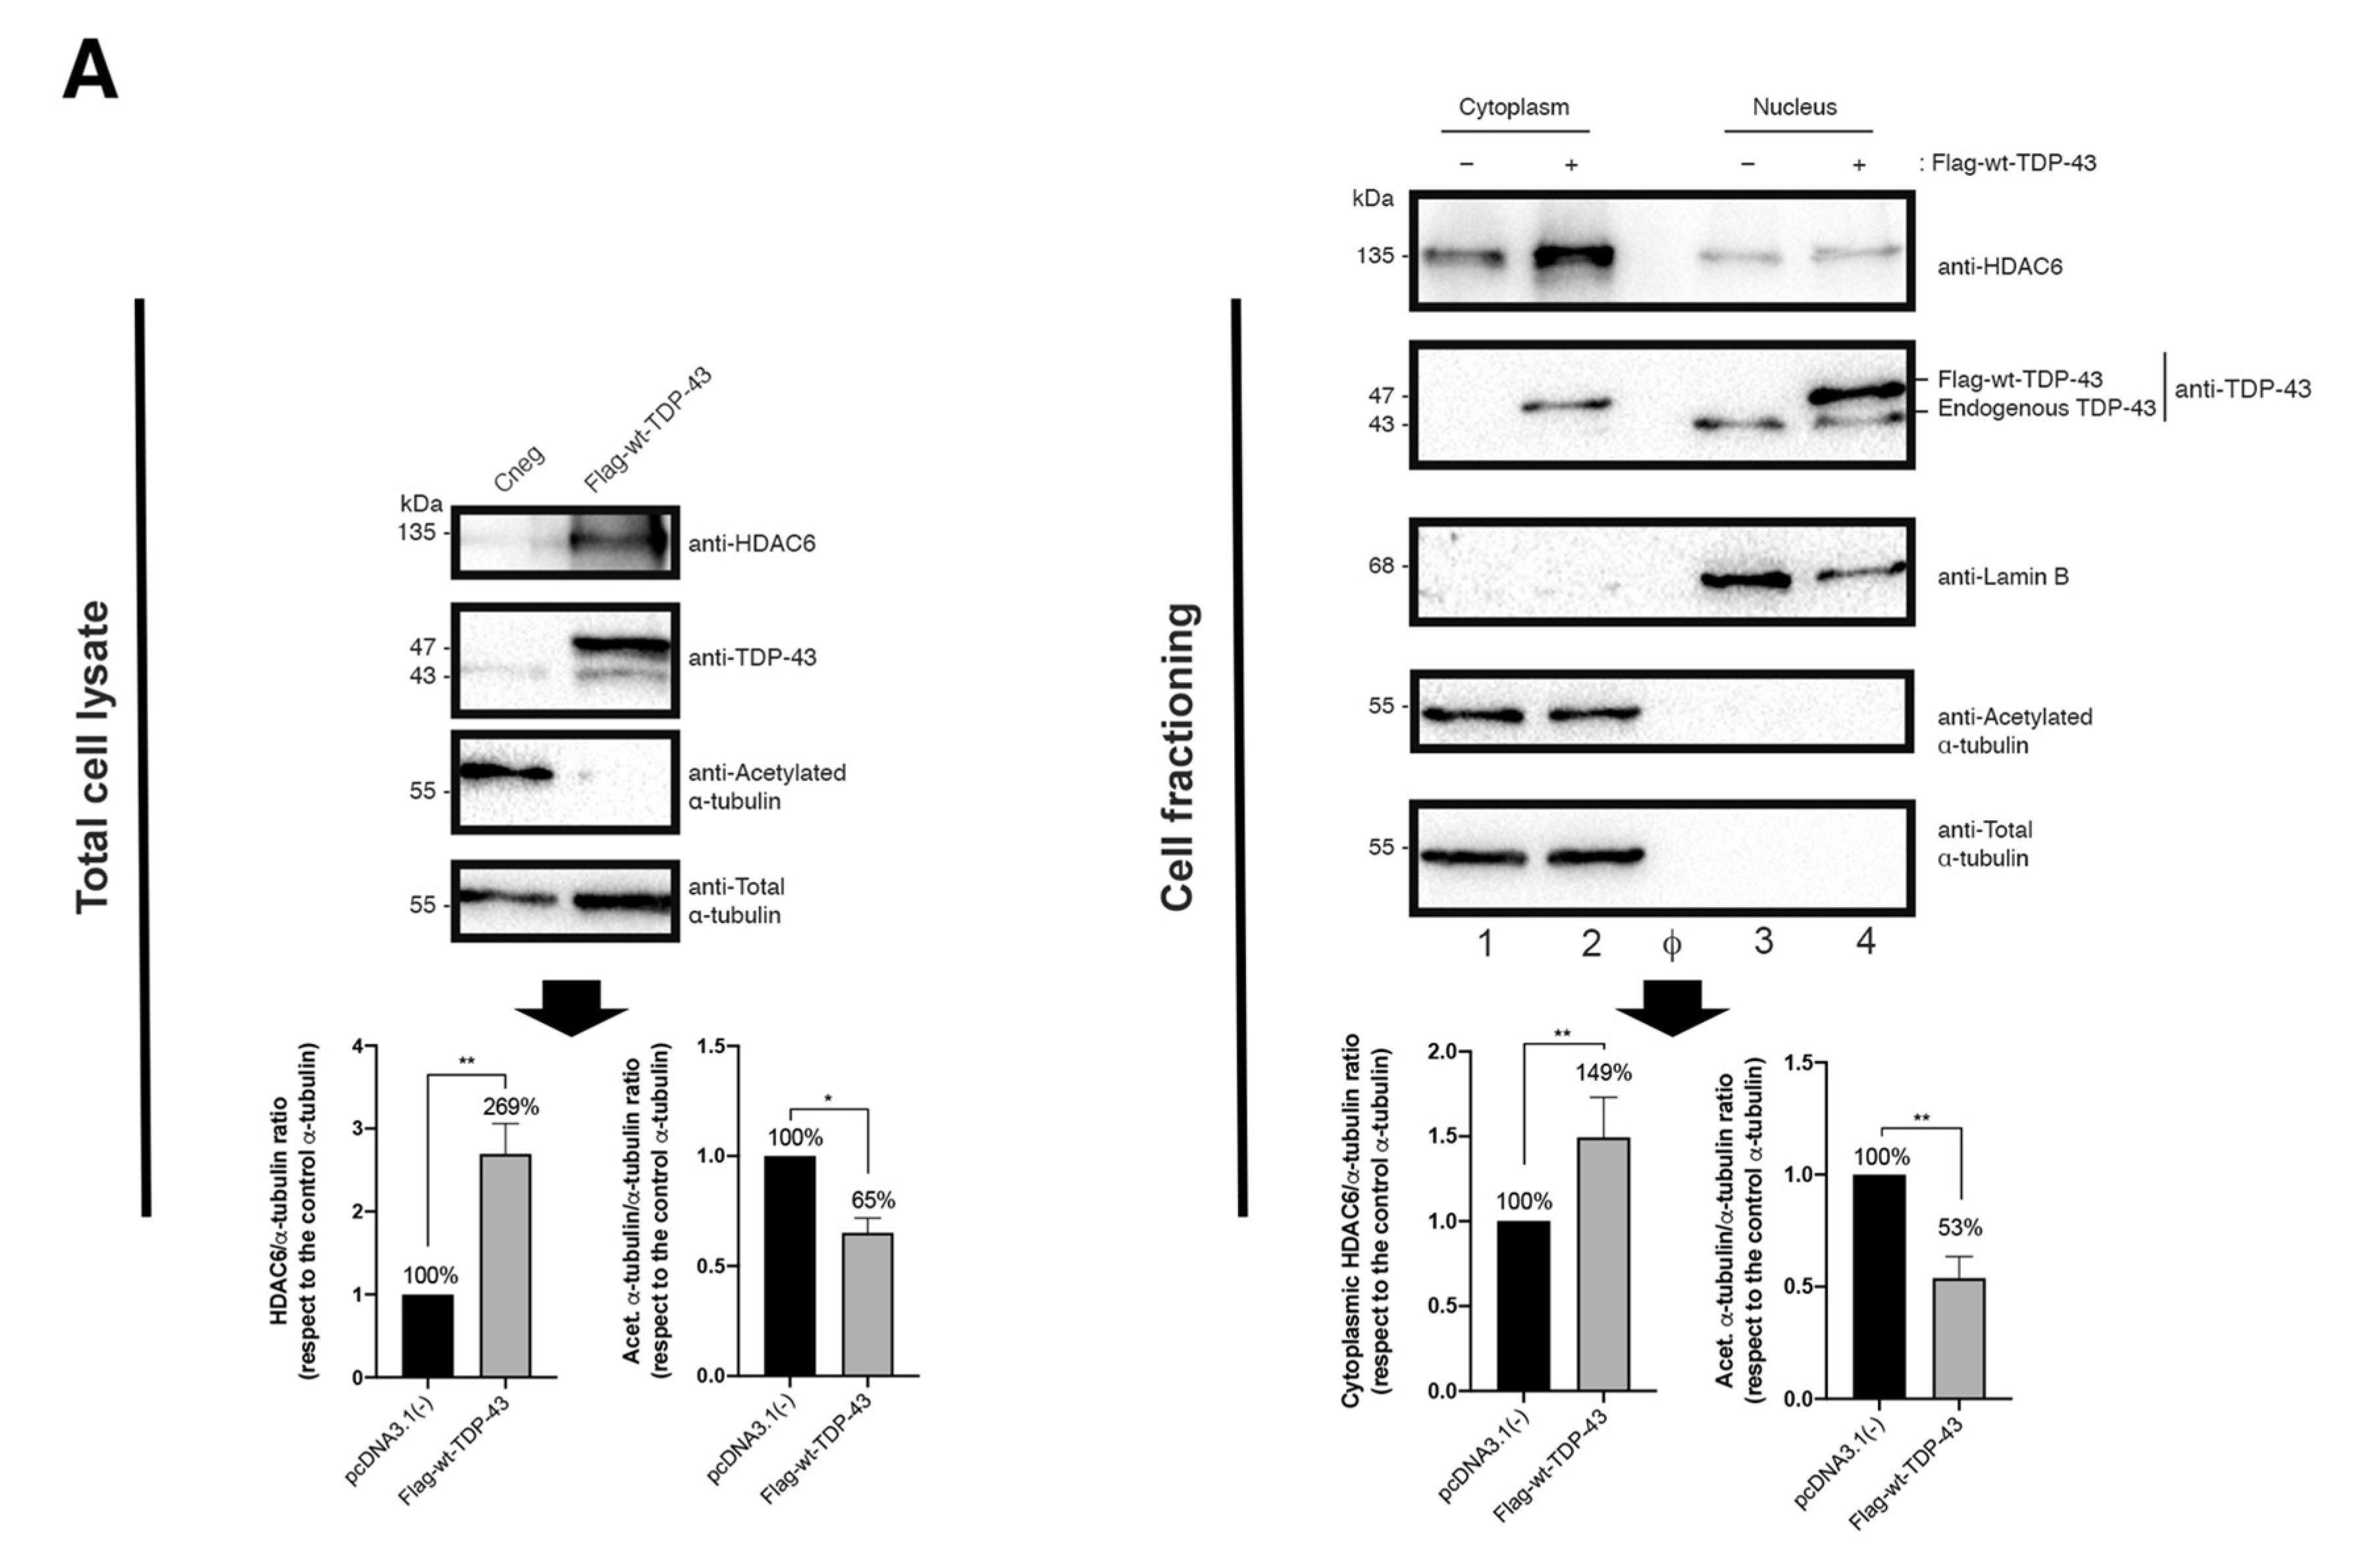
2.2. TDP-43 Stabilizes HDAC6 and Diminishes α-Tubulin Acetylation
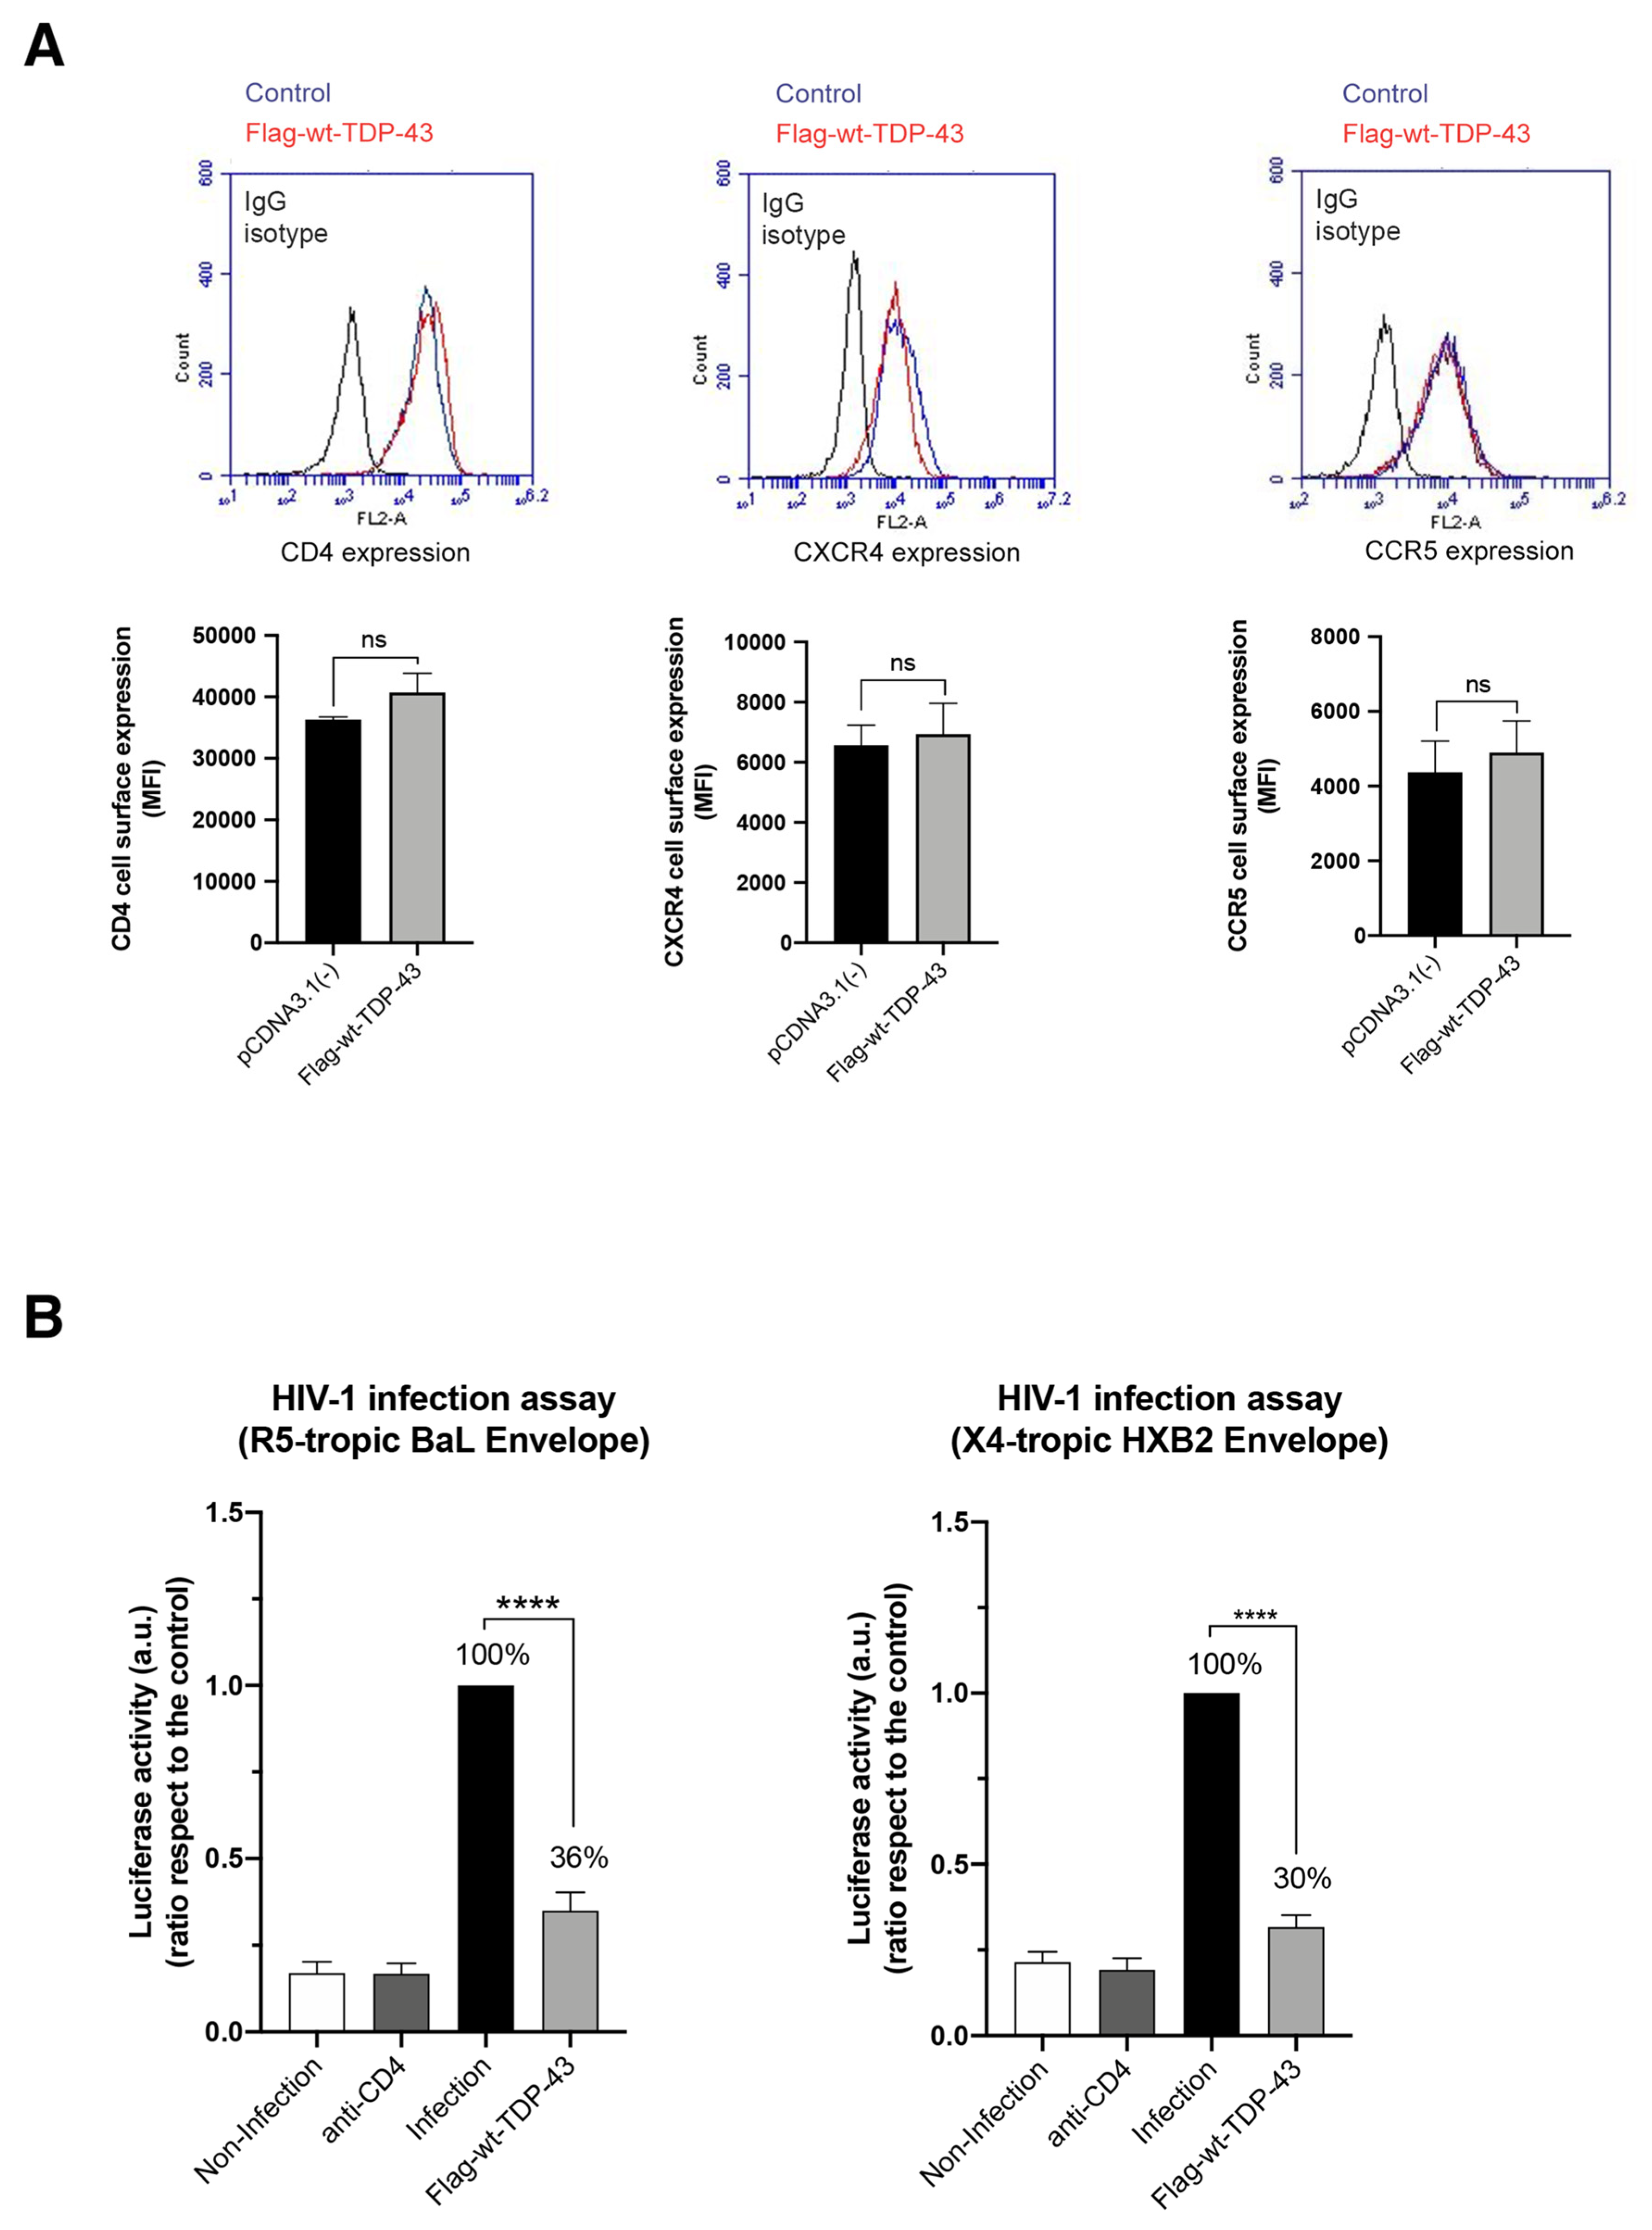
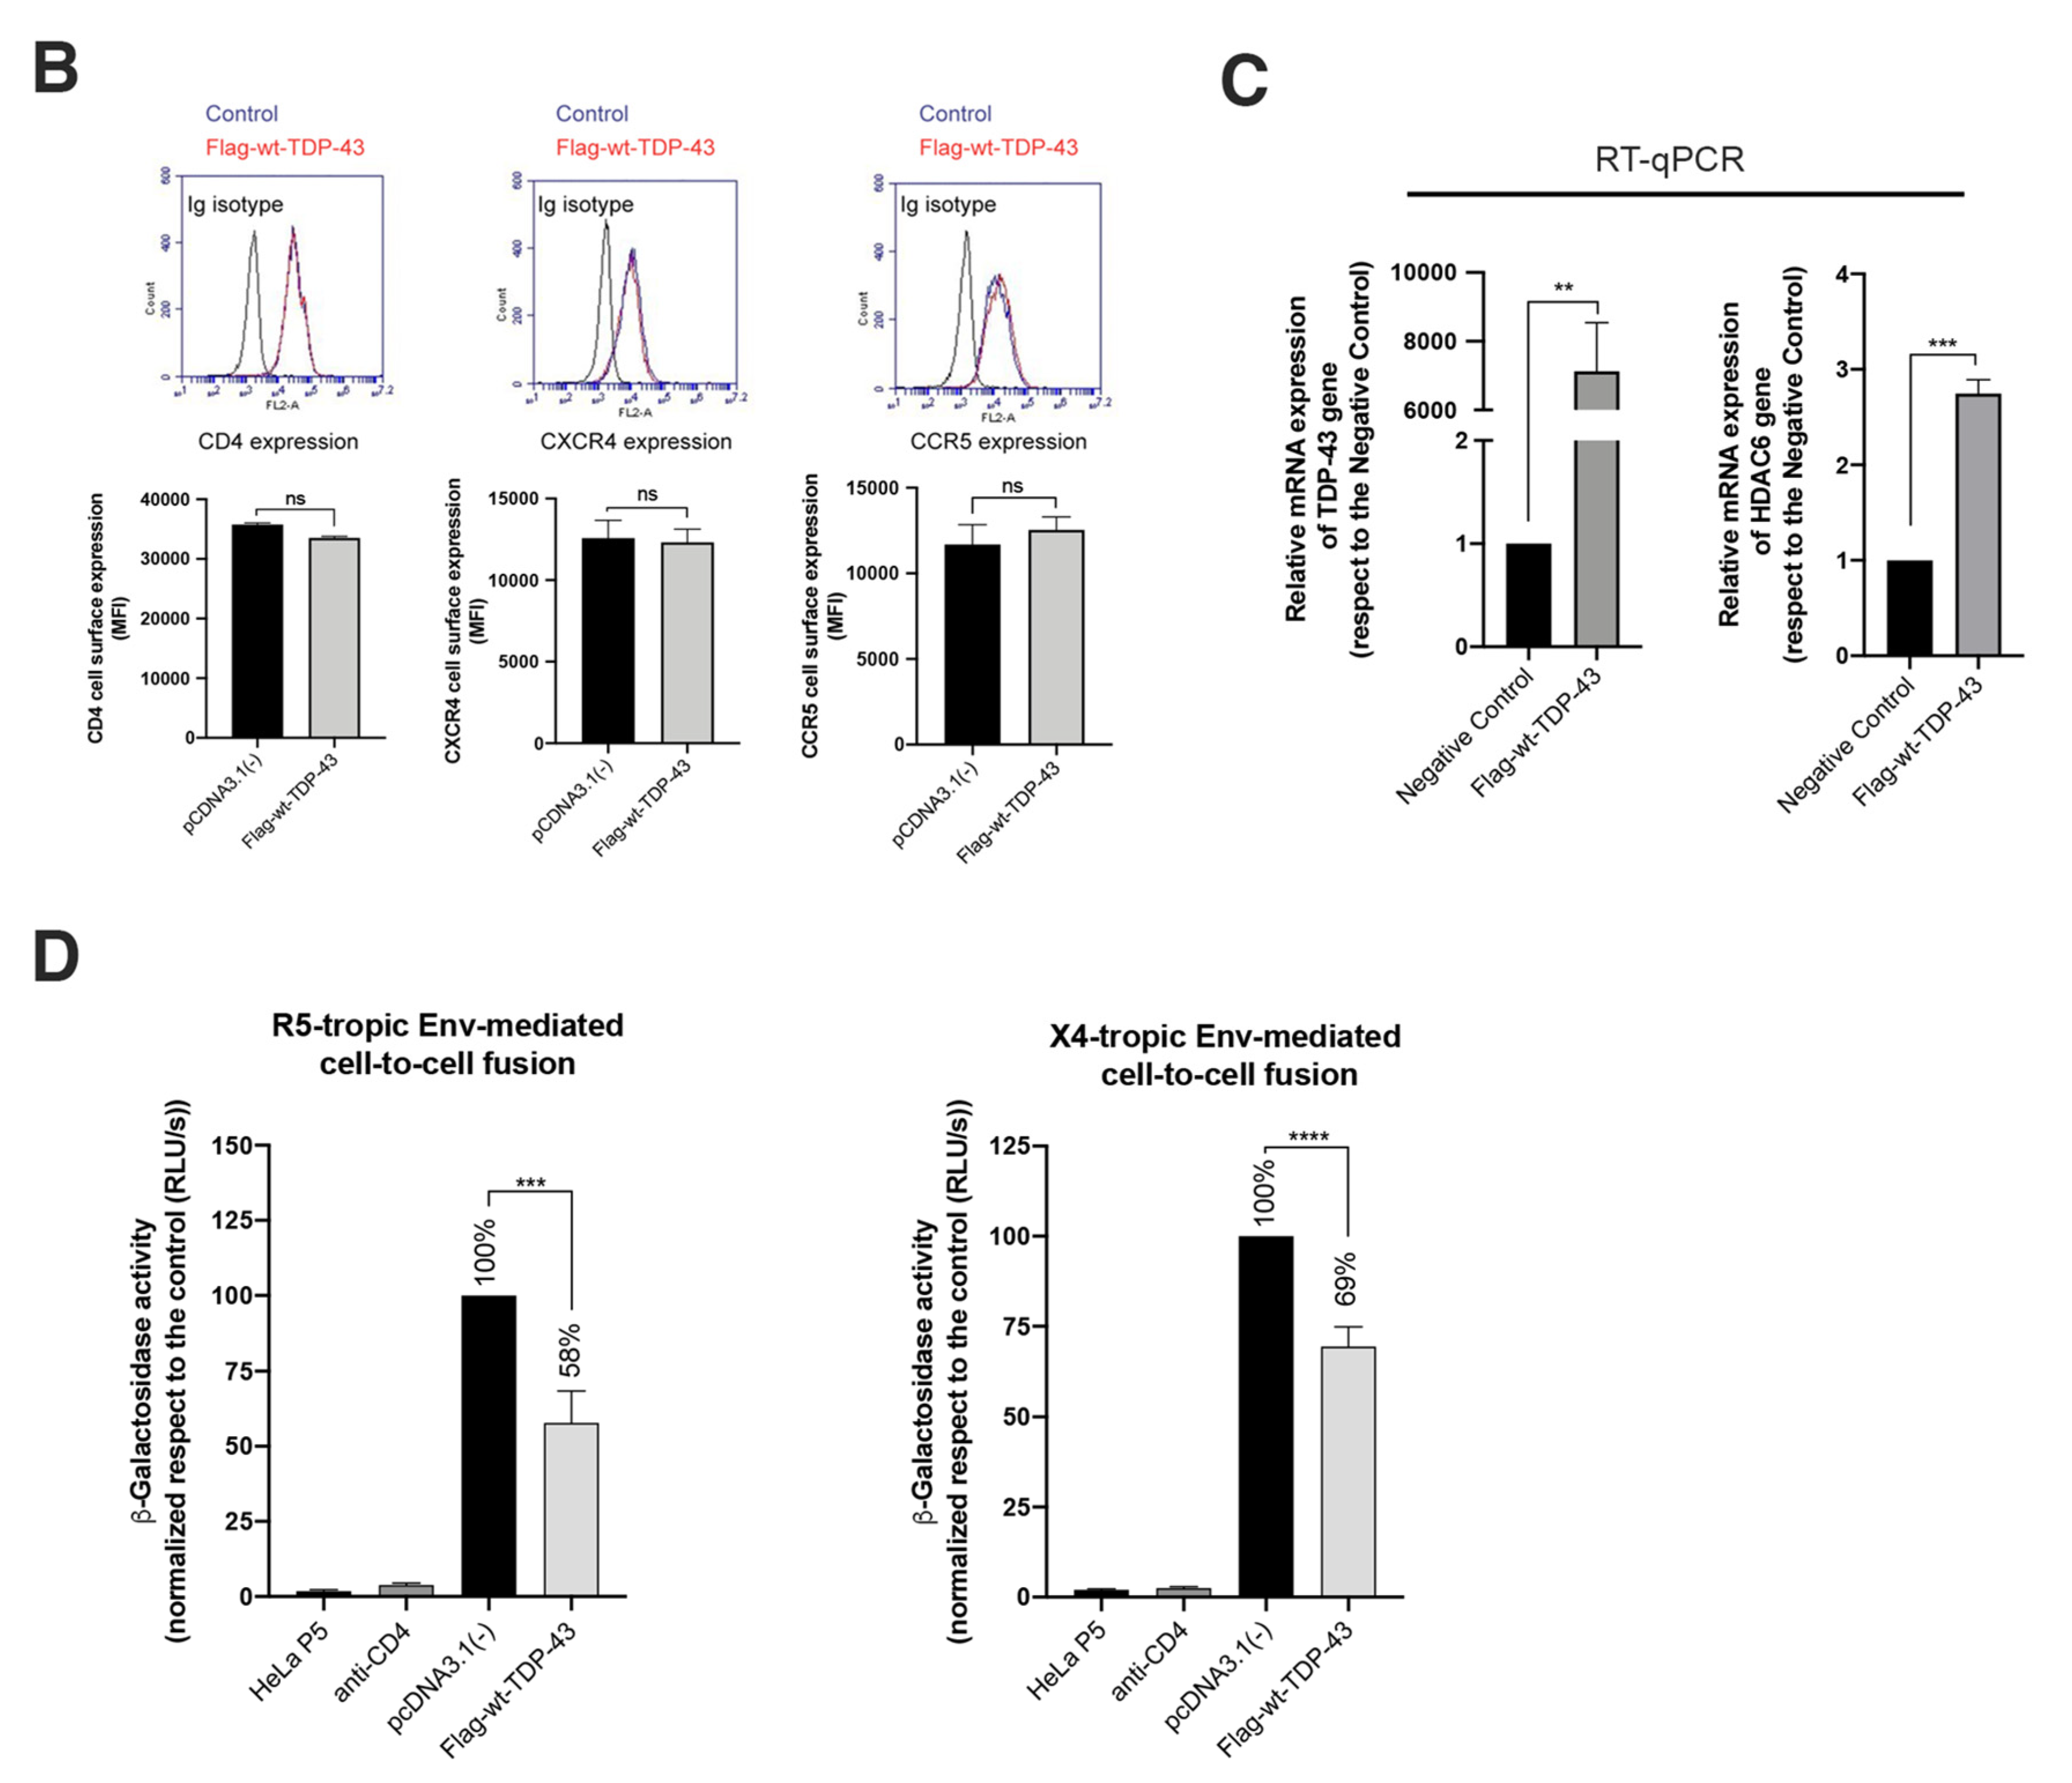
2.3. TDP-43 Overexpression Inhibits HIV-1 Entry and Infection
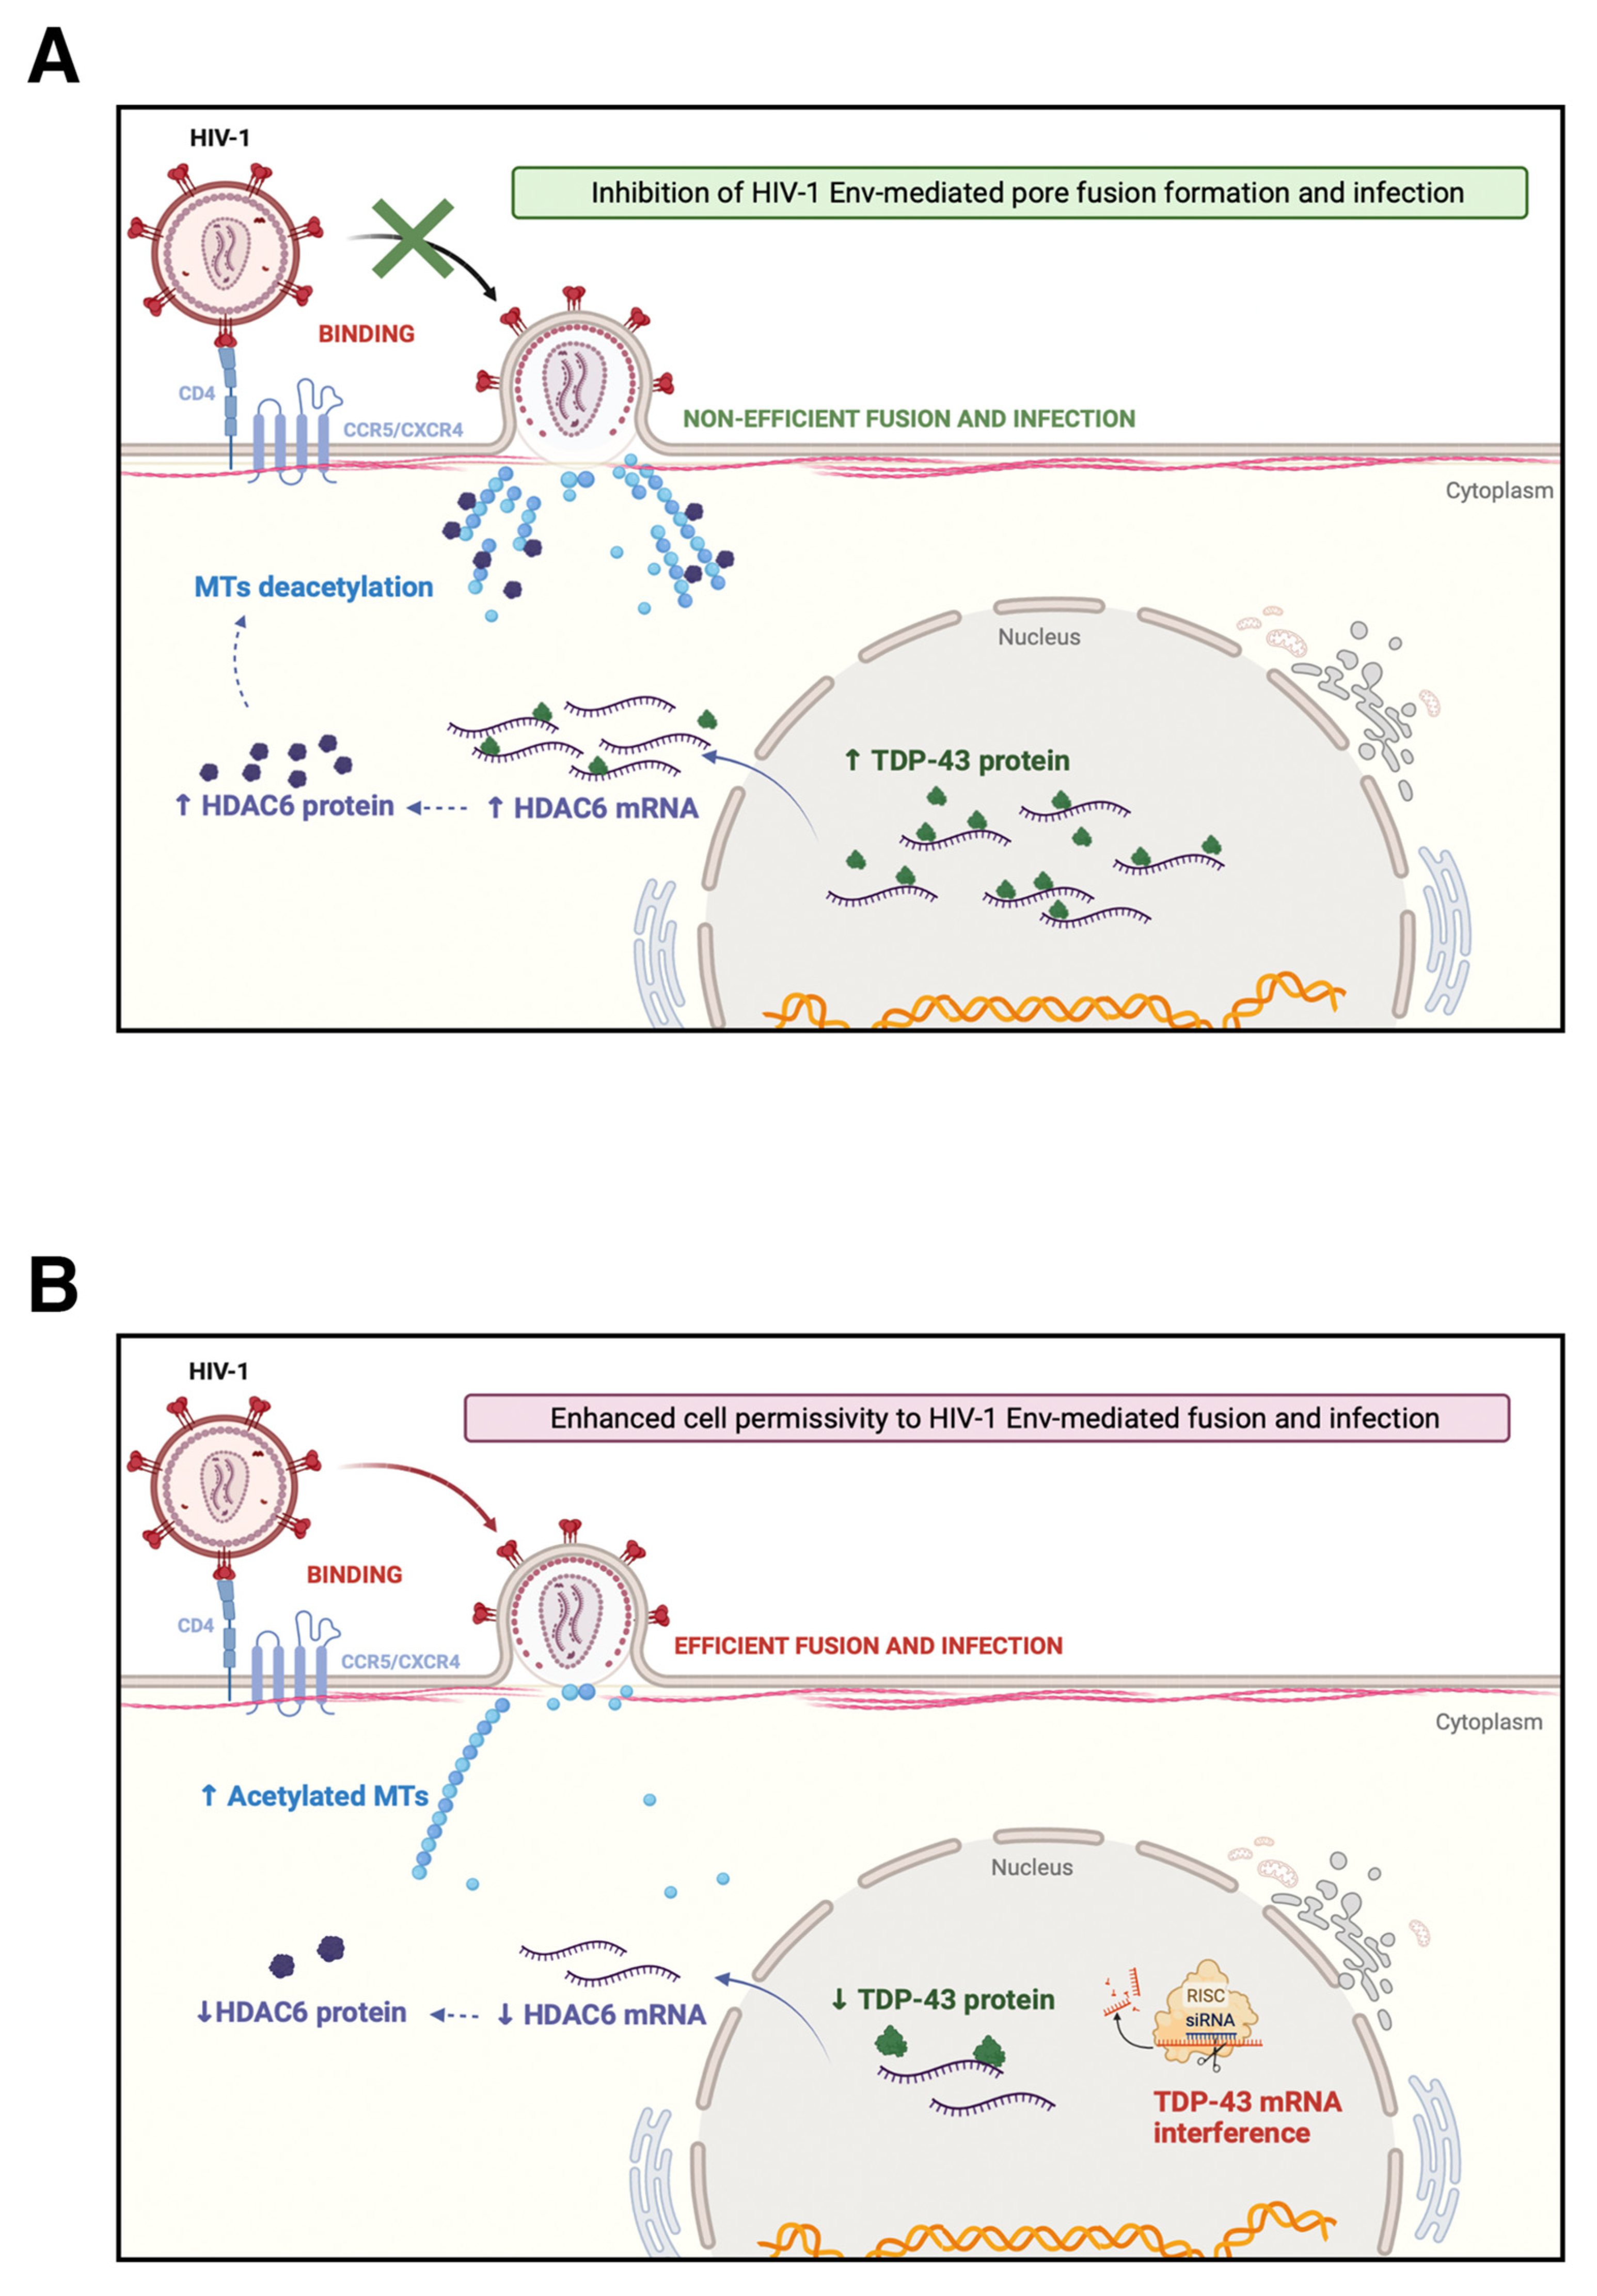
2.4. TDP-43 Overexpression Inhibits HIV-1 Env-Mediated Pore Fusion Formation
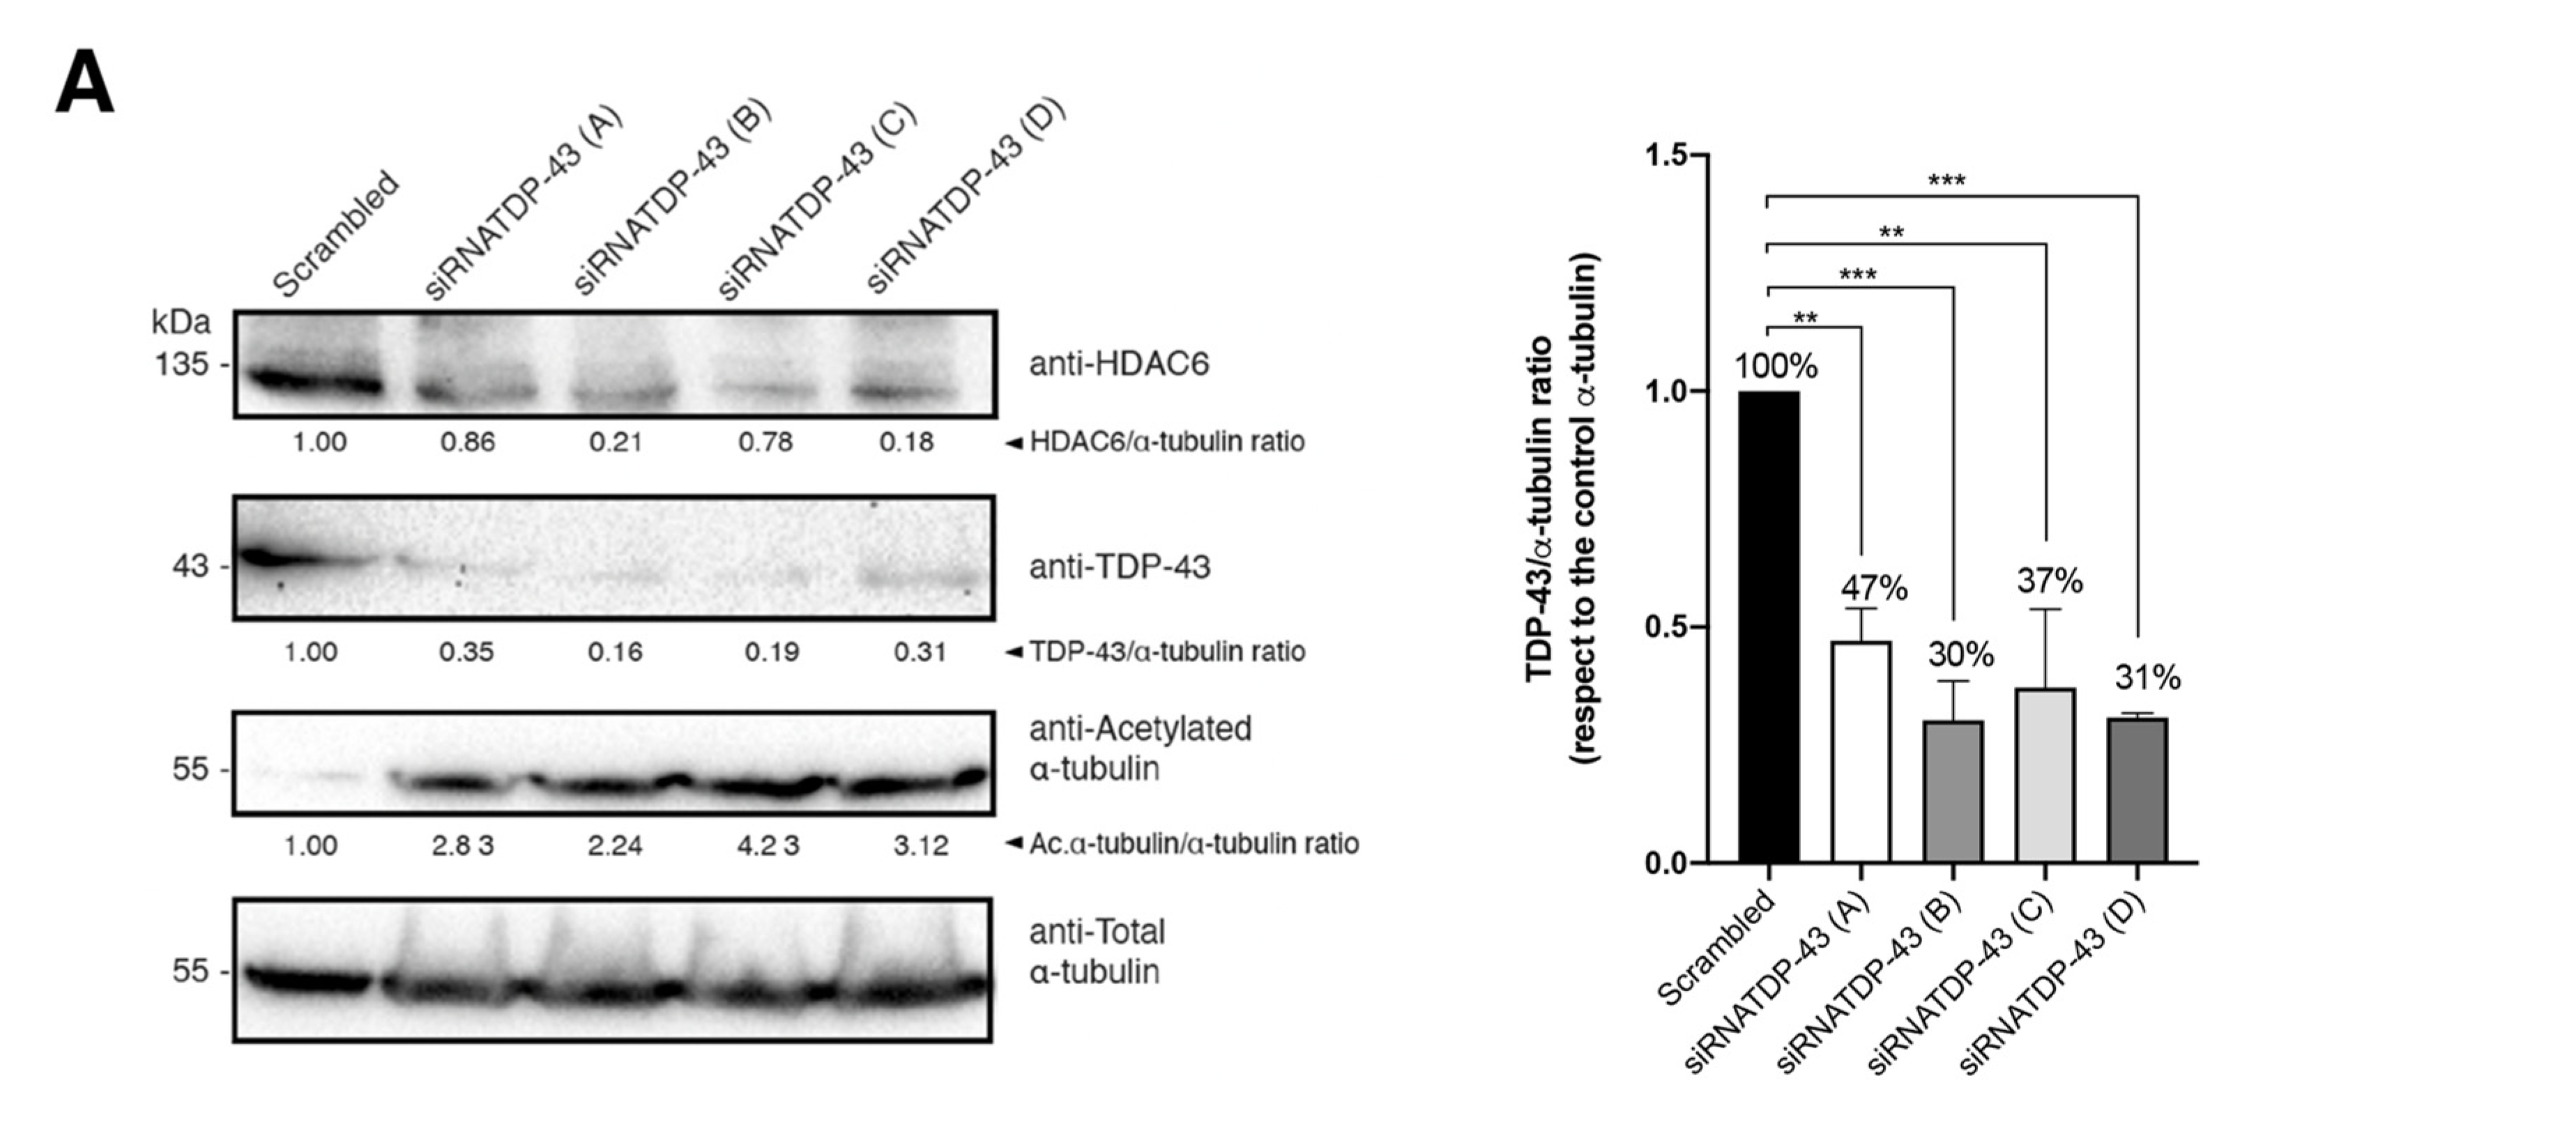
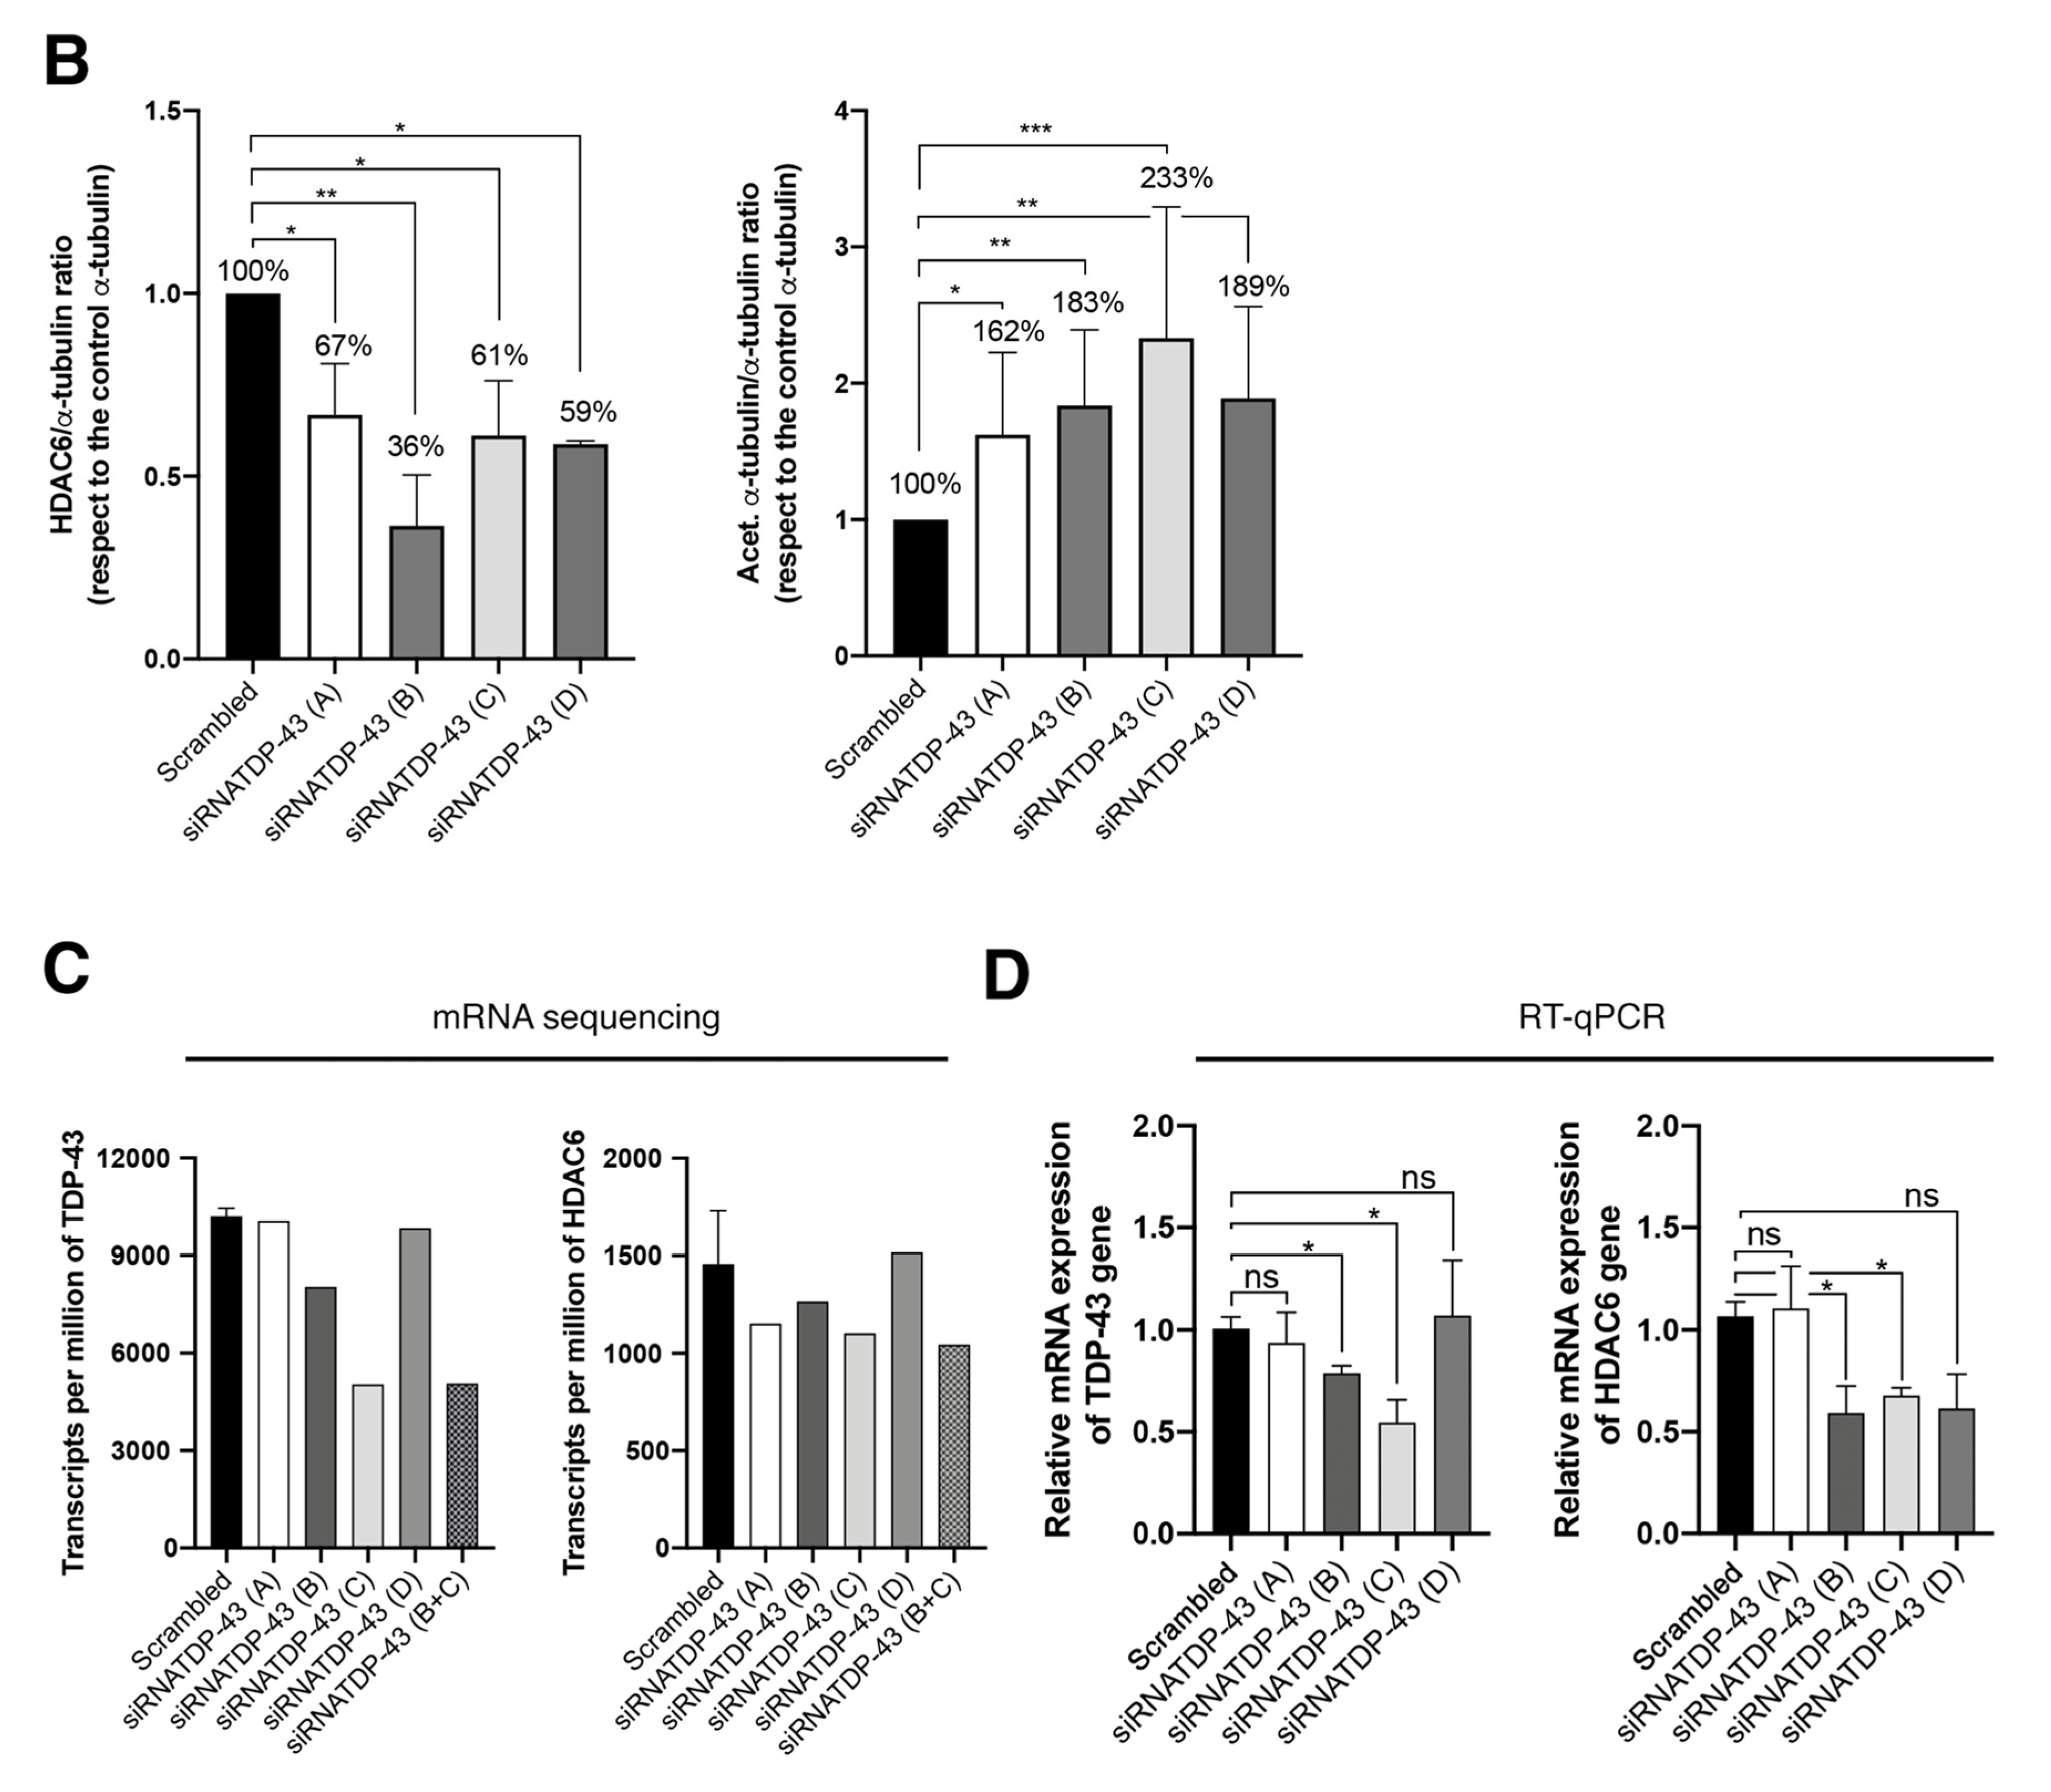
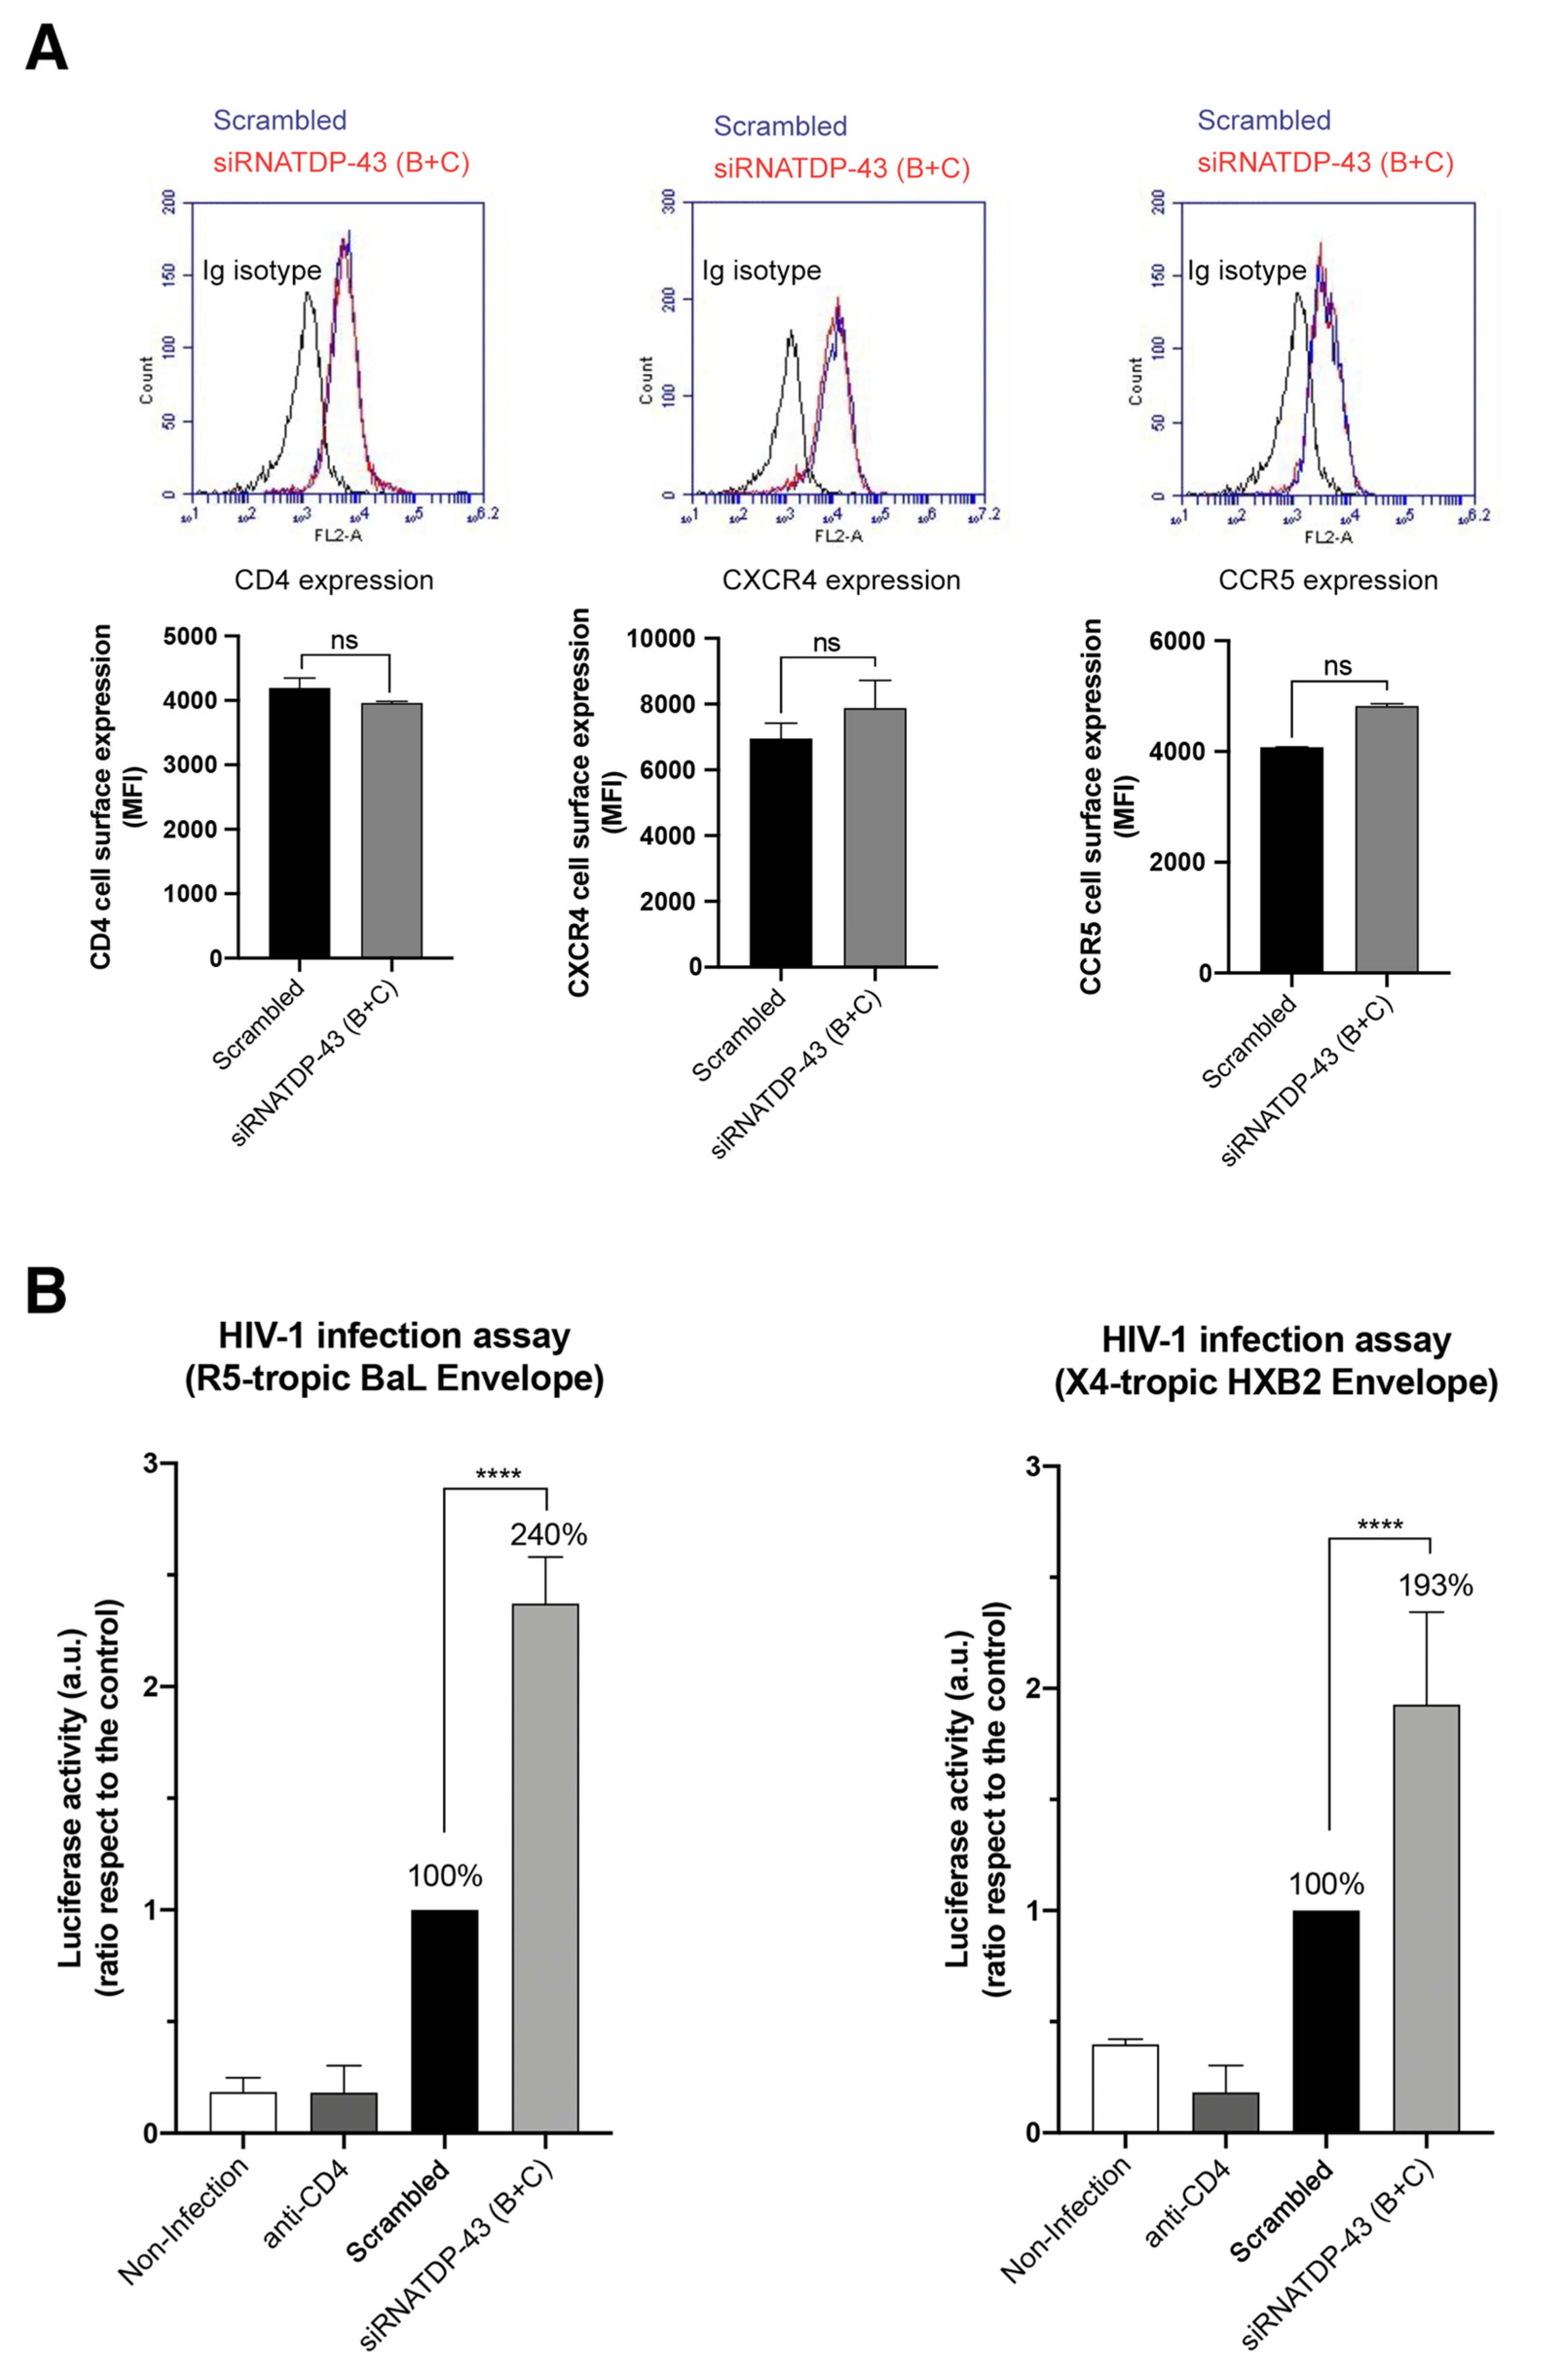
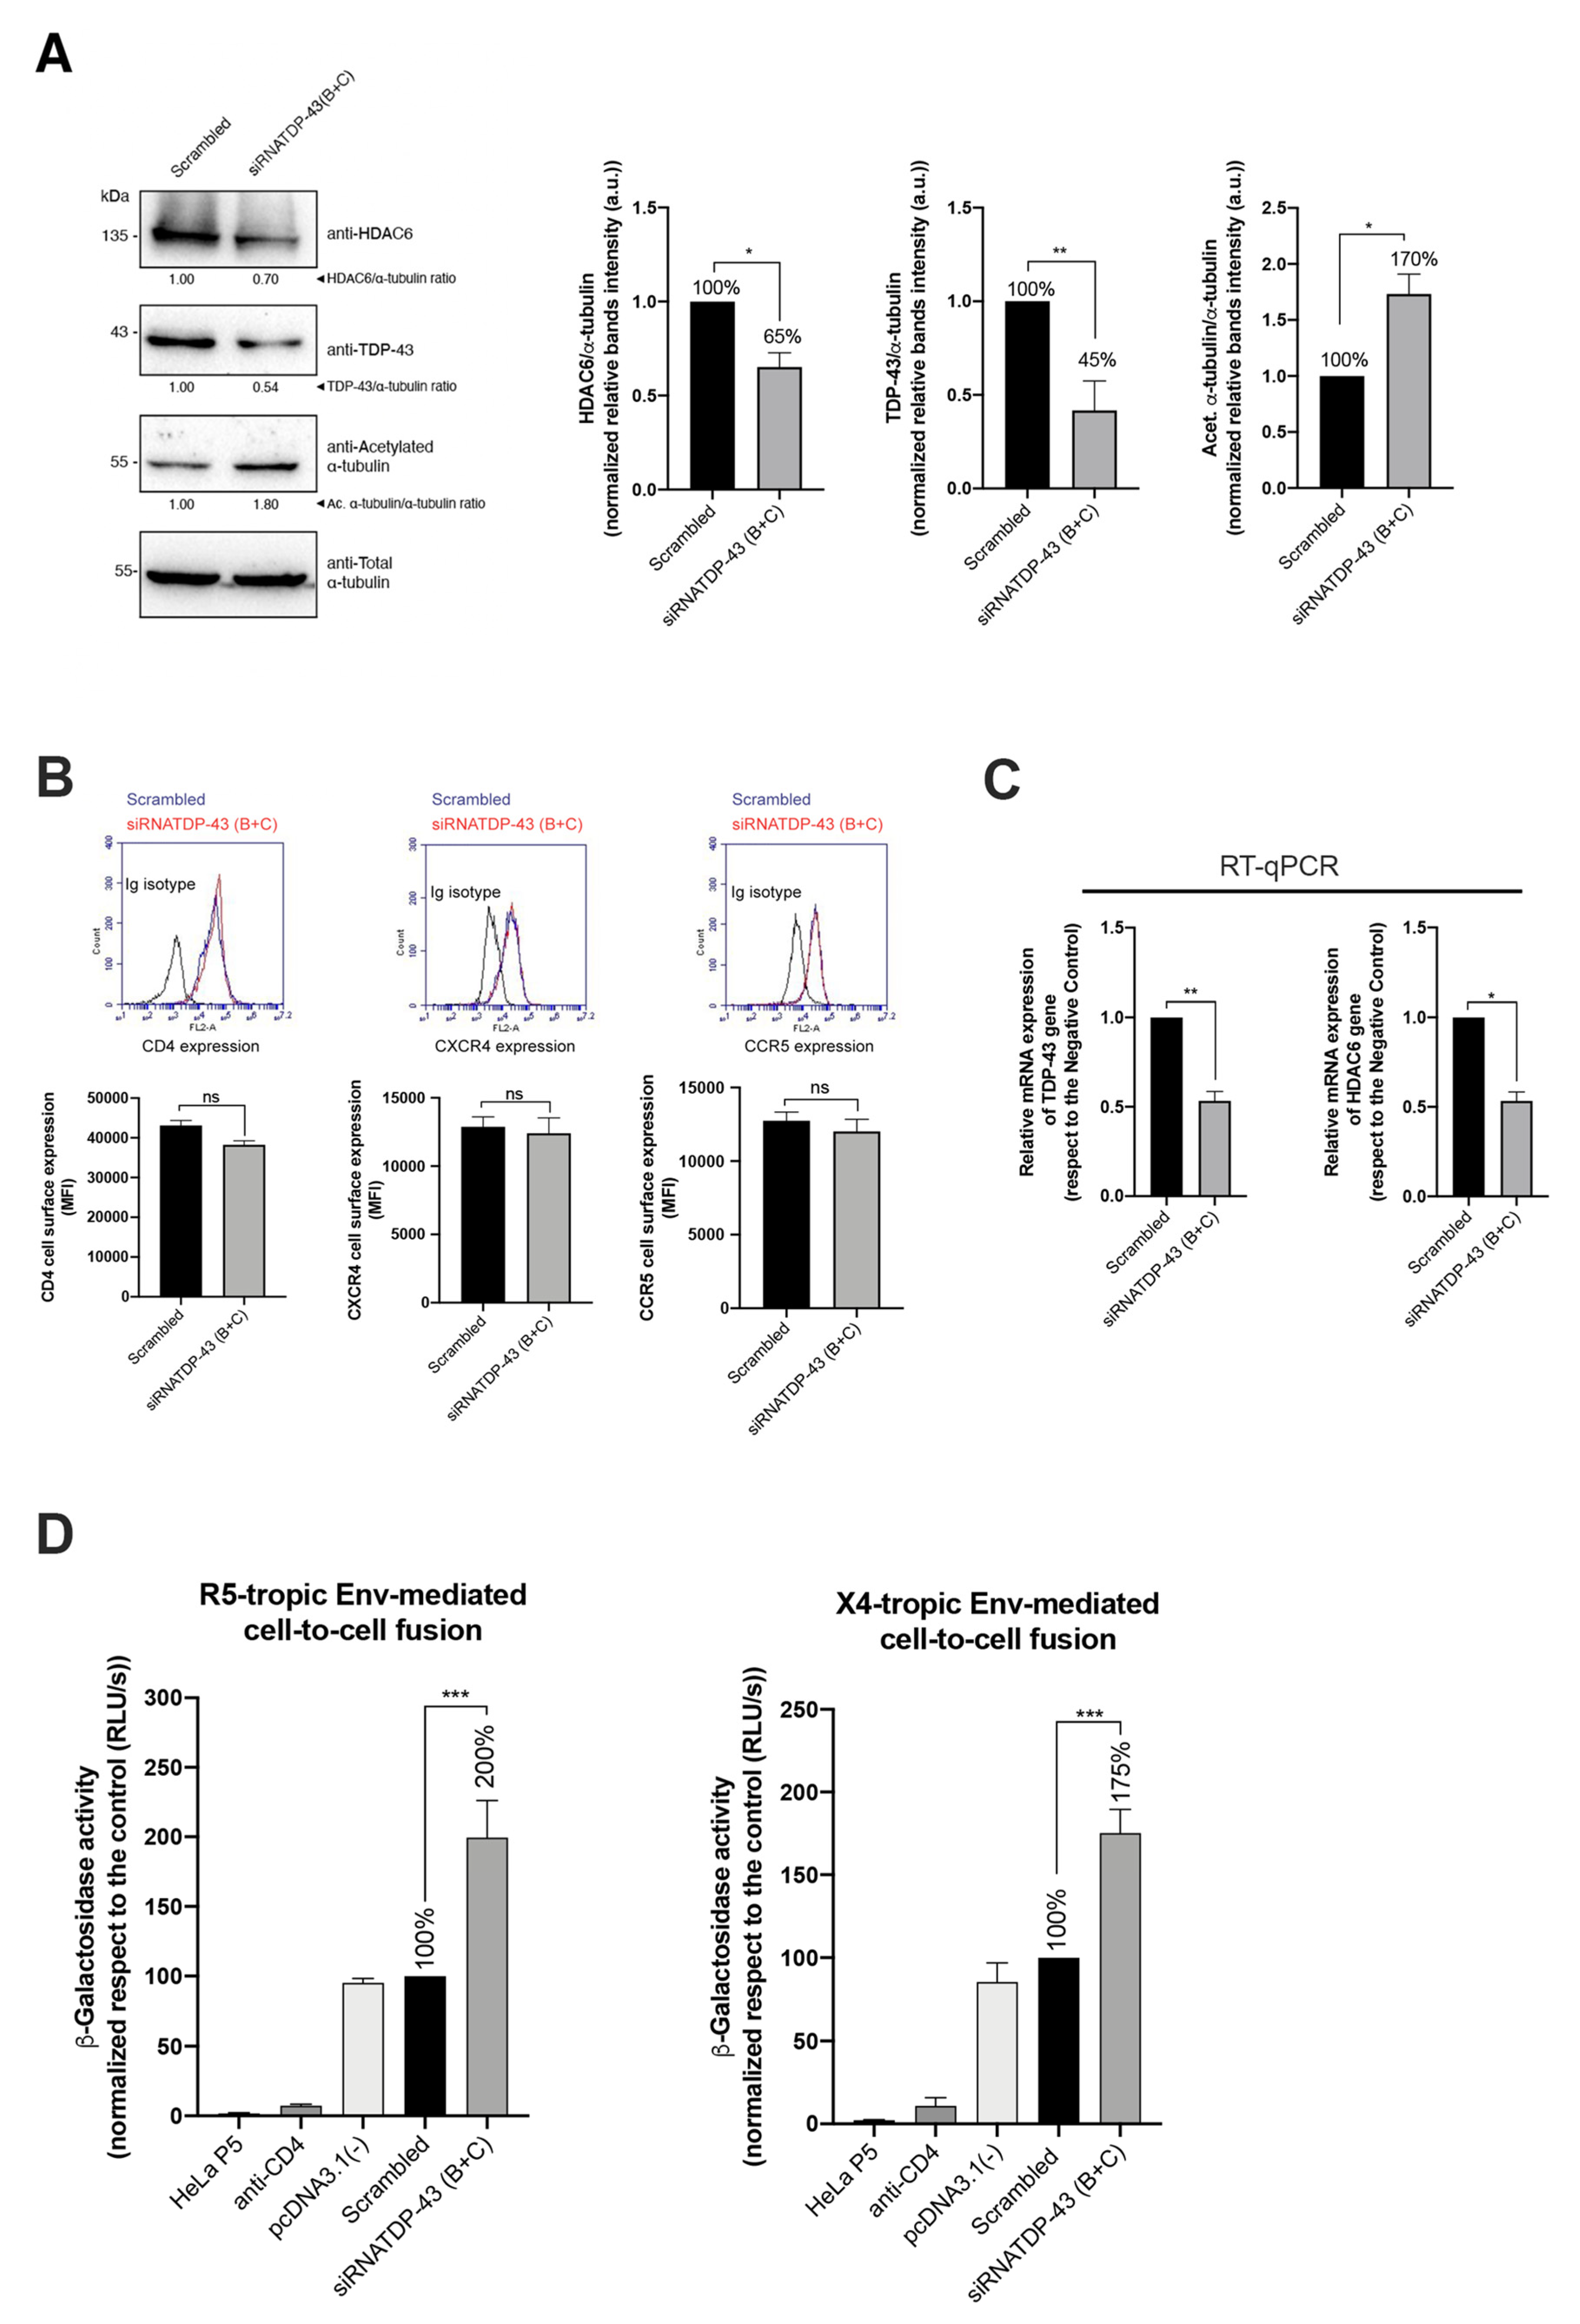
2.5. Specific siRNA Silencing of Endogenous TDP-43 Decreases HDAC6 Protein Level, Increases α-Tubulin Acetylation and Enhances Cell Permissivity to HIV-1 Infection
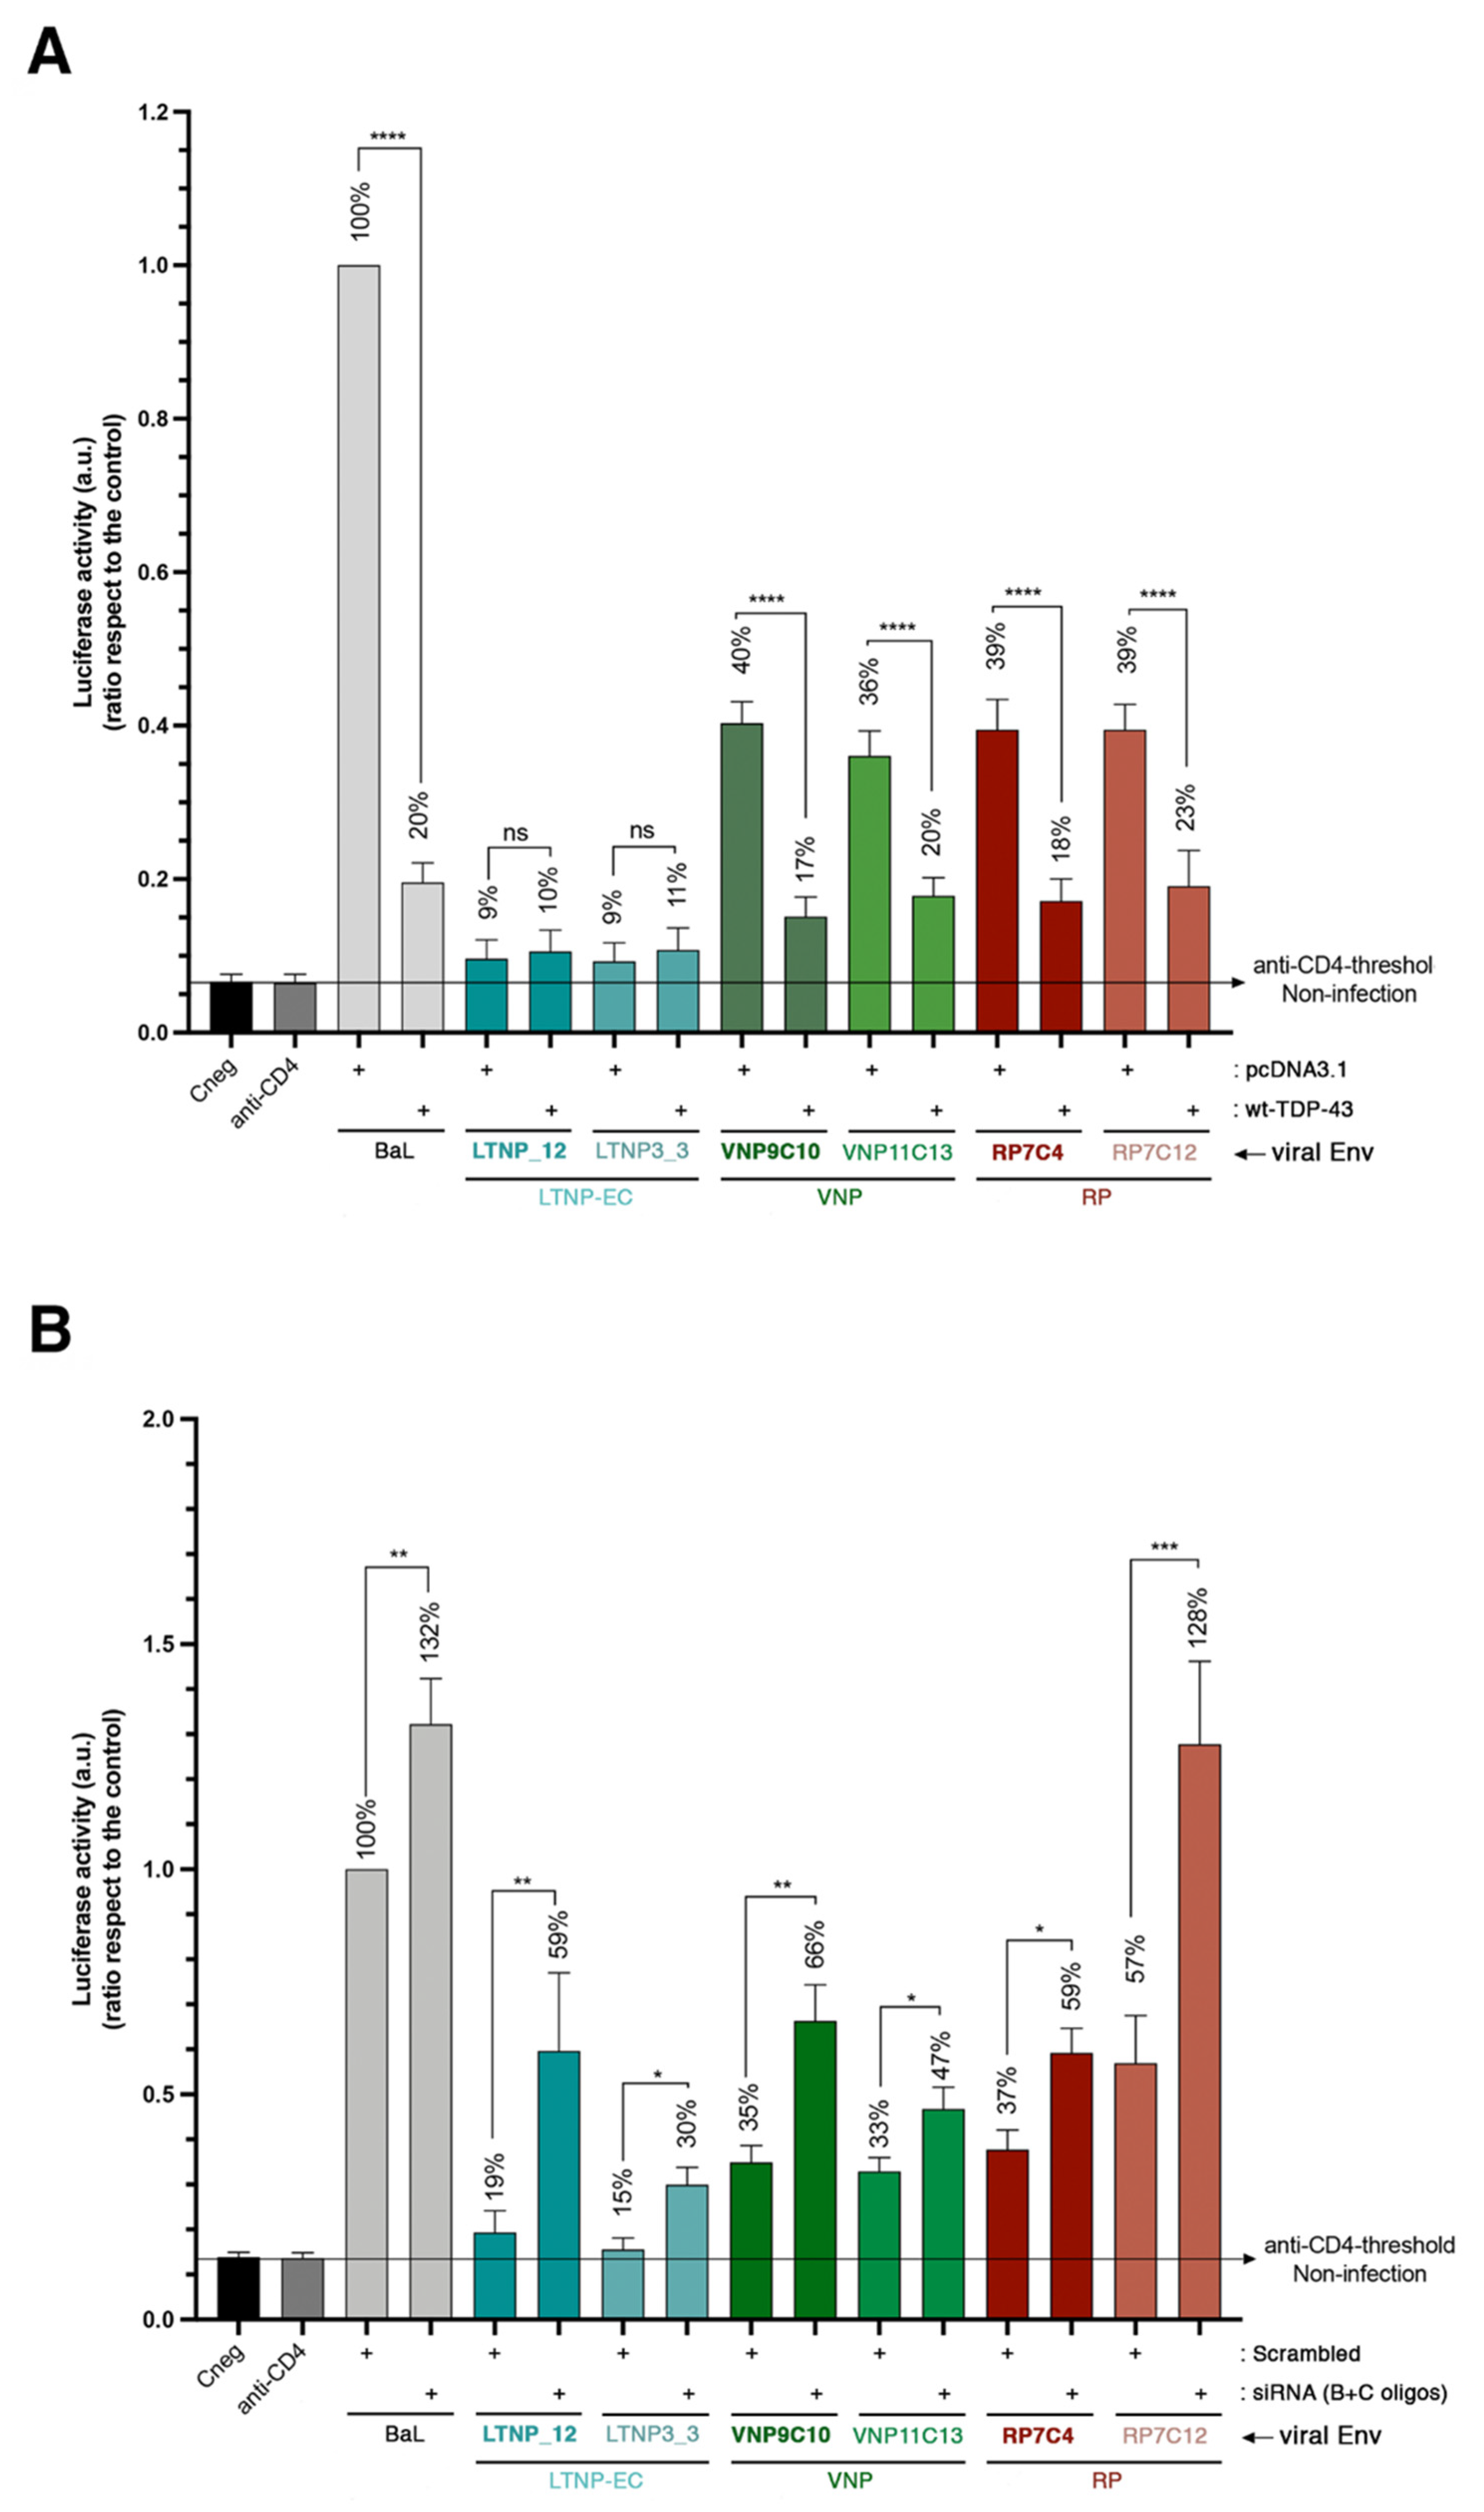
2.6. TDP-43 Affects the Viral Function of Primary Viral Envs from Virus of HIV-1 Individuals with Different Clinical Phenotypes
3. Discussion
4. Materials and Methods
4.1. Antibodies and Reagents
4.2. DNA Plasmids and Viral DNA Constructs
4.3. Primary Env Clones and Ethics Statement
4.4. Cells
4.5. Messenger RNA Silencing
4.6. RNA Extraction and RT-qPCR
4.7. RNA Sequencing
4.7.1. Library Preparation and Sequencing
4.7.2. Bioinformatic Analysis
4.8. Cell Fractioning
4.9. Western Blotting
4.10. Immunofluorescence and Confocal Microscopy Analysis
4.11. Flow Cytometry Analysis
4.12. HIV-1 Env Mediated Cell-to-Cell Fusion Assay
4.13. Production of Viral Particles with Luciferase-Reporter Pseudoviruses
4.14. Luciferase Viral Entry and Infection Assay
4.15. Statistical Analysis
Supplementary Materials
Author Contributions
Funding
Institutional Review Board Statement
Informed Consent Statement
Data Availability Statement
Conflicts of Interest
References
- Brown, A.-L.; Wilkins, O.G.; Keuss, M.J.; Hill, S.E.; Zanovello, M.; Lee, W.C.; Bampton, A.; Lee, F.C.Y.; Masino, L.; Qi, Y.A.; et al. TDP-43 loss and ALS-risk SNPs drive mis-splicing and depletion of UNC13A. Nature 2022, 603, 131–137. [Google Scholar] [CrossRef] [PubMed]
- Ma, X.R.; Prudencio, M.; Koike, Y.; Vatsavayai, S.C.; Kim, G.; Harbinski, F.; Briner, A.; Rodriguez, C.M.; Guo, C.; Akiyama, T.; et al. TDP-43 represses cryptic exon inclusion in the FTD–ALS gene UNC13A. Nature 2022, 603, 124–130. [Google Scholar] [CrossRef] [PubMed]
- Buratti, E.; Baralle, F.E. The multiple roles of TDP-43 in pre-mRNA processing and gene expression regulation. RNA Biol. 2010, 7, 420–429. [Google Scholar] [CrossRef] [Green Version]
- Colombrita, C.; Onesto, E.; Megiorni, F.; Pizzuti, A.; Baralle, F.E.; Buratti, E.; Silani, V.; Ratti, A. TDP-43 and FUS RNA-binding Proteins Bind Distinct Sets of Cytoplasmic Messenger RNAs and Differently Regulate Their Post-transcriptional Fate in Motoneuron-like Cells. J. Biol. Chem. 2012, 287, 15635–15647. [Google Scholar] [CrossRef] [Green Version]
- Tollervey, J.R.; Curk, T.; Rogelj, B.; Briese, M.; Cereda, M.; Kayikci, M.; König, J.; Hortobágyi, T.; Nishimura, A.L.; Župunski, V.; et al. Characterizing the RNA targets and position-dependent splicing regulation by TDP-43. Nat. Neurosci. 2011, 14, 452–458. [Google Scholar] [CrossRef] [Green Version]
- Polymenidou, M.; Lagier-Tourenne, C.; Hutt, K.R.; Huelga, S.C.; Moran, J.; Liang, T.Y.; Ling, S.-C.; Sun, E.; Wancewicz, E.; Mazur, C.; et al. Long pre-mRNA depletion and RNA missplicing contribute to neuronal vulnerability from loss of TDP-43. Nat. Neurosci. 2011, 14, 459–468. [Google Scholar] [CrossRef] [PubMed] [Green Version]
- Kawahara, Y.; Mieda-Sato, A. TDP-43 promotes microRNA biogenesis as a component of the Drosha and Dicer complexes. Proc. Natl. Acad. Sci. USA 2012, 109, 3347–3352. [Google Scholar] [CrossRef] [PubMed] [Green Version]
- Highley, J.R.; Kirby, J.; Jansweijer, J.A.; Webb, P.S.; Hewamadduma, C.A.; Heath, P.R.; Higginbottom, A.; Raman, R.; Ferraiuolo, L.; Cooper-Knock, J.; et al. Loss of nuclear TDP-43 in amyotrophic lateral sclerosis (ALS) causes altered expression of splicing machinery and widespread dysregulation of RNA splicing in motor neurones. Neuropathol. Appl. Neurobiol. 2014, 40, 670–685. [Google Scholar] [CrossRef]
- Ma, X.; Ying, Y.; Xie, H.; Liu, X.; Wang, X.; Li, J. The Regulatory Role of RNA Metabolism Regulator TDP-43 in Human Cancer. Front. Oncol. 2021, 11, 755096. [Google Scholar] [CrossRef]
- Sephton, C.F.; Cenik, C.; Kucukural, A.; Dammer, E.B.; Cenik, B.; Han, Y.; Dewey, C.M.; Roth, F.P.; Herz, J.; Peng, J.; et al. Identification of Neuronal RNA Targets of TDP-43-containing Ribonucleoprotein Complexes. J. Biol. Chem. 2011, 286, 1204–1215. [Google Scholar] [CrossRef] [Green Version]
- Fiesel, F.C.; Voigt, A.; Weber, S.S.; Van den Haute, C.; Waldenmaier, A.; Görner, K.; Walter, M.; Anderson, M.L.; Kern, J.V.; Rasse, T.M.; et al. Knockdown of transactive response DNA-binding protein (TDP-43) downregulates histone deacetylase. EMBO J. 2010, 29, 209–221. [Google Scholar] [CrossRef] [PubMed]
- Simões-Pires, C.; Zwick, V.; Nurisso, A.; Schenker, E.; Carrupt, P.-A.; Cuendet, M. HDAC6 as a target for neurodegenerative diseases: What makes it different from the other HDACs? Mol. Neurodegener. 2013, 8, 7. [Google Scholar] [CrossRef] [PubMed] [Green Version]
- Gao, J.; Wang, L.; Huntley, M.L.; Perry, G.; Wang, X. Pathomechanisms of TDP-43 in neurodegeneration. J. Neurochem. 2018, 146, 7–20. [Google Scholar] [CrossRef] [PubMed]
- Guo, W.; Bosch, L.V.D. Therapeutic potential of HDAC6 in amyotrophic lateral sclerosis. Cell Stress 2017, 2, 14–16. [Google Scholar] [CrossRef] [Green Version]
- Odagiri, S.; Tanji, K.; Mori, F.; Miki, Y.; Kakita, A.; Takahashi, H.; Wakabayashi, K. Brain expression level and activity of HDAC6 protein in neurodegenerative dementia. Biochem. Biophys. Res. Commun. 2013, 430, 394–399. [Google Scholar] [CrossRef]
- Lemos, M.; Stefanova, N. Histone Deacetylase 6 and the Disease Mechanisms of α-Synucleinopathies. Front. Synaptic Neurosci. 2020, 12, 586453. [Google Scholar] [CrossRef]
- Trzeciakiewicz, H.; Ajit, D.; Tseng, J.-H.; Chen, Y.; Ajit, A.; Tabassum, Z.; Lobrovich, R.; Peterson, C.; Riddick, N.V.; Itano, M.S.; et al. An HDAC6-dependent surveillance mechanism suppresses tau-mediated neurodegeneration and cognitive decline. Nat. Commun. 2020, 11, 5522. [Google Scholar] [CrossRef]
- Cykowski, M.D.; Powell, S.Z.; Peterson, L.; Appel, J.W.; Rivera, A.L.; Takei, H.; Chang, E.; Appel, S.H. Clinical Significance of TDP-43 Neuropathology in Amyotrophic Lateral Sclerosis. J. Neuropathol. Exp. Neurol. 2017, 76, 402–413. [Google Scholar] [CrossRef]
- Kwong, L.K.; Neumann, M.; Sampathu, D.M.; Lee, V.M.-Y.; Trojanowski, J.Q. TDP-43 proteinopathy: The neuropathology underlying major forms of sporadic and familial frontotemporal lobar degeneration and motor neuron disease. Acta Neuropathol. 2007, 114, 63–70. [Google Scholar] [CrossRef]
- Ou, S.H.; Wu, F.; Harrich, D.; García-Martínez, L.F.; Gaynor, R.B. Cloning and characterization of a novel cellular protein, TDP-43, that binds to human immunodeficiency virus type 1 TAR DNA sequence motifs. J. Virol. 1995, 69, 3584–3596. [Google Scholar] [CrossRef] [Green Version]
- Wang, H.-Y.; Wang, I.-F.; Bose, J.; Shen, C.-K. Structural diversity and functional implications of the eukaryotic TDP gene family. Genomics 2004, 83, 130–139. [Google Scholar] [CrossRef]
- Buratti, E.; Baralle, F.E. Characterization and Functional Implications of the RNA Binding Properties of Nuclear Factor TDP-43, a Novel Splicing Regulator ofCFTR Exon. J. Biol. Chem. 2001, 276, 36337–36343. [Google Scholar] [CrossRef] [Green Version]
- Nehls, J.; Koppensteiner, H.; Brack-Werner, R.; Floss, T.; Schindler, M. HIV-1 Replication in Human Immune Cells Is Independent of TAR DNA Binding Protein 43 (TDP-43) Expression. PLoS ONE 2014, 9, e105478. [Google Scholar] [CrossRef] [PubMed] [Green Version]
- Aguilera, A.; Aroeira, L.G.S.; Ramírez-Huesca, M.; Lozano, M.-L.P.; Cirugeda, A.; Bajo, M.; Del Peso, G.; Valenzuela-Fernández, A.; Sánchez-Tomero, J.; Cabrera, M.L.; et al. Effects of Rapamycin on the Epithelial-to-mesenchymal Transition of Human Peritoneal Mesothelial Cells. Int. J. Artif. Organs 2005, 28, 164–169. [Google Scholar] [CrossRef]
- Valera, M.-S.; De Armas-Rillo, L.; Barroso-González, J.; Ziglio, S.; Batisse, J.; Dubois, N.; Marrero-Hernández, S.; Borel, S.; García-Expósito, L.; Biard-Piechaczyk, M.; et al. The HDAC6/APOBEC3G complex regulates HIV-1 infectiveness by inducing Vif autophagic degradation. Retrovirology 2015, 12, 1–26. [Google Scholar] [CrossRef] [PubMed] [Green Version]
- Rodríguez, R.C.; Hebmann, V.; Marfil, S.; Pernas, M.; Marrero-Hernández, S.; Cabrera, C.; Urrea, V.; Casado, C.; Olivares, I.; Márquez-Arce, D.; et al. HIV-1 envelope glycoproteins isolated from Viremic Non-Progressor individuals are fully functional and cytopathic. Sci. Rep. 2019, 9, 5544. [Google Scholar] [CrossRef] [PubMed] [Green Version]
- Cabrera-Rodríguez, R.; Pérez-Yanes, S.; Estévez-Herrera, J.; Márquez-Arce, D.; Cabrera, C.; Espert, L.; Blanco, J.; Valenzuela-Fernández, A. The Interplay of HIV and Autophagy in Early Infection. Front. Microbiol. 2021, 12, 661446. [Google Scholar] [CrossRef]
- Barrero-Villar, M.; Barroso-Gonzalez, J.; Cabrero, J.R.; Gordon-Alonso, M.; Álvarez-Losada, S.; Muñoz-Fernández, M.; Sánchez-Madrid, F.; Valenzuela-Fernández, A. PI4P5-Kinase Iα Is Required for Efficient HIV-1 Entry and Infection of T Cells. J. Immunol. 2008, 181, 6882–6888. [Google Scholar] [CrossRef] [Green Version]
- Casado, C.; Marrero-Hernández, S.; Márquez-Arce, D.; Pernas, M.; Marfil, S.; Borràs-Grañana, F.; Olivares, I.; Cabrera-Rodríguez, R.; Valera, M.-S.; de Armas-Rillo, L.; et al. Viral Characteristics Associated with the Clinical Nonprogressor Phenotype Are Inherited by Viruses from a Cluster of HIV-1 Elite Controllers. mBio 2018, 9, e02338-17. [Google Scholar] [CrossRef] [Green Version]
- Winton, M.J.; Igaz, L.M.; Wong, M.M.; Kwong, L.K.; Trojanowski, J.Q.; Lee, V.M.-Y. Disturbance of Nuclear and Cytoplasmic TAR DNA-binding Protein (TDP-43) Induces Disease-like Redistribution, Sequestration, and Aggregate Formation. J. Biol. Chem. 2008, 283, 13302–13309. [Google Scholar] [CrossRef] [Green Version]
- Wang, C.; Duan, Y.; Duan, G.; Wang, Q.; Zhang, K.; Deng, X.; Qian, B.; Gu, J.; Ma, Z.; Zhang, S.; et al. Stress Induces Dynamic, Cytotoxicity-Antagonizing TDP-43 Nuclear Bodies via Paraspeckle LncRNA NEAT1-Mediated Liquid-Liquid Phase Separation. Mol. Cell 2020, 79, 443–458. [Google Scholar] [CrossRef] [PubMed]
- Besnard-Guérin, C. Cytoplasmic localization of amyotrophic lateral sclerosis-related TDP-43 proteins modulates stress granule formation. Eur. J. Neurosci. 2020, 52, 3995–4008. [Google Scholar] [CrossRef] [PubMed]
- Portran, D.; Schaedel, L.; Xu, Z.; Théry, L.S.M.; Nachury, D.P.Z.X.M.V. Tubulin acetylation protects long-lived microtubules against mechanical ageing. Nat. Cell Biol. 2017, 19, 391–398. [Google Scholar] [CrossRef] [PubMed] [Green Version]
- Szyk, A.; Deaconescu, A.M.; Spector, J.; Goodman, B.; Valenstein, M.L.; Ziolkowska, N.E.; Kormendi, V.; Grigorieff, N.; Roll-Mecak, A. Molecular Basis for Age-Dependent Microtubule Acetylation by Tubulin Acetyltransferase. Cell 2014, 157, 1405–1415. [Google Scholar] [CrossRef] [Green Version]
- Eshun-Wilson, L.; Zhang, R.; Portran, D.; Nachury, M.V.; Toso, D.B.; Löhr, T.; Vendruscolo, M.; Bonomi, M.; Fraser, J.S.; Nogales, E. Effects of α-tubulin acetylation on microtubule structure and stability. Proc. Natl. Acad. Sci. USA 2019, 116, 10366–10371. [Google Scholar] [CrossRef] [PubMed] [Green Version]
- Howes, S.C.; Alushin, G.M.; Shida, T.; Nachury, M.V.; Nogales, E. Effects of tubulin acetylation and tubulin acetyltransferase binding on microtubule structure. Mol. Biol. Cell 2014, 25, 257–266. [Google Scholar] [CrossRef] [PubMed]
- Magiera, M.M.; Singh, P.; Gadadhar, S.; Janke, C. Tubulin Posttranslational Modifications and Emerging Links to Human Disease. Cell 2018, 173, 1323–1327. [Google Scholar] [CrossRef] [Green Version]
- Maruta, H.; Greer, K.; Rosenbaum, J.L. The acetylation of alpha-tubulin and its relationship to the assembly and disassembly of microtubules. J. Cell Biol. 1986, 103, 571–579. [Google Scholar] [CrossRef] [Green Version]
- Ledizet, M.; Piperno, G. Cytoplasmic microtubules containing acetylated alpha-tubulin in Chlamydomonas reinhardtii: Spatial arrangement and properties. J. Cell Biol. 1986, 103, 13–22. [Google Scholar] [CrossRef]
- Foster, A.D.; Flynn, L.L.; Cluning, C.; Cheng, F.; Davidson, J.M.; Lee, A.; Polain, N.; Mejzini, R.; Farrawell, N.; Yerbury, J.J.; et al. p62 overexpression induces TDP-43 cytoplasmic mislocalisation, aggregation and cleavage and neuronal death. Sci. Rep. 2021, 11, 11474. [Google Scholar] [CrossRef]
- Brady, O.A.; Meng, P.; Zheng, Y.; Mao, Y.; Hu, F. Regulation of TDP-43 aggregation by phosphorylation andp62/SQSTM. J. Neurochem. 2011, 116, 248–259. [Google Scholar] [CrossRef] [PubMed]
- Fazal, R.; Boeynaems, S.; Swijsen, A.; De Decker, M.; Fumagalli, L.; Moisse, M.; Vanneste, J.; Guo, W.; Boon, R.; Vercruysse, T.; et al. HDAC6 inhibition restores TDP-43 pathology and axonal transport defects in human motor neurons with TARDBP mutations. EMBO J. 2021, 40, e106177. [Google Scholar] [CrossRef]
- Hebron, M.L.; Lonskaya, I.; Sharpe, K.; Weerasinghe, P.; Algarzae, N.K.; Shekoyan, A.R.; Moussa, C.E.-H. Parkin Ubiquitinates Tar-DNA Binding Protein-43 (TDP-43) and Promotes Its Cytosolic Accumulation via Interaction with Histone Deacetylase 6 (HDAC6). J. Biol. Chem. 2013, 288, 4103–4115. [Google Scholar] [CrossRef] [Green Version]
- Yan, J.; Seibenhener, M.L.; Calderilla-Barbosa, L.; Diaz-Meco, M.-T.; Moscat, J.; Jiang, J.; Wooten, M.W.; Wooten, M.C. SQSTM1/p62 Interacts with HDAC6 and Regulates Deacetylase Activity. PLoS ONE 2013, 8, e76016. [Google Scholar] [CrossRef] [PubMed] [Green Version]
- Barrero-Villar, M.; Cabrero, J.R.; Gordón-Alonso, M.; Barroso-Gonzalez, J.; Álvarez-Losada, S.; Muñoz-Fernández, M.A.; Sánchez-Madrid, F.; Valenzuela-Fernández, A. Moesin is required for HIV-1-induced CD4-CXCR4 interaction, F-actin redistribution, membrane fusion and viral infection in lymphocytes. J. Cell Sci. 2009, 122, 103–113. [Google Scholar] [CrossRef] [PubMed] [Green Version]
- Pleskoff, O.; Tréboute, C.; Brelot, A.; Heveker, N.; Seman, M.; Alizon, M. Identification of a Chemokine Receptor Encoded by Human Cytomegalovirus as a Cofactor for HIV-1 Entry. Science 1997, 276, 1874–1878. [Google Scholar] [CrossRef]
- Schwartz, O.; Alizon, M.; Heard, J.-M.; Danos, O. Impairment of T Cell Receptor-Dependent Stimulation in CD4+ Lymphocytes after Contact with Membrane-Bound HIV-1 Envelope Glycoprotein. Virology 1994, 198, 360–365. [Google Scholar] [CrossRef] [PubMed]
- Pérez-Yanes, S.; Pernas, M.; Marfil, S.; Cabrera-Rodríguez, R.; Ortiz, R.; Urrea, V.; Rovirosa, C.; Estévez-Herrera, J.; Olivares, I.; Casado, C.; et al. The Characteristics of the HIV-1 Env Glycoprotein Are Linked With Viral Pathogenesis. Front. Microbiol. 2022, 13, 763039. [Google Scholar] [CrossRef]
- Rosas-Umbert, M.; Llano, A.; Bellido, R.; Olvera, A.; Ruiz-Riol, M.; Rocafort, M.; Fernández, M.A.; Cobarsi, P.; Crespo, M.; Dorrell, L.; et al. Mechanisms of Abrupt Loss of Virus Control in a Cohort of Previous HIV Controllers. J. Virol. 2019, 93, e01436-18. [Google Scholar] [CrossRef] [Green Version]
- Borrell, M.; Fernández, I.; Etcheverrry, F.; Ugarte, A.; Plana, M.; Leal, L.; García, F. High rates of long-term progression in HIV-1-positive elite controllers. J. Int. AIDS Soc. 2021, 24, e25675. [Google Scholar] [CrossRef]
- Marrero-Hernández, S.; Márquez-Arce, D.; Cabrera-Rodriguez, R.; Estévez-Herrera, J.; Pérez-Yanes, S.; Barroso-Gonzalez, J.; Madrid, R.; Machado, J.-D.; Blanco, J.; Valenzuela-Fernández, A. HIV-1 Nef Targets HDAC6 to Assure Viral Production and Virus Infection. Front. Microbiol. 2019, 10, 2437. [Google Scholar] [CrossRef] [PubMed]
- Valenzuela-Fernández, A.; Álvarez, S.; Gordon-Alonso, M.; Barrero, M.; Ursa, A.; Cabrero, J.R.; Fernández, G.; Naranjo-Suárez, S.; Yáñez-Mó, M.; Serrador, J.M.; et al. Histone Deacetylase 6 Regulates Human Immunodeficiency Virus Type 1 Infection. Mol. Biol. Cell 2005, 16, 5445–5454. [Google Scholar] [CrossRef] [PubMed] [Green Version]
- Blanco, J.; Barretinaa, J.; Ferri, K.F.; Jacototbc, E.; Gutiérreza, A.; Armand-Ugon, M.; Cabreraa, C.; Kroemerb, G.; Cloteta, B.; Esté, J.A. Cell-Surface-Expressed HIV-1 Envelope Induces the Death of CD4 T Cells during GP41-Mediated Hemifusion-like Events. Virology 2003, 305, 318–329. [Google Scholar] [CrossRef] [PubMed] [Green Version]
- Espert, L.; Varbanov, M.; Robert-Hebmann, V.; Sagnier, S.; Robbins, I.; Sanchez, F.; Lafont, V.; Biard-Piechaczyk, M. Differential Role of Autophagy in CD4 T Cells and Macrophages during X4 and R5 HIV-1 Infection. PLoS ONE 2009, 4, e5787. [Google Scholar] [CrossRef] [PubMed]
- Fung, G.; Shi, J.; Deng, H.; Hou, J.; Wang, C.; Hong, A.; Zhang, J.; Jia, W.; Luo, H. Cytoplasmic translocation, aggregation, and cleavage of TDP-43 by enteroviral proteases modulate viral pathogenesis. Cell Death Differ. 2015, 22, 2087–2097. [Google Scholar] [CrossRef] [Green Version]
- Manghera, M.; Ferguson-Parry, J.; Lin, R.; Douville, R.N. NF-κB and IRF1 Induce Endogenous Retrovirus K Expression via Interferon-Stimulated Response Elements in Its 5′ Long Terminal Repeat. J. Virol. 2016, 90, 9338–9349. [Google Scholar] [CrossRef] [Green Version]
- Douville, R.; Liu, J.; Rothstein, J.; Nath, A. Identification of active loci of a human endogenous retrovirus in neurons of patients with amyotrophic lateral sclerosis. Ann. Neurol. 2011, 69, 141–151. [Google Scholar] [CrossRef]
- Li, W.; Lee, M.-H.; Henderson, L.; Tyagi, R.; Bachani, M.; Steiner, J.; Campanac, E.; Hoffman, D.A.; von Geldern, G.; Johnson, K.; et al. Human endogenous retrovirus-K contributes to motor neuron disease. Sci. Transl. Med. 2015, 7, 307ra153. [Google Scholar] [CrossRef]
- Janssens, J.; Van Broeckhoven, C. Pathological mechanisms underlying TDP-43 driven neurodegeneration in FTLD-ALS spectrum disorders. Hum. Mol. Genet. 2013, 22, R77–R87. [Google Scholar] [CrossRef] [Green Version]
- Bhat, R.K.; Rudnick, W.; Antony, J.M.; Maingat, F.; Ellestad, K.K.; Wheatley, B.M.; Tönjes, R.R.; Power, C. Human Endogenous Retrovirus-K(II) Envelope Induction Protects Neurons during HIV/AIDS. PLoS ONE 2014, 9, e97984. [Google Scholar] [CrossRef] [Green Version]
- Douville, R.N.; Nath, A. Human Endogenous Retrovirus-K and TDP-43 Expression Bridges ALS and HIV Neuropathology. Front. Microbiol. 2017, 8, 1986. [Google Scholar] [CrossRef] [PubMed]
- Wenzel, E.D.; Speidell, A.; Flowers, S.A.; Wu, C.; Avdoshina, V.; Mocchetti, I. Histone deacetylase 6 inhibition rescues axonal transport impairments and prevents the neurotoxicity of HIV-1 envelope protein gp120. Cell Death Dis. 2019, 10, 674. [Google Scholar] [CrossRef] [PubMed] [Green Version]
- Valenzuela-Fernández, A.; Cabrero, J.R.; Serrador, J.M.; Sánchez-Madrid, F. HDAC6: A key regulator of cytoskeleton, cell migration and cell–cell interactions. Trends Cell Biol. 2008, 18, 291–297. [Google Scholar] [CrossRef]
- Trkola, A.; Matthews, J.; Gordon, C.; Ketas, T.; Moore, J.P. A Cell Line-Based Neutralization Assay for Primary Human Immunodeficiency Virus Type 1 Isolates That Use either the CCR5 or the CXCR4 Coreceptor. J. Virol. 1999, 73, 8966–8974. [Google Scholar] [CrossRef] [Green Version]
- Barroso-González, J.; García-Expósito, L.; Puigdomènech, I.; De Armas-Rillo, L.; Machado, J.-D.; Blanco, J.; Valenzuela-Fernández, A. Viral infection: Moving through complex and dynamic cell-membrane structures. Commun. Integr. Biol. 2011, 4, 398–408. [Google Scholar] [CrossRef]
- García-Expósito, L.; Ziglio, S.; Barroso-González, J.; de Armas-Rillo, L.; Valera, M.-S.; Zipeto, D.; Machado, J.-D.; Valenzuela-Fernández, A. Gelsolin activity controls efficient early HIV-1 infection. Retrovirology 2013, 10, 39. [Google Scholar] [CrossRef] [PubMed] [Green Version]
- Callebaut, C.; Jacotot, E.; Krust, B.; Guichard, G.; Blanco, J.; Valenzuela, A.; Svab, J.; Muller, S.; Briand, J.-P.; Hovanessian, A.G. Pseudopeptide TASP Inhibitors of HIV Entry Bind Specifically to a 95-kDa Cell Surface Protein. J. Biol. Chem. 1997, 272, 7159–7166. [Google Scholar] [CrossRef] [PubMed] [Green Version]
- Patro, R.; Duggal, G.; Love, M.I.; Irizarry, R.A.; Kingsford, C. Salmon provides fast and bias-aware quantification of transcript expression. Nat. Methods 2017, 14, 417–419. [Google Scholar] [CrossRef] [Green Version]
- Dobin, A.; Davis, C.A.; Schlesinger, F.; Drenkow, J.; Zaleski, C.; Jha, S.; Batut, P.; Chaisson, M.; Gingeras, T.R. STAR: Ultrafast universal RNA-seq aligner. Bioinformatics 2013, 29, 15–21. [Google Scholar] [CrossRef]
- Okonechnikov, K.; Conesa, A.; García-Alcalde, F. Qualimap 2: Advanced multi-sample quality control for high-throughput sequencing data. Bioinformatics 2016, 32, 292–294. [Google Scholar] [CrossRef]
- Ewels, P.; Magnusson, M.; Lundin, S.; Käller, M. MultiQC: Summarize analysis results for multiple tools and samples in a single report. Bioinformatics 2016, 32, 3047–3048. [Google Scholar] [CrossRef] [PubMed] [Green Version]
- Love, M.I.; Huber, W.; Anders, S. Moderated estimation of fold change and dispersion for RNA-seq data with DESeq. Genome Biol. 2014, 15, 550. [Google Scholar] [CrossRef] [PubMed] [Green Version]


Publisher’s Note: MDPI stays neutral with regard to jurisdictional claims in published maps and institutional affiliations. |
© 2022 by the authors. Licensee MDPI, Basel, Switzerland. This article is an open access article distributed under the terms and conditions of the Creative Commons Attribution (CC BY) license (https://creativecommons.org/licenses/by/4.0/).
Share and Cite
Cabrera-Rodríguez, R.; Pérez-Yanes, S.; Montelongo, R.; Lorenzo-Salazar, J.M.; Estévez-Herrera, J.; García-Luis, J.; Íñigo-Campos, A.; Rubio-Rodríguez, L.A.; Muñoz-Barrera, A.; Trujillo-González, R.; et al. Transactive Response DNA-Binding Protein (TARDBP/TDP-43) Regulates Cell Permissivity to HIV-1 Infection by Acting on HDAC6. Int. J. Mol. Sci. 2022, 23, 6180. https://0-doi-org.brum.beds.ac.uk/10.3390/ijms23116180
Cabrera-Rodríguez R, Pérez-Yanes S, Montelongo R, Lorenzo-Salazar JM, Estévez-Herrera J, García-Luis J, Íñigo-Campos A, Rubio-Rodríguez LA, Muñoz-Barrera A, Trujillo-González R, et al. Transactive Response DNA-Binding Protein (TARDBP/TDP-43) Regulates Cell Permissivity to HIV-1 Infection by Acting on HDAC6. International Journal of Molecular Sciences. 2022; 23(11):6180. https://0-doi-org.brum.beds.ac.uk/10.3390/ijms23116180
Chicago/Turabian StyleCabrera-Rodríguez, Romina, Silvia Pérez-Yanes, Rafaela Montelongo, José M. Lorenzo-Salazar, Judith Estévez-Herrera, Jonay García-Luis, Antonio Íñigo-Campos, Luis A. Rubio-Rodríguez, Adrián Muñoz-Barrera, Rodrigo Trujillo-González, and et al. 2022. "Transactive Response DNA-Binding Protein (TARDBP/TDP-43) Regulates Cell Permissivity to HIV-1 Infection by Acting on HDAC6" International Journal of Molecular Sciences 23, no. 11: 6180. https://0-doi-org.brum.beds.ac.uk/10.3390/ijms23116180