
Inhibition of Class I Histone Deacetylase Activity Blocks the Induction of TNFAIP3 Both Directly and Indirectly via the Suppression of Endogenous TNF-α

 , , , , and
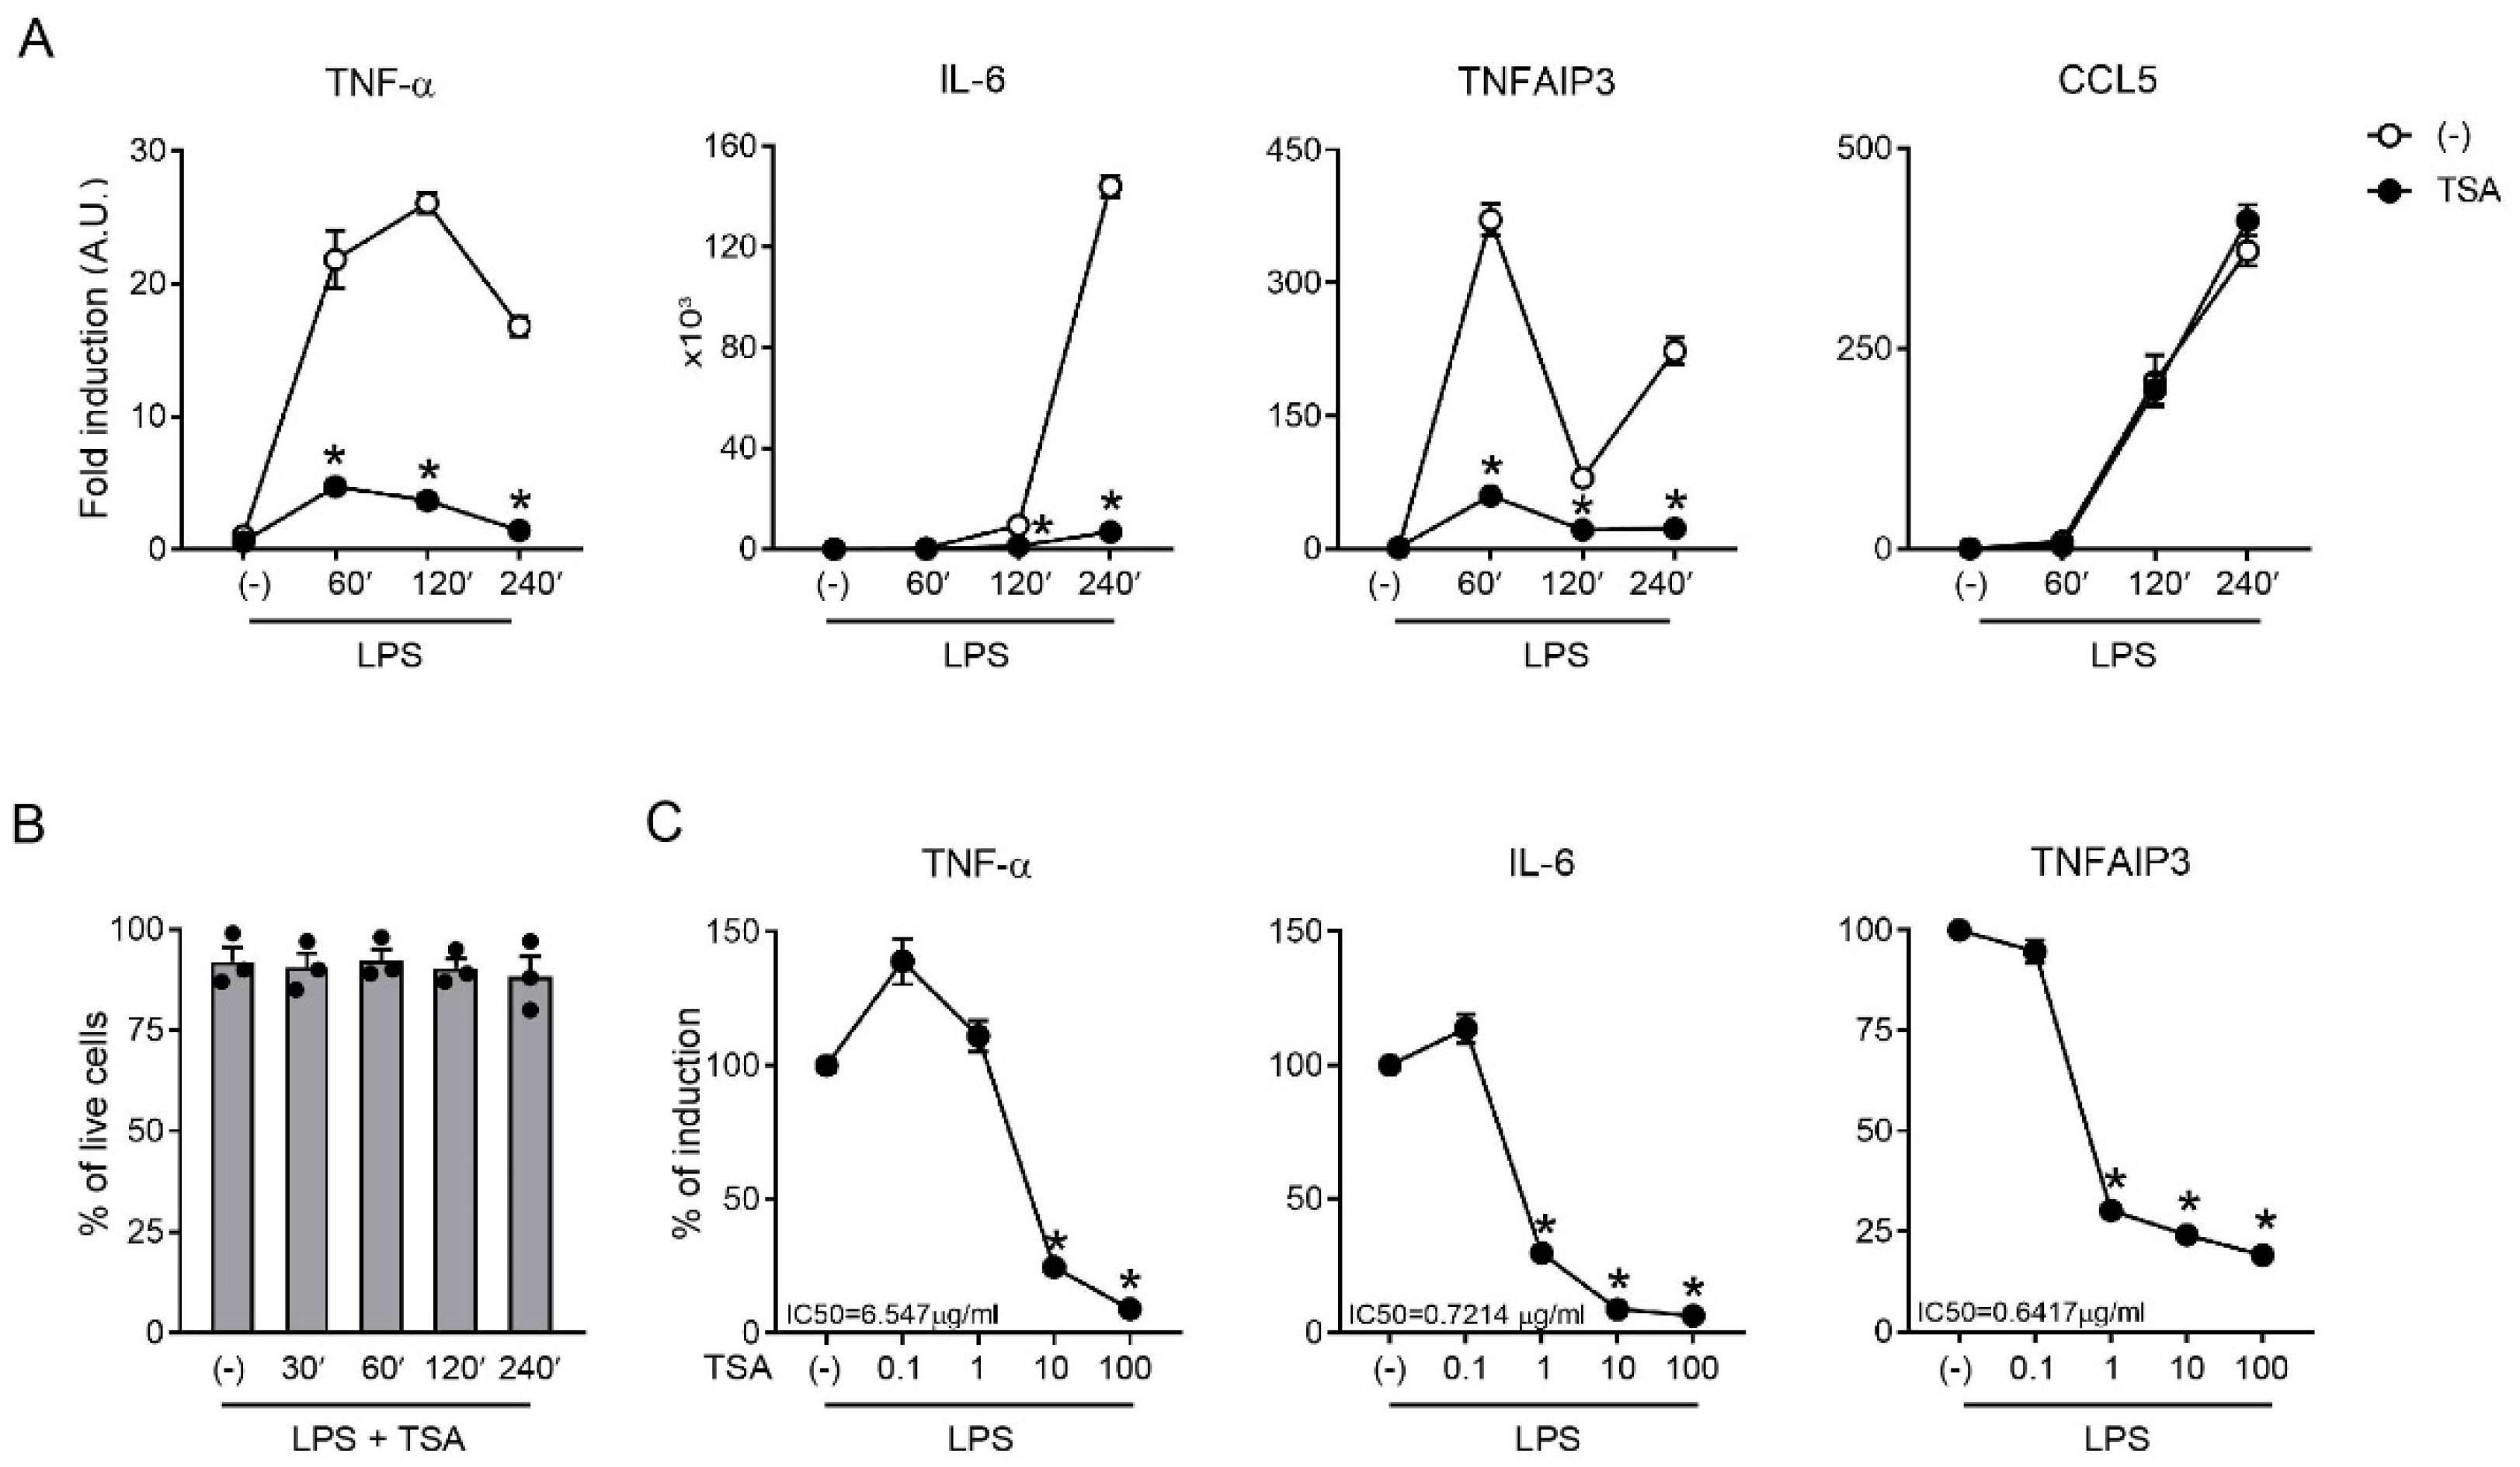
Abstract
:1. Introduction
2. Results
2.1. TSA Inhibited the Inflammatory Upregulation of the TNF-α/TNFAIP3 Axis
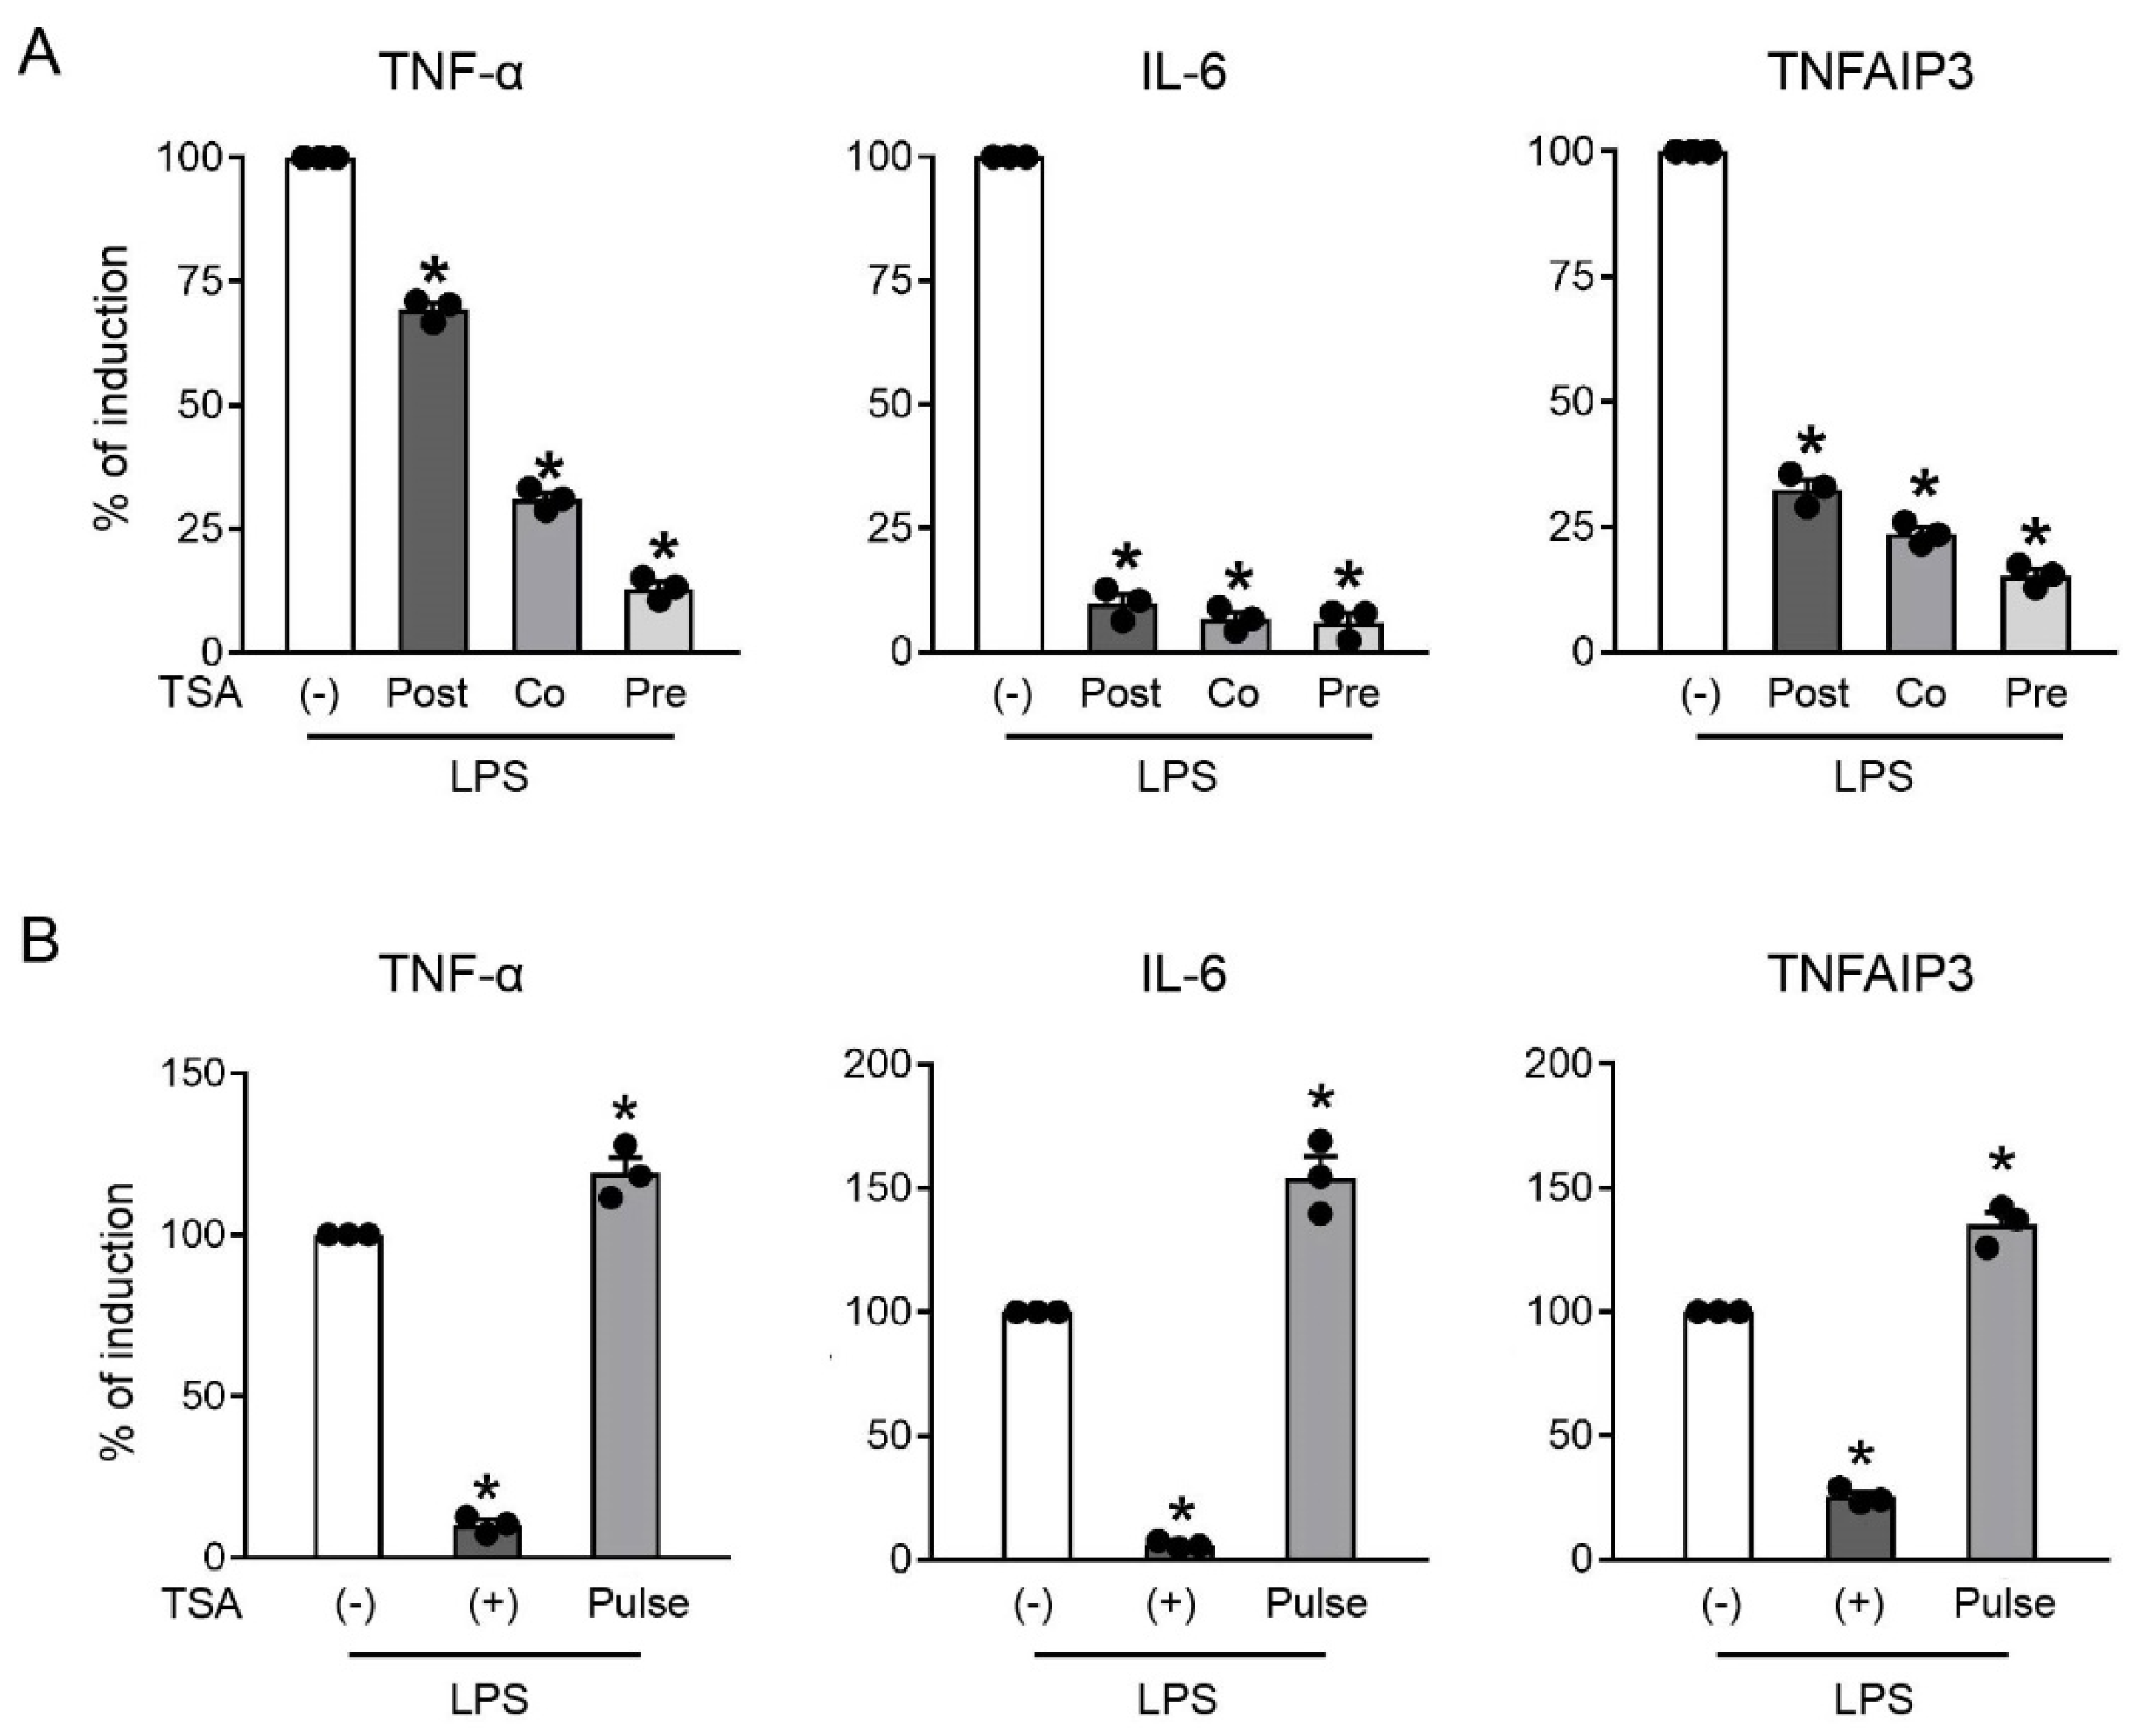
2.2. Downregulation of TNF-α and TNFAIP3 by TSA Was Rapid and Transient
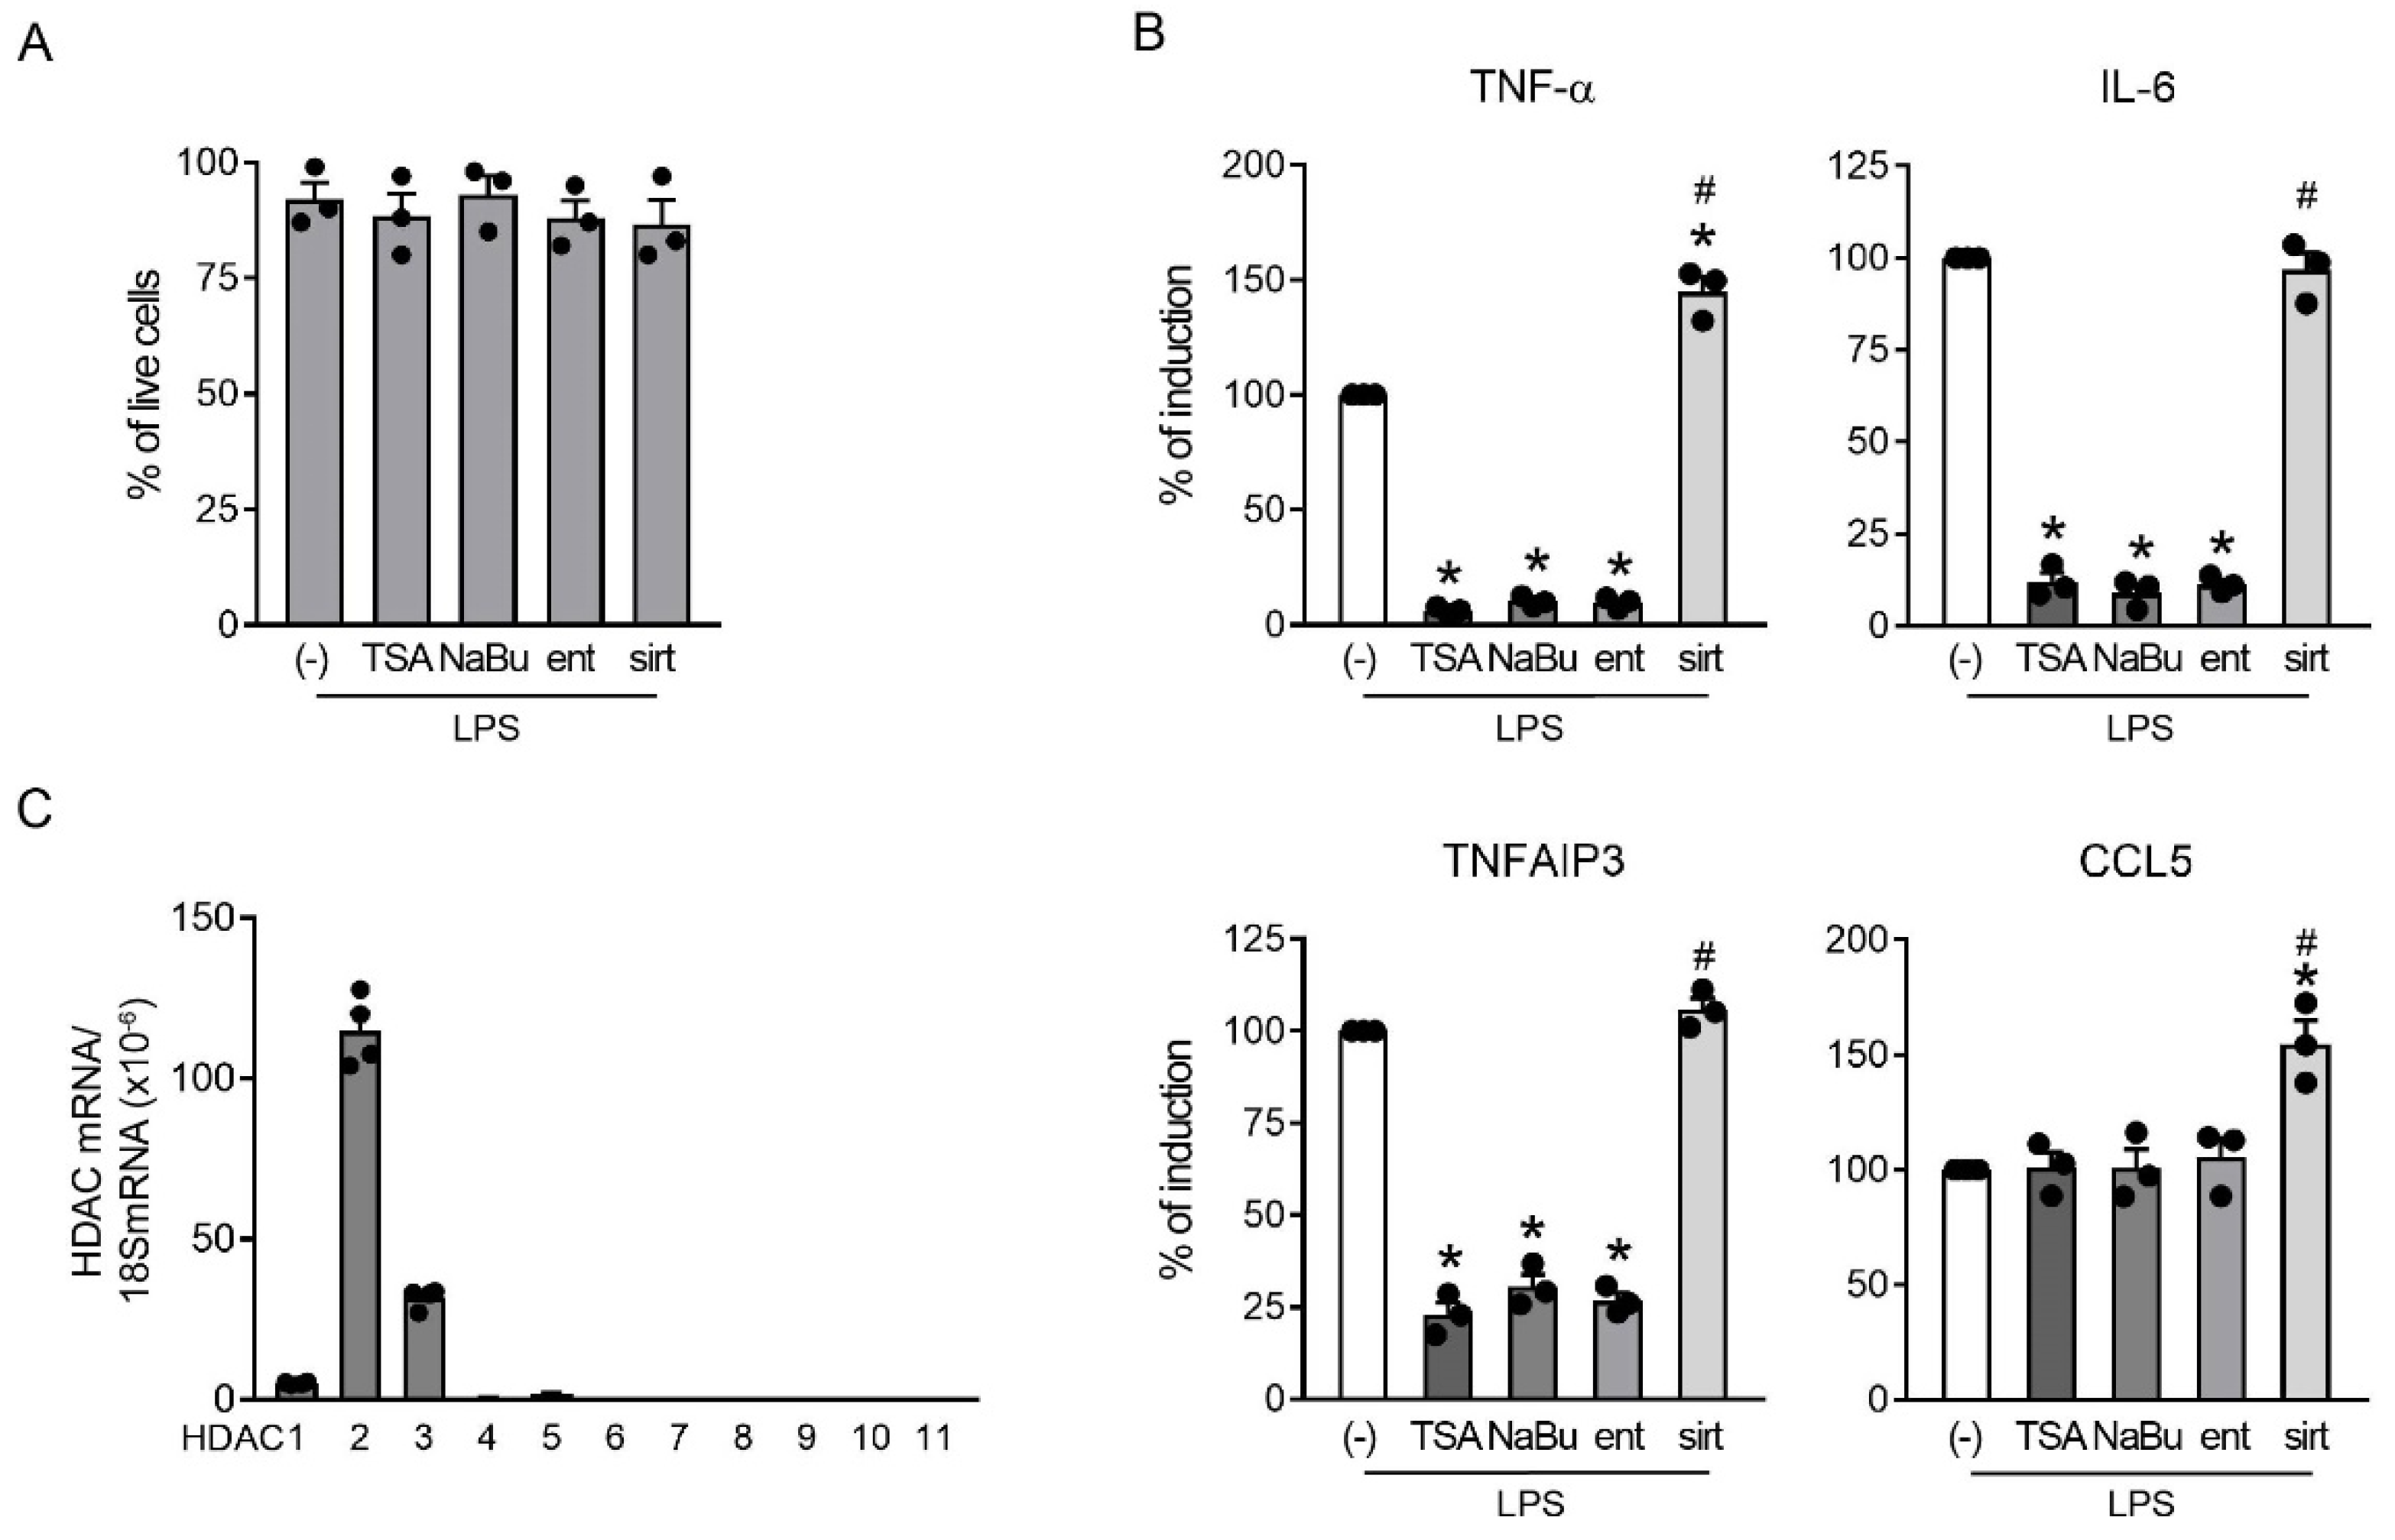
2.3. Class I HDAC Enzymatic Activity Was Required for the Production of Both TNF-α and TNFAIP3
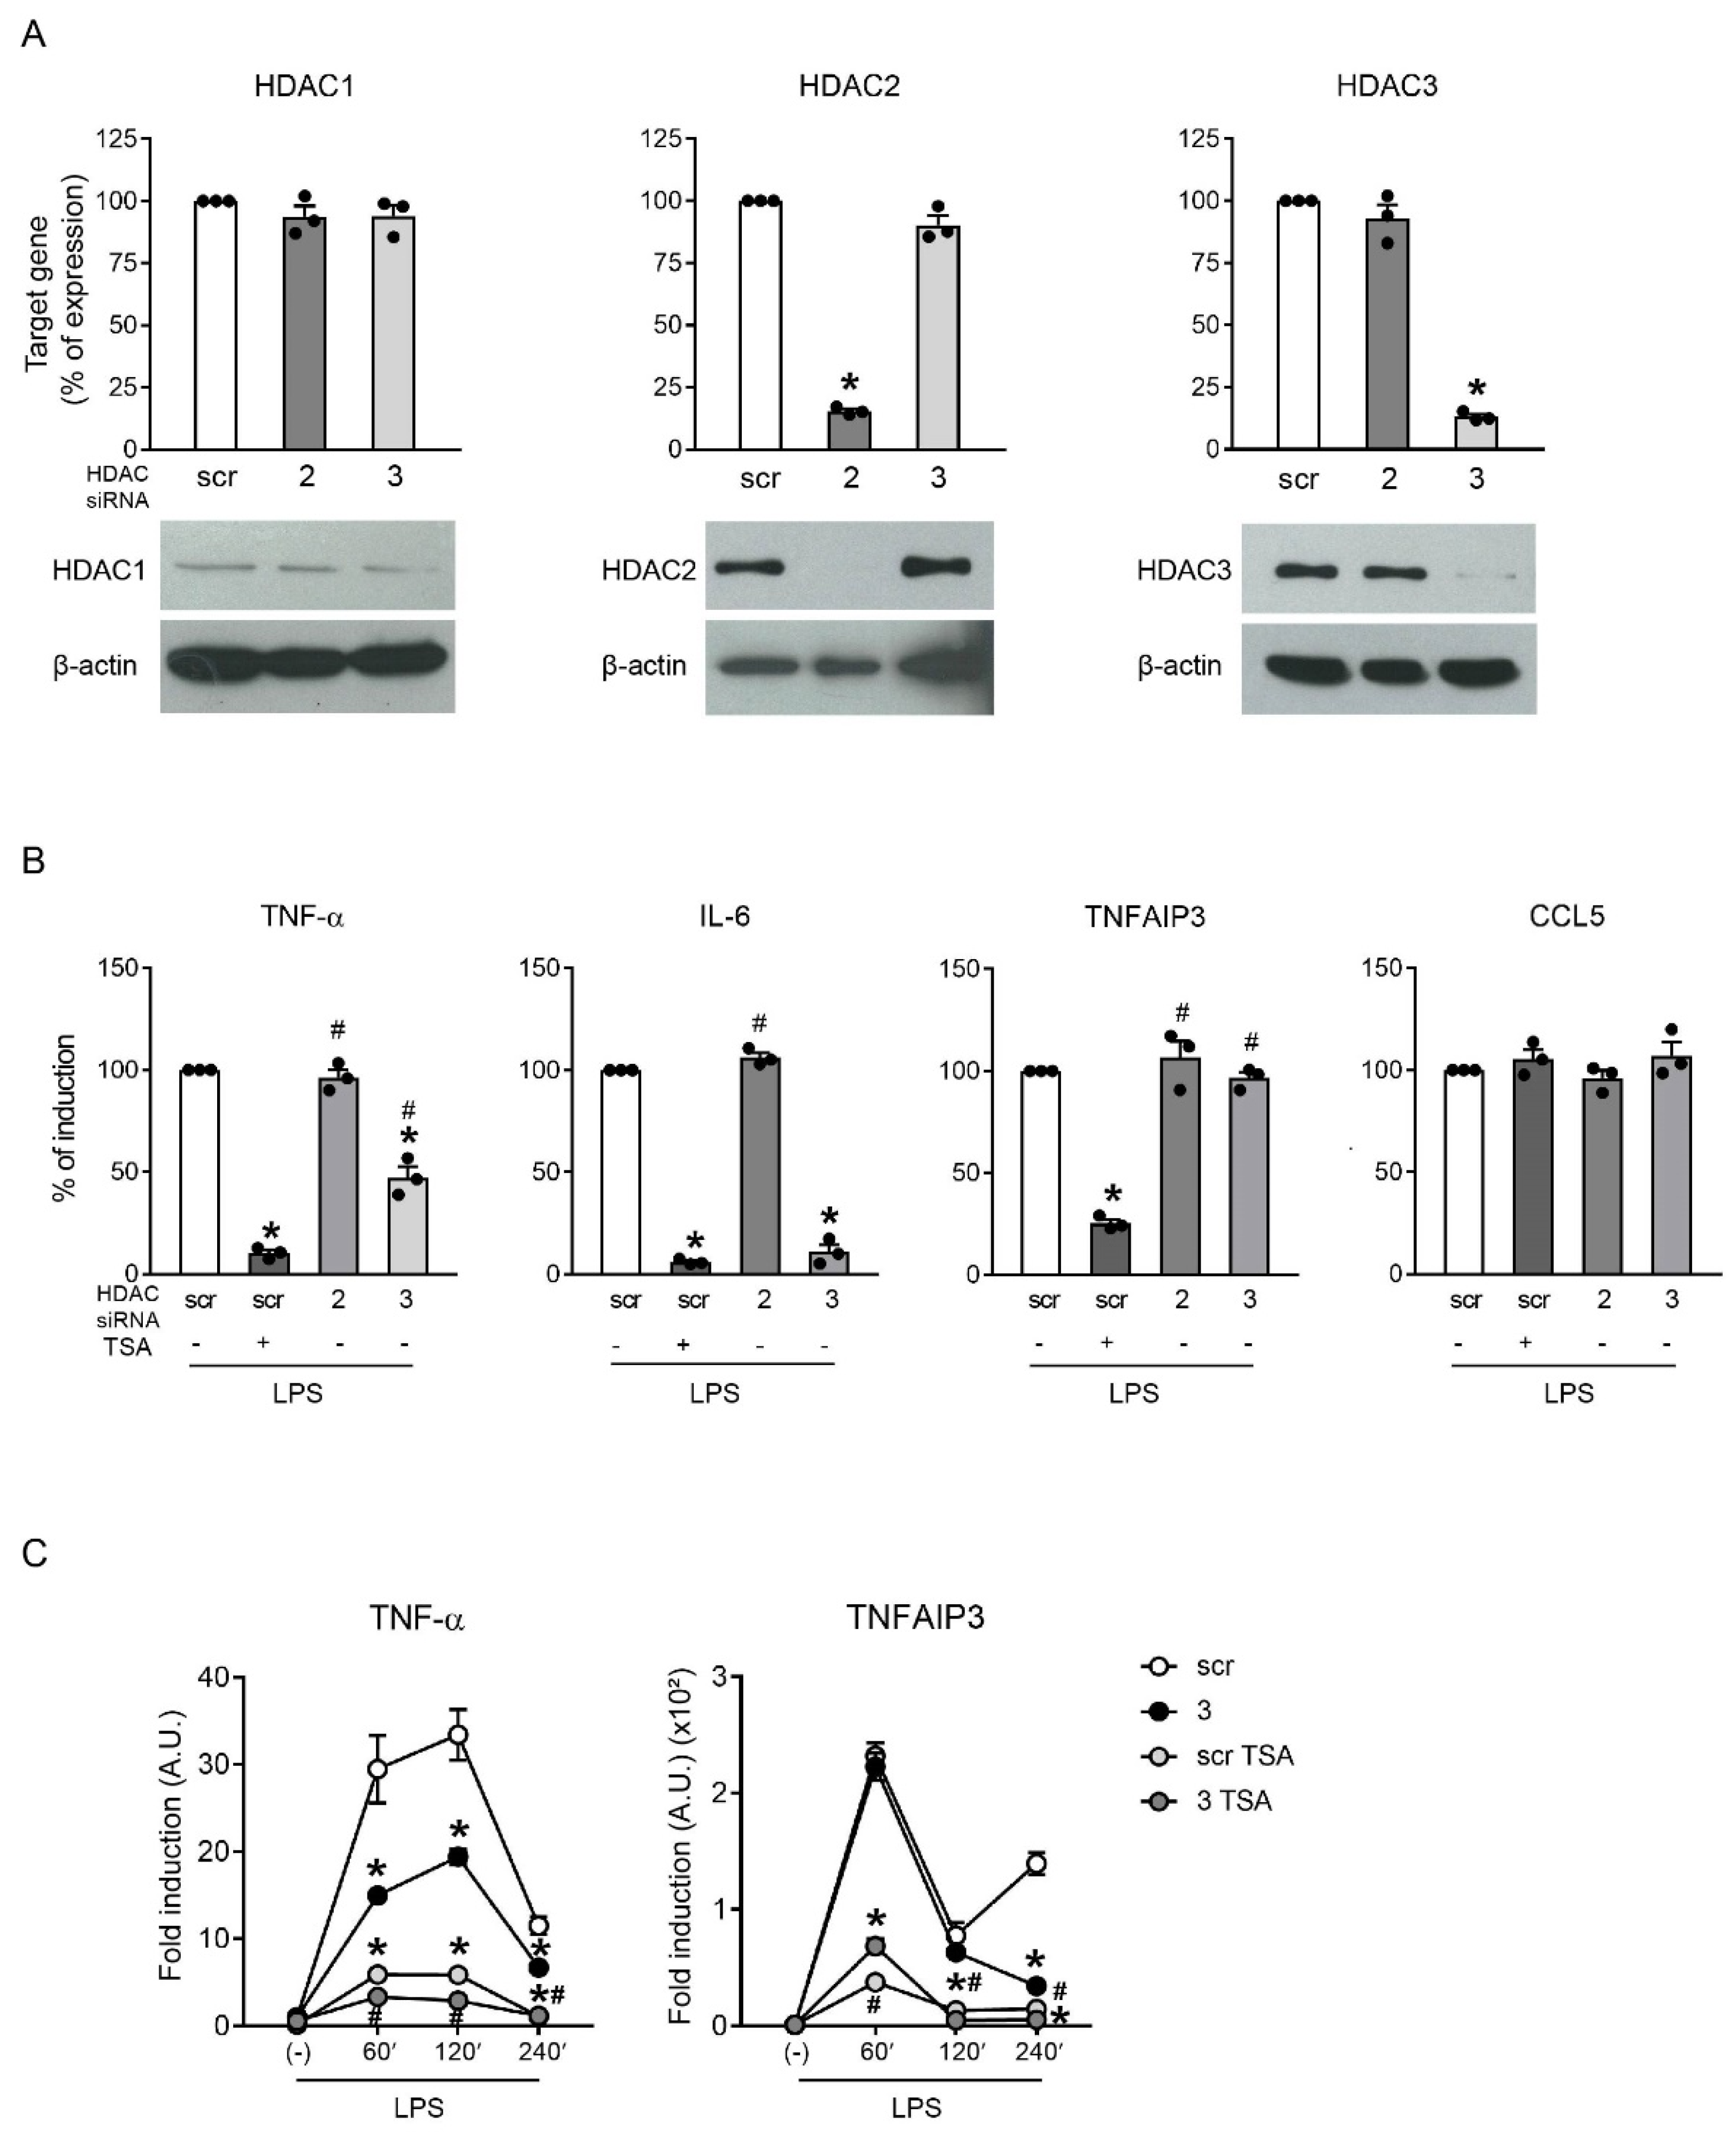
2.4. HDAC3 Knockdown Partially Recapitulated Inhibition by TSA
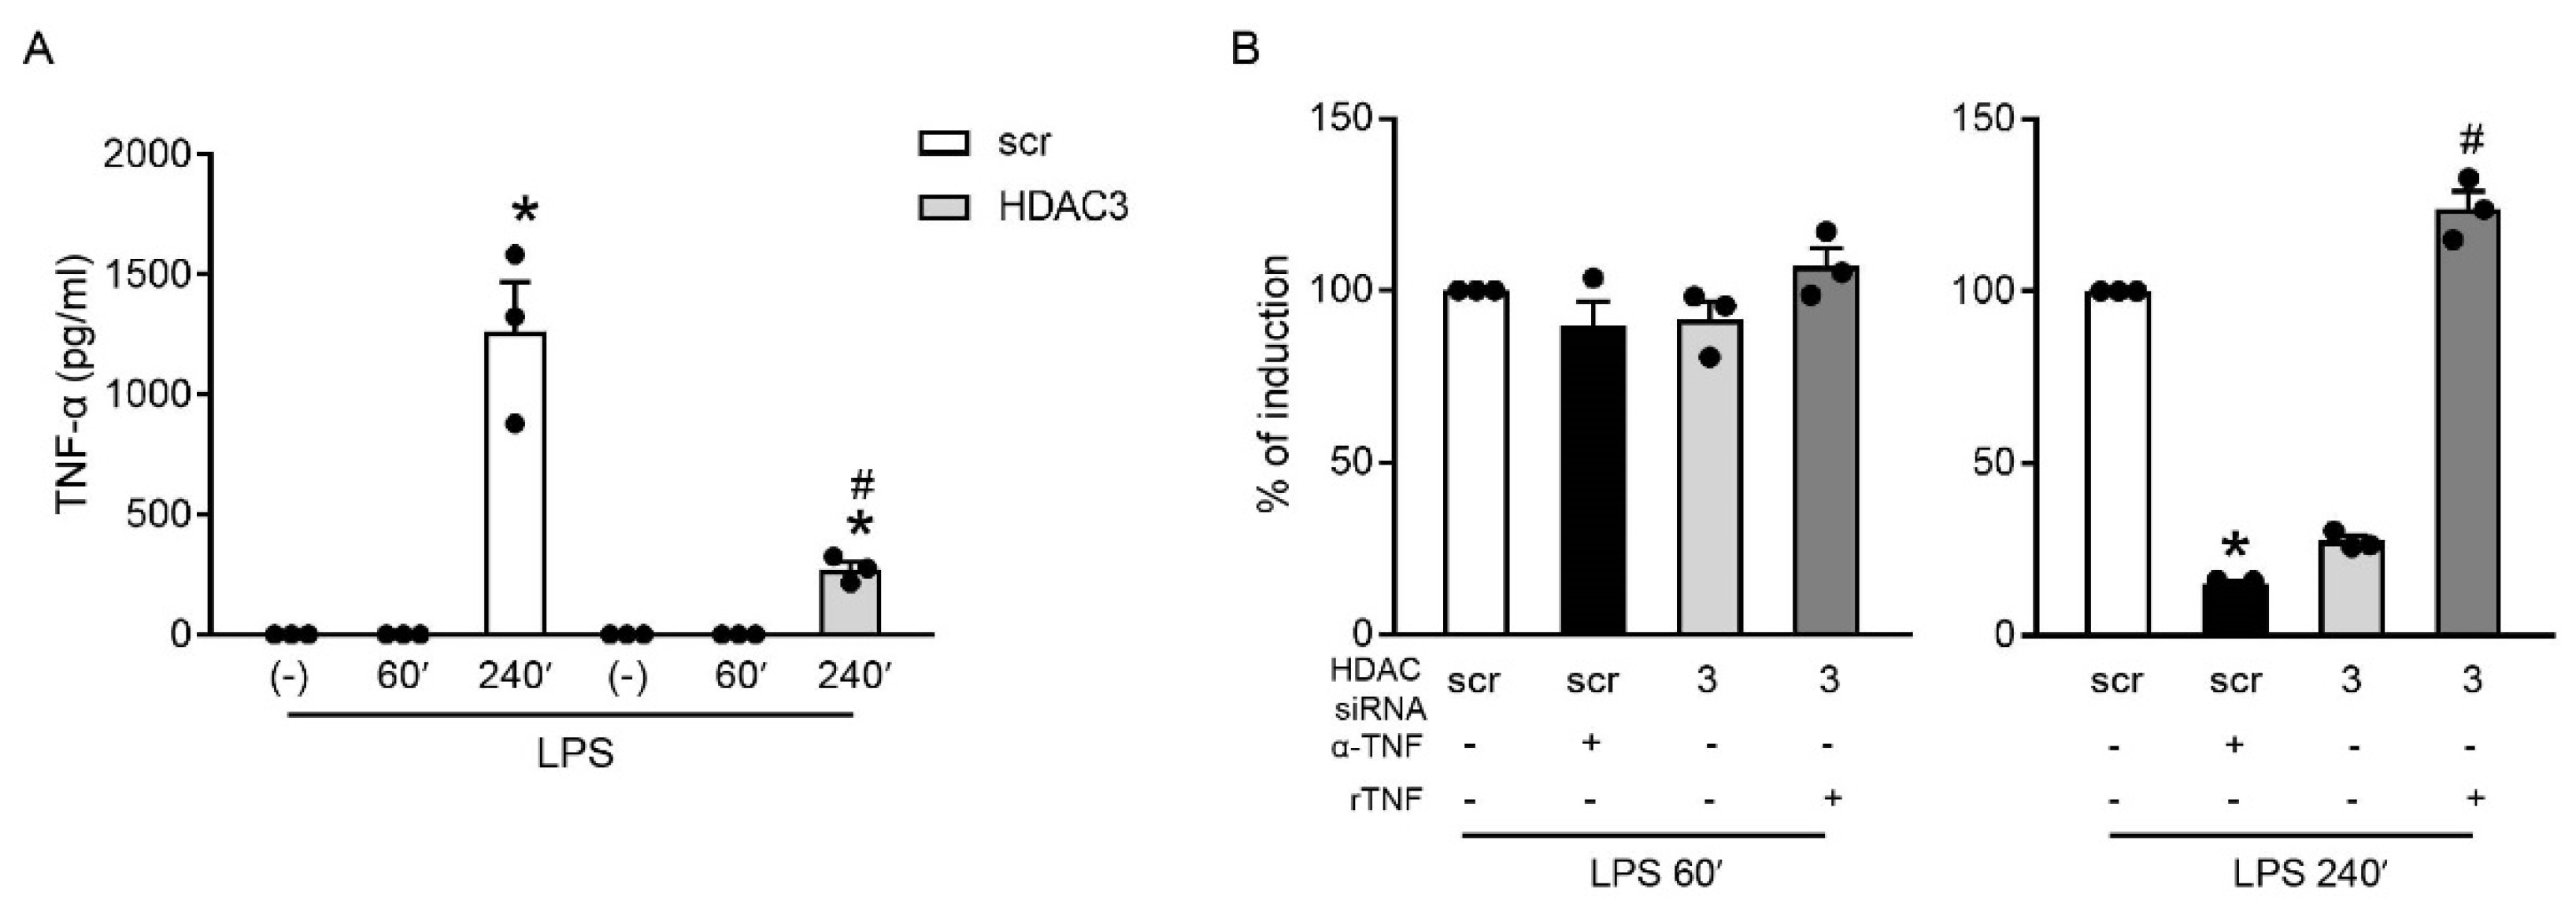
2.5. HDAC3 Indirectly Regulated the Expression of TNFAIP3 by Inducing TNF-α
3. Discussion
4. Materials and Methods
4.1. Cell Lines and Reagents
4.2. mRNA Expression Analysis
4.3. siRNA Transfection
4.4. Protein Detection
4.5. Statistics
Supplementary Materials
Author Contributions
Funding
Institutional Review Board Statement
Informed Consent Statement
Data Availability Statement
Conflicts of Interest
References
- Kouzarides, T. Chromatin modifications and their function. Cell 2007, 128, 693–705. [Google Scholar] [CrossRef] [PubMed]
- Dekker, F.J.; van den Bosch, T.; Martin, N.I. Small molecule inhibitors of histone acetyltransferases and deacetylases are potential drugs for inflammatory diseases. Drug Discov. Today 2014, 19, 654–660. [Google Scholar] [CrossRef] [PubMed]
- Strahl, B.D.; Allis, C.D. The language of covalent histone modifications. Nature 2000, 403, 41–45. [Google Scholar] [CrossRef]
- Yang, X.-J.; Seto, E. The Rpd3/Hda1 family of lysine deacetylases: From bacteria and yeast to mice and men. Nat. Rev. Mol. Cell Biol. 2008, 9, 206–218. [Google Scholar] [CrossRef] [PubMed]
- Parra, M.; Verdin, E. Regulatory signal transduction pathways for class IIa histone deacetylases. Curr. Opin. Pharmacol. 2010, 10, 454–460. [Google Scholar] [CrossRef]
- Gao, L.; Cueto, M.A.; Asselbergs, F.; Atadja, P. Cloning and functional characterization of HDAC11, a novel member of the human histone deacetylase family. J. Biol. Chem. 2002, 277, 25748–25755. [Google Scholar] [CrossRef]
- Dali-Youcef, N.; Lagouge, M.; Froelich, S.; Koehl, C.; Schoonjans, K.; Auwerx, J. Sirtuins: The “magnificent seven”, function, metabolism and longevity. Ann. Med. 2007, 39, 335–345. [Google Scholar] [CrossRef]
- Kim, H.-J.; Bae, S.-C. Histone deacetylase inhibitors: Molecular mechanisms of action and clinical trials as anti-cancer drugs. Am. J. Transl. Res. 2011, 3, 166–179. [Google Scholar]
- Dallavalle, S.; Pisano, C.; Zunino, F. Development and therapeutic impact of HDAC6-selective inhibitors. Biochem. Pharmacol. 2012, 84, 756–765. [Google Scholar] [CrossRef]
- Pan, H.; Cao, J.; Xu, W. Selective histone deacetylase inhibitors. Anticancer. Agents Med. Chem. 2012, 12, 247–270. [Google Scholar] [CrossRef]
- Kim, M.S.; Kwon, H.J.; Lee, Y.M.; Baek, J.H.; Jang, J.E.; Lee, S.W.; Moon, E.J.; Kim, H.S.; Lee, S.K.; Chung, H.Y.; et al. Histone deacetylases induce angiogenesis by negative regulation of tumor suppressor genes. Nat. Med. 2001, 7, 437–443. [Google Scholar] [CrossRef] [PubMed]
- Nair, A.R.; Boersma, L.J.; Schiltz, L.; Chaudhry, M.A.; Muschel, R.J.; Chaudry, A. Paradoxical effects of trichostatin A: Inhibition of NF-Y-associated histone acetyltransferase activity, phosphorylation of hGCN5 and downregulation of cyclin A and B1 mRNA. Cancer Lett. 2001, 166, 55–64. [Google Scholar] [CrossRef]
- Tong, X.; Yin, L.; Giardina, C. Butyrate suppresses Cox-2 activation in colon cancer cells through HDAC inhibition. Biochem. Biophys. Res. Commun. 2004, 317, 463–471. [Google Scholar] [CrossRef] [PubMed]
- Glozak, M.A.; Sengupta, N.; Zhang, X.; Seto, E. Acetylation and deacetylation of non-histone proteins. Gene 2005, 363, 15–23. [Google Scholar] [CrossRef]
- Choudhary, C.; Kumar, C.; Gnad, F.; Nielsen, M.L.; Rehman, M.; Walther, T.C.; Olsen, J.V.; Mann, M. Lysine acetylation targets protein complexes and co-regulates major cellular functions. Science 2009, 325, 834–840. [Google Scholar] [CrossRef]
- Leoni, F.; Zaliani, A.; Bertolini, G.; Porro, G.; Pagani, P.; Pozzi, P.; Donà, G.; Fossati, G.; Sozzani, S.; Azam, T.; et al. The antitumor histone deacetylase inhibitor suberoylanilide hydroxamic acid exhibits antiinflammatory properties via suppression of cytokines. Proc. Natl. Acad. Sci. USA 2002, 99, 2995–3000. [Google Scholar] [CrossRef]
- Roger, T.; Lugrin, J.; Le Roy, D.; Goy, G.; Mombelli, M.; Koessler, T.; Ding, X.C.; Chanson, A.-L.; Reymond, M.K.; Miconnet, I.; et al. Histone deacetylase inhibitors impair innate immune responses to Toll-like receptor agonists and to infection. Blood 2011, 117, 1205–1217. [Google Scholar] [CrossRef]
- Han, S.-B.; Lee, J.K. Anti-inflammatory effect of Trichostatin-A on murine bone marrow-derived macrophages. Arch. Pharm. Res. 2009, 32, 613–624. [Google Scholar] [CrossRef]
- Nasu, Y.; Nishida, K.; Miyazawa, S.; Komiyama, T.; Kadota, Y.; Abe, N.; Yoshida, A.; Hirohata, S.; Ohtsuka, A.; Ozaki, T. Trichostatin A, a histone deacetylase inhibitor, suppresses synovial inflammation and subsequent cartilage destruction in a collagen antibody-induced arthritis mouse model. Osteoarthr. Cartil. 2008, 16, 723–732. [Google Scholar] [CrossRef]
- Bosisio, D.; Vulcano, M.; Del Prete, A.; Sironi, M.; Salvi, V.; Salogni, L.; Riboldi, E.; Leoni, F.; Dinarello, C.A.; Girolomoni, G.; et al. Blocking TH17-polarizing cytokines by histone deacetylase inhibitors in vitro and in vivo. J. Leukoc. Biol. 2008, 84, 1540–1548. [Google Scholar] [CrossRef]
- Salvi, V.; Bosisio, D.; Mitola, S.; Andreoli, L.; Tincani, A.; Sozzani, S. Trichostatin A blocks type I interferon production by activated plasmacytoid dendritic cells. Immunobiology 2010, 215, 756–761. [Google Scholar] [CrossRef] [PubMed]
- Fischer, A. Targeting histone-modifications in Alzheimer’s disease. What is the evidence that this is a promising therapeutic avenue? Neuropharmacology 2014, 80, 95–102. [Google Scholar] [CrossRef] [PubMed]
- Grabiec, A.M.; Tak, P.P.; Reedquist, K.A. Function of histone deacetylase inhibitors in inflammation. Crit. Rev. Immunol. 2011, 31, 233–263. [Google Scholar] [CrossRef] [PubMed]
- Halili, M.A.; Andrews, M.R.; Sweet, M.J.; Fairlie, D.P. Histone deacetylase inhibitors in inflammatory disease. Curr. Top. Med. Chem. 2009, 9, 309–319. [Google Scholar] [CrossRef] [PubMed]
- Shakespear, M.R.; Halili, M.A.; Irvine, K.M.; Fairlie, D.P.; Sweet, M.J. Histone deacetylases as regulators of inflammation and immunity. Trends Immunol. 2011, 32, 335–343. [Google Scholar] [CrossRef]
- Weiss, U.; Möller, M.; Husseini, S.A.; Manderscheid, C.; Häusler, J.; Geisslinger, G.; Niederberger, E. Inhibition of HDAC Enzymes Contributes to Differential Expression of Pro-Inflammatory Proteins in the TLR-4 Signaling Cascade. Int. J. Mol. Sci. 2020, 21, 8943. [Google Scholar] [CrossRef] [PubMed]
- Halili, M.A.; Andrews, M.R.; Labzin, L.I.; Schroder, K.; Matthias, G.; Cao, C.; Lovelace, E.; Reid, R.C.; Le, G.T.; Hume, D.A.; et al. Differential effects of selective HDAC inhibitors on macrophage inflammatory responses to the Toll-like receptor 4 agonist LPS. J. Leukoc. Biol. 2010, 87, 1103–1114. [Google Scholar] [CrossRef]
- Chavey, C.; Mühlbauer, M.; Bossard, C.; Freund, A.; Durand, S.; Jorgensen, C.; Jobin, C.; Lazennec, G. Interleukin-8 expression is regulated by histone deacetylases through the nuclear factor-kappaB pathway in breast cancer. Mol. Pharmacol. 2008, 74, 1359–1366. [Google Scholar] [CrossRef]
- Gatla, H.R.; Zou, Y.; Uddin, M.M.; Vancurova, I. Epigenetic regulation of interleukin-8 expression by class I HDAC and CBP in ovarian cancer cells. Oncotarget 2017, 8, 70798–70810. [Google Scholar] [CrossRef]
- Huang, B.; Yang, X.-D.; Lamb, A.; Chen, L.-F. Posttranslational modifications of NF-kappaB: Another layer of regulation for NF-kappaB signaling pathway. Cell. Signal. 2010, 22, 1282–1290. [Google Scholar] [CrossRef]
- Lf, C.; Fischle, W.; Verdin, E.; Greene, W.C. Duration of nuclear NF-kappaB action regulated by reversible acetylation. Science 2001, 293, 1653–1657. [Google Scholar] [CrossRef] [Green Version]
- Ziesché, E.; Kettner-Buhrow, D.; Weber, A.; Wittwer, T.; Jurida, L.; Soelch, J.; Müller, H.; Newel, D.; Kronich, P.; Schneider, H.; et al. The coactivator role of histone deacetylase 3 in IL-1-signaling involves deacetylation of p65 NF-κB. Nucleic Acids Res. 2013, 41, 90–109. [Google Scholar] [CrossRef] [PubMed]
- Chen, X.; Barozzi, I.; Termanini, A.; Prosperini, E.; Recchiuti, A.; Dalli, J.; Mietton, F.; Matteoli, G.; Hiebert, S.; Natoli, G. Requirement for the histone deacetylase Hdac3 for the inflammatory gene expression program in macrophages. Proc. Natl. Acad. Sci. USA 2012, 109, E2865–E2874. [Google Scholar] [CrossRef] [PubMed]
- Leus, N.G.; Zwinderman, M.R.; Dekker, F.J. Histone deacetylase 3 (HDAC 3) as emerging drug target in NF-κB-mediated inflammation. Curr. Opin. Chem. Biol. 2016, 33, 160–168. [Google Scholar] [CrossRef]
- Ashburner, B.P.; Westerheide, S.D.; Baldwin, A.S. The p65 (RelA) subunit of NF-kappaB interacts with the histone deacetylase (HDAC) corepressors HDAC1 and HDAC2 to negatively regulate gene expression. Mol. Cell. Biol. 2001, 21, 7065–7077. [Google Scholar] [CrossRef] [PubMed]
- Wieczorek, M.; Ginter, T.; Brand, P.; Heinzel, T.; Krämer, O.H. Acetylation modulates the STAT signaling code. Cytokine Growth Factor Rev. 2012, 23, 293–305. [Google Scholar] [CrossRef] [PubMed]
- Kosan, C.; Ginter, T.; Heinzel, T.; Krämer, O.H. STAT5 acetylation: Mechanisms and consequences for immunological control and leukemogenesis. JAK-STAT 2013, 2, e26102. [Google Scholar] [CrossRef]
- Zhuang, S. Regulation of STAT signaling by acetylation. Cell. Signal. 2013, 25, 1924–1931. [Google Scholar] [CrossRef]
- Awasthi, N.; Liongue, C.; Ward, A.C. STAT proteins: A kaleidoscope of canonical and non-canonical functions in immunity and cancer. J. Hematol. Oncol. 2021, 14, 198. [Google Scholar] [CrossRef]
- Krämer, O.H.; Knauer, S.K.; Greiner, G.; Jandt, E.; Reichardt, S.; Gührs, K.-H.; Stauber, R.H.; Böhmer, F.D.; Heinzel, T. A phosphorylation-acetylation switch regulates STAT1 signaling. Genes Dev. 2009, 23, 223–235. [Google Scholar] [CrossRef]
- Krämer, O.H.; Baus, D.; Knauer, S.K.; Stein, S.; Jäger, E.; Stauber, R.H.; Grez, M.; Pfitzner, E.; Heinzel, T. Acetylation of Stat1 modulates NF-kappaB activity. Genes Dev. 2006, 20, 473–485. [Google Scholar] [CrossRef] [PubMed] [Green Version]
- Villagra, A.; Sotomayor, E.M.; Seto, E. Histone deacetylases and the immunological network: Implications in cancer and inflammation. Oncogene 2010, 29, 157–173. [Google Scholar] [CrossRef] [PubMed]
- Yuan, Z.-L.; Guan, Y.-J.; Chatterjee, D.; Chin, Y.E. Stat3 dimerization regulated by reversible acetylation of a single lysine residue. Science 2005, 307, 269–273. [Google Scholar] [CrossRef]
- Sacks, D.; Baxter, B.; Campbell, B.C.V.; Carpenter, J.S.; Cognard, C.; Dippel, D.; Eesa, M.; Fischer, U.; Hausegger, K.; Hirsch, J.A.; et al. Multisociety Consensus Quality Improvement Revised Consensus Statement for Endovascular Therapy of Acute Ischemic Stroke. Int. J. Stroke 2018, 13, 612–632. [Google Scholar] [CrossRef] [PubMed]
- Wertz, I.E.; O’Rourke, K.M.; Zhou, H.; Eby, M.; Aravind, L.; Seshagiri, S.; Wu, P.; Wiesmann, C.; Baker, R.; Boone, D.L.; et al. De-ubiquitination and ubiquitin ligase domains of A20 downregulate NF-kappaB signalling. Nature 2004, 430, 694–699. [Google Scholar] [CrossRef]
- Dixit, V.M.; Green, S.; Sarma, V.; Holzman, L.B.; Wolf, F.W.; O’Rourke, K.; Ward, P.A.; Prochownik, E.V.; Marks, R.M. Tumor necrosis factor-alpha induction of novel gene products in human endothelial cells including a macrophage-specific chemotaxin. J. Biol. Chem. 1990, 265, 2973–2978. [Google Scholar] [CrossRef]
- Lee, E.G.; Boone, D.L.; Chai, S.; Libby, S.L.; Chien, M.; Lodolce, J.P.; Ma, A. Failure to regulate TNF-induced NF-kappaB and cell death responses in A20-deficient mice. Science 2000, 289, 2350–2354. [Google Scholar] [CrossRef]
- Boone, D.L.; Turer, E.E.; Lee, E.G.; Ahmad, R.-C.; Wheeler, M.T.; Tsui, C.; Hurley, P.; Chien, M.; Chai, S.; Hitotsumatsu, O.; et al. The ubiquitin-modifying enzyme A20 is required for termination of Toll-like receptor responses. Nat. Immunol. 2004, 5, 1052–1060. [Google Scholar] [CrossRef]
- Zhou, Q.; Wang, H.; Schwartz, D.M.; Stoffels, M.; Park, Y.H.; Zhang, Y.; Yang, D.; Demirkaya, E.; Takeuchi, M.; Tsai, W.L.; et al. Loss-of-function mutations in TNFAIP3 leading to A20 haploinsufficiency cause an early-onset autoinflammatory disease. Nat. Genet. 2016, 48, 67–73. [Google Scholar] [CrossRef]
- Taciak, B.; Białasek, M.; Braniewska, A.; Sas, Z.; Sawicka, P.; Kiraga, Ł.; Rygiel, T.; Król, M. Evaluation of phenotypic and functional stability of RAW 264.7 cell line through serial passages. PLoS ONE 2018, 13, e0198943. [Google Scholar] [CrossRef]
- Dinarello, C.A.; Fossati, G.; Mascagni, P. Histone deacetylase inhibitors for treating a spectrum of diseases not related to cancer. Mol. Med. 2011, 17, 333–352. [Google Scholar] [CrossRef] [PubMed]
- Daskalaki, M.G.; Tsatsanis, C.; Kampranis, S.C. Histone methylation and acetylation in macrophages as a mechanism for regulation of inflammatory responses. J. Cell. Physiol. 2018, 233, 6495–6507. [Google Scholar] [CrossRef]
- Poralla, L.; Stroh, T.; Erben, U.; Sittig, M.; Liebig, S.; Siegmund, B.; Glauben, R. Histone deacetylase 5 regulates the inflammatory response of macrophages. J. Cell. Mol. Med. 2015, 19, 2162–2171. [Google Scholar] [CrossRef]
- Schmitz, M.L.; de la Vega, L. New Insights into the Role of Histone Deacetylases as Coactivators of Inflammatory Gene Expression. Antioxid. Redox Signal. 2015, 23, 85–98. [Google Scholar] [CrossRef] [PubMed]
- Wolter, S.; Doerrie, A.; Weber, A.; Schneider, H.; Hoffmann, E.; von der Ohe, J.; Bakiri, L.; Wagner, E.F.; Resch, K.; Kracht, M. c-Jun controls histone modifications, NF-kappaB recruitment, and RNA polymerase II function to activate the ccl2 gene. Mol. Cell. Biol. 2008, 28, 4407–4423. [Google Scholar] [CrossRef] [PubMed]
- Doyle, S.; Vaidya, S.; O’Connell, R.; Dadgostar, H.; Dempsey, P.; Wu, T.; Rao, G.; Sun, R.; Haberland, M.; Modlin, R.; et al. IRF3 mediates a TLR3/TLR4-specific antiviral gene program. Immunity 2002, 17, 251–263. [Google Scholar] [CrossRef]
- Gordon, H.M.; Kucera, G.; Salvo, R.; Boss, J.M. Tumor necrosis factor induces genes involved in inflammation, cellular and tissue repair, and metabolism in murine fibroblasts. J. Immunol. 1992, 148, 4021–4027. [Google Scholar] [PubMed]
- Kurdistani, S.K.; Tavazoie, S.; Grunstein, M. Mapping global histone acetylation patterns to gene expression. Cell 2004, 117, 721–733. [Google Scholar] [CrossRef]
- Bosisio, D.; Marazzi, I.; Agresti, A.; Shimizu, N.; Bianchi, M.E.; Natoli, G. A hyper-dynamic equilibrium between promoter-bound and nucleoplasmic dimers controls NF-kappaB-dependent gene activity. EMBO J. 2006, 25, 798–810. [Google Scholar] [CrossRef]
- Salvi, V.; Scutera, S.; Rossi, S.; Zucca, M.; Alessandria, M.; Greco, D.; Bosisio, D.; Sozzani, S.; Musso, T. Dual regulation of osteopontin production by TLR stimulation in dendritic cells. J. Leukoc. Biol. 2013, 94, 147–158. [Google Scholar] [CrossRef]
- Salvi, V.; Nguyen, H.O.; Sozio, F.; Schioppa, T.; Gaudenzi, C.; Laffranchi, M.; Scapini, P.; Passari, M.; Barbazza, I.; Tiberio, L.; et al. SARS-CoV-2-associated ssRNAs activate inflammation and immunity via TLR7/8. JCI Insight 2021, 6, e150542. [Google Scholar] [CrossRef] [PubMed]


Publisher’s Note: MDPI stays neutral with regard to jurisdictional claims in published maps and institutional affiliations. |
© 2022 by the authors. Licensee MDPI, Basel, Switzerland. This article is an open access article distributed under the terms and conditions of the Creative Commons Attribution (CC BY) license (https://creativecommons.org/licenses/by/4.0/).
Share and Cite
Schioppa, T.; Nguyen, H.O.; Tiberio, L.; Sozio, F.; Gaudenzi, C.; Passari, M.; Del Prete, A.; Bosisio, D.; Salvi, V. Inhibition of Class I Histone Deacetylase Activity Blocks the Induction of TNFAIP3 Both Directly and Indirectly via the Suppression of Endogenous TNF-α. Int. J. Mol. Sci. 2022, 23, 9752. https://0-doi-org.brum.beds.ac.uk/10.3390/ijms23179752
Schioppa T, Nguyen HO, Tiberio L, Sozio F, Gaudenzi C, Passari M, Del Prete A, Bosisio D, Salvi V. Inhibition of Class I Histone Deacetylase Activity Blocks the Induction of TNFAIP3 Both Directly and Indirectly via the Suppression of Endogenous TNF-α. International Journal of Molecular Sciences. 2022; 23(17):9752. https://0-doi-org.brum.beds.ac.uk/10.3390/ijms23179752
Chicago/Turabian StyleSchioppa, Tiziana, Hoang Oanh Nguyen, Laura Tiberio, Francesca Sozio, Carolina Gaudenzi, Mauro Passari, Annalisa Del Prete, Daniela Bosisio, and Valentina Salvi. 2022. "Inhibition of Class I Histone Deacetylase Activity Blocks the Induction of TNFAIP3 Both Directly and Indirectly via the Suppression of Endogenous TNF-α" International Journal of Molecular Sciences 23, no. 17: 9752. https://0-doi-org.brum.beds.ac.uk/10.3390/ijms23179752