Article

The Chromatin-Oxygen Sensor Gene KDM5C Associates with Novel Hypoxia-Related Signatures in Glioblastoma Multiforme

1
Institute of Genetics and Biophysics Adriano Buzzati-Traverso, CNR, 80131 Naples, Italy
2
Maria Rosaria Maglione Foundation Onlus, 80122 Naples, Italy
3
A.O.R.N. S. Anna and S. Sebastiano Hospital, Division of Neurosurgery, 81100 Caserta, Italy
4
A.O.R.N. S. Anna and S. Sebastiano Hospital, Division of Pathology, 81100 Caserta, Italy
5
A.O.R.N. S. Anna and S. Sebastiano Hospital, Division of Oncology, 81100 Caserta, Italy
*
Authors to whom correspondence should be addressed.
These authors co-supervised the study.
Int. J. Mol. Sci. 2022, 23(18), 10250; https://0-doi-org.brum.beds.ac.uk/10.3390/ijms231810250
Submission received: 4 August 2022 / Revised: 26 August 2022 / Accepted: 31 August 2022 / Published: 6 September 2022

Abstract

:
Glioblastoma multiforme (GBM) is a fatal brain tumor without effective drug treatment. In this study, we highlight, for the first time, the contribution of chromatin remodeling gene Lysine (K)-specific demethylase 5C (KDM5C) in GBM via an extensive analysis of clinical, expression, and functional data, integrated with publicly available omic datasets. The expression analysis on GBM samples (N = 37) revealed two informative subtypes, namely KDM5CHigh and KDM5CLow, displaying higher/lower KDM5C levels compared to the controls. The former subtype displays a strong downregulation of brain-derived neurotrophic factor (BDNF)—a negative KDM5C target—and a robust overexpression of hypoxia-inducible transcription factor-1A (HIF1A) gene, a KDM5C modulator. Additionally, a significant co-expression among the prognostic markers HIF1A, Survivin, and p75 was observed. These results, corroborated by KDM5C overexpression and hypoxia-related functional assays in T98G cells, suggest a role for the HIF1A-KDM5C axis in the hypoxic response in this tumor. Interestingly, fluorescence-guided surgery on GBM sections further revealed higher KDM5C and HIF1A levels in the tumor rim niche compared to the adjacent tumor margin, indicating a regionally restricted hyperactivity of this regulatory axis. Analyzing the TCGA expression and methylation data, we found methylation changes between the subtypes in the genes, accounting for the hypoxia response, stem cell differentiation, and inflammation. High NANOG and IL6 levels highlight a distinctive stem cell-like and proinflammatory signature in the KDM5CHigh subgroup and GBM niches. Taken together, our results indicate HIF1A-KDM5C as a new, relevant cancer axis in GBM, opening a new, interesting field of investigation based on KDM5C as a potential therapeutic target of the hypoxic microenvironment in GBM.

Graphical Abstract

1. Introduction

Glioblastoma multiforme (GBM) is one of the most aggressive and damaging tumors of the brain without effective targeted chemotherapeutic agents [1]. GBM is characterized by high heterogeneity and poor survival with a median rate of 12–16 months after diagnosis [2]. It is a fast-growing tumor characterized by the presence of oxygen deficiency (hypoxia) with central necrosis, robust angiogenesis, intense resistance to apoptosis, and genomic instability [3]. Currently, patients with GBM undergo surgical removal of the tumor mass and then radiotherapy and/or chemotherapy using temozolomide (TMZ) protocols that, however, are still completely inadequate to effectively combat GBM [2,4]. To date, the poor understanding of the molecular mechanisms underlying GBM aggression, multiple drug resistance (MDR), and relapse have prevented the development of effective targeted therapies [5]. At the basis of the aforementioned processes, several studies have proved the critical role played by hypoxia characterizing the tumor microenvironment (TME), but little is known about the molecular players involved and how to manipulate them.
The frequent occurrence of somatic alterations in the genes responsible for chromatin remodeling and transcriptional control in cancer is the Achilles’ heel of tumors, which allows the identification of epigenetic biomarkers as new possible drug targets [6,7,8]. In this regard, it has definitely established the key role of Jumonji-C (JmjC) histone demethylases (KDMs) as chromatin oxygen sensors required for the cellular response to hypoxia [9]. Mechanistically, JmjC KDMs are 2-oxoglutarate-dependent dioxygenases whose enzymatic activity requires oxygen and Fe2+ to promote the hydroxylation reaction necessary for the removal of the methyl groups [9]. Among them, X-chromosome Lysine-specific demethylase 5C (KDM5C) is a JmjC gene involved in p53 gene expression regulation, having a significant role in tumor cell proliferation, migration, and drug resistance [10]. The KDM5C protein catalyzes H3K4me3-me2 demethylation [11,12], and depending on the methylation site, it can either activate or repress gene transcription [13]. Somatic mutations in KDM5C were identified in renal cell carcinoma [14], pancreatic cancer [15], and in primary and secondary chemoresistant pediatric acute myeloid leukemia [16]. In addition to mutations, alterations in the KDM5C expression levels have been related to the development of various cancers. Indeed, KDM5C overexpression is associated with increased tumor cell proliferation and tumorigenic progression in multiple cancer types, including colorectal [17], breast [18], ovary [19], and prostate [20]. Conversely, KDM5C downregulation is associated with genomic instability in clear cell renal cell carcinoma (ccRCC) [14].
The role of KDM5C in cancer is still controversial, given the dual -pro-oncogenic and suppressive properties, which are highly tumor-specific. KDM5C alterations have been proposed as a negative prognostic marker in various cancers and have been also used to predict survival benefits upon immune checkpoint inhibitor treatments [21]. In ccRCC, KDM5C specifically regulates the expression of several hypoxia-inducible factor (Hif)-related genes [22], and its deficiency promotes tumorigenicity by reprogramming glycogen metabolism and inhibiting ferroptosis [23]. Most importantly, pharmacological KDM5C inhibition blocks cell growth and tumorigenesis [24] by repressing oncogenic target genes [25] or, alternatively, by counteracting genomic instability [14].
KDM5C was initially identified as an X-linked Intellectual Disability (XLID) gene with a critical role for brain development and functioning, as evident by the discovery of hereditary and de novo mutations in patients with neurodevelopmental diseases (NDDs), presenting intellectual disability (ID), epilepsy, and autism [26]. Several independent studies [27,28], including ours [29,30,31], reported KDM5C as widely expressed in both neurons and astrocyte cells and its activity as required for neuronal maturation and plasticity.
Here, we have explored for the first time the potential role of KDM5C in the pathophysiology of GBM. We analyzed the expression of this chromatin oxygen sensor gene in GBM tissues isolated both from conventional surgery and the most recent 5-aminolevulinic acid fluorescence-guided surgery (5-ALA FGS) method. This analysis allowed us stratifying GBM patients into two subgroups (KDM5CLow and KDM5CHigh) in which the expression of KDM5C targets and hypoxic-related markers was extensively studied. Additionally, taking advantage of public omic datasets, we disclosed differences in gene expression and methylation between the tumor subgroups, identifying relevant altered and interconnected processes, such as the hypoxia response, inflammation, and stemness. Overall, our results highlight the role of KDM5C in GBM, identifying the new hypoxia-induced signature exclusively localized in the tumor tissue.

2. Results

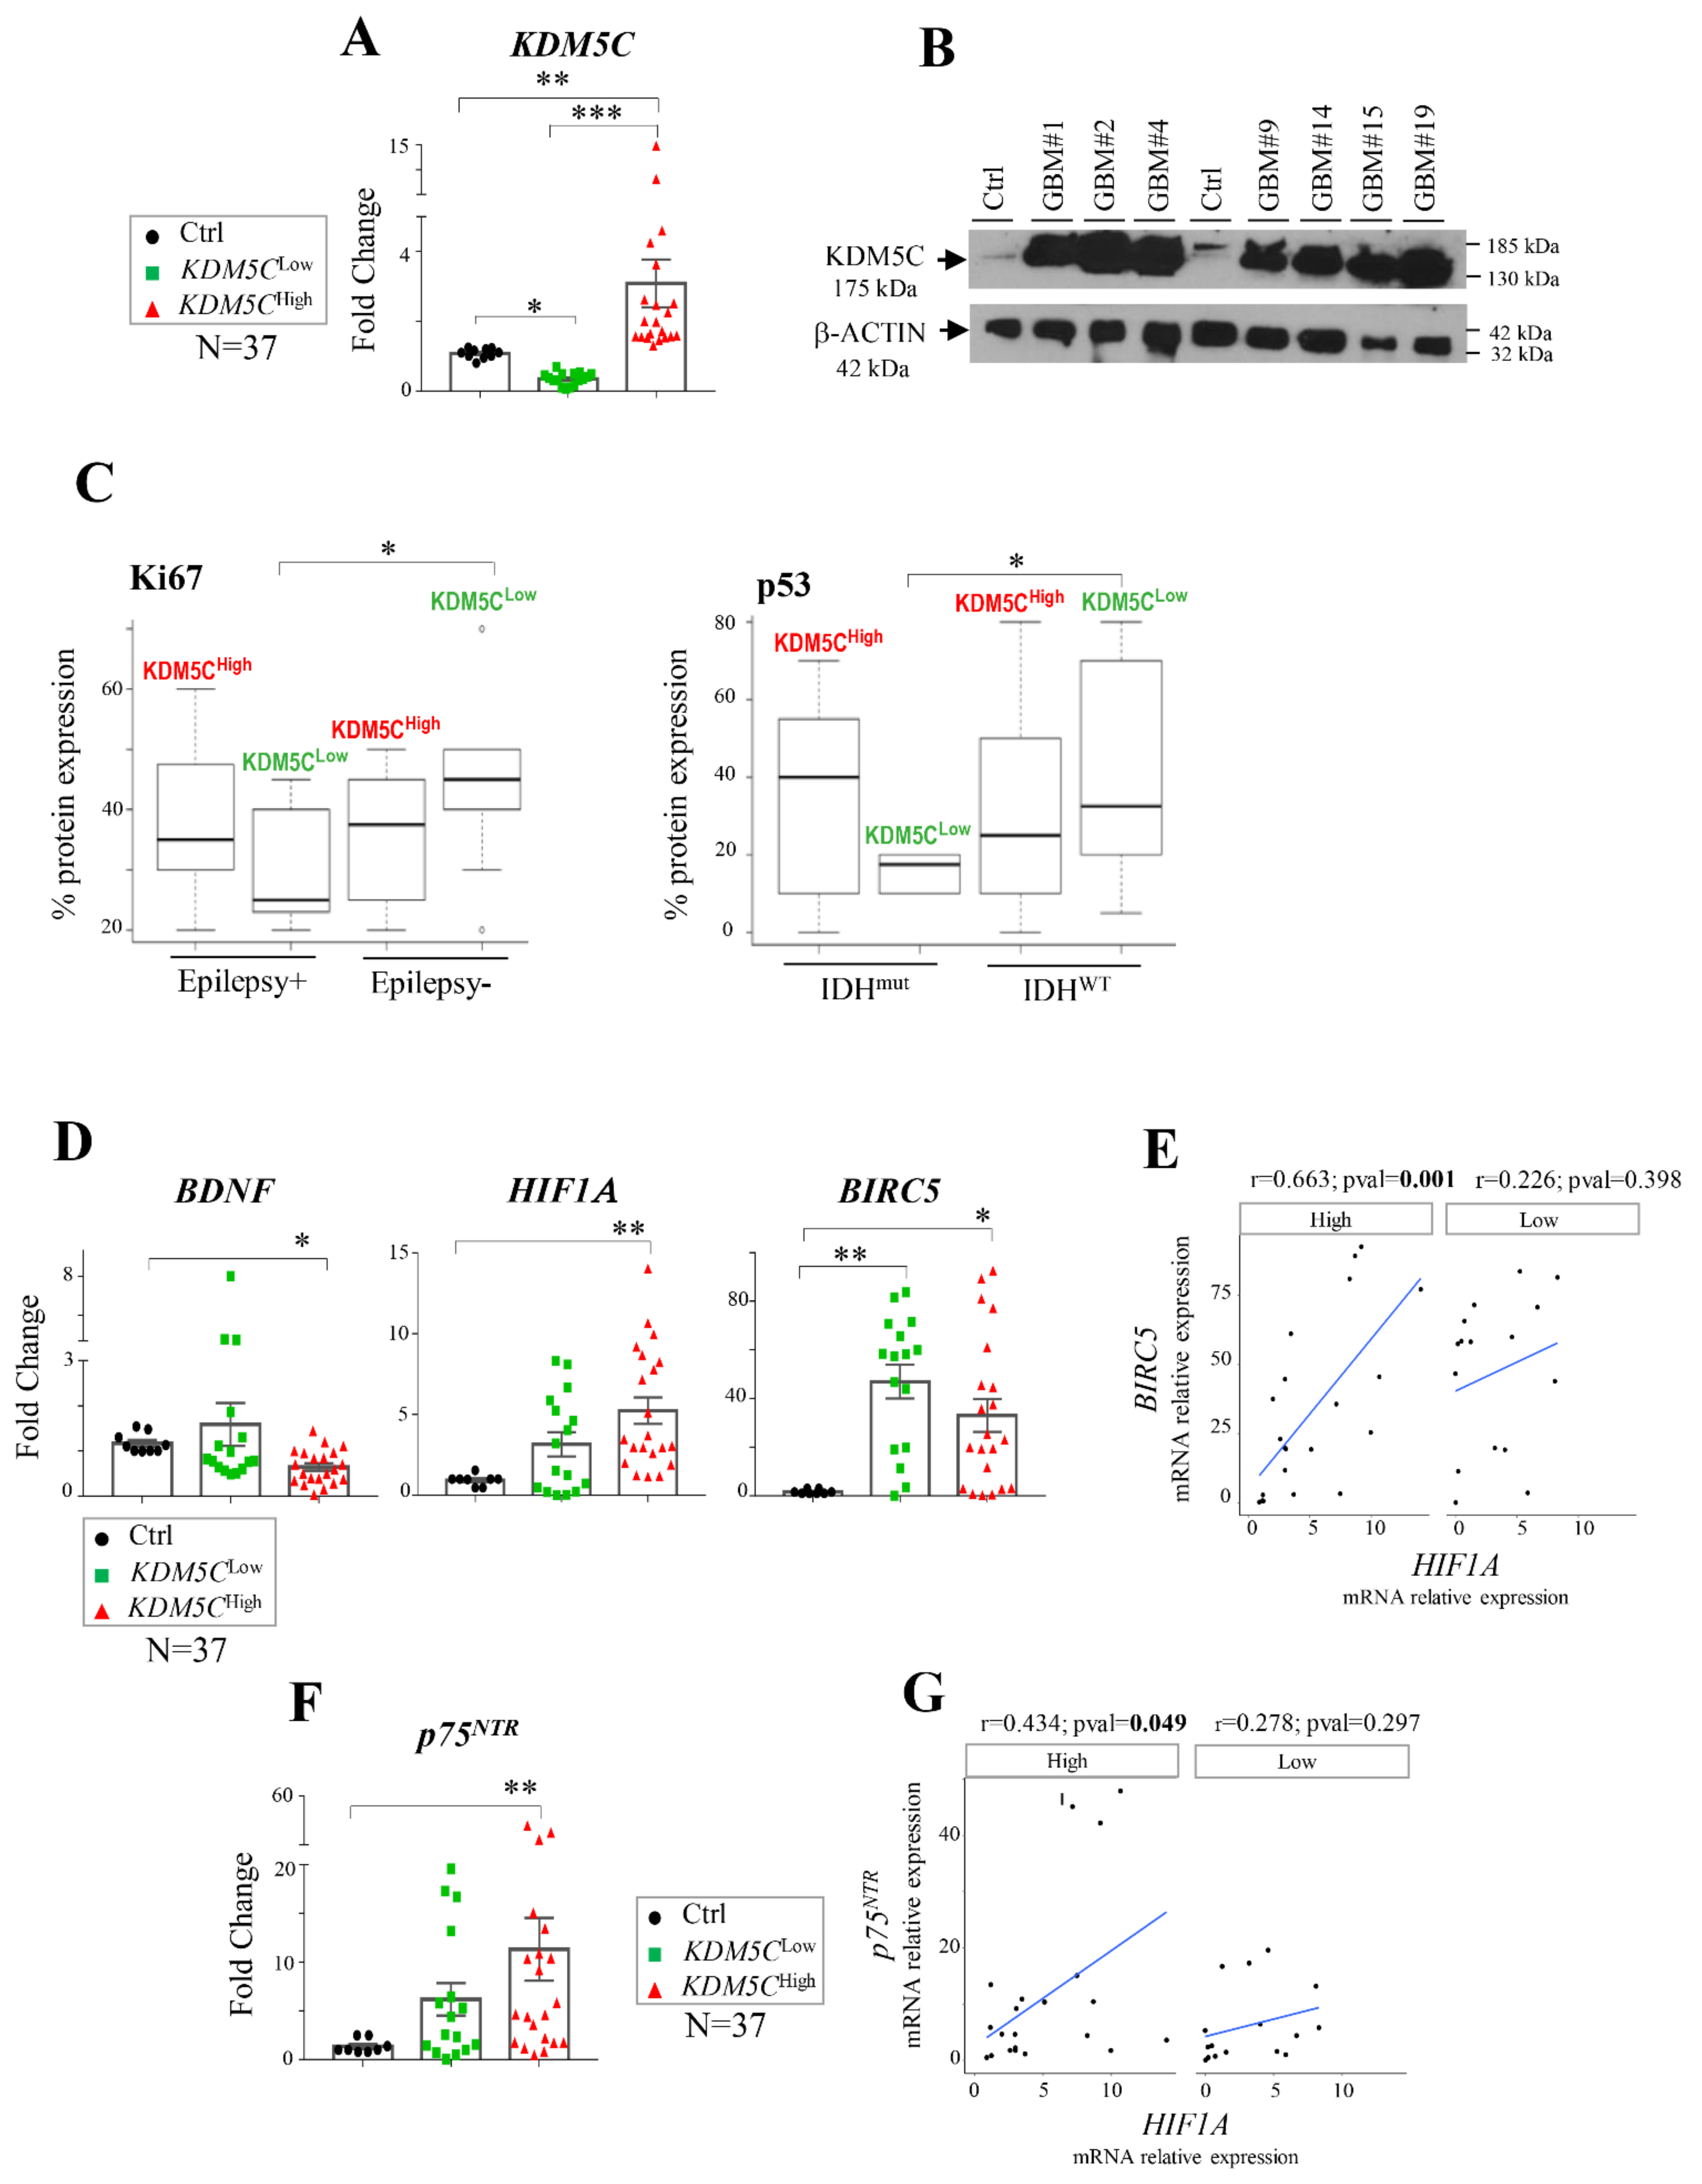
2.1. Stratification of GBM Patients Based on KDM5C Gene Expression Levels

Considering the debated role of KDM5C as an oncogene or tumor suppressor and its crucial contribution in brain functioning, we first aimed to establish KDM5C expression levels by real time PCR (RT-PCR) in tumor samples (N = 37) derived from GBM patients compared to brain control samples (N = 8). Analyzing the entire cohort of GBM samples (KDM5CTot), whose clinical features are summarized in Table 1, we found no significant differences in KDM5C expression compared to the control samples (Figure S1A). However, as we noted highly heterogeneous KDM5C levels across the sample cohorts, we sought to stratify them into two subgroups—KDM5CLow and KDM5CHigh (Figure 1A)—according to the KDM5C expression. As expected, a strong increase in the amount of KDM5C protein was evident in the protein lysates obtained from biopsies of the KDM5CHigh GBM subgroup (Figure 1B), whereas no detectable band was visible in the WB assay from the samples of the KDM5CLow GBM subgroup. Looking for a clinical feature associated with KDM5C changes, we analyzed the baseline patient characteristics of each cohort. Despite how the KDM5C levels do not significantly associate either with clinicopathological characteristics (Table S1) or survival (Figure S1B) in the two GBM subgroups, significant changes in Ki67 and p53 protein expressions were observed in KDM5CLow patients with (Epilepsy+) compared to those without epilepsy (Epilepsy−) and in KDM5CLow patients with (IDHmut) or without (IDHWT) IDH1/2 mutation (Figure 1C), respectively. These findings indicate a possible link between KDM5C, and these two prognostic markers widely used as poor prognosis indicators in GBM patients [32]. Next, we explored whether low and high KDM5C levels might impact the expression of the negative KDM5C-responsive gene brain-derived neurotrophic factor (BDNF), implicated in GBM pathogenesis [33]. As expected, by analyzing the entire GBM cohort (KDM5CTot), no significant differences in BDNF expression were found between the two groups and compared to the control samples (Figure S1C). However, a significant BDNF decrease was observed specifically in the KDM5CHigh subgroup compared to the control samples (Figure 1D); no significant variation was observed in the KDM5CLow tumor samples that displayed expression values comparable to the healthy tissues (Figure 1D). Overall, these results suggest the potential use of KDM5C as a molecular stratification factor in GBM, with a particular attention for patients with epilepsy and IDH1/2 mutations.

2.2. Hypoxia-Related Signatures Correlate with KDM5C Levels

Given the role of the KDM5C protein as an oxygen sensor [9], we further analyzed the expression levels of hypoxic markers aiming to identify the tumor signatures associated with the changes in KDM5C. Noteworthy, hypoxia, a characteristic of almost all types of solid tumors, has been associated with a poor outcome in GBM [34]. We therefore measured the expression of hypoxia-inducible factor 1-alpha, encoded by the HIF1A gene reported to be a direct modulator of KDM5C expression [22,35] and to play a critical role in GBM progression [36] and temozolomide responsiveness [37]. In line with its pro-tumorigenic feature, HIF1A is overall induced in GBM samples (vs. the control), reaching its highest expression levels in the KDM5CHigh subgroup (Figure 1D). Despite a trend of over-expression also observed in the KDM5CLow subgroup, it did not reach the threshold (p > 0.05) of statistical significance (Figure 1D). Since high levels of HIF-1α are strongly correlated with the expression of survivin, a protein involved in tumor progression [38], we analyzed the transcript levels of the corresponding gene Baculoviral IAP Repeat-Containing Protein 5 (BIRC5). Interestingly, in both tumor subgroups, we found a marked BIRC5 overexpression compared to the control samples (Figure 1D), even though a very strong and significant positive correlation between HIF1A and BIRC5 was observed only in the KDM5CHigh subgroup (Figure 1E and Figure S1D).
Afterwards, we analyzed the expression of the p75 neurotrophin receptor (p75NTR) that, as previously reported by Tong et al. [39], positively regulates the level of HIF1A and correlates with hypoxia-induced stemness in glioma. We measured an increased expression of p75NTR and a positive correlation with HIF1A, which is significant only in the KDM5CHigh subgroup vs. the control samples (Figure 1F,G). We also tested the transcript level of the nerve growth factor (NGF) that, through the binding to receptor p75NTR, is involved in glioma proliferation [40]. No significant variation in the NGF levels were observed in the entire cohort of tumor samples or in the two subgroups compared to the controls (Figure S1E). Collectively, despite the limitations due to the low number of patients, these findings indicate that GBM tumors expressing higher KDM5C levels are positively associated with increased HIF1A, suggesting a potential pro-tumorigenic activity of KDM5C in GBM. On the opposite side, the marked repression of BDNF in the KDM5CHigh subgroup suggests a possible direct role of KDM5C in the promoter’s demethylation in these tumor samples.

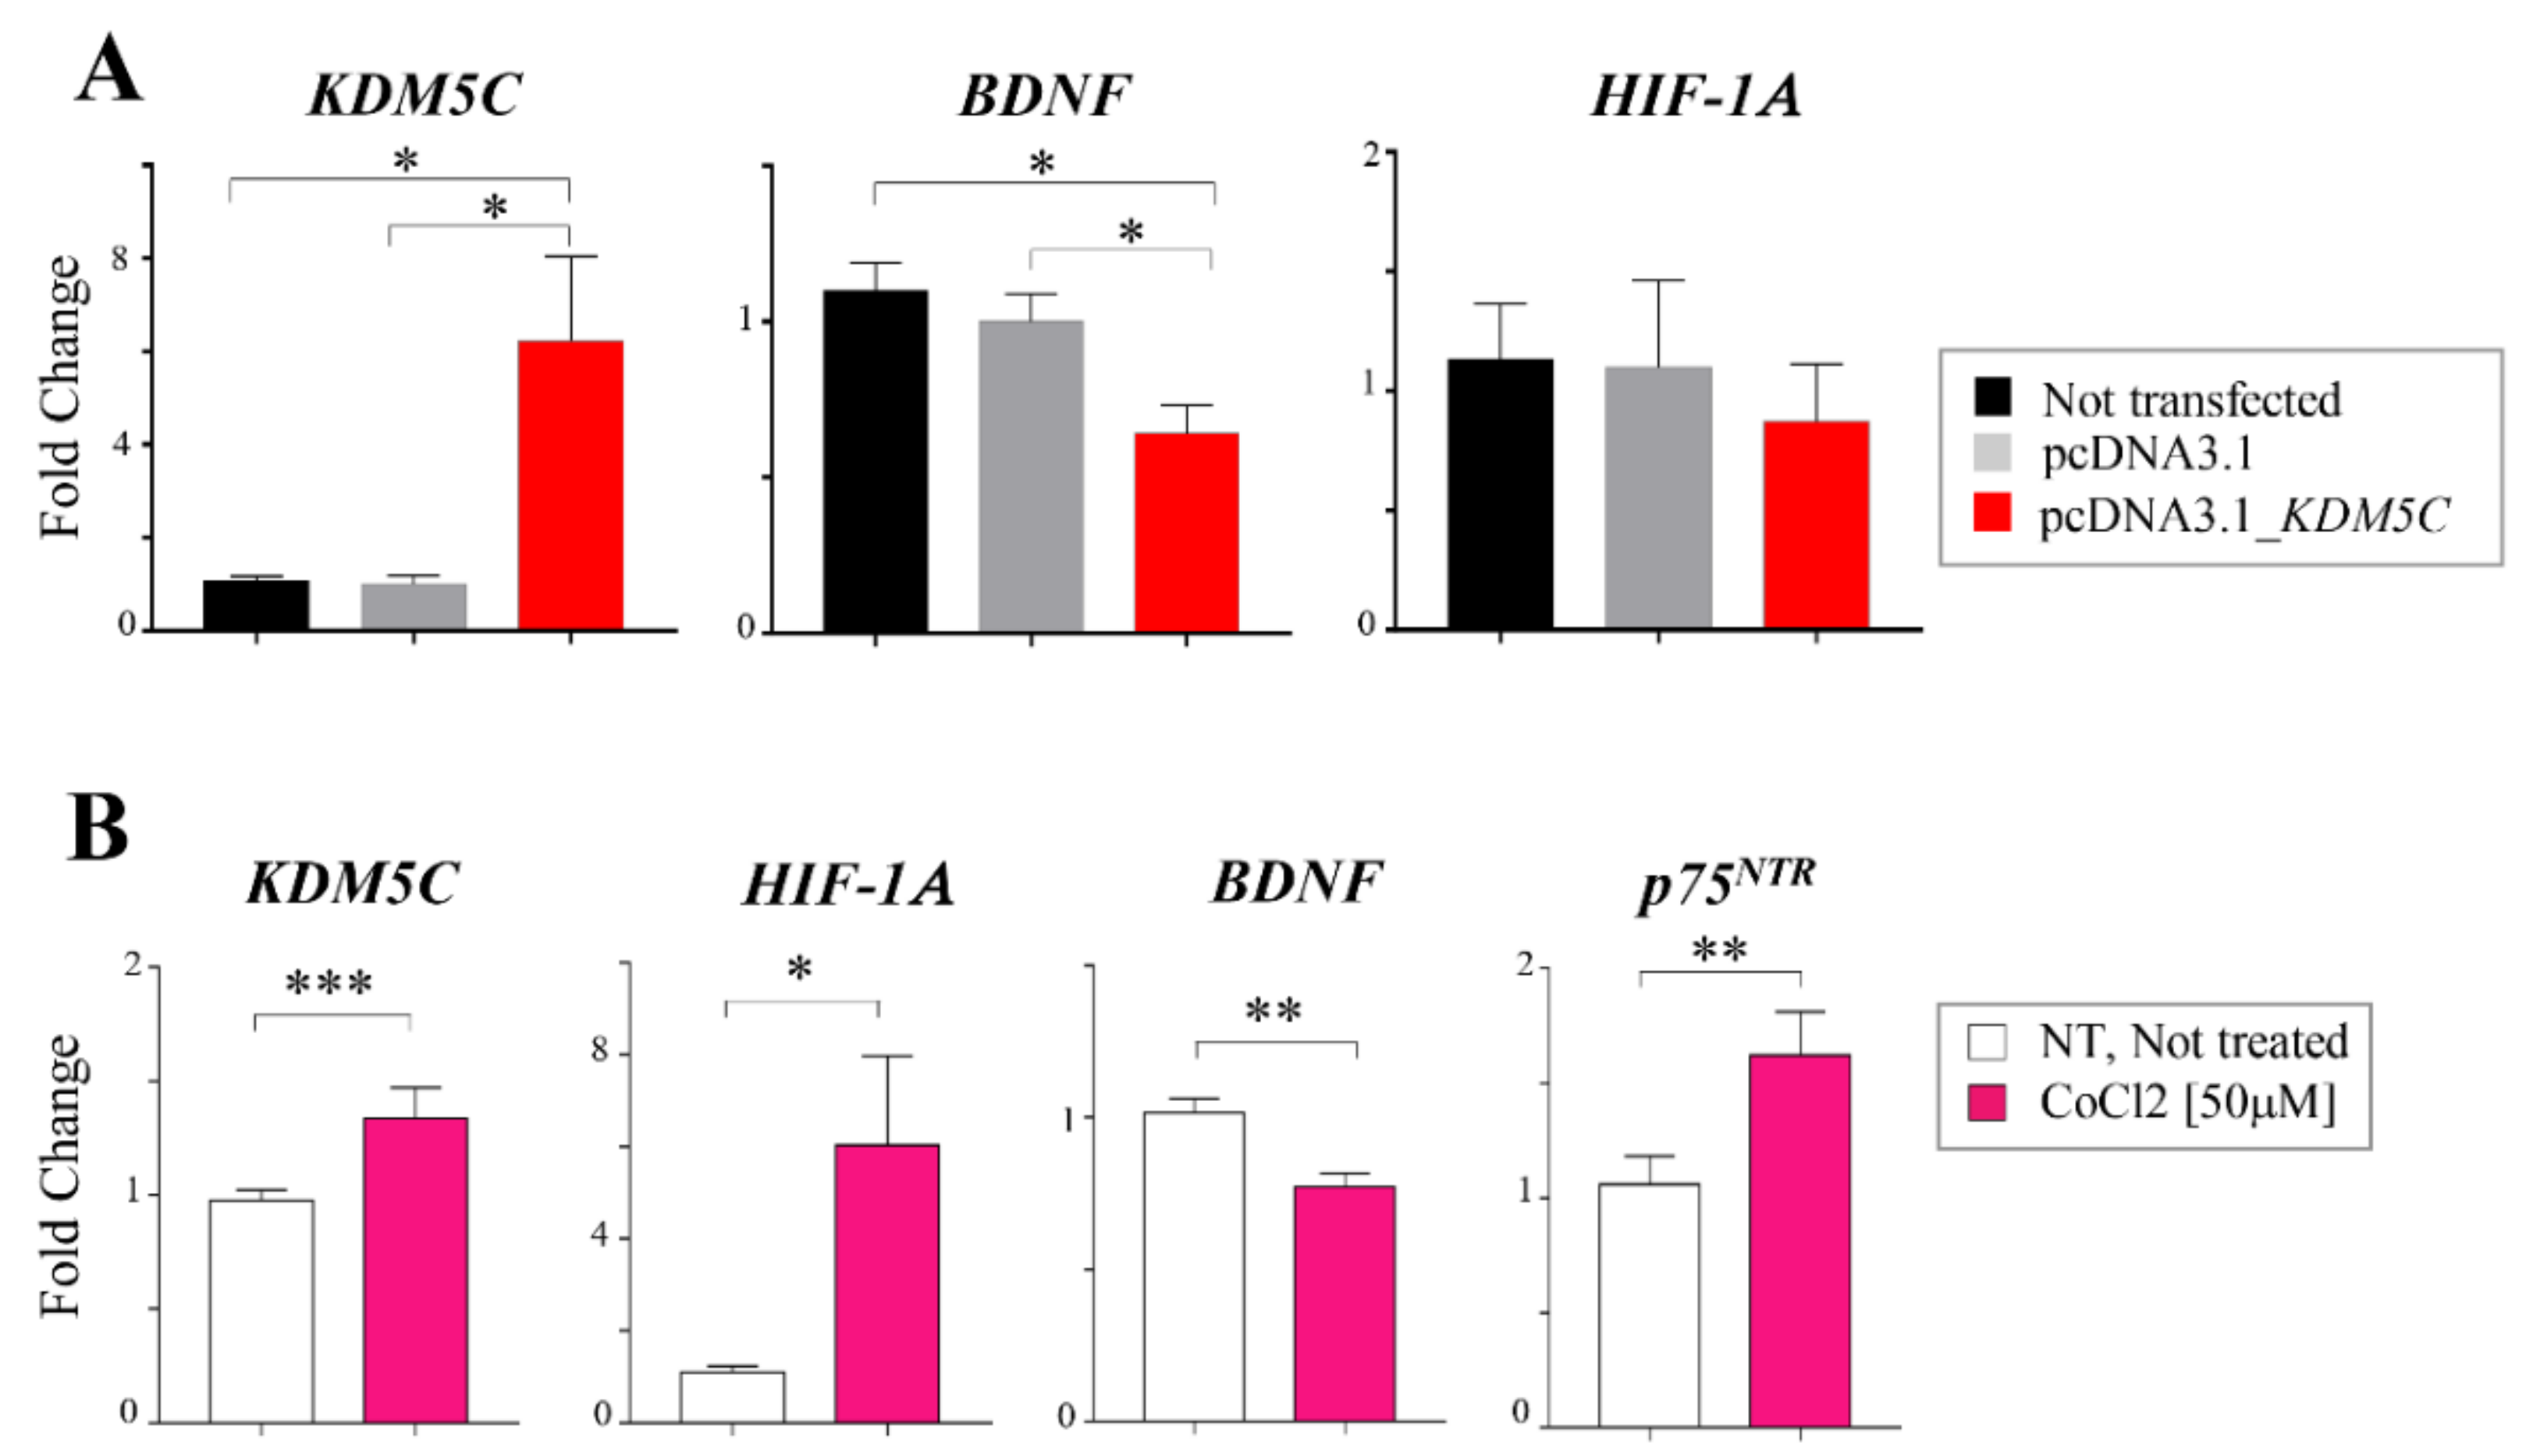
2.3. Hif-1α Stabilization Induces KDM5C Increase and BDNF Repression in T98G Glioblastoma Cell Line

To functionally investigate the impact of KDM5C overexpression on the BDNF and HIF1A levels, we transiently transfected the T98G glioblastoma cell line with KDM5C plasmid (see Materials and Methods). After assessing the transfection efficiency, we measured the expression of BDNF, HIF1A, NGF, and p75NTR mRNAs in transfected cells. As shown in Figure 2A, KDM5C-overexpressing cells display a significant downregulation of BDNF; while no effects were observed for HIF1A (Figure 2A), NGF, and p75NTR (Figure S1F), suggesting that one of the primary events of KDM5C induction in tumor cells could be the transcriptional repression of the BDNF gene. However, considering that hypoxia—through the involvement of Hif-1α—has been reported to regulate histone demethylases, including KDM5C [35], we used cobalt chloride (CoCl2), a hypoxia-mimicking chemical [41], to stabilize Hif-1α in T98G cells. Interestingly, HIF1A mRNA increasingly correlates with high levels of KDM5C mRNA (Figure 2B). Furthermore, in line with KDM5C over-expression, CoCl2-treated tumor cells also display BDNF repression and p75NTR upregulation (Figure 2B). It should be noted that, in the CoCl2 conditions employed, in line with the published data [42], the growth or survival rate of T98G cells were unchanged. Overall, the in vitro data on the GBM tumor cell line indicate that, in hypoxic conditions, high levels of p75NTR may correlate with high levels of HIF1A and KDM5C, a negative regulator of BDNF.

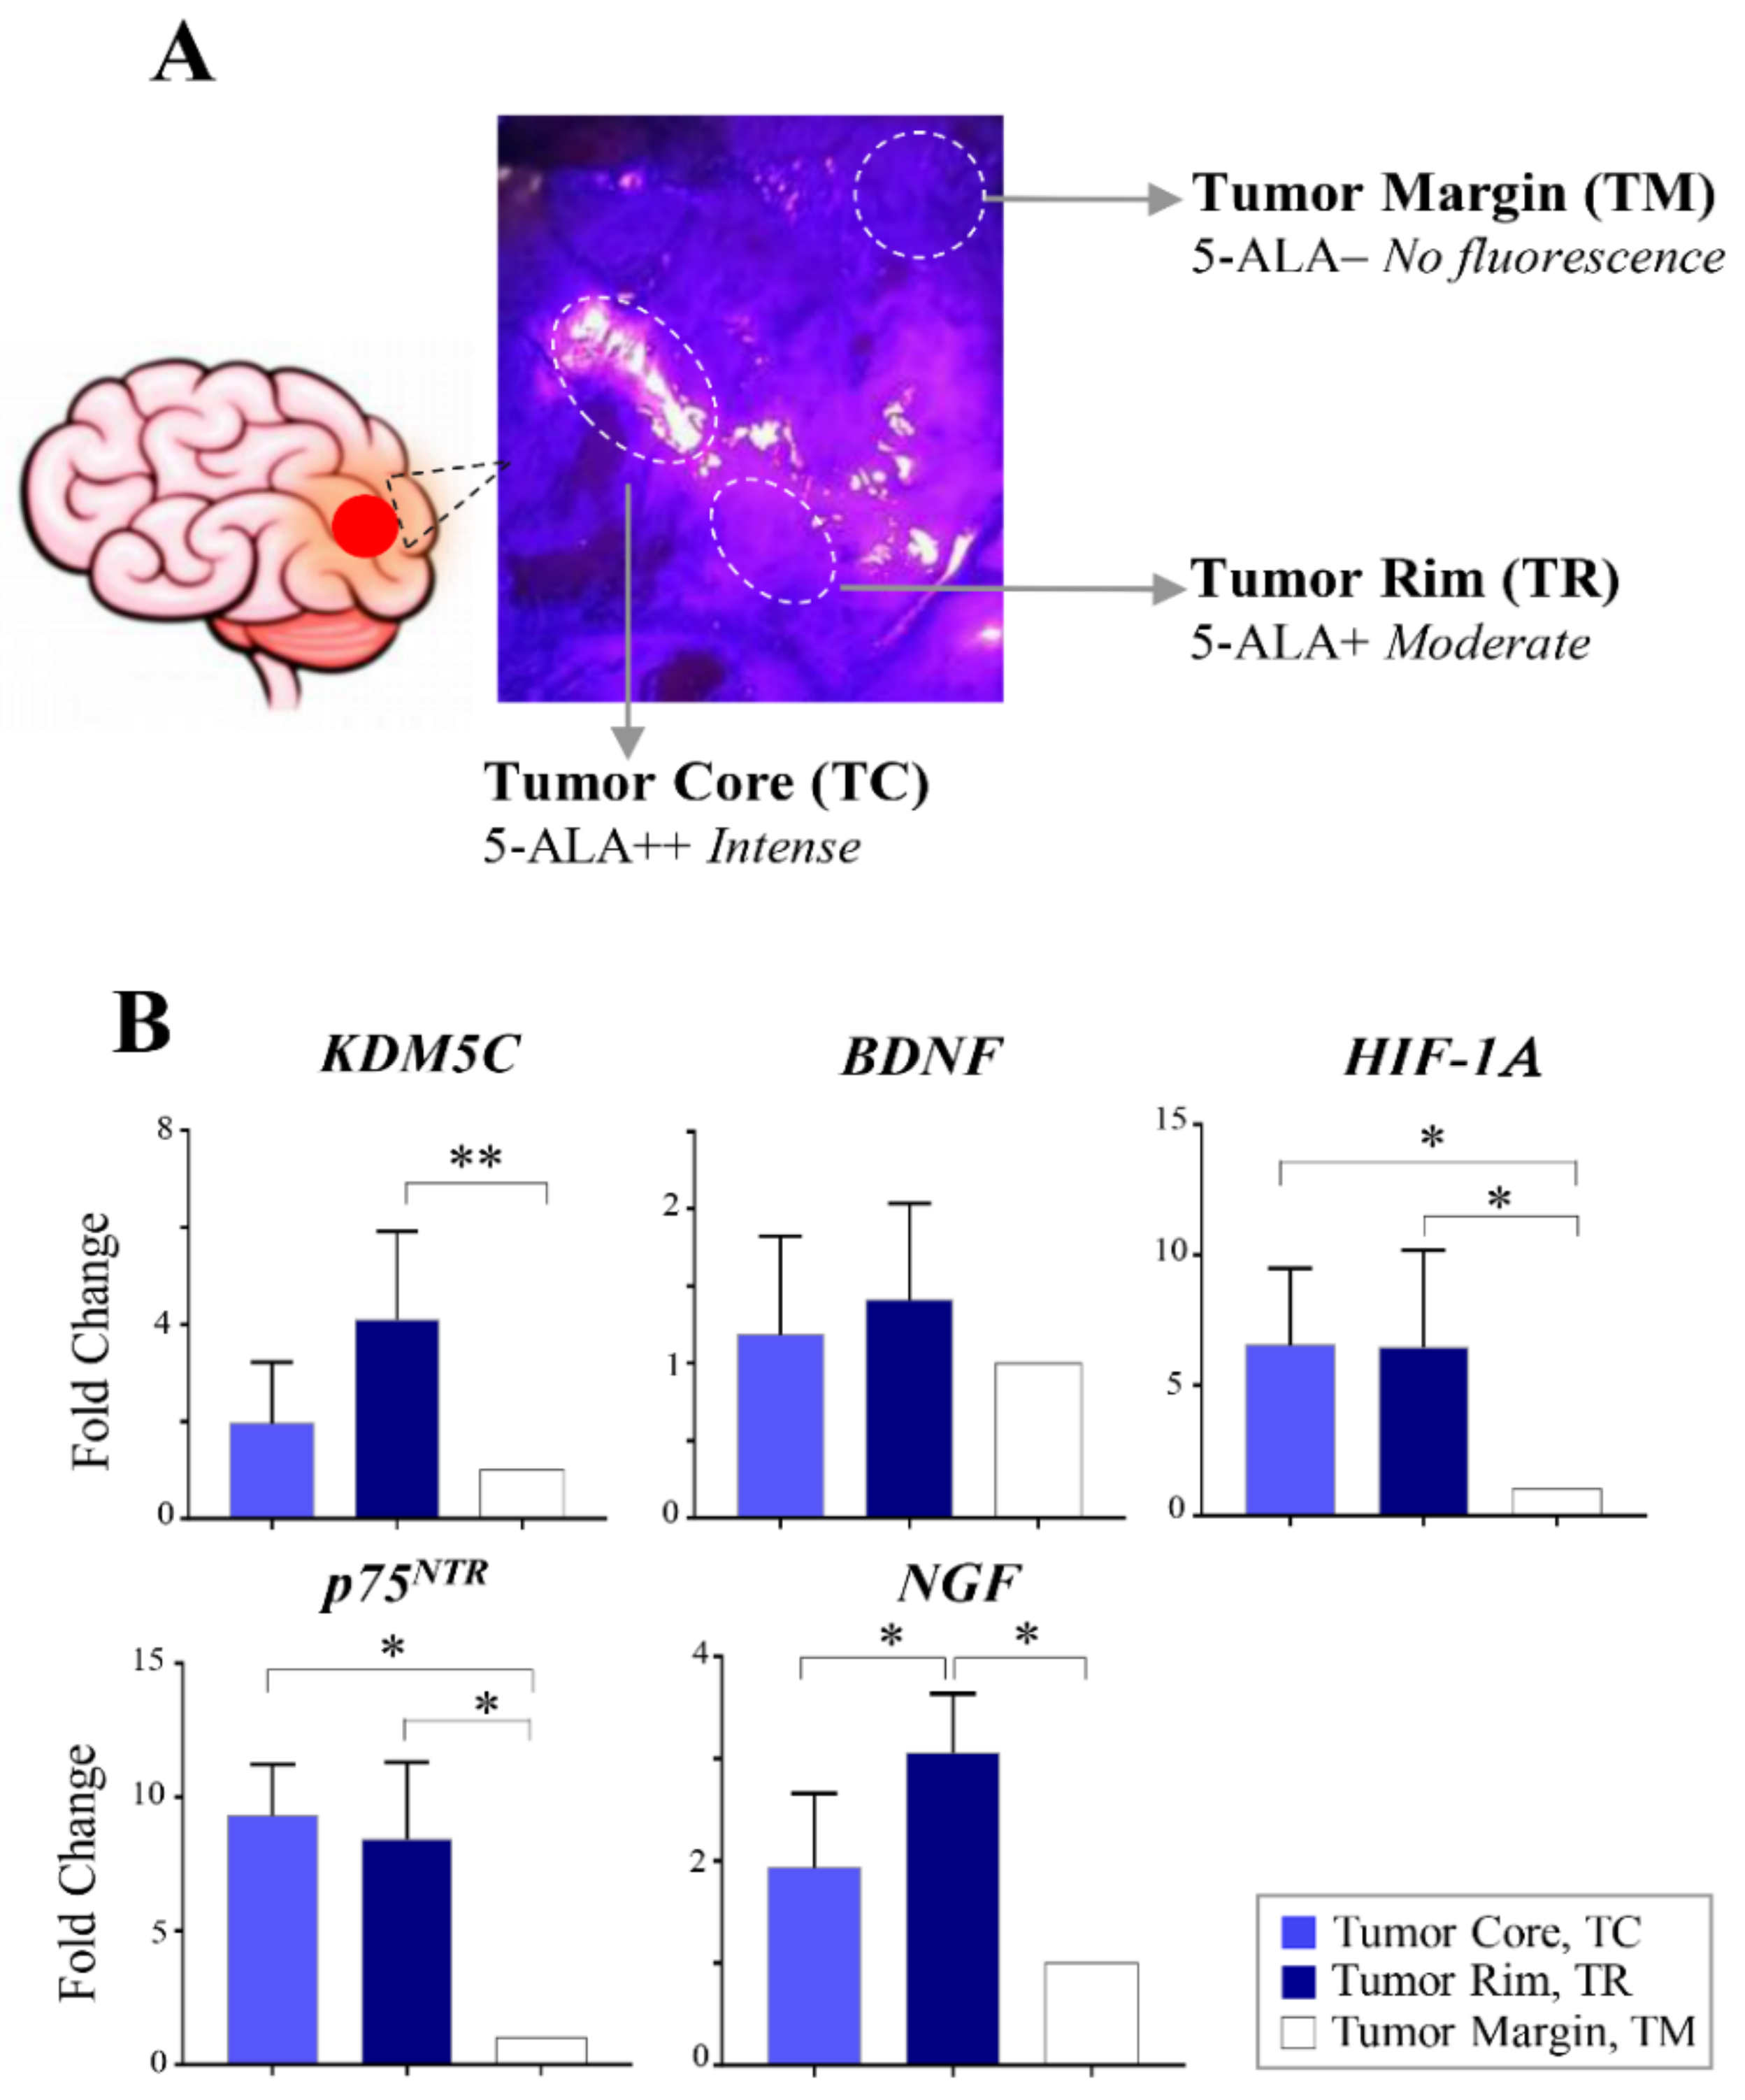
2.4. Regional Heterogeneity of KDM5C and HIF1A Expression Profiles in Distinct GBM Areas Isolated by 5-Aminolevulinic acid Fluorescence-Guided Surgery

Since GBM contains several tumor microenvironments (TMEs) with irregular distributions of signaling networks [43], we wondered whether the gene expression levels of KDM5C, BDNF, and HIF1A differed in distinct GBM tumor areas. Taking advantage of 5-aminolevulinic acid (5-ALA) fluorescence-guided surgery (FGS), we isolated the central region of the tumor, the infiltrating front, and the healthy surrounding tissue, respectively, characterized by bright (5-ALA++; intense), weak (5-ALA+; moderate), and no fluorescence (5-ALA-; Figure 3A and Figure S2A) [44]. In terms of histological characteristics, these areas correspond to three dominant TME niches: 5-ALA++ corresponds to the tumor core (TC) characterized by severe hypoxia, 5-ALA+ corresponds to the tumor rim (TR) with infiltrating glioma cells characterized by high mitotic activity, and 5-ALA- corresponds to the tumor margin (TM) considered the intersection between infiltrating tumor cells and nontumoral brain tissue (Figure 3A). The expression analysis was carried out in representative regions displaying strong (5-ALA++), moderate (5-ALA+), or no 5-ALA (5-ALA-) fluorescence obtained from seven GBM patients undergoing 5-ALA FGS. Interestingly, we measured higher KDM5C expression levels in the TR region compared to the TM region (p-value 0.004). Moreover, significantly higher levels of HIF1A were measured in both TC and TR compared to the TM area (Figure 3B and Figure S2B). No significant differences were found for the BDNF levels among the three areas, and there is a higher level of HIF1A in both TC and TR than in TM (Figure 3B). Furthermore, p75NTR expression was significantly increased in TC and TR compared to the TM (Figure 3B). We also measured higher NGF levels in TR (vs. TC and TM; Figure 3B). Overall, the results of the expression analysis based on the 5-ALA FGS approach indicate that the tumor margins are characterized by low levels of KDM5C, HIF1A, p75NTR, and NGF, whereas the tumor border regions (TR) are significantly enriched for these markers, and, in line with the highly hypoxic features of the tumor core, it is mainly characterized by increased HIF1A and p75NTR expression.

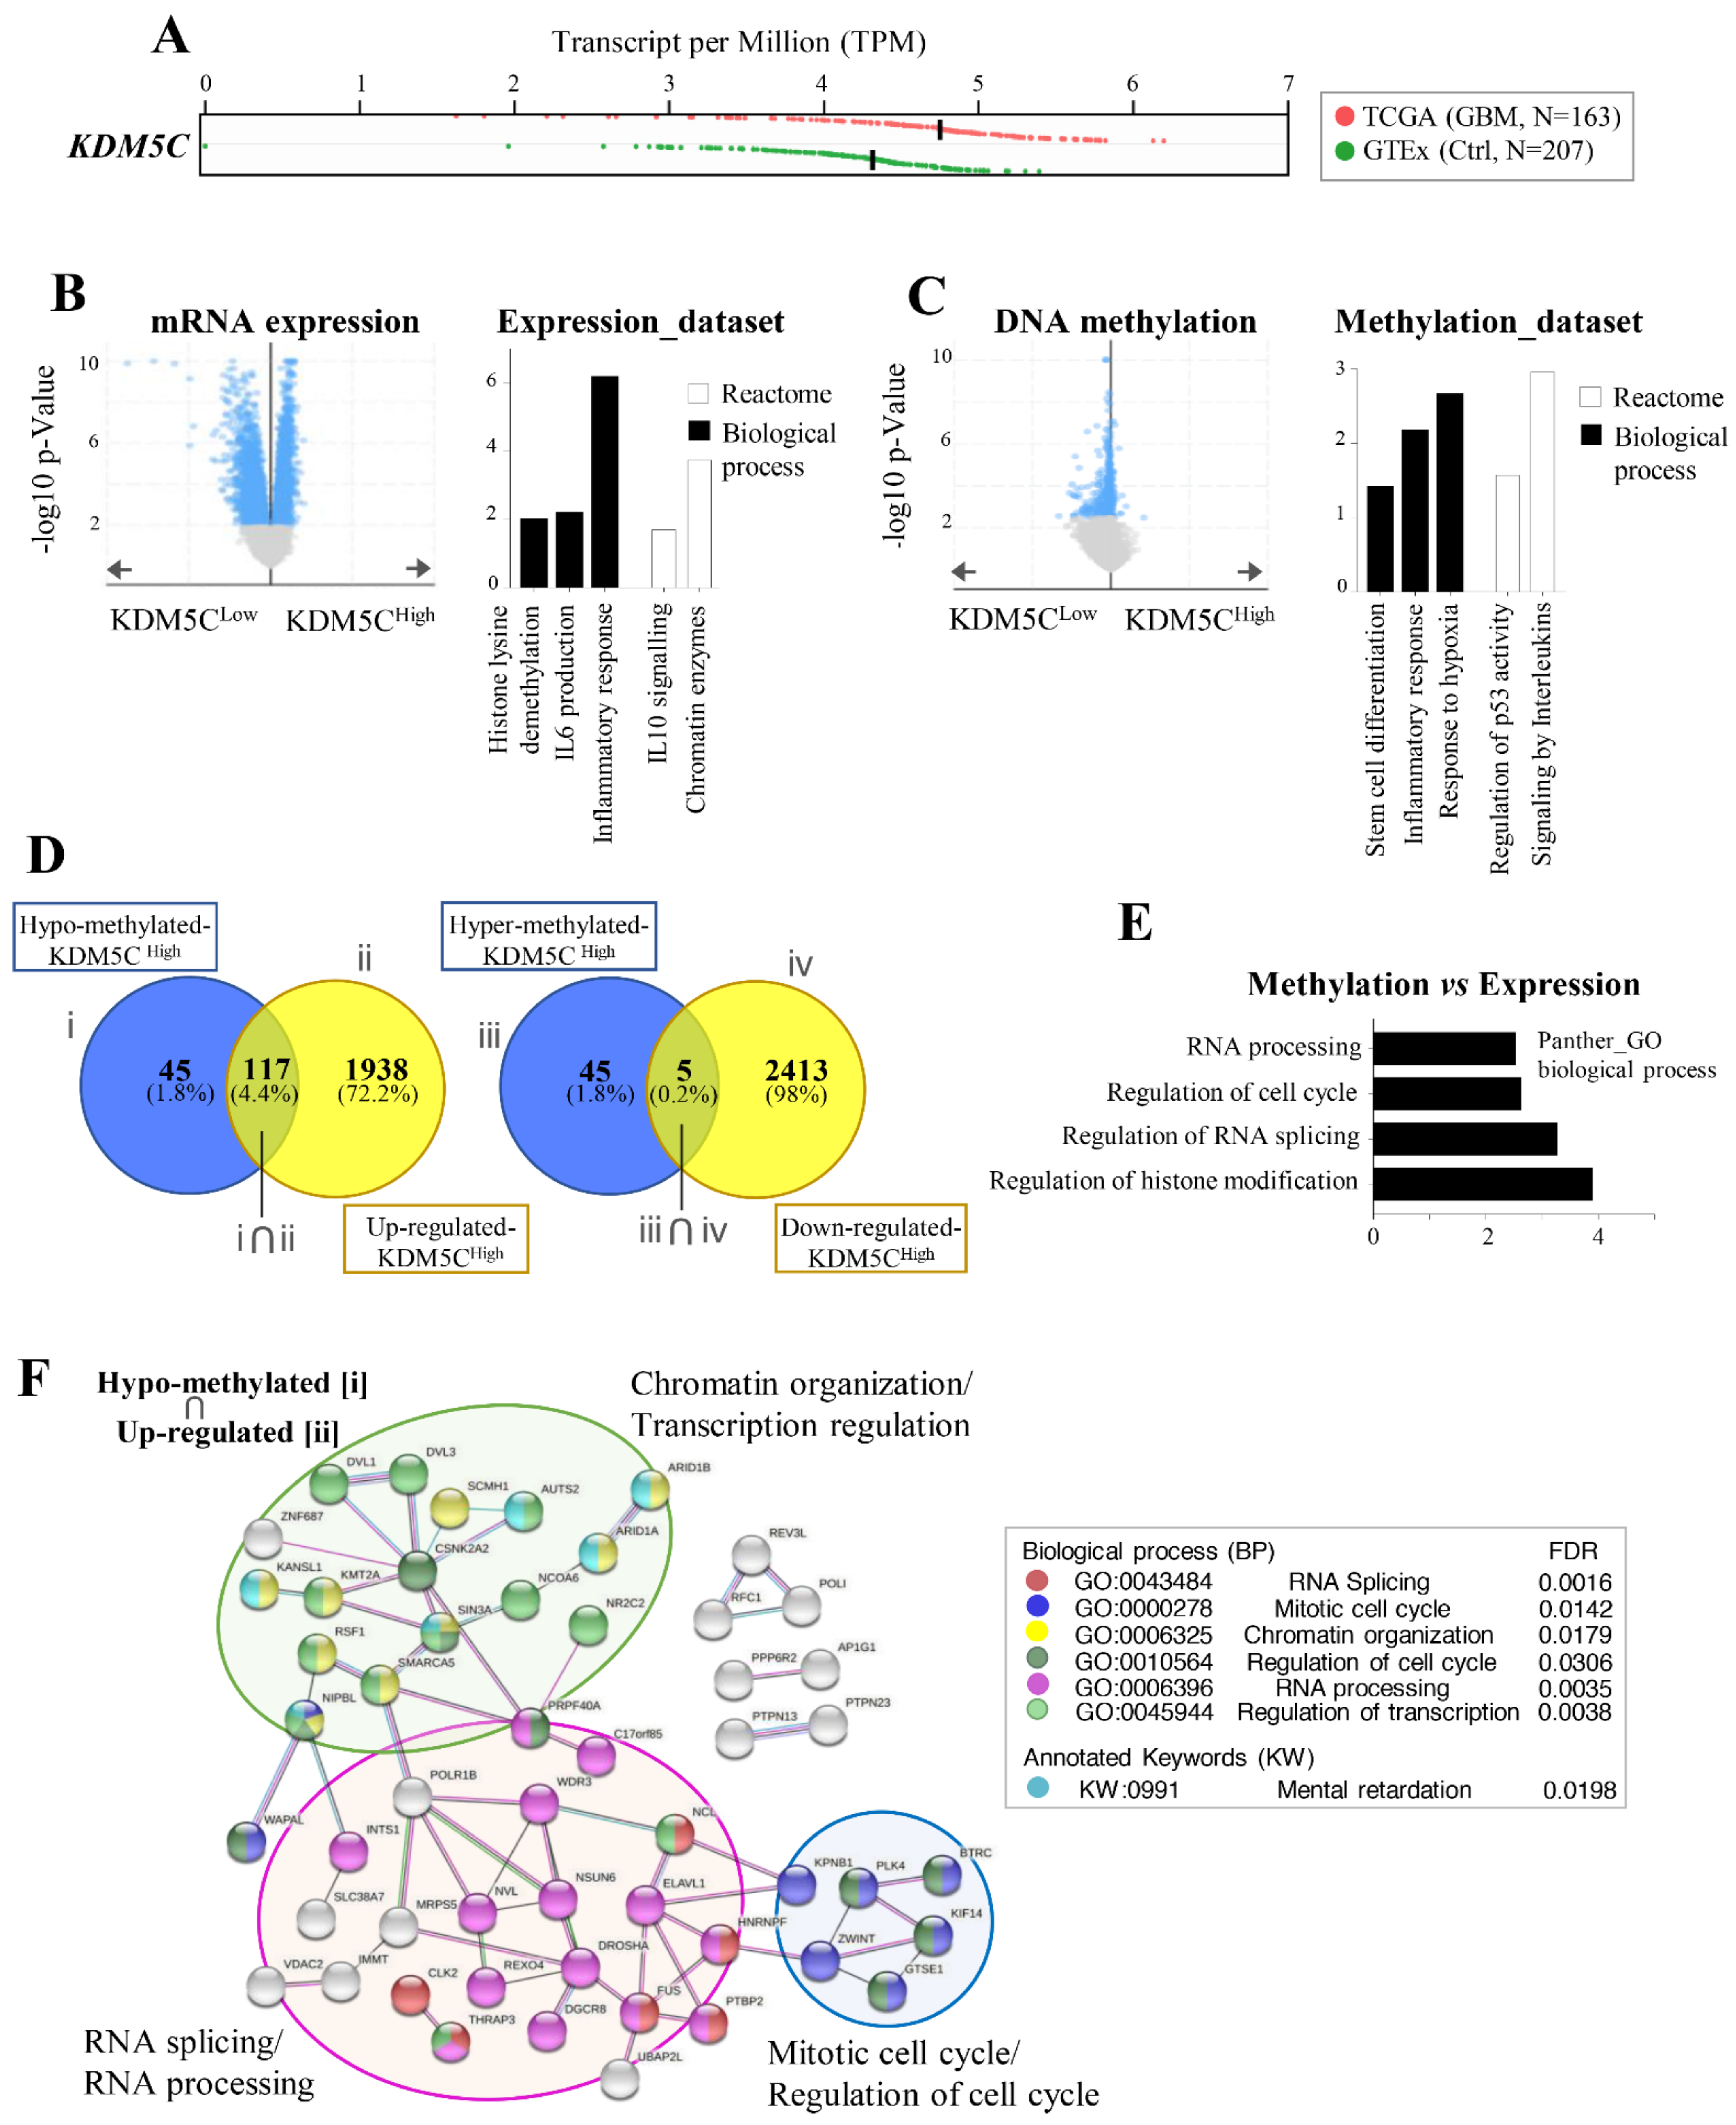
2.5. GBMs Expressing High or Low KDM5C Display Markedly Different Expression and Methylation Patterns

Prompted by the evidence of the highly variable expression of KDM5C in GBM patients and hypothesizing that such heterogeneity might result in distinct tumor subtypes having peculiar tumorigenic features, we took advantage of public expression and methylation data available from The Cancer Genome Atlas (TCGA; GBM cohort). As the expression data from healthy controls for GBM are missing in TCGA, we used RNA-Seq data from post-mortem brains in GTeX to verify that KDM5C is indeed overexpressed in tumor samples (Figure 4A). Then, using cBioportal, we created two subgroups of samples according to the KDM5C expression levels (see Supplementary Methods). No differences in the clinical features, including the probability of overall survival (Figure S3A), were found between the two subgroups. Moreover, differential mRNA expression and methylation were assessed between them (Figure 4B,C). As evident in Figure 4B,C (left panels), the two tumor subgroups largely differ in terms of gene expression and methylation. Interestingly, Gene Ontology and the pathway analysis on differentially expressed genes revealed the enrichment of inflammatory-related, as well as of chromatin remodeling, processes (Figure 4B, right panel). Similarly, the analysis of differentially methylated genes indicated “stem cell differentiation”, “hypoxia”, “p53 signaling”, and “inflammation” as the most relevant processes and/or pathway affected (Figure 4C, right panel).
Finally, classifying the genes altered between KDM5CLow and KDM5CHigh according to the consistency between the methylation and expression values, we focused on the two clusters of genes characterized by hypomethylation and overexpression (Figure 4D, left panel), as well as by hypermethylation and downregulation (Figure 4D, right panel). In particular, using this approach, we identified 117 genes hypomethylated (and overexpressed) in KDM5CHigh tumor samples and only five genes showing the opposite trend (Figure 4D). Interestingly, using the Panther classification system (over-representation test), we observed that the genes consistently regulated by methylation changes belong to “RNA processing/splicing”, “chromatin remodeling”, and the “cell cycle” (Figure 4E). Moreover, when analyzing the potential interactions occurring among the related proteins (by STRING), we found an interesting network, including 51 interacting proteins among these gene products, as highlighted in Figure 4F, with significant enrichment in Chromatin organization (GO:0006325), Regulation of transcription (GO:0045944), RNA splicing (GO:0043484), RNA processing (GO:0006396), Mitotic cell cycle (GO:0000278), and Regulation of cell cycle (GO:0010564). Among these genes, 90% (46/51) are implicated in cancer (Table S2), including seven involved in glioblastoma pathogenesis, such as Polypyrimidine tract binding protein 2 (PTBP2), encoding a splicing factor aberrantly overexpressed in GBM [45] and NOP2/Sun RNA methyltransferase 6 (NSUN6) encoding the RNA 5-methyl cytosine (5mC) transferase that regulates the glioblastoma response to temozolomide [46]. Surprisingly, 33% of them (17/51) are genes mutated in children with neurodevelopmental disorders (NDDs; Table S2), including the Activator of transcription and developmental regulator AUTS2 (AUTS2; MIM 607270) [47], SWI/SNF-related matrix-associated actin-dependent regulator of chromatin subfamily A member 5 (SMARCA5, MIM 603375) [48], KAT8 regulatory NSL complex subunit 1 (KANSL1; MIM 612452) [49], and Lysine methyltransferase 2A (KMT2A; MIM 159555) [50] that are NDD chromatin remodeling genes (KW:0991; Figure 4F; Table S2) as KDM5C [29,31].

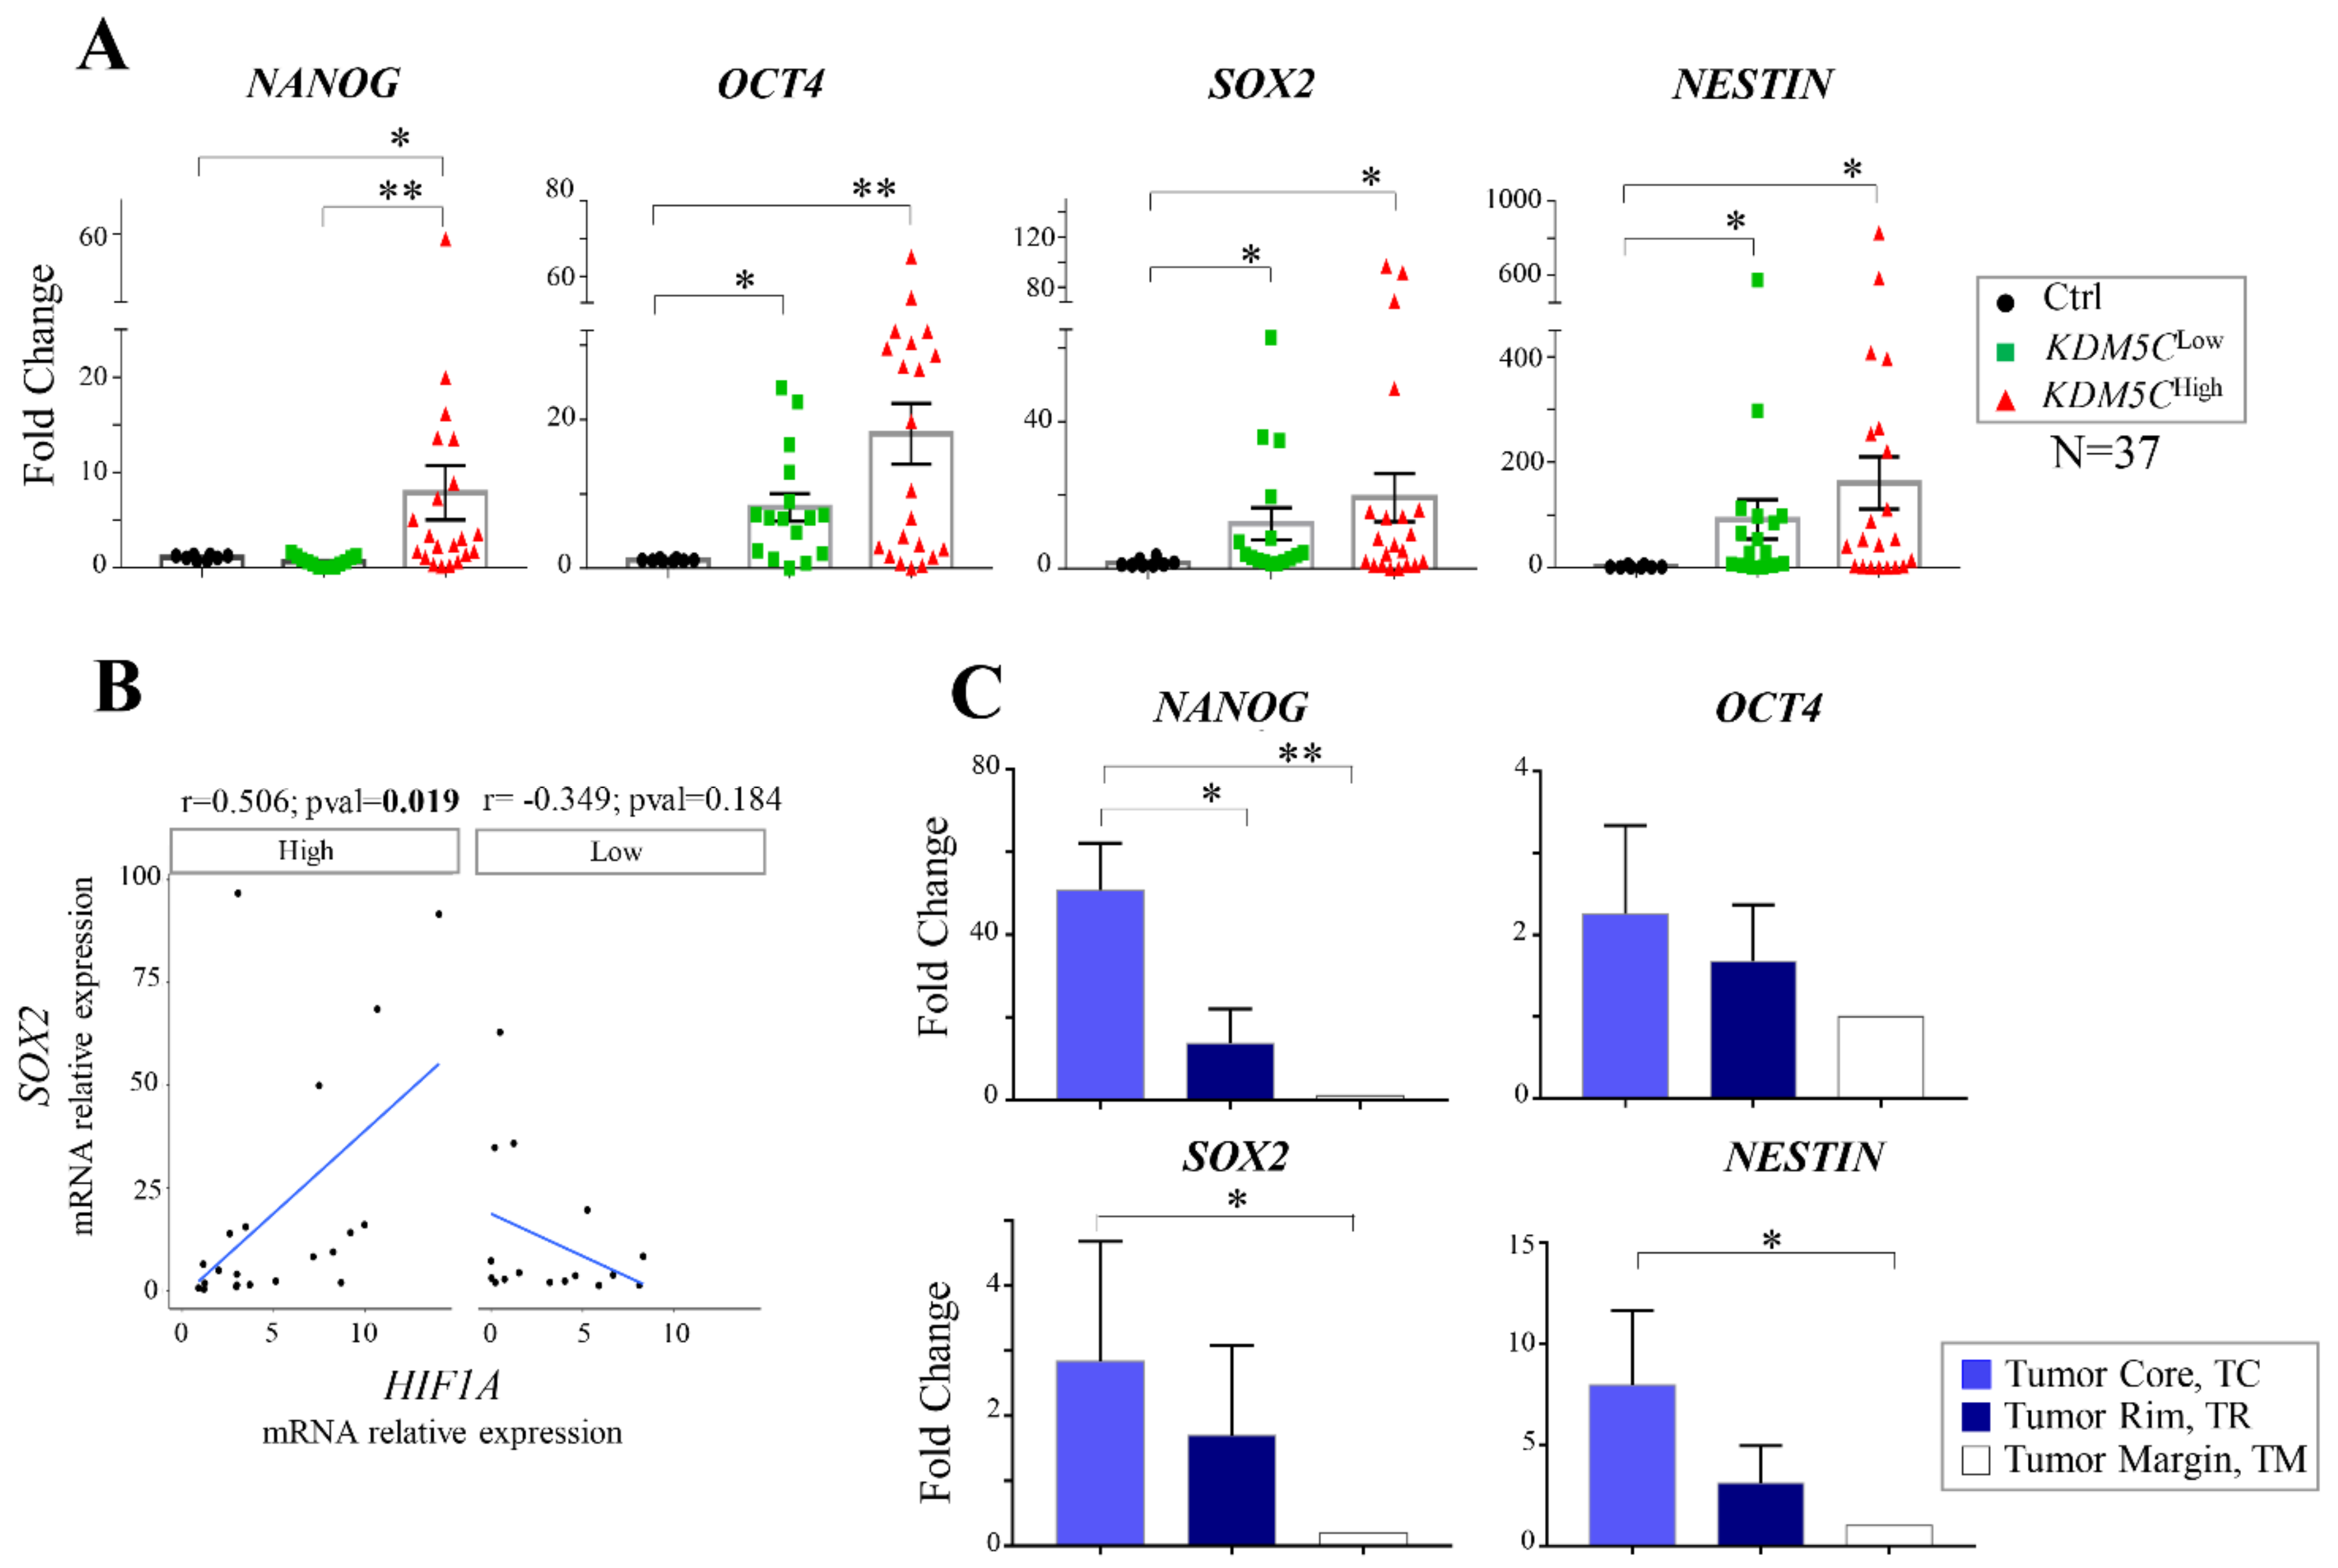
2.6. Analysis of Stem Cell-Associated Genes Expression in the GBM Cohorts

A growing body of evidence indicates that GBM may be generated from stem cell-like tumor cells (GSCs), sharing many properties with those of neural stem cells [51]. Our analysis of differentially methylated genes in the KDM5CHigh and KDM5CLow TCGA subgroups indicated “stem cell differentiation” as one of the top-ranked pathways (Reactome). Hence, to investigate the potential correlation between stem cell-derived genetic signatures and KDM5C expression, we measured—in our cohort of GBM patients—the expression levels of four GBM stemness markers: the transcription factor genes NANOG homeobox (NANOG), organic cation/carnitine transporter 4 (OCT4), and sex-determining region Y box 2 (SOX2) and the neuroectodermal marker NESTIN [52]. Interestingly, we observed a significant overexpression of OCT4, SOX2, and NESTIN in both tumor KDM5C subgroups compared to the control samples. Surprisingly, NANOG was largely overexpressed only in KDM5CHigh patients compared both to KDM5CLow and healthy groups (Figure 5A).
Searching for the potential correlation between the stemness and hypoxia markers, we found a significant positive trend between SOX2 and HIF1A only in KDM5CHigh patients (Figure 5B). Taken into consideration the clinical characteristics of GBM patients, we expanded our analysis by exploring the potential correlation with specific stemness marker profiling. Noteworthy, the two KDM5C subgroups showed significant changes in NANOG expression in the subset of patients without epilepsy (Figure S3B) or with the wild-type IDH1/2 genotype (Figure S3C) or with MGMT methylation (Figure S3D), while significant OCT4 change was found in the subset of patients with the wild-type IDH1/2 genotype (Figure S3E). These results, together with the KDM5C-associated methylation profile of “stem cell differentiation” genes—observed in the larger and independent TCGA sample cohorts (Figure 4C)—corroborate the finding that GBM tumors are enriched in stem cell markers compared to the healthy tissue. These data shed light on a distinctive signature marked by a high co-expression of HIF1A-KDM5C-NANOG that could help to explain differences in the clinical phenotype.
Moving to 5-ALA FGS tissues, we detected a high level of NANOG, as well as of SOX2 and NESTIN in the TC region compared with the TR and TM regions (Figure 5C). Based on this evidence, we therefore hypothesize that the three TMEs display distinctive stem cell-derived signatures that may depend on the heterogeneous differentiation stage of tumor cells whose further characterization could validate their prognostic values.

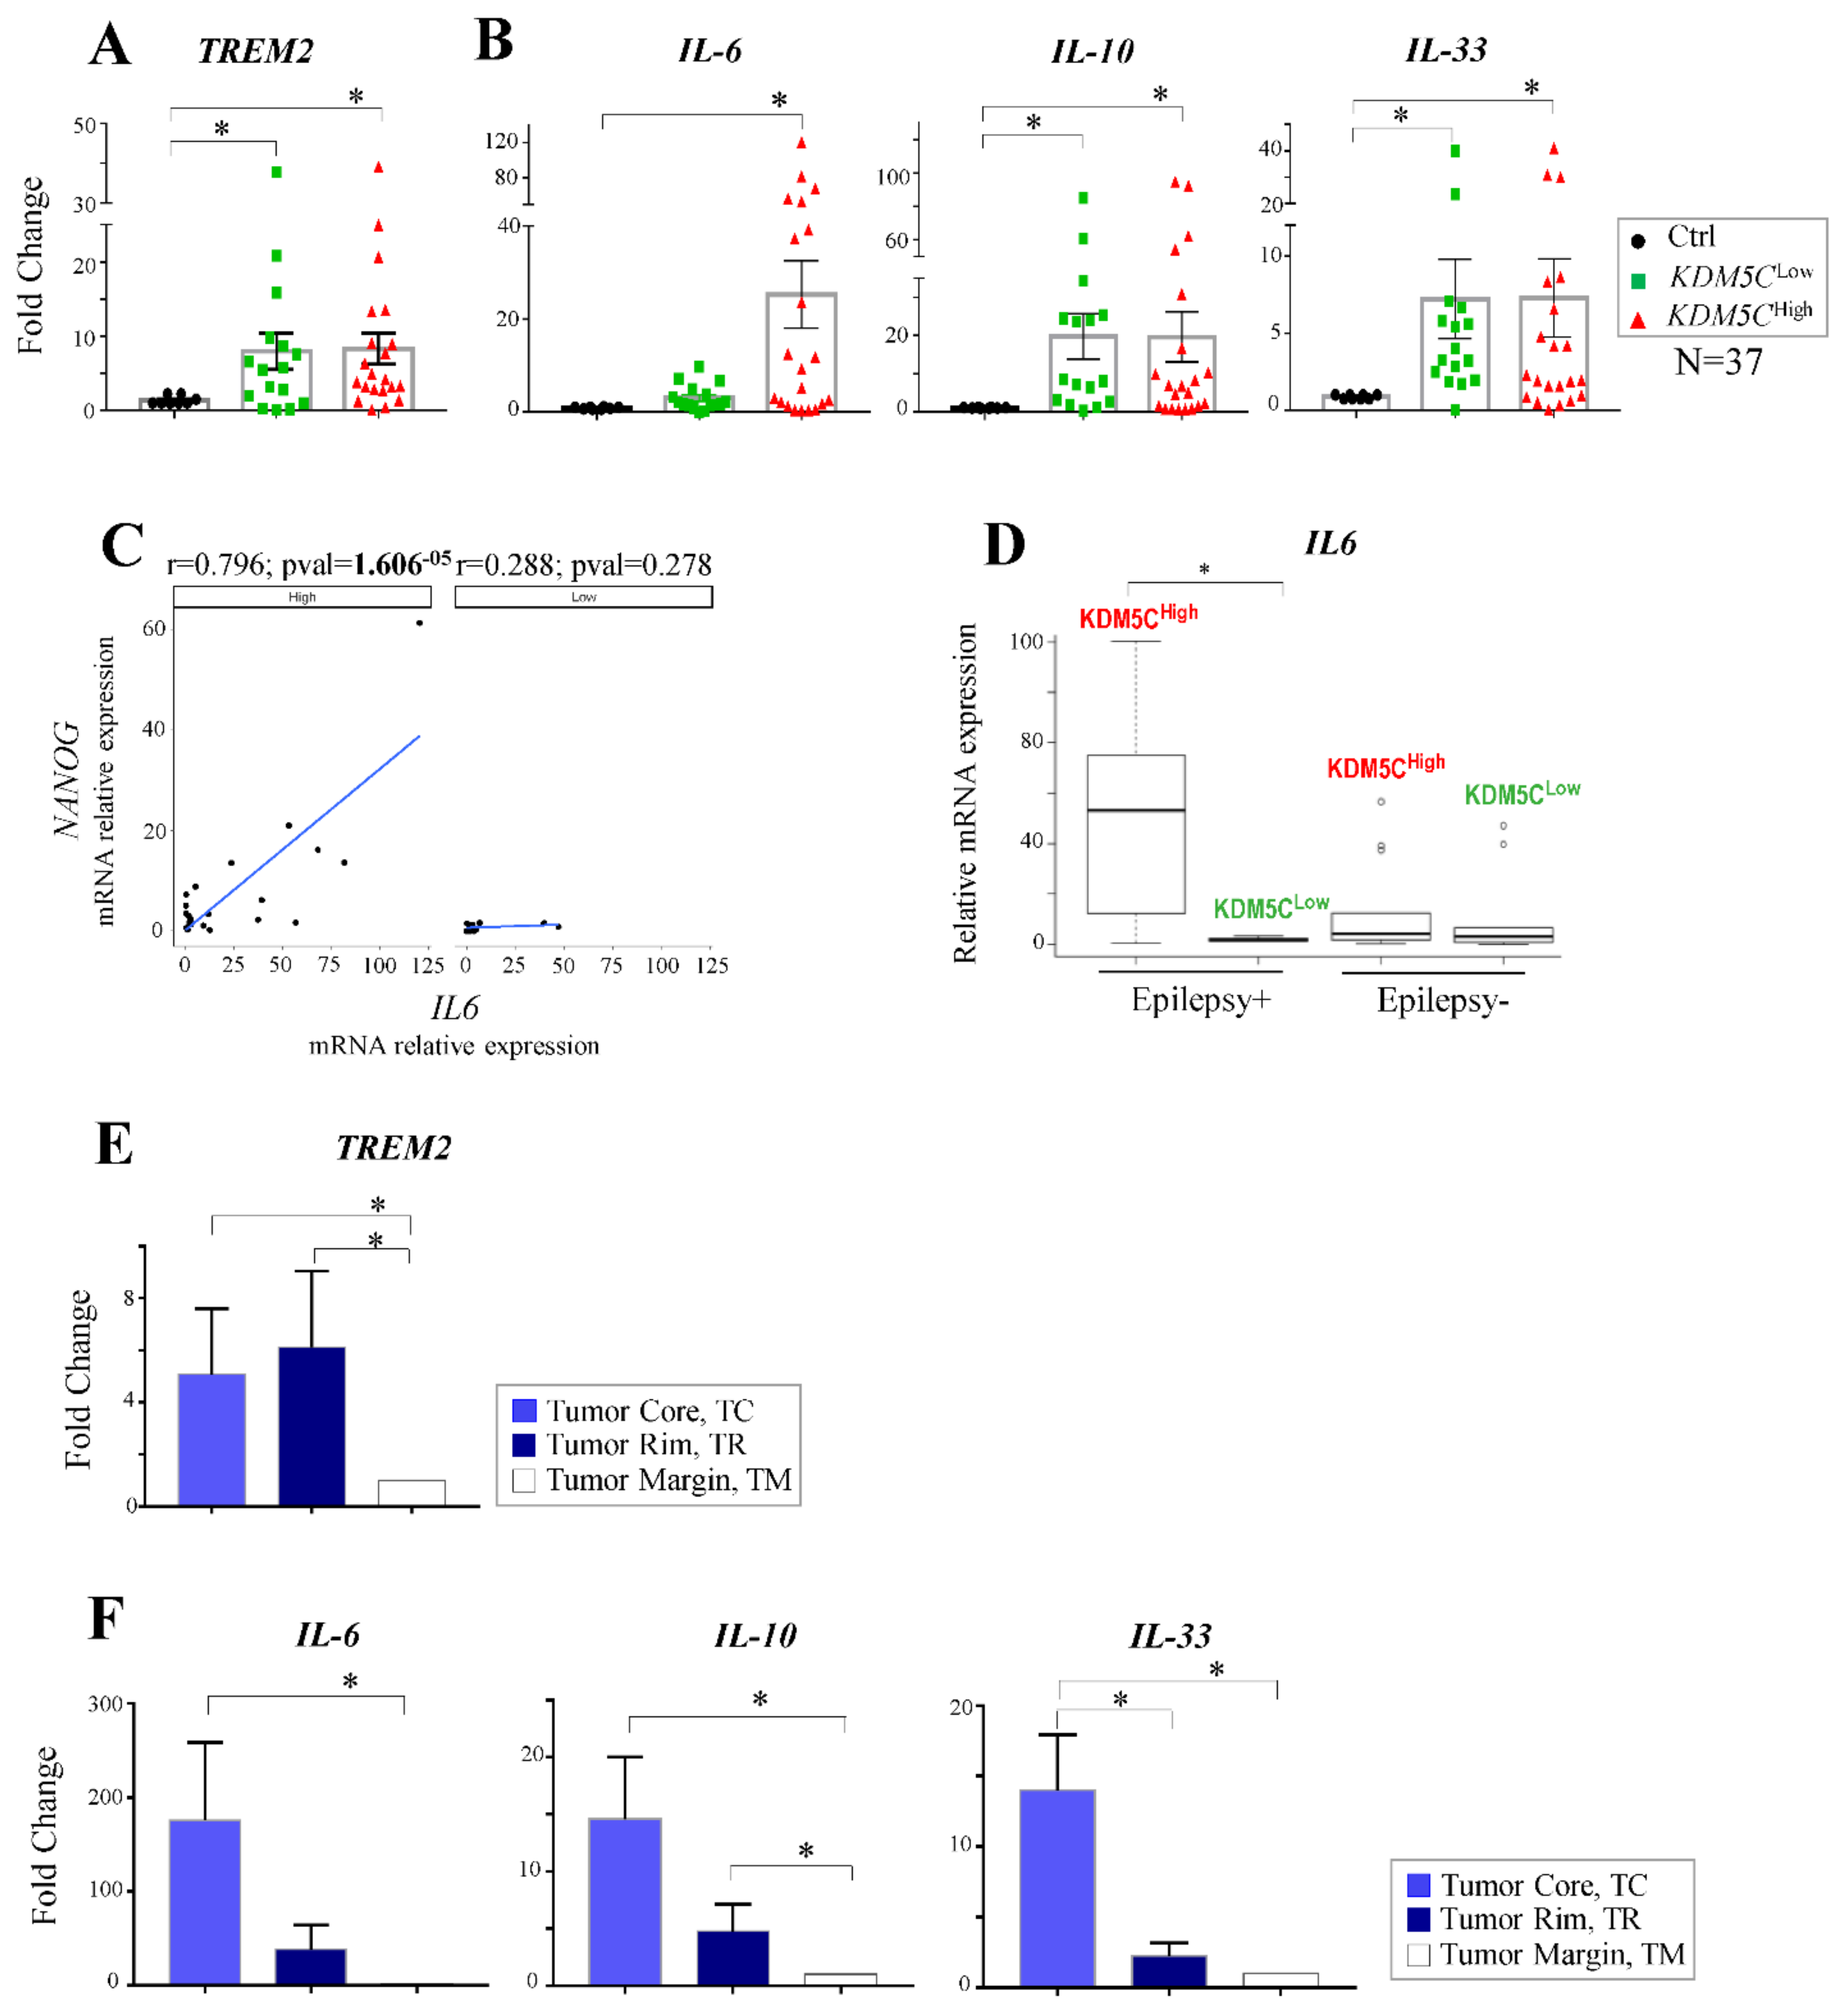
2.7. Expression Profiles of Tumor Progression Markers and Inflammatory Cytokines in GBM Samples
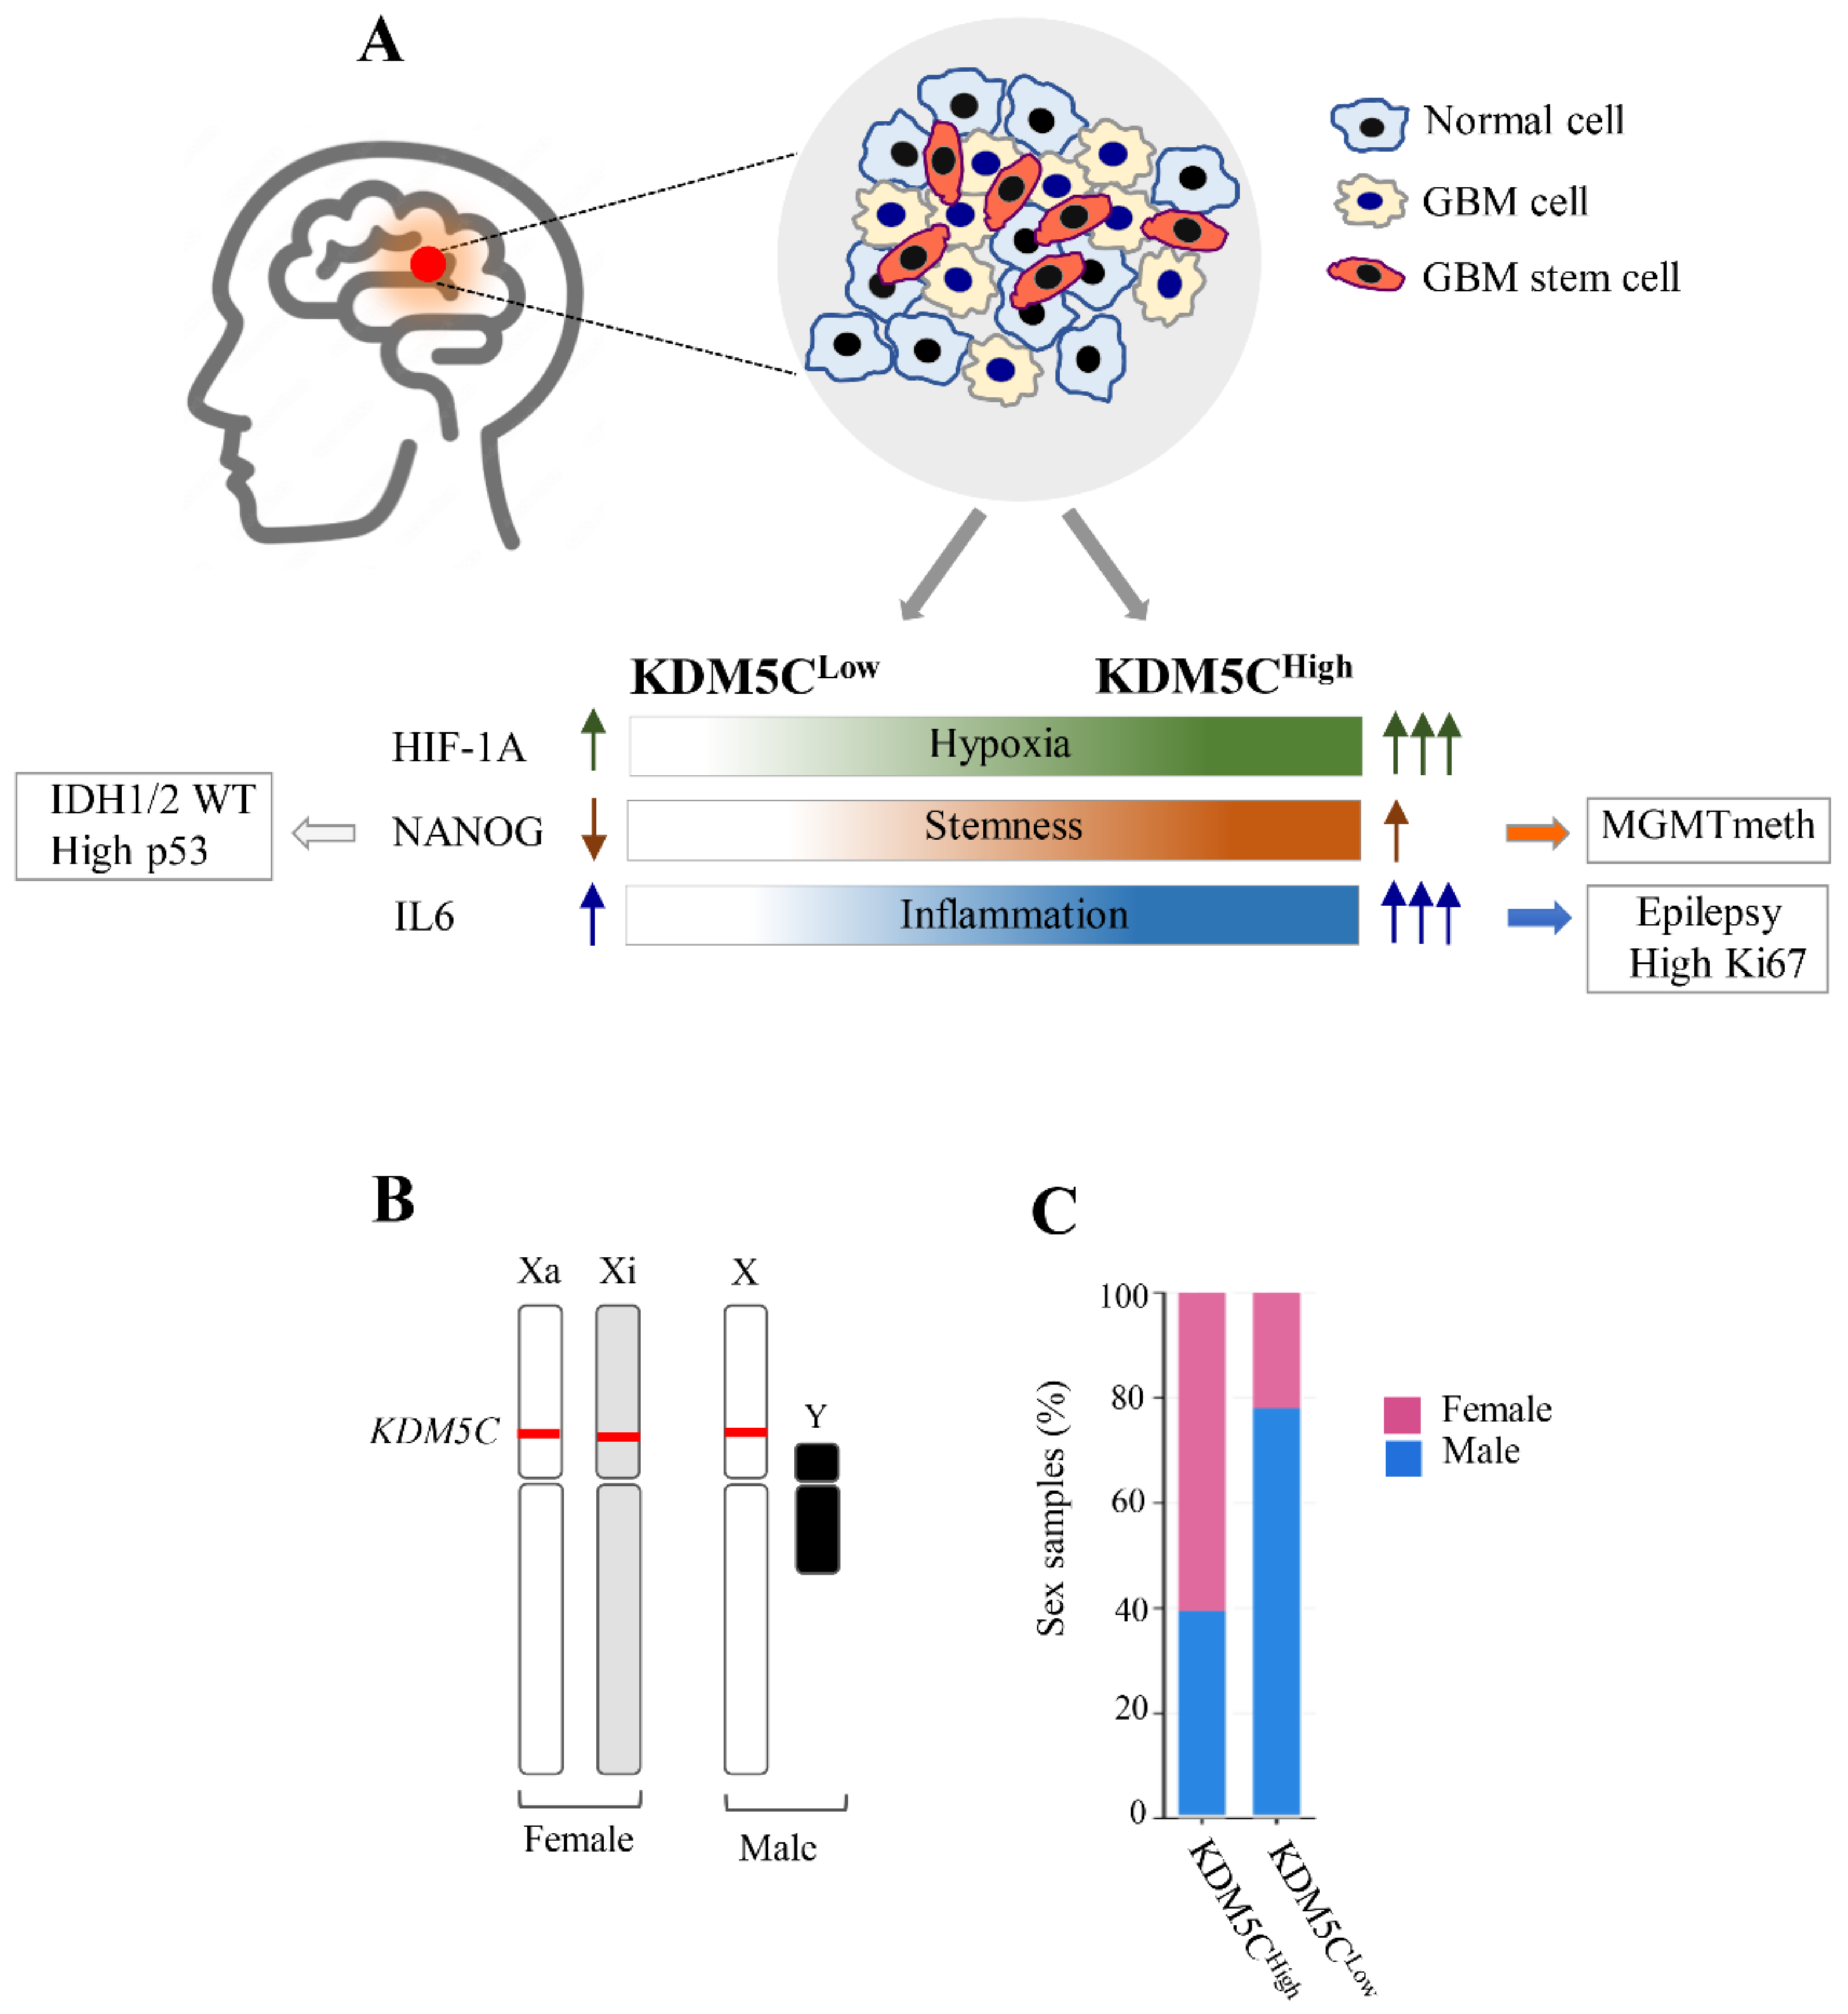
Since p53 expression has been postulated to be modulated by KDM5C (e.g., gastric cancer cell lines and gastric tumors) [10] and “p53 signaling” ranked among the top Reactome pathways enriched for differentially methylated genes between the KDM5CHigh and KDM5CLow subgroups (TCGA), we quantified p53 by immunohistochemistry in the biopsies of the entire cohort of tumor samples. The tumor samples were labeled as “strong”, “moderate”, “weak”, or “negative”, according to the p53 protein levels [53]. Interestingly, we found that the majority of the GBM samples having a “strong” p53 signal belonging to the KDM5CHigh subgroup (Figure S4A), in line with the literature data on gastric cancer [10]. Noteworthy, a strong immunoreactivity signal was found in most patients of the KDM5CHigh subgroup with the earlier onset of GBM (median age at 48; Figure S4B). However, unexpectedly, the only p53-negative patients were found in the same tumor subgroup (Figure S4A). By the RT-PCR assay, an upregulation of the TP53 transcript was found in the KDM5CLow and KDM5CHigh cohorts (Figure S4C), as well as in CoCl2-treated T98G cells (Figure S4D) and in the TC region of 5-ALA FGS tissues (Figure S4E). Although it is still unknown, the molecular mechanism linking KDM5C to p53, our data highlight the expression of high levels of the p53 protein strongly associated with an adverse outcome in GBM in tumor samples presenting high levels of KDM5C.
Next, given the enrichment of genes differentially methylated belonging to the Reactome pathway “inflammation”, we measured the gene expression of Triggering Receptor Expressed on Myeloid cells-2 (TREM2), a microglia surface receptor involved in neuroinflammation that is overexpressed in the glioma and associated with tumor progression [54,55]. A pronounced increase of TREM2 was detected in both GBM subgroups compared to the control tissues (Figure 6A). Furthermore, we measured the expression of the genes encoding proinflammatory cytokines Interleukin-6 (IL6), Interleukin-10 (IL10), and Interleukin-33 (IL33), associated with increased cell proliferation and tumorigenesis in GBM [56,57,58]. In line with the literature data [56,57,58], IL10 and IL33 were overexpressed in the entire cohort of GBM patients compared to the healthy samples (Figure 6B). However, IL6 was robustly induced only in the KDM5CHigh samples (Figure 6B), and interestingly, it showed a significant positive correlation with NANOG only in this tumor subtype (Figure 6C). Interestingly, exploring the clinical features of GBM patients, we found a significant change in IL6 expression between the two KDM5C subgroups with epilepsy (Figure 6D). Moreover, measuring the TREM2 expression and the inflammatory cytokine genes in the 5-ALA FGS tissues, we found that their levels are higher in TC areas compared to the TR and TM ones (Figure 6E,F), further corroborating the previous findings about the role of the inflammatory response in GBM. However, our data highlight how these molecular features of such a tumorigenesis-related process vary according to the surrounding TMEs in the context of GBM.

3. Discussion

The present work evaluated for the first time the association between alterations in the levels of the chromatin-oxygen sensor gene KDM5C and GBM pathogenesis. Based on the expression profile data in GBM tissues and the Cancer Genome Atlas (TCGA) database, we stratified GBM patients into two informative subtypes displaying high- and low-KDM5C levels. By an experimental approach mainly based on expression data, we revealed distinctive molecular profiles for hypoxia, stemness, and neuroinflammation markers. Although this somehow complicates the interpretation of our results, our study supports the hypothesis that diverse pathogenic mechanisms are implicated in the two subgroups.
Interestingly, we found a co-overexpression of KDM5C and the tumor prognostic genes HIF1A, p75 and survivin (alias BIRC5), involved in hypoxia-mediated mechanisms, as aggressiveness and a poor therapeutic response. HIF1A encodes the oxygen-regulated transcription factor Hif-1α that controls a number of pathways involved in GBM aggressiveness [34], whose overexpression was observed in GBM patients with poor prognosis and low sensitivity to chemotherapy [37]. Very importantly, hypoxia-induced Hif-1α stabilization is mediated by increased levels of p75NTR, a marker of aggressiveness where the inhibition reduces migration, invasion, and stemness in GBM [39]. In turn, Hif-1α cooperates to regulate survivin expression, whose overexpression was negatively associated with the overall survival in GBM patients and positively associated with hypoxia and stemness [59]. Related to these previous findings, our data corroborate the strong interplay between p75NTR and Hif-1α and between Hif-1α and Survivin in GBM and, above all, suggest that the p75NTR–HIF1A–KDM5C–survivin axis could be a new oncogenic hypoxia-mediated gene target with high therapeutic potential. Remarkably, as a consequence of KDM5C upregulation, a marked BDNF repression was found in the hypoxia condition. Since the hypoxia-mediated suppression of BDNF has been associated with neuronal loss and spatial memory impairment [60] and GBM patients frequently suffer cognitive deficits, including problems with attention and memory, we therefore conclude that BDNF decrease can contribute to the manifestation of these clinical signs in GBM patients. On the contrary, high BDNF acts on stem cells, promoting malignant progression [61].
It is important to highlight that hypoxia exerts pleiotropic effects in GBM as cell reprogramming towards a stem cell phenotype associated with high levels of stemness markers and activation of the inflammatory response with high levels of proinflammatory mediators [62]. According to previous findings, our study shows that the stemness genes OCT4, SOX2, and NESTIN are highly expressed in both the GBM sub-cohorts, but surprisingly, we observed that NANOG is overexpressed only in the KDM5CHigh subgroup compared both to KDM5CLow and healthy control. Since it has been reported that NANOG expression is controlled by Hif-1α and that they cooperate, promoting self-renewal in breast cancer stem cells [63], we therefore hypothesize that the GBM subgroup with HIF1A-KDM5C hyperactivity has a distinctive stemness expression signature. These findings could explain, at least in part, the peculiar intratumoral GBM heterogeneity, frequently characterized by a variability in stem-like cell composition, a feature that correlates with a varying degree of invasion capacity, resistance to conventional treatments, and tumor relapse.
Secondary inflammatory changes are frequently associated with tumor hypoxia by establishing a particular condition called “inflammatory hypoxia” [64]. Very importantly, our molecular analysis revealed high levels of TREM2, IL10, and IL-33 in the KDM5C subgroups corroborating the critical role of these inflammatory mediators in GBM. However, only in KDM5CHigh samples, we detected the IL6 overexpression coupled with a positive correlation with the NANOG levels. These results further differentiate, from a molecular point of view, the two GBM subgroups, assigning a specific IL6-NANOG signature to the KDM5CHigh. Since IL6 overexpression is induced by hypoxia [65], and as IL6 may strongly induce NANOG expression and promote proliferation and stemness in other tumors [66,67,68], the co-expression of IL6-NANOG likely represents a hypoxia-induced module, which appears as a distinctive feature of the KDM5CHigh GBM phenotype. Nevertheless, our results further emphasize TREM2 as a GBM biomarker, as recently reported [69].
By extending our analysis to tumor suppressor p53, whose expression associates with the pathological grade of glioma [70], a strong immunoreactivity signal was found in most patients of the KDM5CHigh sub-cohort with an earlier onset of GBM. This finding may emphasize the promising use of p53 expression as an early predictive GBM marker in the KDM5CHigh sub-cohort. Very importantly, the finding that GBM samples (TCGA) with high levels of KDM5C display DNA methylation changes mainly affecting genes involved in the hypoxia response, stem cell differentiation, inflammation, and p53 signaling further corroborates the role of KDM5C in GBM etiology and/or progression.
As proven by several reports, aberrant DNA methylation and/or histone modifications can disrupt the correct transcriptional control of clinically relevant genes and trigger malignant cellular transformation [71]. We therefore propose that, in an inflammatory-hypoxic microenvironment marked by high levels of HIF1A-KDM5C-IL6, tumor cells may dedifferentiate via a survivin-dependent pathway and acquire a particular stem-like phenotype marked by a high level of NANOG expression and associated, in turn, with high p53 levels (Figure 7A). Remarkably, taken into consideration the clinical features, the KDM5CHigh subgroup showed an interesting correlation between the epilepsy outcome and high co-expression of Ki67 and IL6 (Figure 7A). Given the implication of KDM5C in NDDs with a seizure [26,29], we believe that the identification of these KDM5C-related signatures constitutes a step forward to understand the GBM-related epileptic phenotype. Indeed, Ki67 overexpression was proposed as a significant predictor of poor seizure control in GBM patients [72], while the activation of proinflammatory cytokines in response to inadequate homeostasis in the GBM tumor tissues was suggested as seizure susceptibility factors [73]. Since GBM-related seizures are often refractory to antiepileptic treatments, the characterization of these pathogenic players could open a new field of investigation for clinical treatment. Furthermore, other interesting correlations were found between MGMT methylation and high NANOG in KDM5CHigh patients and, likewise, between the WT IDH1/2 genotype with high p53 and low NANOG and OCT4. Although the functional relationships between these GBM tumor markers are not well-known in the literature, the identification of these gene expression profiles together with the analysis of the clinical features could contribute to shed light on the multiple pathogenic mechanisms involved and on the substantial heterogeneity of the GBM phenotype. On the other hand, the moniker ‘multiforme’ derives from the first histopathological description characterized by the presence of heterogeneous cell populations, where coexist functional subdomains within a single tumor mass [74]. Related to this consideration, our molecular study in the 5-ALA FGS tumor samples revealed a peculiar expression profile across the microenvironmental cells residing in different tumor niches with a higher expression of the stem cell markers in the tumor core and of KDM5C in the tumor rim. Approved in Europe and in the United States, the prodrug 5-ALA induces tumor fluorescence with high specificity and sensitivity across all histopathologic grades for malignant high-grade glioma (with a probability close to 100%) facilitating the sampling of the core region of the tumor, the infiltrating front, and the healthy tissue [75]. Machine learning tools applied to 5-ALA fluorescence data analysis combined with molecular profiles could further characterize the GBM phenotypes.
The association with somatic mutations in cancer-related genes remains to be explored in our GBM cohorts, both bulk and 5-ALA FGS tumors. Indeed, low KDM5C expression could be caused by mutations in KDM5C or in its positive regulatory genes, while mutations in negative regulatory genes could stimulate high KDM5C expression.
Another genetic phenomenon contributing to generate KDM5C expression variability is sex disparity. Since this gene is located on X chromosome and escapes X-inactivation (Xi escaper) in females [76] (Figure 7B), a gene dosing effect with two copies expressed in females and one copy expressed in males could contribute to this scenario. Interestingly, the GBM TCGA analysis showed a peculiar sex-related distribution with a female prevalence in the KDM5CHigh vs. KDM5CLow subgroups (Figure 7C). Further studies in larger patient collections can elucidate the functional relationship between the levels of this Xi escaper gene and sex disparity in GBM outcome and therapy. Even though the observed KDM5C expression variability could be caused by these factors, our study represents a significant step forward the understanding of the molecular determinants at the basis of GBM pathogenesis, contributing to better defining the stem cell- and inflammatory hypoxia-based stratification of GBM. Noteworthy, the discovery of specific inhibitors or modulators of KDM5C will prospect the identification of new GBM therapies with translational application in personalized treatments. In this regard, the discovery of potent histone demethylase inhibitors across the JMJ family abled to inhibit glioma cell proliferation, such as GSK-J1/J4, encourages the design of new small-molecule inhibitors with selective pharmacological intervention against KDM5C [77,78,79]. Finally, since KDM5C specifically regulates several hypoxia-related genes and targets hypoxia-mediated mechanisms are considered an attractive approach to improve the therapy outcome in GBM [34], the discovery of new hypoxia-related signatures could accelerate the identification of more effective mechanism-based therapies and the development of predictive biomarkers, potentially linked to tumor-related epilepsy.

4. Materials and Methods

Patients and clinical data. A total of 37 patients with histopathologically confirmed glioblastoma were included in this study. These patients, admitted to A.O.R.N. S. Anna and S. Sebastiano Hospital (Caserta, Italy), were 20 males and 17 females, ranging in age from 34 to 78 years (Table 1 and Table S3). Tumor characteristics, including lesion sites; treatment strategy; molecular analysis of the tumor markers Ki-67, p53, MGMT methylation, and survival; and mortality, were retrospectively examined (Table 1 and Table S3). Epilepsy was reported in 13 patients (35%). Patients received radiotherapy (75.6%) and chemotherapy (92%). Isocitrate dehydrogenase 1/2 (IDH1/2) mutation analysis was performed with 62.2% of patients showing IDH1/2 mutations compared to 37.8% with the wild-type allele (Table 1 and Table S3). The study was reviewed and approved by the Ethics Committee and Institutional Review Board of A.O.R.N. S. Anna and S. Sebastiano Hospital.
Clinical Samples. Tumor tissues were collected during neurosurgery at A.O.R.N. S. Anna and S. Sebastiano Hospital (Caserta, Italy). Immediately after surgical excision, the tissues were immersed in liquid nitrogen and kept in liquid nitrogen until use. We obtained the written informed consent from each participant before surgery. The Research Ethics Committee of Campania Nord (San Giuseppe Moscati-Avellino) approved the study protocol (Prot. 359 on date 15/02/20). The study was implemented in compliance with the ethical guidelines of the 1975 Declaration of Helsinki.
Fluorescence-guided surgery (FGS) using 5-aminolevulinic acid (5-ALA). Each patient received an oral dose of 5-ALA (20 mg/kg body weight) 2 h prior to the induction of anesthesia. During the tumor resection, 5-ALA-induced PpIX fluorescence and autofluorescence were visualized using a commercially available fluorescence operative microscope (OPMI, Pentero 800, Carl Zeiss, Oberkochen, Germany). Total microscopic tumor resection was performed with this fluorescence-guided method, combined with a standard navigation system (Medtronic StealthStation S7 Surgical Navigation system). The visualized fluorescence intensity was classified as described elsewhere [44]. Specifically, three grades of fluorescence intensity were identified: (i) a charcoal red PpIX fluorescence defined as strong fluorescence, a lack of red PpIX fluorescence, defined as non-fluorescence, and a pink or orange fluorescence was defined as vague fluorescence. The phenomenon of vague PpIX fluorescence was postulated as deriving from a merging of charcoal red PpIX fluorescence with green autofluorescence, resulting in a change of the fluorescence color spectrum to orange (500-nm low-pass filter) or light red (420- and 450-nm low-pass filters).
Cell culture and plasmid transfection. Human glioblastoma cell-line T98G cells (GBM-derived T98G) were obtained from ATCC. Cells were maintained in Dulbecco’s modified Eagle’s medium (DMEM) (Gibco, Carlsbad, CA, USA) supplemented with 10% fetal bovine serum (FBS; Gibco, Carlsbad, CA, USA), penicillin (100 units/mL; Gibco, Carlsbad, CA, USA), and streptomycin (100 μg/mL; Gibco, Carlsbad, CA, USA) in a humidified 5% (v/v) CO2 atmosphere and were routinely tested for mycoplasma contamination. The wild-type (WT) human KDM5C cDNA cloned in the pcDNA3.1 vector (pcDNA_KDM5C) was a gift of Charles Schwartz (Greenwood Genetic Center, Greenwood, SC, USA). pcDNA3.1 empty and pcDNA3.1_KDM5C plasmids were purified with a plasmid DNA kit (Qiagen, Venlo, Limburg, Belgium). For transfection experiments, empty pcDNA3.1 and pcDNA3.1_KDM5C plasmids were transiently transfected into T98G cells using Lipofectamine 2000 reagent (Invitrogen, Waltham, MA, USA). T98G cells (1 × 10⁶) were seeded overnight, and the mixture of each plasmid DNA (8 μg) and Lipofectamine 2000 diluted in Opti-MEM was added to the cells, and the cells were cultured for 48 h. All experiments were performed at least three times. The primers used are listed in Table S4.
Hypoxia treatment with cobalt chloride (CoCl2). Stock solution of 25 mM of cobalt chloride (CoCl2) was prepared in sterile distilled water and further diluted in the medium in order to obtain the final desired concentrations. T98G cells were treated with 50 μM CoCl2 and incubated for 24 h.

Supplementary Materials

The following supporting information can be downloaded at: https://0-www-mdpi-com.brum.beds.ac.uk/article/10.3390/ijms231810250/s1.

Author Contributions

D.D., experimental design, data analysis, and manuscript writing; L.V., experimental design and data curation; P.D.M., P.O., A.C., G.T., A.A., S.B., M.G., V.M., E.S. and I.D.M., clinical data; V.C., data analysis and curation, result interpretation, and manuscript editing; M.G.M., study conception, result interpretation, and manuscript writing; A.d.B., clinical data, study conception, and result interpretation. All authors have read and agreed to the published version of the manuscript.

Funding

This work was supported by Maria Rosaria Maglione Foundation Onlus grant to M.G.M (MRM#2020). The research activities of V.C. are funded by My First AIRC Grant (MFAG) Programme (grant no. 23453) and SATIN-POR CAMPANIA FESR 2014/2020. D.D. received a fellowship by Maria Rosaria Maglione Foundation Onlus as a tribute to Francesco Mazza.

Institutional Review Board Statement

The study was conducted in accordance with the Declaration of Helsinki and approved by The Research Ethics Committee of Campania Nord (San Giuseppe Moscati-Avellino; Prot. 359 on date 15 February 2020).

Informed Consent Statement

A.O.R.N. S. Anna and S. Sebastiano Hospital (Caserta, Italy) obtained informed consent from all subjects involved in the study.

Data Availability Statement

Publicly archived datasets analyzed: The Genotype Tissue Expression database (GTEx; https://gtexportal.org/home/; accessed on 10 March 2022). The Cancer Genome Atlas (TCGA) Consortium was retrieved from public repository cBioportal (https://www.cbioportal.org; accessed on 10 March 2022).

Acknowledgments

We would like to thank all the patients involved in this study for their generous participation. We thank Charles Schwartz (Greenwood Genetic Center, Greenwood, SC, USA) for kindly providing the pcDNA3.1_KDM5C construct and Rosita Di Palma for proof-reading the manuscript.

Conflicts of Interest

The authors declare no conflict of interest.

References

  1. Perry, A.; Wesseling, P. Histologic classification of gliomas. Handb. Clin. Neurol. 2016, 134, 71–95. [Google Scholar] [CrossRef] [PubMed]
  2. Hanif, F.; Muzaffar, K.; Perveen, K.; Malhi, S.M.; Simjee, S.U. Glioblastoma Multiforme: A Review of its Epidemiology and Pathogenesis through Clinical Presentation and Treatment. Asian Pac. J. Cancer Prev. 2017, 18, 3–9. [Google Scholar] [CrossRef] [PubMed]
  3. Belisario, D.C.; Kopecka, J.; Pasino, M.; Akman, M.; De Smaele, E.; Donadelli, M.; Riganti, C. Hypoxia Dictates Metabolic Rewiring of Tumors: Implications for Chemoresistance. Cells 2020, 9, 2598. [Google Scholar] [CrossRef] [PubMed]
  4. Tan, A.C.; Ashley, D.M.; López, G.Y.; Malinzak, M.; Friedman, H.S.; Khasraw, M. Management of glioblastoma: State of the art and future directions. CA Cancer J. Clin. 2020, 70, 299–312. [Google Scholar] [CrossRef]
  5. Bastola, S.; Pavlyukov, M.S.; Yamashita, D.; Ghosh, S.; Cho, H.; Kagaya, N.; Zhang, Z.; Minata, M.; Lee, Y.; Sadahiro, H.; et al. Glioma-initiating cells at tumor edge gain signals from tumor core cells to promote their malignancy. Nat. Commun. 2020, 11, 4660. [Google Scholar] [CrossRef]
  6. Ruano, Y.; Mollejo, M.; Ribalta, T.; Fiaño, C.; Camacho, F.I.; Gómez, E.; de Lope, A.R.; Hernández-Moneo, J.L.; Martínez, P.; Meléndez, B. Identification of novel candidate target genes in amplicons of Glioblastoma multiforme tumors detected by expression and CGH microarray profiling. Mol. Cancer 2006, 26, 5–39. [Google Scholar] [CrossRef]
  7. Phillips, H.S.; Kharbanda, S.; Chen, R.; Forrest, W.F.; Soriano, R.H.; Wu, T.D.; Misra, A.; Nigro, J.M.; Colman, H.; Soroceanu, L.; et al. Molecular subclasses of high-grade glioma predict prognosis, delineate a pattern of disease progression, and resemble stages in neurogenesis. Cancer Cell 2006, 9, 157–173. [Google Scholar] [CrossRef]
  8. Noushmehr, H.; Weisenberger, D.J.; Diefes, K.; Phillips, H.S.; Pujara, K.; Berman, B.P.; Pan, F.; Pelloski, C.E.; Sulman, E.P.; Bhat, K.P.; et al. Cancer Genome Atlas Research Network. Identification of a CpG island methylator phenotype that defines a distinct subgroup of glioma. Cancer Cell 2010, 17, 510–522. [Google Scholar] [CrossRef]
  9. Batie, M.; Rocha, S. JmjC histone demethylases act as chromatin oxygen sensors. Mol. Cell. Oncol. 2019, 6, 1608501. [Google Scholar] [CrossRef]
  10. Xu, L.; Wu, W.; Cheng, G.; Qian, M.; Hu, K.; Yin, G.; Wang, S. Enhancement of Proliferation and Invasion of Gastric Cancer Cell by KDM5C via Decrease in p53 Expression. Technol. Cancer Res. Treat. 2017, 16, 141–149. [Google Scholar] [CrossRef]
  11. Iwase, S.; Lan, F.; Bayliss, P.; de la Torre-Ubieta, L.; Huarte, M.; Qi, H.H.; Whetstine, J.R.; Bonni, A.; Roberts, T.M.; Shi, Y. The X-linked mental retardation gene SMCX/JARID1C defines a family of histone H3 lysine 4 demethylases. Cell 2007, 128, 1077–1088. [Google Scholar] [CrossRef]
  12. Tahiliani, M.; Mei, P.; Fang, R.; Leonor, T.; Rutenberg, M.; Shimizu, F.; Li, J.; Rao, A.; Shi, Y. The histone H3K4 demethylase SMCX links REST target genes to X-linked mental retardation. Nature 2007, 447, 601–605. [Google Scholar] [CrossRef]
  13. Højfeldt, J.W.; Agger, K.; Helin, K. Histone lysine demethylases as targets for anticancer therapy. Nat. Rev. Drug Discov. 2013, 12, 917–930. [Google Scholar] [CrossRef]
  14. Rondinelli, B.; Rosano, D.; Antonini, E.; Frenquelli, M.; Montanini, L.; Huang, D.; Segalla, S.; Yoshihara, K.; Amin, S.B.; Lazarevic, D.; et al. Histone demethylase JARID1C inactivation triggers genomic instability in sporadic renal cancer. J. Clin. Investig. 2016, 126, 4387. [Google Scholar] [CrossRef]
  15. Varela, I.; Tarpey, P.; Raine, K.; Huang, D.; Ong, C.K.; Stephens, P.; Davies, H.; Jones, D.; Lin, M.L.; Teague, J.; et al. Exome sequencing identifies frequent mutation of the SWI/SNF complex gene PBRM1 in renal carcinoma. Nature 2011, 469, 539–542. [Google Scholar] [CrossRef]
  16. Zhan, D.; Zhang, Y.; Xiao, P.; Zheng, X.; Ruan, M.; Zhang, J.; Chen, A.; Zou, Y.; Chen, Y.; Huang, G.; et al. Whole exome sequencing identifies novel mutations of epigenetic regulators in chemorefractory pediatric acute myeloid leukemia. Leuk. Res. 2018, 65, 20–24. [Google Scholar] [CrossRef]
  17. Lin, H.; Ma, N.; Zhao, L.; Yang, G.; Cao, B. KDM5c Promotes Colon Cancer Cell Proliferation Through the FBXW7-c-Jun Regulatory Axis. Front. Oncol. 2020, 10, 535449. [Google Scholar] [CrossRef]
  18. DeVaux, R.S.; Herschkowitz, J. Beyond DNA: The role of epigenetics in the premalignant progression of breast cancer. J. Mammary Gland. Biol. Neoplasia 2018, 23, 223–235. [Google Scholar] [CrossRef]
  19. Chen, X.; Loo, J.X.; Shi, X.; Xiong, W.; Guo, Y.; Ke, H.; Yang, M.; Jiang, Y.; Xia, S.; Zhao, M.; et al. E6 protein expressed by high-risk HPV activates super-enhancers of the EGFR and c-MET oncogenes by destabilizing the histone demethylase KDM5C. Cancer Res. 2018, 78, 1418–1430. [Google Scholar] [CrossRef]
  20. Stein, J.; Majores, M.; Rohde, M.; Lim, S.; Schneider, S.; Krappe, E.; Ellinger, J.; Dietel, M.; Stephan, C.; Jung, K.; et al. KDM5C is overexpressed in prostate cancer and is a prognostic marker for prostate-specific antigen-relapse following radical prostatectomy. Am. J. Pathol. 2014, 184, 2430–2437. [Google Scholar] [CrossRef]
  21. Chen, X.J.; Ren, A.Q.; Zheng, L.; Zheng, E.D. Predictive Value of KDM5C Alterations for Immune Checkpoint Inhibitors Treatment Outcomes in Patients with Cancer. Front. Immunol. 2021, 12, 664847. [Google Scholar] [CrossRef] [PubMed]
  22. Niu, X.; Zhang, T.; Liao, L.; Zhou, L.; Lindner, D.J.; Zhou, M.; Rini, B.; Yan, Q.; Yang, H. The von Hippel-Lindau tumor suppressor protein regulates gene expression and tumor growth through histone demethylase JARID1C. Oncogene 2012, 31, 776–786. [Google Scholar] [CrossRef]
  23. Zheng, Q.; Li, P.; Zhou, X.; Qiang, Y.; Fan, J.; Lin, Y.; Chen, Y.; Guo, J.; Wang, F.; Xue, H.; et al. Deficiency of the X-inactivation escaping gene KDM5C in clear cell renal cell carcinoma promotes tumorigenicity by reprogramming glycogen metabolism and inhibiting ferroptosis. Theranostics 2021, 11, 8674–8691. [Google Scholar] [CrossRef] [PubMed]
  24. Shen, H.F.; Zhang, W.J.; Huang, Y.; He, Y.H.; Hu, G.S.; Wang, L.; Peng, B.L.; Yi, J.; Li, T.T.; Rong, R.; et al. The Dual Function of KDM5C in Both Gene Transcriptional Activation and Repression Promotes Breast Cancer Cell Growth and Tumorigenesis. Adv. Sci. 2021, 8, 2004635. [Google Scholar] [CrossRef] [PubMed]
  25. Outchkourov, N.S.; Muiño, J.M.; Kaufmann, K.; van Ijcken, W.F.; Groot Koerkamp, M.J.; van Leenen, D.; de Graaf, P.; Holstege, F.C.; Grosveld, F.G.; Timmers, H.T. Balancing of histone H3K4 methylation states by the Kdm5c/SMCX histone demethylase modulates promoter and enhancer function. Cell Rep. 2013, 3, 1071–1079. [Google Scholar] [CrossRef]
  26. Vallianatos, C.N.; Farrehi, C.M.; Friez, M.J.; Burmeister, M.; Keegan, C.E.; Iwase, S. Altered gene-regulatory function of KDM5C by a novel mutation associated with autism and intellectual disability. Front. Mol. Neurosci. 2018, 11, 104. [Google Scholar] [CrossRef]
  27. Xu, J.; Deng, X.; Disteche, C.M. Sex-specific expression of the X-linked histone demethylase gene Jarid1c in brain. PLoS ONE 2008, 3, e2553. [Google Scholar] [CrossRef]
  28. Iwase, S.; Brookes, E.; Agarwal, S.; Badeaux, A.I.; Ito, H.; Vallianatos, C.N.; Tomassy, G.S.; Kasza, T.; Lin, G.; Thompson, A.; et al. A Mouse Model of X-linked Intellectual Disability Associated with Impaired Removal of Histone Methylation. Cell Rep. 2016, 14, 1000–1009. [Google Scholar] [CrossRef]
  29. Poeta, L.; Fusco, F.; Drongitis, D.; Shoubridge, C.; Manganelli, G.; Filosa, S.; Paciolla, M.; Courtney, M.; Collombat, P.; Lioi, M.B.; et al. A Regulatory Path Associated with X-Linked Intellectual Disability and Epilepsy Links KDM5C to the Polyalanine Expansions in ARX. Am. J. Hum. Genet. 2013, 92, 114–125. [Google Scholar] [CrossRef]
  30. Poeta, L.; Padula, A.; Attianese, B.; Valentino, M.; Verrillo, L.; Filosa, S.; Shoubridge, C.; Barra, A.; Schwartz, C.E.; Christensen, J.; et al. Histone demethylase KDM5C is a SAHA-sensitive central hub at the crossroads of transcriptional axes involved in multiple neurodevelopmental disorders. Hum. Mol. Genet. 2019, 28, 4089–4102. [Google Scholar] [CrossRef]
  31. Poeta, L.; Padula, A.; Lioi, M.B.; van Bokhoven, H.; Miano, M.G. Analysis of a Set of KDM5C Regulatory Genes Mutated in Neurodevelopmental Disorders Identifies Temporal Coexpression Brain Signatures. Genes 2021, 12, 1088. [Google Scholar] [CrossRef]
  32. Hu, X.; Miao, W.; Zou, Y.; Zhang, W.; Zhang, Y.; Liu, H. Expression of p53, epidermal growth factor receptor, Ki-67 and O6-methylguanine-DNA methyltransferase in human gliomas. Oncol. Lett. 2013, 6, 130–134. [Google Scholar] [CrossRef]
  33. Colucci-D’Amato, L.; Speranza, L.; Volpicelli, F. Neurotrophic Factor BDNF, Physiological Functions and Therapeutic Potential in Depression, Neurodegeneration and Brain Cancer. Int. J. Mol. Sci. 2020, 21, 7777. [Google Scholar] [CrossRef]
  34. Chédeville, A.L.; Madureira, P.A. The Role of Hypoxia in Glioblastoma Radiotherapy Resistance. Cancers 2021, 13, 542. [Google Scholar] [CrossRef]
  35. Liu, O.H.; Kiema, M.; Beter, M.; Ylä-Herttuala, S.; Laakkonen, J.P.; Kaikkonen, M.U. Hypoxia-Mediated Regulation of Histone Demethylases Affects Angiogenesis-Associated Functions in Endothelial Cells. Arterioscler. Thromb. Vasc. Biol. 2020, 40, 2665–2677. [Google Scholar] [CrossRef]
  36. Peng, X.; Gao, H.; Xu, R.; Wang, H.; Mei, J.; Liu, C. The interplay between HIF-1α and noncoding RNAs in cancer. J. Exp. Clin. Cancer Res. 2020, 39, 27. [Google Scholar] [CrossRef]
  37. Lo Dico, A.; Martelli, C.; Diceglie, C.; Lucignani, G.; Ottobrini, L. Hypoxia-Inducible Factor-1α Activity as a Switch for Glioblastoma Responsiveness to Temozolomide. Front. Oncol. 2018, 8, 249. [Google Scholar] [CrossRef]
  38. Kanwar, J.R.; Kamalapuram, S.K.; Kanwar, R.K. Targeting survivin in cancer: The cell-signalling perspective. Drug Discov. Today 2011, 16, 485–494. [Google Scholar] [CrossRef]
  39. Tong, B.; Pantazopoulou, V.; Johansson, E.; Pietras, A. The p75 neurotrophin receptor enhances HIF-dependent signaling in glioma. Exp. Cell Res. 2018, 371, 122–129. [Google Scholar] [CrossRef]
  40. Johnston, A.L.; Lun, X.; Rahn, J.J.; Liacini, A.; Wang, L.; Hamilton, M.G.; Parney, I.F.; Hempstead, B.L.; Robbins, S.M.; Forsyth, P.A.; et al. The p75 neurotrophin receptor is a central regulator of glioma invasion. PLoS Biol. 2007, 5, e212. [Google Scholar] [CrossRef]
  41. Rana, N.K.; Singh, P.; Koch, B. CoCl2 simulated hypoxia induce cell proliferation and alter the expression pattern of hypoxia associated genes involved in angiogenesis and apoptosis. Biol. Res. 2019, 52, 12. [Google Scholar] [CrossRef]
  42. Kitamuro, T.; Takahashi, K.; Ogawa, K.; Udono-Fujimori, R.; Takeda, K.; Furuyama, K.; Nakayama, M.; Sun, J.; Fujita, H.; Hida, W.; et al. Bach1 functions as a hypoxia-inducible repressor for the heme oxygenase-1 gene in human cells. J. Biol. Chem. 2003, 278, 9125–9133. [Google Scholar] [CrossRef]
  43. Manini, I.; Caponnetto, F.; Dalla, E.; Ius, T.; Della Pepa, G.M.; Pegolo, E.; Bartolini, A.; La Rocca, G.; Menna, G.; Di Loreto, C.; et al. Heterogeneity Matters: Different Regions of Glioblastoma Are Characterized by Distinctive Tumor-Supporting Pathways. Cancers 2020, 12, 2960. [Google Scholar] [CrossRef]
  44. Yagi, R.; Kawabata, S.; Ikeda, N.; Nonoguchi, N.; Furuse, M.; Katayama, Y.; Kajimoto, Y.; Kuroiwa, T. Intraoperative 5-aminolevulinic acid-induced photodynamic diagnosis of metastatic brain tumors with histopathological analysis. World J. Surg. Oncol. 2017, 15, 179. [Google Scholar] [CrossRef]
  45. Kim, J.H.; Jeong, K.; Li, J.; Murphy, J.M.; Vukadin, L.; Stone, J.K.; Richard, A.; Tran, J.; Gillespie, G.Y.; Flemington, E.K.; et al. SON drives oncogenic RNA splicing in glioblastoma by regulating PTBP1/PTBP2 switching and RBFOX2 activity. Nat. Commun. 2021, 12, 5551. [Google Scholar] [CrossRef]
  46. Awah, C.U.; Winter, J.; Mazdoom, C.M.; Ogunwobi, O.O. NSUN6, an RNA methyltransferase of 5-mC controls glioblastoma response to temozolomide (TMZ) via NELFB and RPS6KB2 interaction. Cancer Biol. Ther. 2021, 22, 587–597. [Google Scholar] [CrossRef]
  47. Kalscheuer, V.M.; FitzPatrick, D.; Tommerup, N.; Bugge, M.; Niebuhr, E.; Neumann, L.M.; Tzschach, A.; Shoichet, S.A.; Menzel, C.; Erdogan, F.; et al. Mutations in autism susceptibility candidate 2 (AUTS2) in patients with mental retardation. Hum. Genet. 2007, 121, 501–509. [Google Scholar] [CrossRef]
  48. Li, D.; Wang, Q.; Gong, N.N.; Kurolap, A.; Feldman, H.B.; Boy, N.; Brugger, M.; Grand, K.; McWalter, K.; Guillen Sacoto, M.J.; et al. Pathogenic variants in SMARCA5, a chromatin remodeler, cause a range of syndromic neurodevelopmental features. Sci. Adv. 2021, 7, eabf2066. [Google Scholar] [CrossRef] [PubMed]
  49. Zollino, M.; Marangi, G.; Ponzi, E.; Orteschi, D.; Ricciardi, S.; Lattante, S.; Murdolo, M.; Battaglia, D.; Contaldo, I.; Mercuri, E.; et al. Intragenic KANSL1 mutations and chromosome 17q21.31 deletions: Broadening the clinical spectrum and genotype-phenotype correlations in a large cohort of patients. J. Med. Genet. 2015, 52, 804–814. [Google Scholar] [CrossRef] [PubMed]
  50. Jones, W.D.; Dafou, D.; McEntagart, M.; Woollard, W.J.; Elmslie, F.V.; Holder-Espinasse, M.; Irving, M.; Saggar, A.K.; Smithson, S.; Trembath, R.C.; et al. De novo mutations in MLL cause Wiedemann-Steiner syndrome. Am. J. Hum. Genet. 2012, 91, 358–364. [Google Scholar] [CrossRef] [PubMed] [Green Version]
  51. Alves, A.L.V.; Gomes, I.N.F.; Carloni, A.C.; Rosa, M.N.; da Silva, L.S.; Evangelista, A.F.; Reis, R.M.; Silva, V.A.O. Role of glioblastoma stem cells in cancer therapeutic resistance: A perspective on antineoplastic agents from natural sources and chemical derivatives. Stem Cell Res. Ther. 2021, 12, 206. [Google Scholar] [CrossRef] [PubMed]
  52. Prager, B.C.; Bhargava, S.; Mahadev, V.; Hubert, C.G.; Rich, J.N. Glioblastoma Stem Cells: Driving Resilience through Chaos. Trends Cancer 2020, 6, 223–235. [Google Scholar] [CrossRef] [PubMed]
  53. Oh, H.J.; Bae, J.M.; Wen, X.; Jung, S.; Kim, Y.; Kim, K.J.; Cho, N.Y.; Kim, J.H.; Han, S.W.; Kim, T.Y.; et al. p53 expression status is associated with cancer-specific survival in stage III and high-risk stage II colorectal cancer patients treated with oxaliplatin-based adjuvant chemotherapy. Br. J. Cancer 2019, 120, 797–805. [Google Scholar] [CrossRef]
  54. Molgora, M.; Esaulova, E.; Vermi, W.; Hou, J.; Chen, Y.; Luo, J.; Brioschi, S.; Bugatti, M.; Omodei, A.S.; Ricci, B.; et al. TREM2 Modulation Remodels the Tumor Myeloid Landscape Enhancing Anti-PD-1 Immunotherapy. Cell 2020, 182, 886–900. [Google Scholar] [CrossRef] [PubMed]
  55. Qiu, H.; Shao, Z.; Wen, X.; Jiang, J.; Ma, Q.; Wang, Y.; Huang, L.; Ding, X.; Zhang, L. TREM2: Keeping Pace With Immune Checkpoint Inhibitors in Cancer Immunotherapy. Front. Immunol. 2021, 12, 716710. [Google Scholar] [CrossRef]
  56. West, A.J.; Tsui, V.; Stylli, S.S.; Nguyen, H.; Morokoff, A.P.; Kaye, A.H.; Luwor, R.B. The role of interleukin-6-STAT3 signalling in glioblastoma. Oncol. Lett. 2018, 16, 4095–4104. [Google Scholar] [CrossRef] [PubMed]
  57. Widodo, S.S.; Dinevska, M.; Furst, L.M.; Stylli, S.S.; Mantamadiotis, T. IL-10 in glioma. Br. J. Cancer 2021, 125, 1466–1476. [Google Scholar] [CrossRef]
  58. De Boeck, A.; Ahn, B.Y.; D’Mello, C.; Lun, X.; Menon, S.V.; Alshehri, M.M.; Szulzewsky, F.; Shen, Y.; Khan, L.; Dang, N.H.; et al. Glioma-derived IL-33 orchestrates an inflammatory brain tumor microenvironment that accelerates glioma progression. Nat. Commun. 2020, 11, 4997. [Google Scholar] [CrossRef]
  59. Tong, X.; Yang, P.; Wang, K.; Liu, Y.; Liu, X.; Shan, X.; Huang, R.; Zhang, K.; Wang, J. Survivin is a prognostic indicator in glioblastoma and may be a target of microRNA-218. Oncol. Lett. 2019, 18, 359–367. [Google Scholar] [CrossRef]
  60. Kumar, R.; Jain, V.; Kushwah, N.; Dheer, A.; Mishra, K.P.; Prasad, D.; Singh, S.B. Role of DNA Methylation in Hypobaric Hypoxia-Induced Neurodegeneration and Spatial Memory Impairment. Ann. Neurosci. 2018, 4, 191–200. [Google Scholar] [CrossRef]
  61. Muthukrishnan, S.D.; Alvarado, A.G.; Kornblum, H.I. Building Bonds: Cancer Stem Cells Depend on Their Progeny to Drive Tumor Progression. Cell Stem Cell 2018, 4, 473–474. [Google Scholar] [CrossRef]
  62. Tafani, M.; Di Vito, M.; Frati, A.; Pellegrini, L.; De Santis, E.; Sette, G.; Eramo, A.; Sale, P.; Mari, E.; Santoro, A.; et al. Pro-inflammatory gene expression in solid glioblastoma microenvironment and in hypoxic stem cells from human glioblastoma. J. Neuroinflamm. 2011, 8, 32. [Google Scholar] [CrossRef]
  63. Lu, H.; Lyu, Y.; Tran, L.; Lan, J.; Xie, Y.; Yang, Y.; Murugan, N.L.; Wang, Y.J.; Semenza, G.L. HIF-1 recruits NANOG as a coactivator for TERT gene transcription in hypoxic breast cancer stem cells. Cell Rep. 2021, 36, 109757. [Google Scholar] [CrossRef]
  64. Castillo-Rodríguez, R.A.; Trejo-Solís, C.; Cabrera-Cano, A.; Gómez-Manzo, S.; Dávila-Borja, V.M. Hypoxia as a Modulator of Inflammation and Immune Response in Cancer. Cancers 2022, 14, 2291. [Google Scholar] [CrossRef]
  65. Yan, S.F.; Tritto, I.; Pinsky, D.; Liao, H.; Huang, J.; Fuller, G.; Brett, J.; May, L.; Stern, D. Induction of interleukin 6 (IL-6) by hypoxia in vascular cells. Central role of the binding site for nuclear factor-IL-6. J. Biol. Chem. 1995, 270, 11463–11471. [Google Scholar] [CrossRef]
  66. Radharani, N.N.V.; Yadav, A.S.; Nimma, R.; Kumar, T.; Bulbule, A.; Chanukuppa, V.; Kumar, D.; Patnaik, S.; Rapole, S.; Kundu, G.C. Tumor-associated macrophage derived IL-6 enriches cancer stem cell population and promotes breast tumor progression via Stat-3 pathway. Cancer Cell Int. 2022, 22, 122. [Google Scholar] [CrossRef]
  67. Wang, T.; Song, P.; Zhong, T.; Wang, X.; Xiang, X.; Liu, Q.; Chen, H.; Xia, T.; Liu, H.; Niu, Y.; et al. The inflammatory cytokine IL-6 induces FRA1 deacetylation promoting colorectal cancer stem-like properties. Oncogene 2019, 38, 4932–4947. [Google Scholar] [CrossRef]
  68. Deng, L.; Zhang, X.; Xiang, X.; Xiong, R.; Xiao, D.; Chen, Z.; Liu, K.; Feng, G. NANOG Promotes Cell Proliferation, Invasion, and Stemness via IL-6/STAT3 Signaling in Esophageal Squamous Carcinoma. Technol. Cancer Res. Treat. 2021, 20, 1–9. [Google Scholar] [CrossRef]
  69. Cheng, X.; Wang, X.; Nie, K.; Cheng, L.; Zhang, Z.; Hu, Y.; Peng, W. Systematic Pan-Cancer Analysis Identifies TREM2 as an Immunological and Prognostic Biomarker. Front. Immunol. 2021, 12, 646523. [Google Scholar] [CrossRef]
  70. Jin, Y.; Xiao, W.; Song, T.; Feng, G.; Dai, Z. Expression and Prognostic Significance of p53 in Glioma Patients: A Meta-analysis. Neurochem. Res. 2016, 41, 1723–1731. [Google Scholar] [CrossRef]
  71. Jang, J.Y.; Kim, Y.S.; Kang, K.N.; Kim, K.H.; Park, Y.J.; Kim, C.W. Multiple microRNAs as biomarkers for early breast cancer diagnosis. Mol. Clin. Oncol. 2021, 14, 31. [Google Scholar] [CrossRef] [PubMed]
  72. Yuan, Y.; Xiang, W.; Yanhui, L.; Ruofei, L.; Shuang, L.; Yingjun, F.; Qiao, Z.; Yanwu, Y.; Qing, M. Ki-67 overexpression in WHO grade II gliomas is associated with poor postoperative seizure control. Seizure 2013, 22, 877–881. [Google Scholar] [CrossRef] [PubMed]
  73. You, G.; Sha, Z.; Jiang, T. The pathogenesis of tumor-related epilepsy and its implications for clinical treatment. Seizure 2012, 21, 153–159. [Google Scholar] [CrossRef] [PubMed]
  74. Kleihues, P.; Cavenee, W.K. Pathology and Genetics of Tumours of the Nervous System; International Agency for Research on Cancer (IARC) Press: Lyon, France, 2000. [Google Scholar]
  75. Hadjipanayis, C.G.; Stummer, W. 5-ALA and FDA approval for glioma surgery. J. Neurooncol. 2019, 141, 479–486. [Google Scholar] [CrossRef]
  76. Li, N.; Carrel, L. Escape from X chromosome inactivation is an intrinsic property of the Jarid1c locus. Proc. Natl. Acad. Sci. USA 2008, 105, 17055–17060. [Google Scholar] [CrossRef]
  77. Kruidenier, L.; Chung, C.W.; Cheng, Z.; Liddle, J.; Che, K.; Joberty, G.; Bantscheff, M.; Bountra, C.; Bridges, A.; Diallo, H.; et al. A selective jumonji H3K27 demethylase inhibitor modulates the proinflammatory macrophage response. Nature 2012, 488, 404–408. [Google Scholar] [CrossRef]
  78. Hashizume, R.; Andor, N.; Ihara, Y.; Lerner, R.; Gan, H.; Chen, X.; Fang, D.; Huang, X.; Tom, M.W.; Ngo, V.; et al. Pharmacologic inhibition of histone demethylation as a therapy for pediatric brainstem glioma. Nat. Med. 2014, 12, 1394–1396. [Google Scholar] [CrossRef]
  79. Sui, A.; Xu, Y.; Li, Y.; Hu, Q.; Wang, Z.; Zhang, H.; Yang, J.; Guo, X.; Zhao, W. The pharmacological role of histone demethylase JMJD3 inhibitor GSK-J4 on glioma cells. Oncotarget 2017, 40, 68591–68598. [Google Scholar] [CrossRef] [Green Version]
Figure 1. Expression analysis in KDM5CLow and KDM5CHigh cohorts. (A) Analysis of KDM5C expression by real-time PCR (RT-PCR) assay and (B) Western blotting. (C) Ki67 expression analysis in GBM patients with (Epilepsy+) or without epilepsy (Epilepsy−), and p53 expression analysis in GBM patients with wild-type (WT) or mutated IDH1/2 (mut) alleles. (D) RT-PCR analysis of BDNF, HIF1A, and BIRC5. (E) Scatter plots reporting the correlation—by linear regression analysis—of HIF1A and BIRC5 expression in the KDM5CLow and KDM5CHigh subgroups. (F) RT-PCR analysis of p75NTR expression in healthy controls, KDM5CLow, and KDM5CHigh GBM samples. (G) Scatter plot reporting the correlation—by linear regression analysis—of HIF1A and p75NTR expression in the KDM5CLow and KDM5CHigh subgroups. Each transcript analysis was performed in triplicate, and the samples were normalized with the TATA-Box Binding Protein (TBP) transcript. The bars indicate the mean ± SEM of repeated experiments. Asterisks indicate statistical significance compared with healthy control samples: *** p < 0.0005, ** p < 0.005, and * p < 0.05. The Western blotting experiment was repeated in triplicate, and the beta-actin antibody (β-ACTIN) was used as a loading control. In the scatter plots, the average expression value of healthy control samples was used as a reference. The Pearson’s correlation coefficient (r) and p-values (p) are indicated on the top of each plot. In the box plot, the black thick line inside the box represents the median of the values, and the 25th and 75th percentiles are shown as boundaries of the box. The Student’s t-test was applied with * p < 0.05.
Ijms 23 10250 g001
Figure 2. Expression analysis in T98G cell lines. (A) RT-PCR analysis of KDM5C, BDNF, and HIF1A transcripts in T98G cell lines transiently transfected with a plasmid expressing KDM5C or a plasmid containing the empty vector. (B) RT-PCR analysis of KDM5C, HIF1A, BDNF, and p75NTR in T98G cell lines exposed to cobalt chloride (CoCl2). Each transcript analysis was performed in triplicate, and the samples were normalized with the 18S transcript. The bars indicate the mean ± dev.st. of repeated experiments. Asterisks indicate statistical significance compared with the control samples: *** p < 0.0005, ** p < 0.005, and * p < 0.05.
Ijms 23 10250 g002
Figure 3. Expression analysis in GBM areas isolated by 5-aminolevulinic acid fluorescence-guided surgery. (A) Intraoperative photographs obtained in the GBM patient #45. 5-ALA administration showing the resection cavity illuminated with blue light, demonstrating intense and moderate 5-ALA fluorescence representing the tumor core and tumor rim, respectively. (B) RT-PCR analysis of the KDM5C, BDNF, HIF1A, p75NTR, and NGF transcripts in different layers identified by 5-ALA surgery. Each transcript analysis was performed in triplicate, and the samples were normalized with the TATA-Box Binding Protein (TBP) gene. The bars indicate the mean ± SEM of repeated experiments. Asterisks indicate statistical significance compared with the healthy control samples: ** p < 0.005 and * p< 0.05.
Ijms 23 10250 g003
Figure 4. Features of the KDM5CLow and KDM5CHigh subgroups in the TCGA dataset. (A) KDM5C expression (transcript per million, RNA-Seq data) in the GBM samples (TCGA; N = 163) compared to control post-mortem brains (GTeX portal; N = 207). (B,C) On the left, volcano plots reporting differential mRNA expression and methylation between the two GBM subgroups (downloaded from cBioportal). On the right, bar graphs reporting the results of Gene Ontology and pathway analysis on differentially expressed (B) and methylated (C) genes between the two tumor subgroups. (D) Venn diagrams of hypomethylated/overexpressed genes and hypermethylated/downregulated genes in the KDM5CHigh cohort. (E) Gene Ontology analysis of DEGs regulated by methylation changes (DEGs_meth) in KDM5CHigh (KDM5CHigh/DEGs_meth) by using the Panther classification system (www.pantherdb.org; accessed on 1 June 2022). (F) Network analysis of protein–protein interactions for KDM5CHigh/DEGs_meth genes using the STRING database.
Ijms 23 10250 g004
Figure 5. Expression analysis of the stem cell-associated genes in GBM tumor samples. (A) RT-PCR analysis of NANOG, OCT4, SOX2, and NESTIN in the KDM5CLow and KDM5CHigh cohorts. (B) Scatter plot reporting the correlation—by linear regression analysis—of HIF1A and SOX2 in the KDM5CLow and KDM5CHigh subgroups. The average expression value of healthy control samples was used as a reference. The Pearson’s correlation coefficient (r) and p-values (p) are indicated on the top of each plot. (C) RT-PCR analysis of NANOG, OCT4, SOX2, and NESTIN in 5-ALA FGS tissues. Each transcript analysis was performed in triplicate, and the samples were normalized with the TATA-Box Binding Protein (TBP) gene. The bars indicate the mean ± SEM of repeated experiments. Asterisks indicate statistical significance compared with healthy control samples: ** p < 0.005 and * p< 0.05.
Ijms 23 10250 g005
Figure 6. Expression profiles of TREM2 and proinflammatory cytokine genes in GBM tumor samples. (A,B) RT-PCR assay in the KDM5CLow and KDM5CHigh subgroups. (C) Scatter plot reporting the correlation—by linear regression analysis—of NANOG and IL6 in the KDM5CLow and KDM5CHigh subgroups. (D) IL6 expression analysis in GBM patients with (Epilepsy+) or without epilepsy (Epilepsy−). (E,F) RT-PCR assay in 5-ALA FGS tissues. Each transcript analysis was performed in triplicate, and the samples were normalized with the TBP gene. The bars indicate the mean ± SEM of repeated experiments. Asterisks indicate statistical significance compared with the healthy control samples: * p < 0.05. In the scatter plots, the average expression value of the healthy control samples was used as a reference. The Pearson’s correlation coefficient (r) and p-values (p) are indicated on the top of each plot.
Ijms 23 10250 g006
Figure 7. Molecular features of GBM patients stratified by expression data of the chromatin oxygen sensor gene KDM5C. (A) High expression levels of the tumor markers HIF1A, NANOG, and IL6 are associated with a high level of KDM5C. (B) KDM5C expression variability in female and male individuals. Since KDM5C escapes X-inactivation, two active alleles (in red) are present in female individuals, unlike the male individuals, in which only one allele drives the expression of KDM5C. (C) Sex-related distribution in the KDM5CHigh and KDM5CLow GBM subgroups identified in TCGA. Xa, X chromosome active; Xi, X chromosome inactive.
Ijms 23 10250 g007
Table 1. Demographic data, tumor characteristics, and treatments strategies of 37 GBM patients enrolled in this study.
Clinicopathological ParametersNo. of Patients (Frequency)
GenderMale20 (54%)
Female17 (46%)
EpilepsyYes13 (35%)
No24 (65%)
Location of lesionParietal4 (10.8 %)
Frontal7 (18.9%)
Temporal5 (13.6%)
Rolandic3 (8.1%)
Corpus Callosum2 (5.4%)
Frontotemporal4 (10.8%)
Temporo-Parietal3 (8.1%)
Frontoparietal3 (8.1%)
Parieto-Occipital2 (5.4%)
Others4 (10.8%)
Lobe localizationRight hemisphere17 (45.9%)
Left hemisphere17 (45.9%)
Others3 (8.2%)
Lesion numberSingle33 (89%)
Multifocal4 (11%)
Surgical approachTotal resection with standard method25 (68%)
Total resection with 5-ALA9 (24%)
Biopsy3 (8%)
RadiotherapyYes28 (75.6%)
No9 (24.4%)
ChemotherapyYes34 (92%)
No3 (8%)
MGMT methylationYes33 (89.2%)
No4 (10.8%)
IDH1/2 mutationWT14 (37.8%)
MUT23 (62.2%)
p53 expressionYes32 (86.5%)
No5 (13.5%)
Ki67 expressionYes37 (100%)
Survival--17 (46%)
Mortality rate--20 (54%)
Publisher’s Note: MDPI stays neutral with regard to jurisdictional claims in published maps and institutional affiliations.

