Article

Per1/Per2 knockout Affects Spleen Immune Function in Elderly Mice via Inducing Spleen Lymphocyte Ferroptosis

School of Life Science and Technology, Wuhan Polytechnic University, Wuhan 430024, China
*
Author to whom correspondence should be addressed.
These authors contributed equally to this work.
Int. J. Mol. Sci. 2022, 23(21), 12962; https://0-doi-org.brum.beds.ac.uk/10.3390/ijms232112962
Submission received: 24 August 2022 / Revised: 18 October 2022 / Accepted: 18 October 2022 / Published: 26 October 2022
(This article belongs to the Special Issue Molecular Research in Circadian Rhythm and Cellular Synchrony)

Abstract

:
Disturbances in circadian rhythms are known to affect immune functions. However, the long-term impact of abnormal circadian rhythms on the immune-related functions of the spleen are poorly understood. Hence, we aimed to investigate the immune-related functions of spleen in Per1/Per2 double-knockout (DKO) and wild-type (WT) mice aged 4, 9, and 14 months. Compared to the WT mice, the DKO mice had smaller spleen white pulp (WP) and lymphocyte germinal area, as well as fewer immune cells with age—these differences were especially clear. The spleen lymphocyte mortality, malondialdehyde (MDA) levels, reactive oxygen species (ROS) levels, and ferritin-binding receptor (TFR1) levels were significantly higher in the 14-month-old DKO mice than in WT mice of the same age. Transcriptome analysis showed that most of the differentially expressed mRNAs were enriched in DNA damage repair-related pathways. In DKO mice, spleen cells showed up-regulation of pro-ferroptosis genes, such as Cd36, Atm, and Acsl4, and down-regulation of anti-ferroptosis genes, such as GPX4. We found that long-term abnormalities in the circadian rhythm can induce DNA damage and ferroptosis in mouse spleen.

1. Introduction

Circadian rhythms influence the patterns of mammalian behaviors and physiology. An elaborate set of molecular mechanisms are regulated by the period genes, Per1 and Per2, and cryptochrome genes, Cry1 and Cry2, all of which control the rhythm of the biological clock. The PER and CRY proteins form heterodimers that inhibit the transcription of their genes by blocking the BMAL1/CLOCK activity [1]. These core clock proteins also form a regulatory loop with RAR-related orphan receptors (RORs) and nuclear receptor subfamily 1 group D member 1 (NR1D1, also known as Rev-Erb alpha) proteins for the regulation of the biological clock [2,3].
Disruption of the circadian rhythm can cause cardiovascular disease [4], gastrointestinal diseases [5,6], reproductive abnormalities [7], brain disorders [8], and immune system damage [9,10]. Recent work has found that cerebrospinal fluid (CSF) drains into the lymphatic system [11]. Therefore, waste clearance from the CSF may also be influenced by the circadian clock. In addition, circadian disruption can also lead to the loss or inversion of daily patterns of M1 (pro-inflammatory) and M2 (anti-inflammatory) macrophage activity and cytokine levels in spleen and tumor tissues. In tumors, this may promote the remodeling of the tumor microenvironment (TME) and favor tumor cell proliferation [12]. Thus, circadian disruption can severely affect the body’s lymphatic and immune systems. The spleen is the largest secondary lymphoid organ in the body, and is responsible for a wide range of immunological functions in addition to its roles in hematopoiesis and red blood cell clearance [13]. However, the impact of long-term abnormalities in circadian rhythms on the function of the spleen is poorly understood, especially in old age. We aimed to investigate if chronic circadian rhythm abnormalities impair spleen function in old age. This research is important for understanding the health issues of night shift workers in an increasingly aging society.
This study used double-knockout (DKO) Per1/Per2 mice aged 4 (young), 9 (middle-aged), and 14 (old) months to explore the effects of circadian rhythm abnormalities on the spleen. Physiological indicators and hematoxylin–eosin (HE) staining showed that the older mice had significant and obvious spleen damage. Flow cytometry showed that the numbers of blood and spleen lymphocytes in 14-month-old DKO mice were significantly lower than those in WT mice of corresponding ages. While the differences in the numbers of blood and spleen lymphocytes in 9-month-old and 4-month-old DKO mice were minor, the differences in these numbers between DKO and WT mice of corresponding ages were significant. Transcriptome analyses of spleen tissues of 14-month-old mice revealed that Per1/Per2 DKO induced DNA damage repair in the spleen, followed by lipid peroxidation and ferroptosis through multiple pathways, including induced ROS, up-regulation of ACSL4 expression, and PUFA-PL (polyunsaturated fatty acid-containing phospholipids) peroxidation, along with dampening of glutathione peroxidase 4 (GPX4) expression. Immunohistochemical staining indicated that lymphocyte mortality, ROS, and MDA were higher in DKO mice than in WT mice. The levels of ferritin-binding receptor (TFR1) increased with age in the DKO mice. Interestingly, these pathways are also involved in radiotherapy-induced ferroptosis [14], which suggests that long-term abnormalities in the circadian rhythm can negatively affect the spleen’s immune function in mice.

2. Results

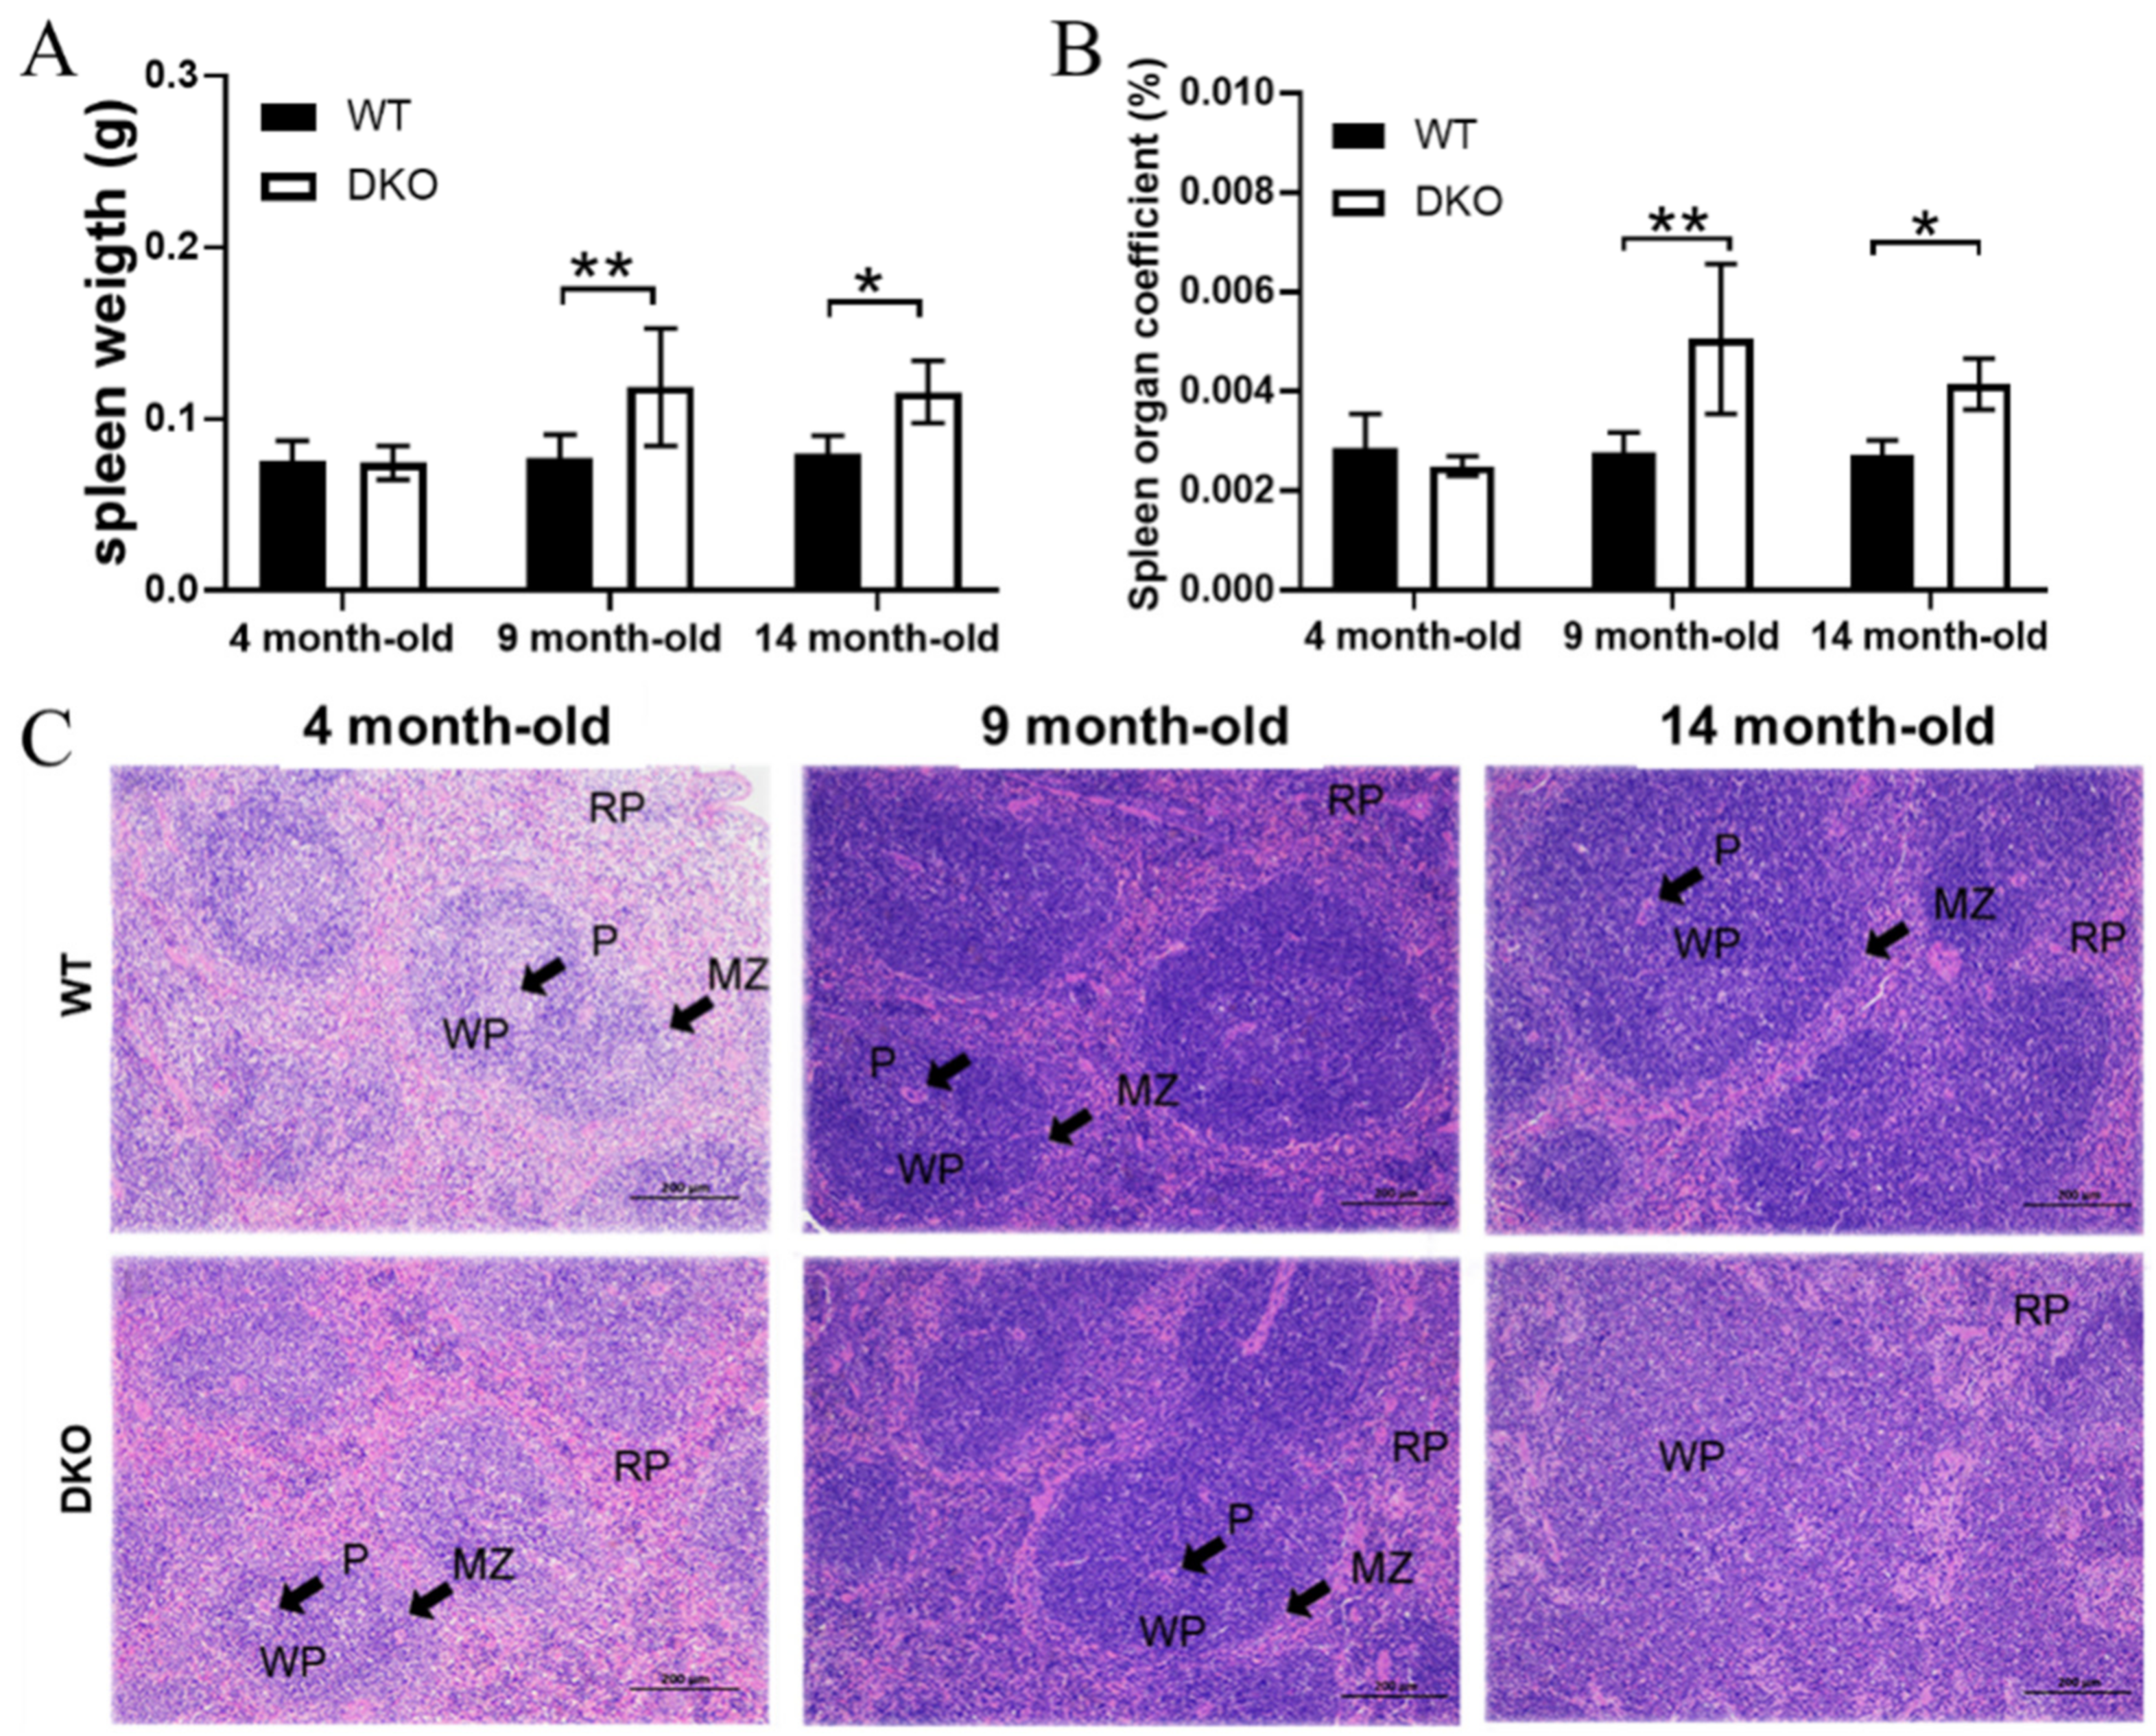
2.1. Effects of Per1/Per2 Knockout on Spleen Weight and Pathological Structure

In the 4-month-old mice, we observed no significant differences in either spleen weight or spleen weight–body weight ratios between the DKO and WT mice. However, in the 9- and 14-month-old mice, spleen weights and spleen weight–body weight ratios were significantly higher in the DKO mice than in WT mice (p < 0.05; Figure 1A,B).
The white pulp (WP) and the red pulp (RP) are two functionally and morphologically distinct regions of the spleen. The WP can be further differentiated into the periarterial lymphatic sheath (P) and the marginal zone (MZ), while the RP consists of the hyperemic sinuses and the splenic cord. In a normal spleen, there is a clear boundary between MZ and WP. However, pathological changes can lead to the blurring of this boundary. The spleens of DKO mice showed some pathological changes, which increased with age (Figure 1C); such changes were not as evident in WT mice. At 4 and 9 months, the DKO mice had a fairly normal spleen structure containing a loose WP structure with light staining and a clear boundary between the WP and MZ. However, by 14 months, the WP structure was loose and incomplete, the P was blurred or had disappeared, and the MZ boundary could not be seen. The spleen WP and lymphocyte germinal area in the DKO mice decreased significantly with age and were also significantly smaller than those of WT mice of the same age.

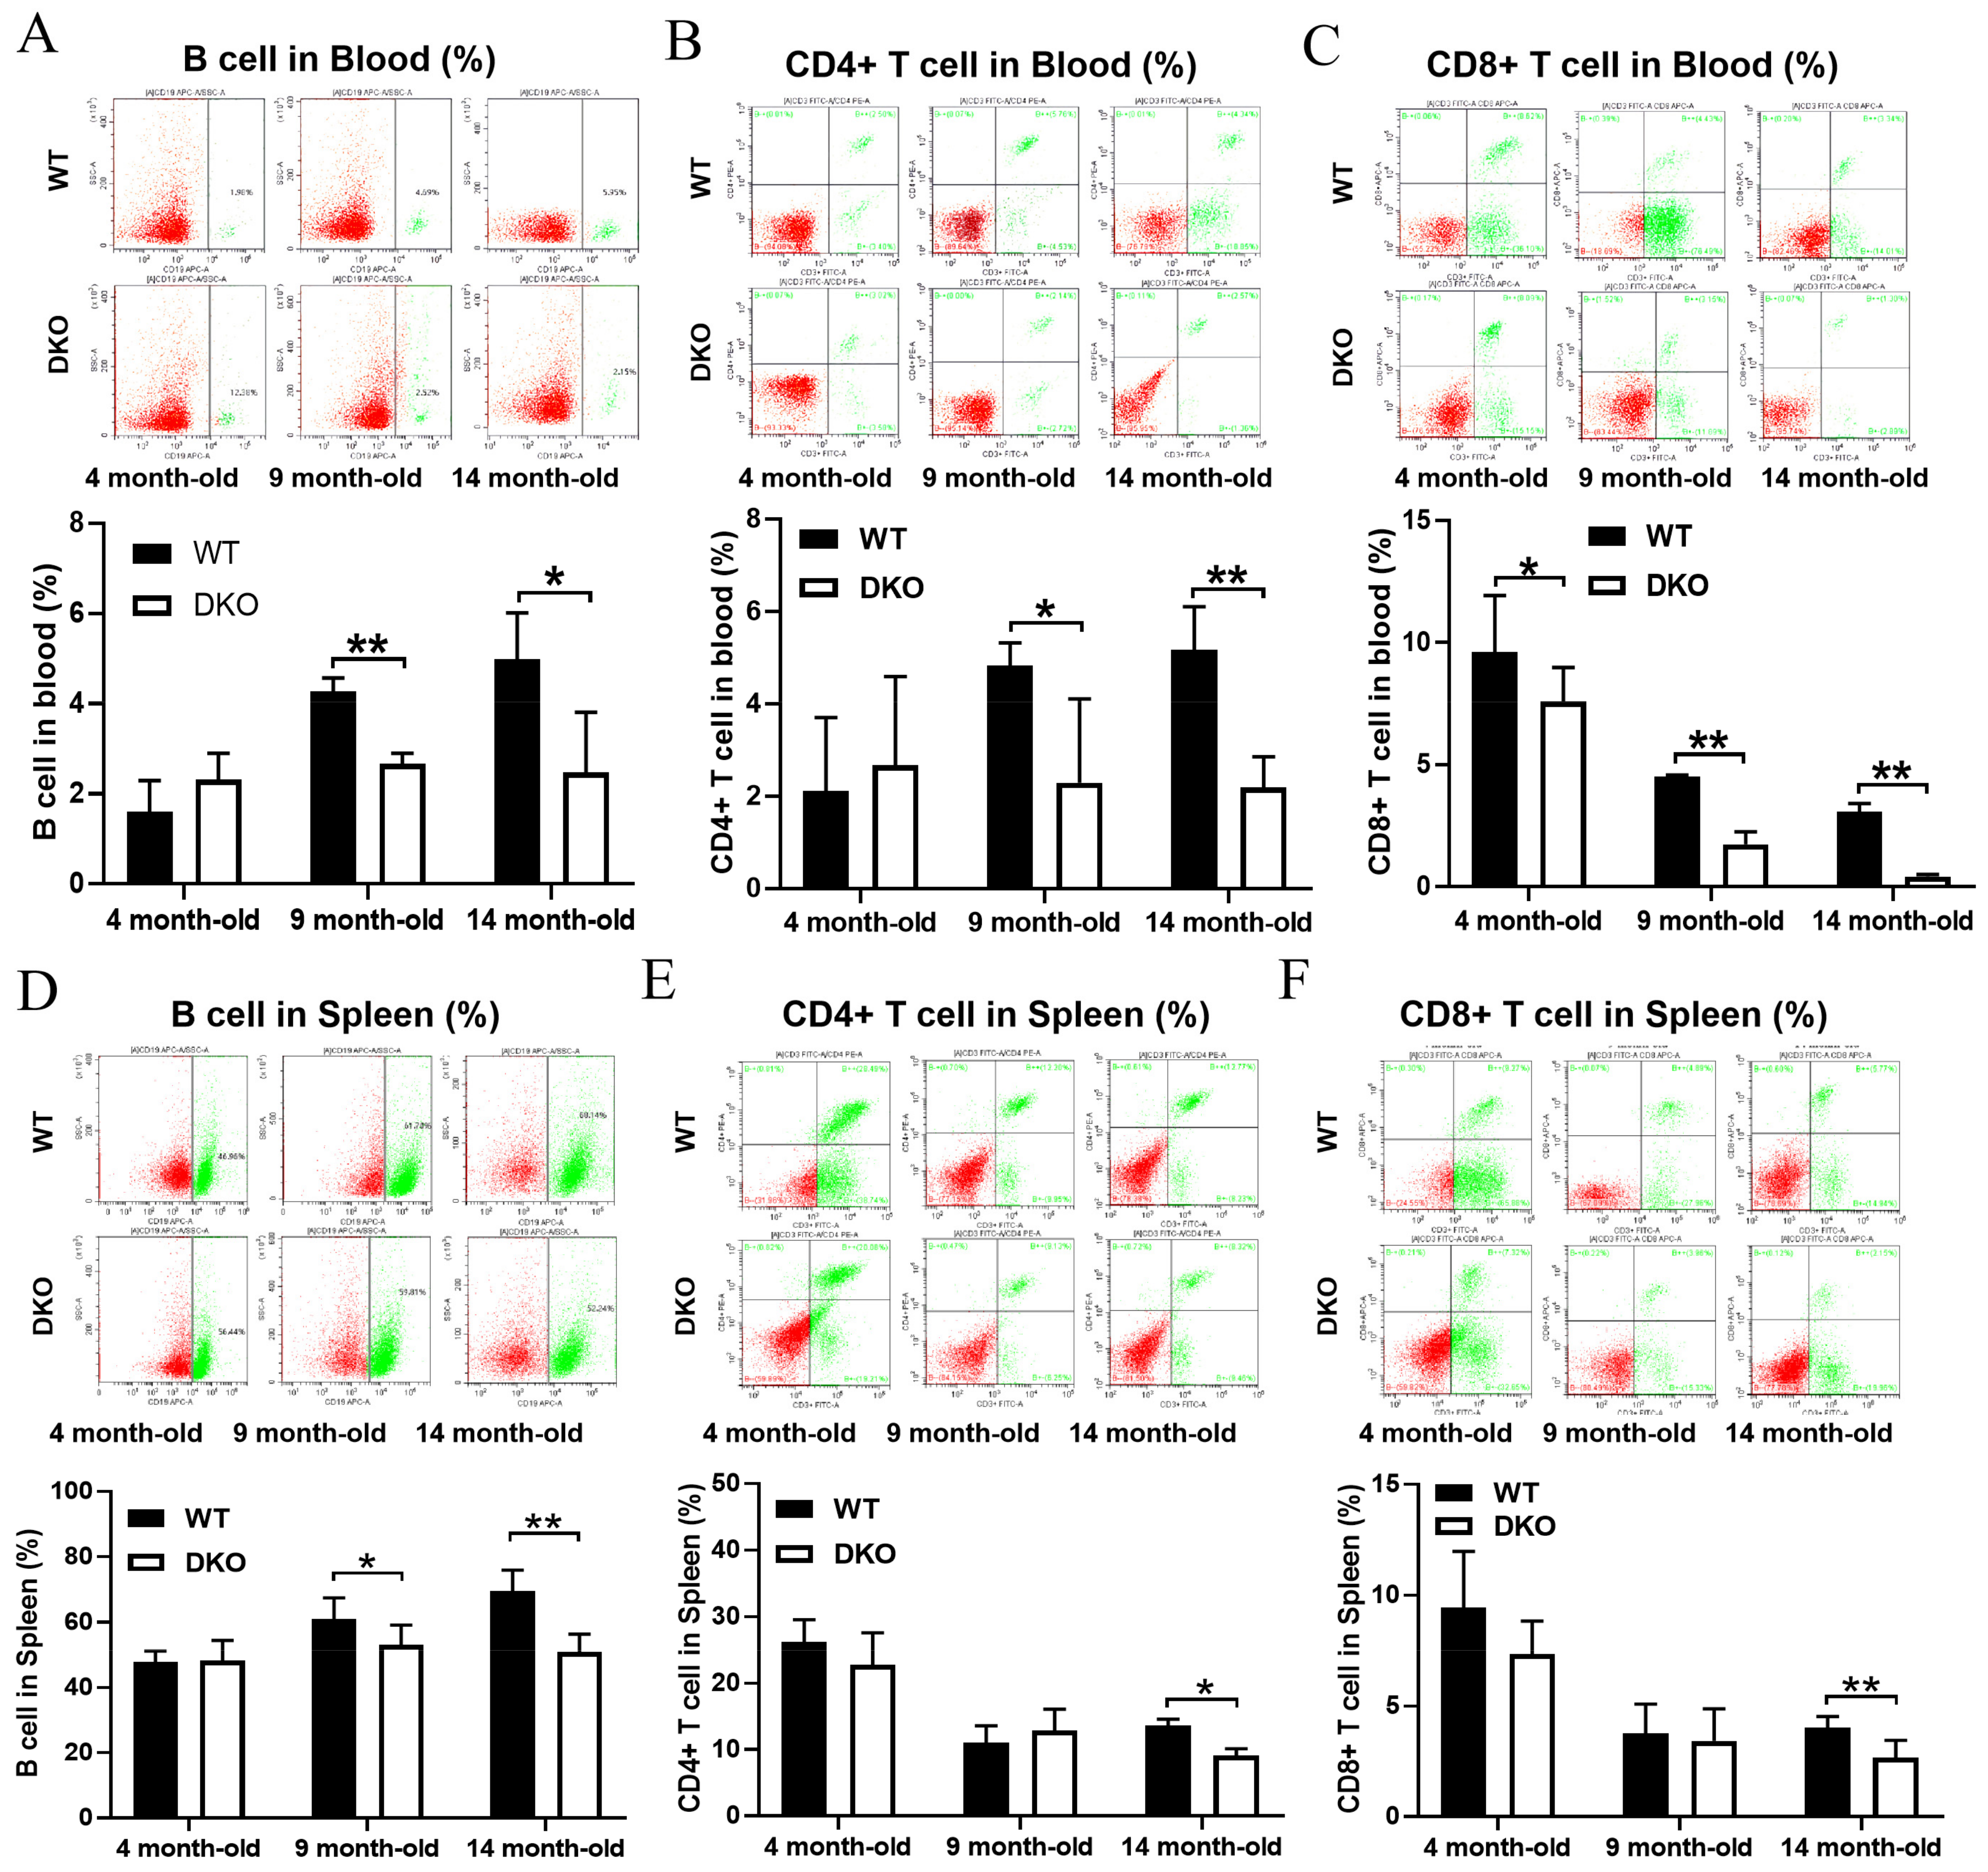
2.2. Levels of B Cells, CD3+-CD4+T Cells, and CD3+-CD8+T Cells in Blood and Spleen of DKO and WT Mice at Different Ages

Flow cytometry was used to measure the numbers of B cells, CD3+-CD4+T cells, and CD3+-CD8+T cells in the blood and spleen of WT and DKO mice aged 4, 9, and 14 months (Figure 2). All three cell types in blood were significantly lower in the 9- and 14-month-old DKO mice compared to WT mice of corresponding ages (Figure 2A–C). There were no significant differences in the number of B cells and CD3+-CD4+T cells in blood between 4-month-old DKO and WT mice (Figure 2A,B); however, the number of CD3+-CD8+T cells in blood was significantly lower in DKO mice than in WT mice (Figure 2C). In the spleen, there were no significant differences in the number of B cells, CD3+-CD4+T cells, and CD3+-CD8+T cells between 4-month-old DKO and WT mice (Figure 2D–F). B cell numbers were significantly lower in 9-month-old DKO mice than in WT mice (Figure 2D), but there were no significant differences in CD3+-CD4+T and CD3+-CD8+T cell numbers between the DKO and WT mice (Figure 2E,F). The numbers of all three cell types in 14-month-old DKO mice were significantly lower than those in 14-month-old WT mice (Figure 2D–F).

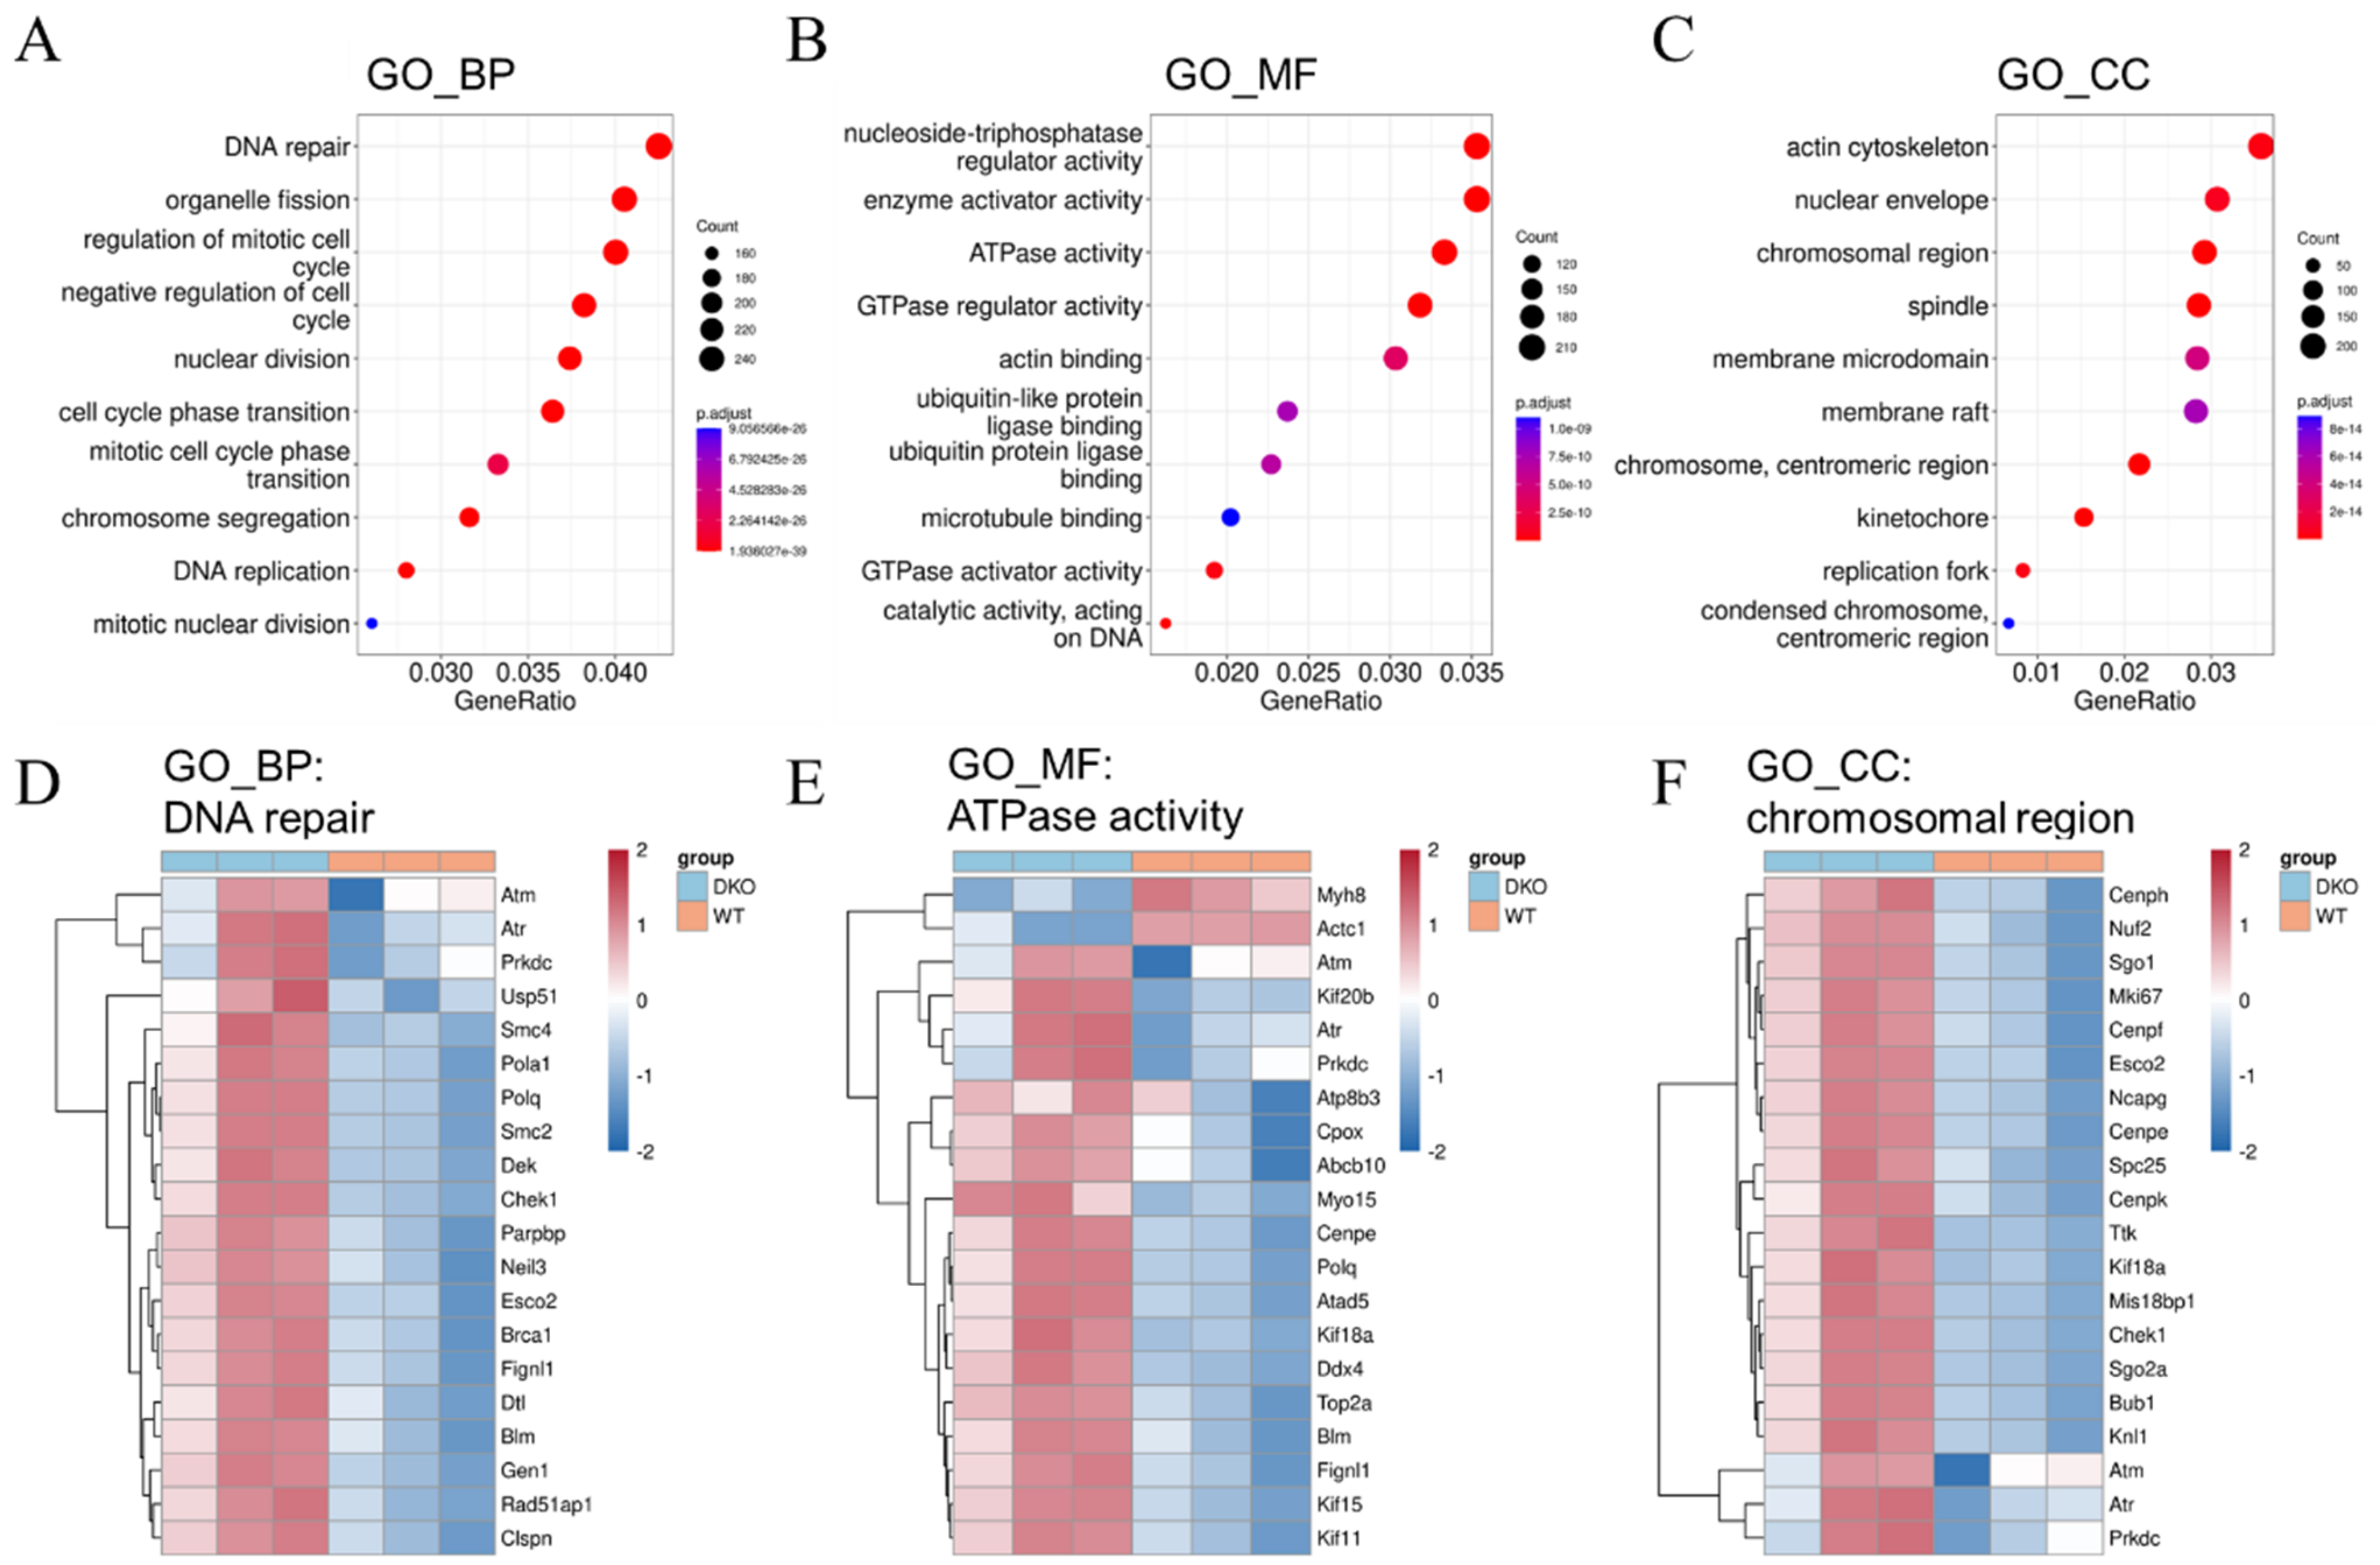
2.3. DNA Damage Response and Oxidative Stress Resistance in DKO Mice Spleen Tissue Detected through Transcriptome Sequencing

The total RNA contents of spleen cells from 14-month-old DKO and WT mice were sequenced and analyzed. The differentially expressed genes (DEGs) in DKO and WT mice were identified using principal component analysis (PCA) (Figure S1A). In total, 3583 genes were up-regulated and 2290 were down-regulated in DKO mice. Genes exhibiting differential expression levels > 0.1 (fold change in expression or log2FoldChange) and p-value < 0.05 were selected for further analysis (Figure S1B), and the results are presented as a heatmap in Figure S1C.
Gene Ontology (GO) functional enrichment analysis was performed to determine the functions of the DEGs. The results showed that most of differentially expressed mRNAs (DEmRNAs) belonged to genes involved in the DNA damage response (DDR) pathway, including DNA repair (biological process, BP) (Figure 3A,D), ATPase activity (molecular function, MF) (Figure 3B,E), and chromosomal region (cell component, CC) (Figure 3C,F). Three DNA damage response genes, Atm, Atr, and Prkdc, were significantly up-regulated in the spleens of DKO mice (Figure 3D,F). In addition, the genes Msh2, Msh3, Msh5, Msh6, Pms2, Dnmt, Apex2, and H2afx, all of which are involved in DNA repair pathways, were also up-regulated in the spleens of the DKO mice (Figure S2A).
Kyoto Encyclopedia of Genes and Genomes (KEGG) analysis showed that some DEmRNAs belonging to genes involved in the FoxO (forkhead box O) signaling pathway (Figure 4A), such as Fox3 and Fox4, were up-regulated in DKO mice. This pathway is involved in many cellular physiological processes, such as cell cycle control, immuno-regulation, and oxidative stress resistance. In contrast, genes belonging to the TGF-β signaling pathway, such as Smad3, Smad4, Bcl6b, Sod3, and Gadd45b, were down-regulated in DKO mice (Figure S2B); these genes are involved in immuno-regulation and oxidative stress resistance. A pathway–pathway interaction network (PPIN) analysis based on the enriched DEmRNAs in each pathway was constructed. Most DEmRNAs were enriched in five pathways, namely cell cycle, DNA replication, Fanconi anemia pathway, focal adhesion, and homologous recombination (Figure 4B), all of which are associated with DNA damage response. Gene set enrichment analysis (GSEA) (Figure 4C and Figure S3) also proved that cell cycle, DNA replication, and the Fanconi anemia pathway were activated in the spleens of DKO mice.

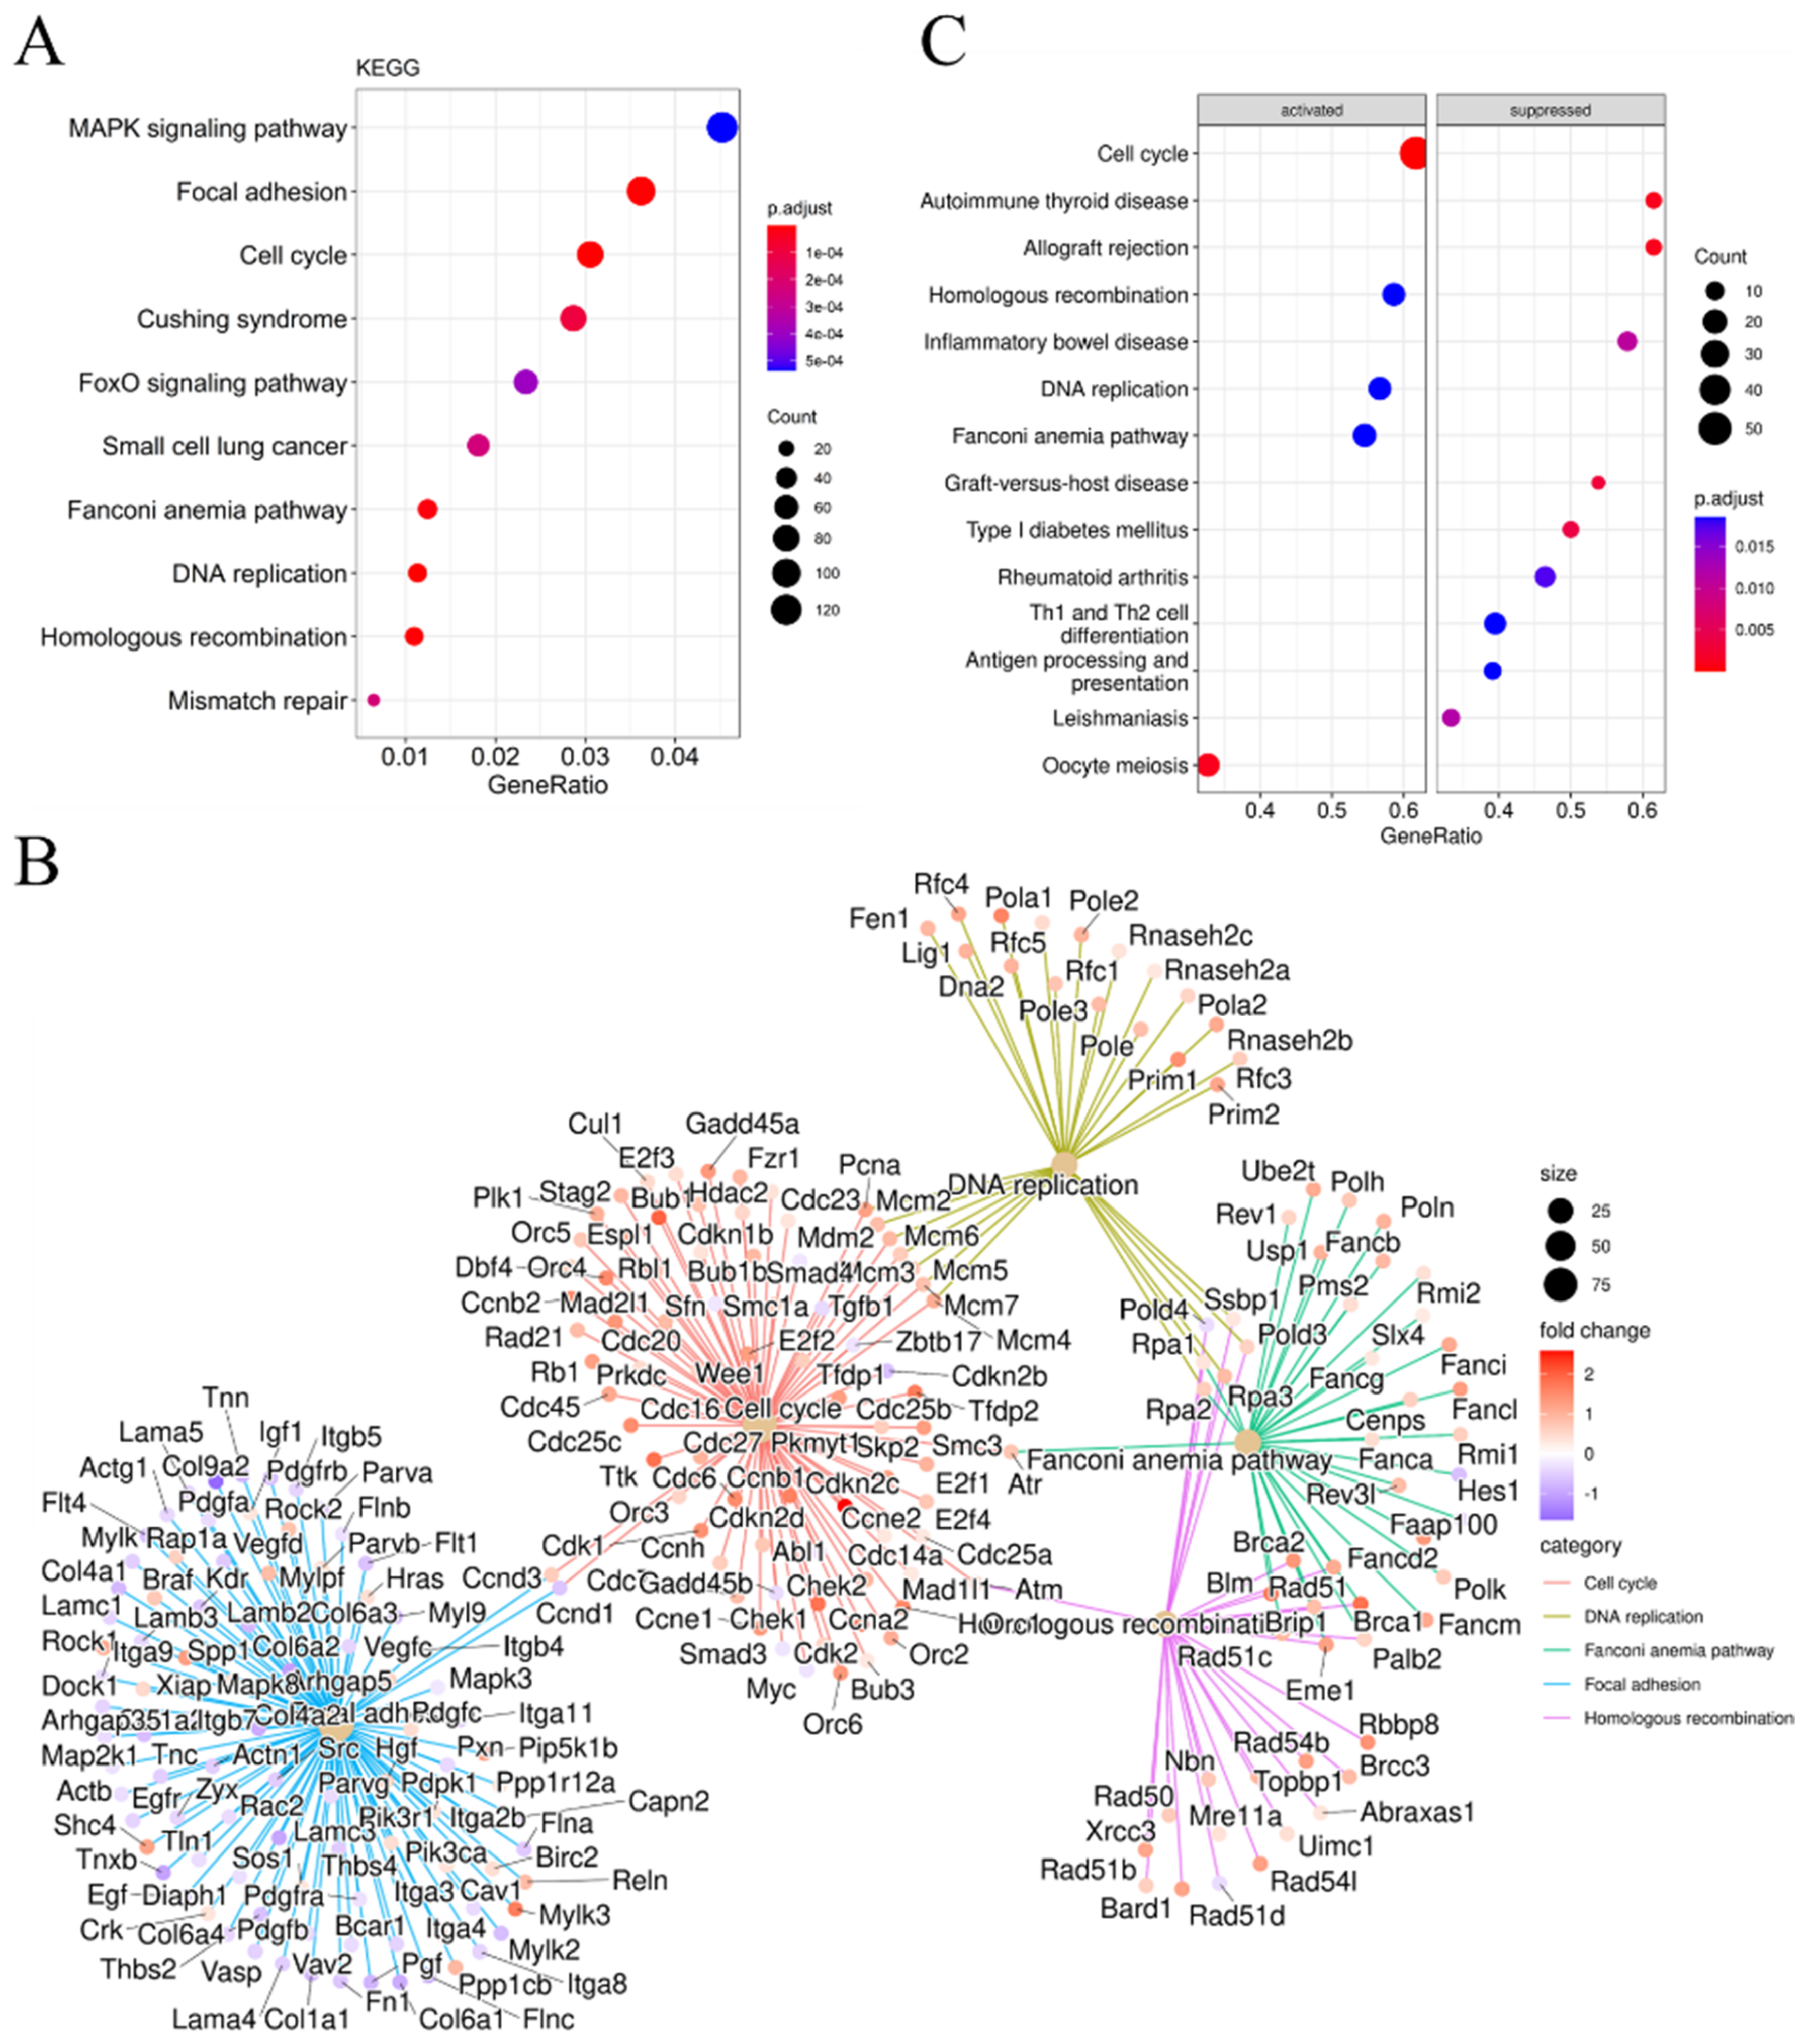
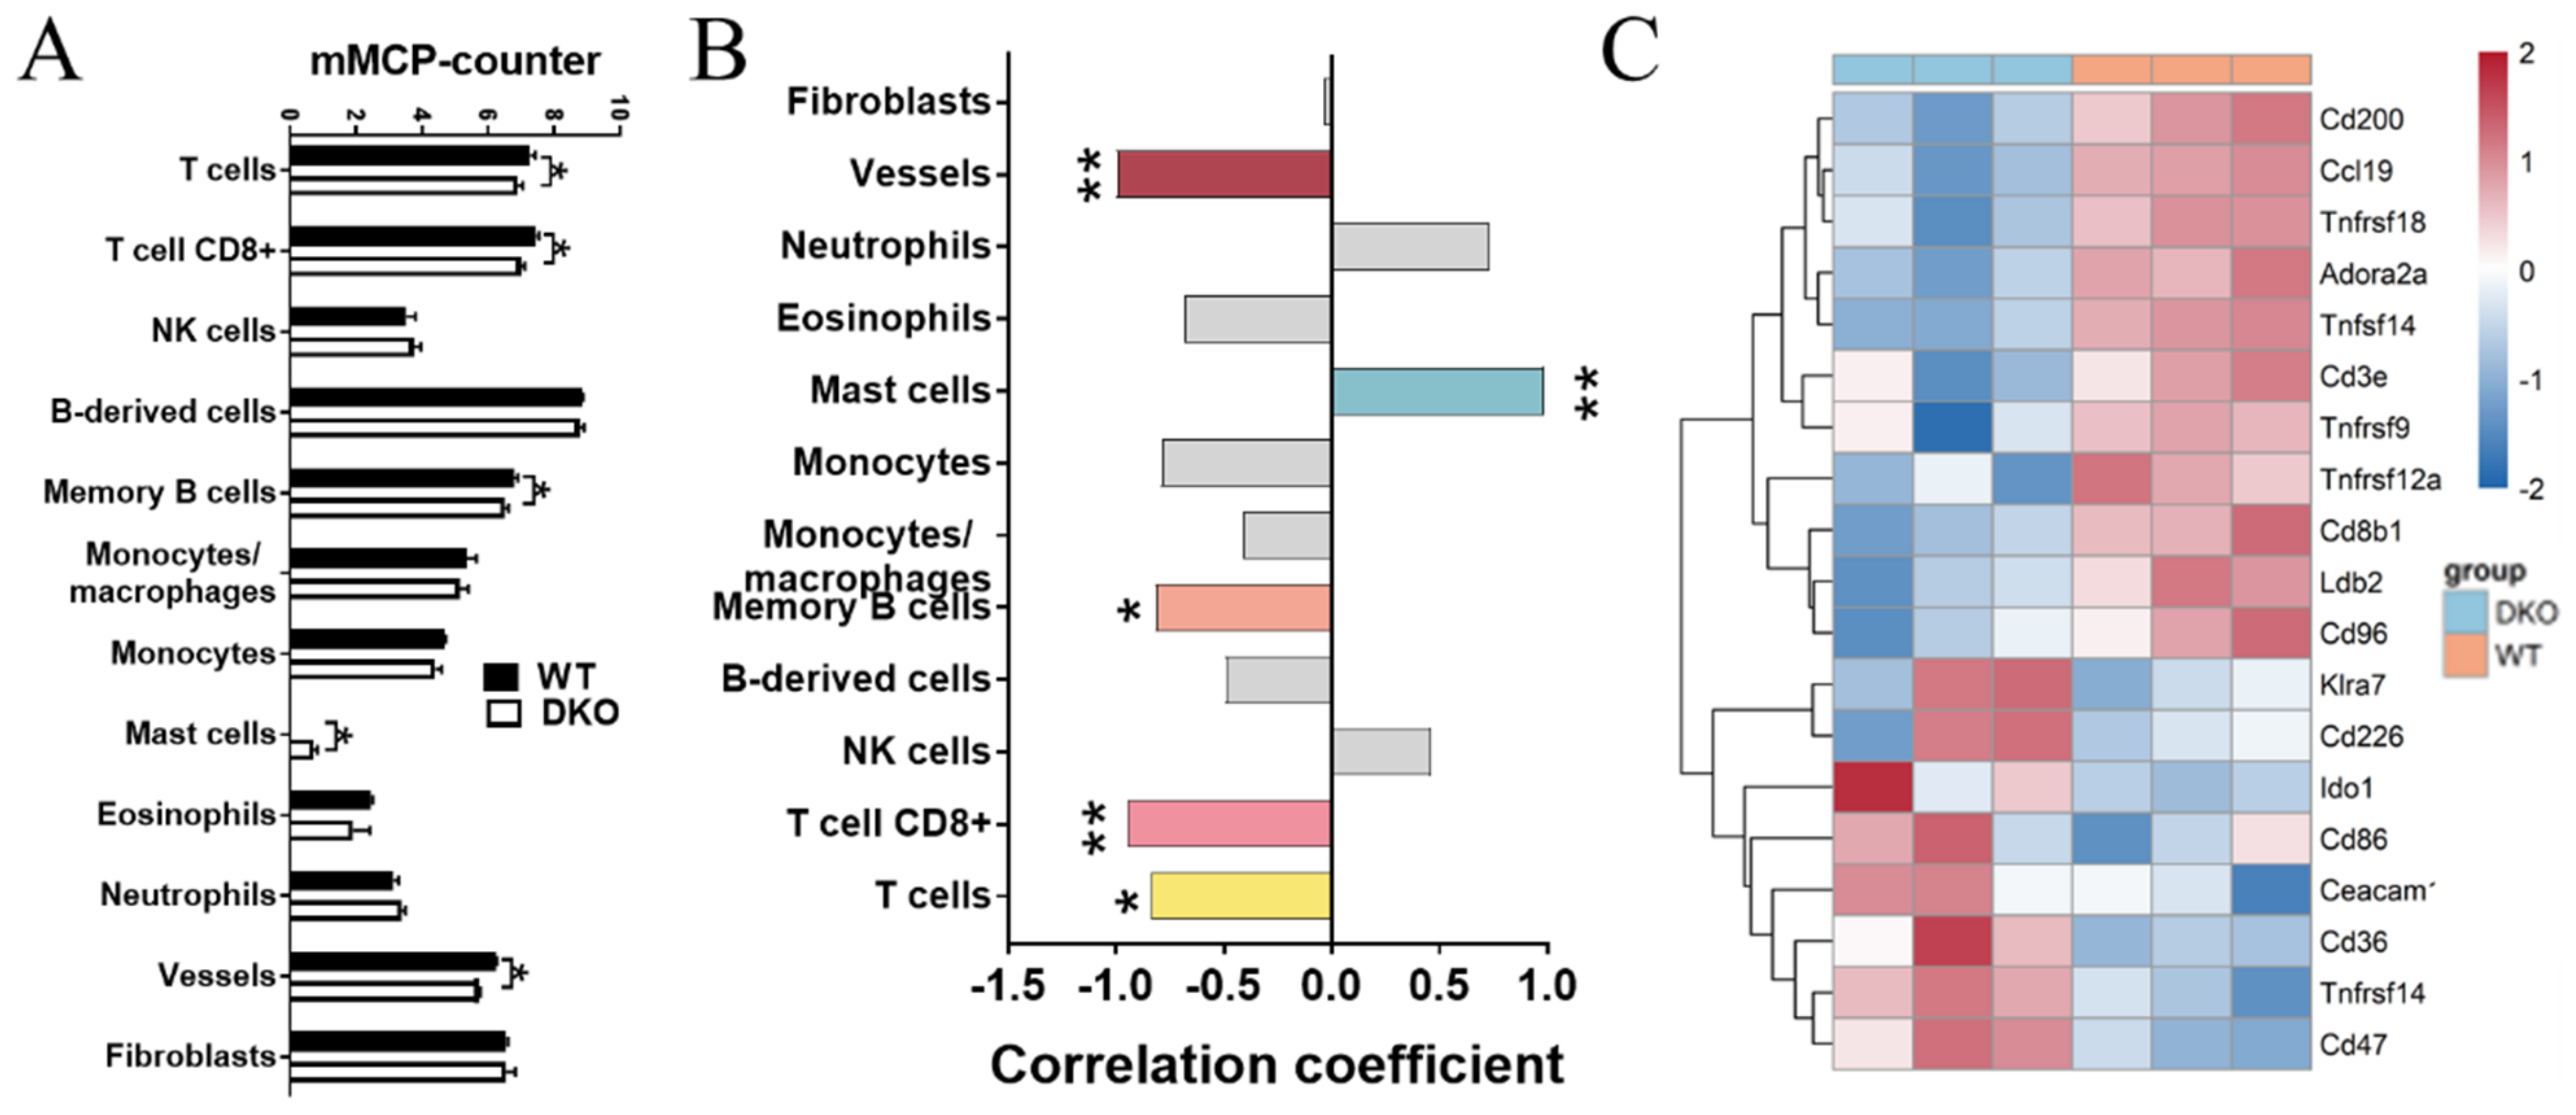
2.4. Differences in the Immune Microenvironment and Immune-Related Signatures between the DKO and WT Mice Spleen Based on Transcriptome Analysis

We then calculated and investigated the correlation between Per1/Per2 score (DKO: 0; WT: 1) and immune cell infiltration based on 14-month-old mice spleen transcriptome data using the R package “mMCP-counter” (Murine Microenvironment Cell Population counter) [15]. We found that the DKO mice had lower numbers of immune cells (T cells, CD8 T cells, and memory B cells) and stromal cells (vessels) (Figure 5A,B), consistent with our flow cytometry results (Figure 2). We further examined the relationship between the Per1/Per2 score and the expression level of immune checkpoint genes. Notably, CD200 [16], a classic immune checkpoint that is expressed on the cell surfaces of B cells and activated T cells, was down-regulated in the DKO mice (Figure 5C). In contrast, CD36, which could mediate ferroptosis and dampen intratumoral CD8+ T cell effector functions to impair their antitumor ability, was up-regulated [17]. Thus, Per1/Per2 DKO could cause a massive loss of immune cells in the spleen of 14-month-old mice.

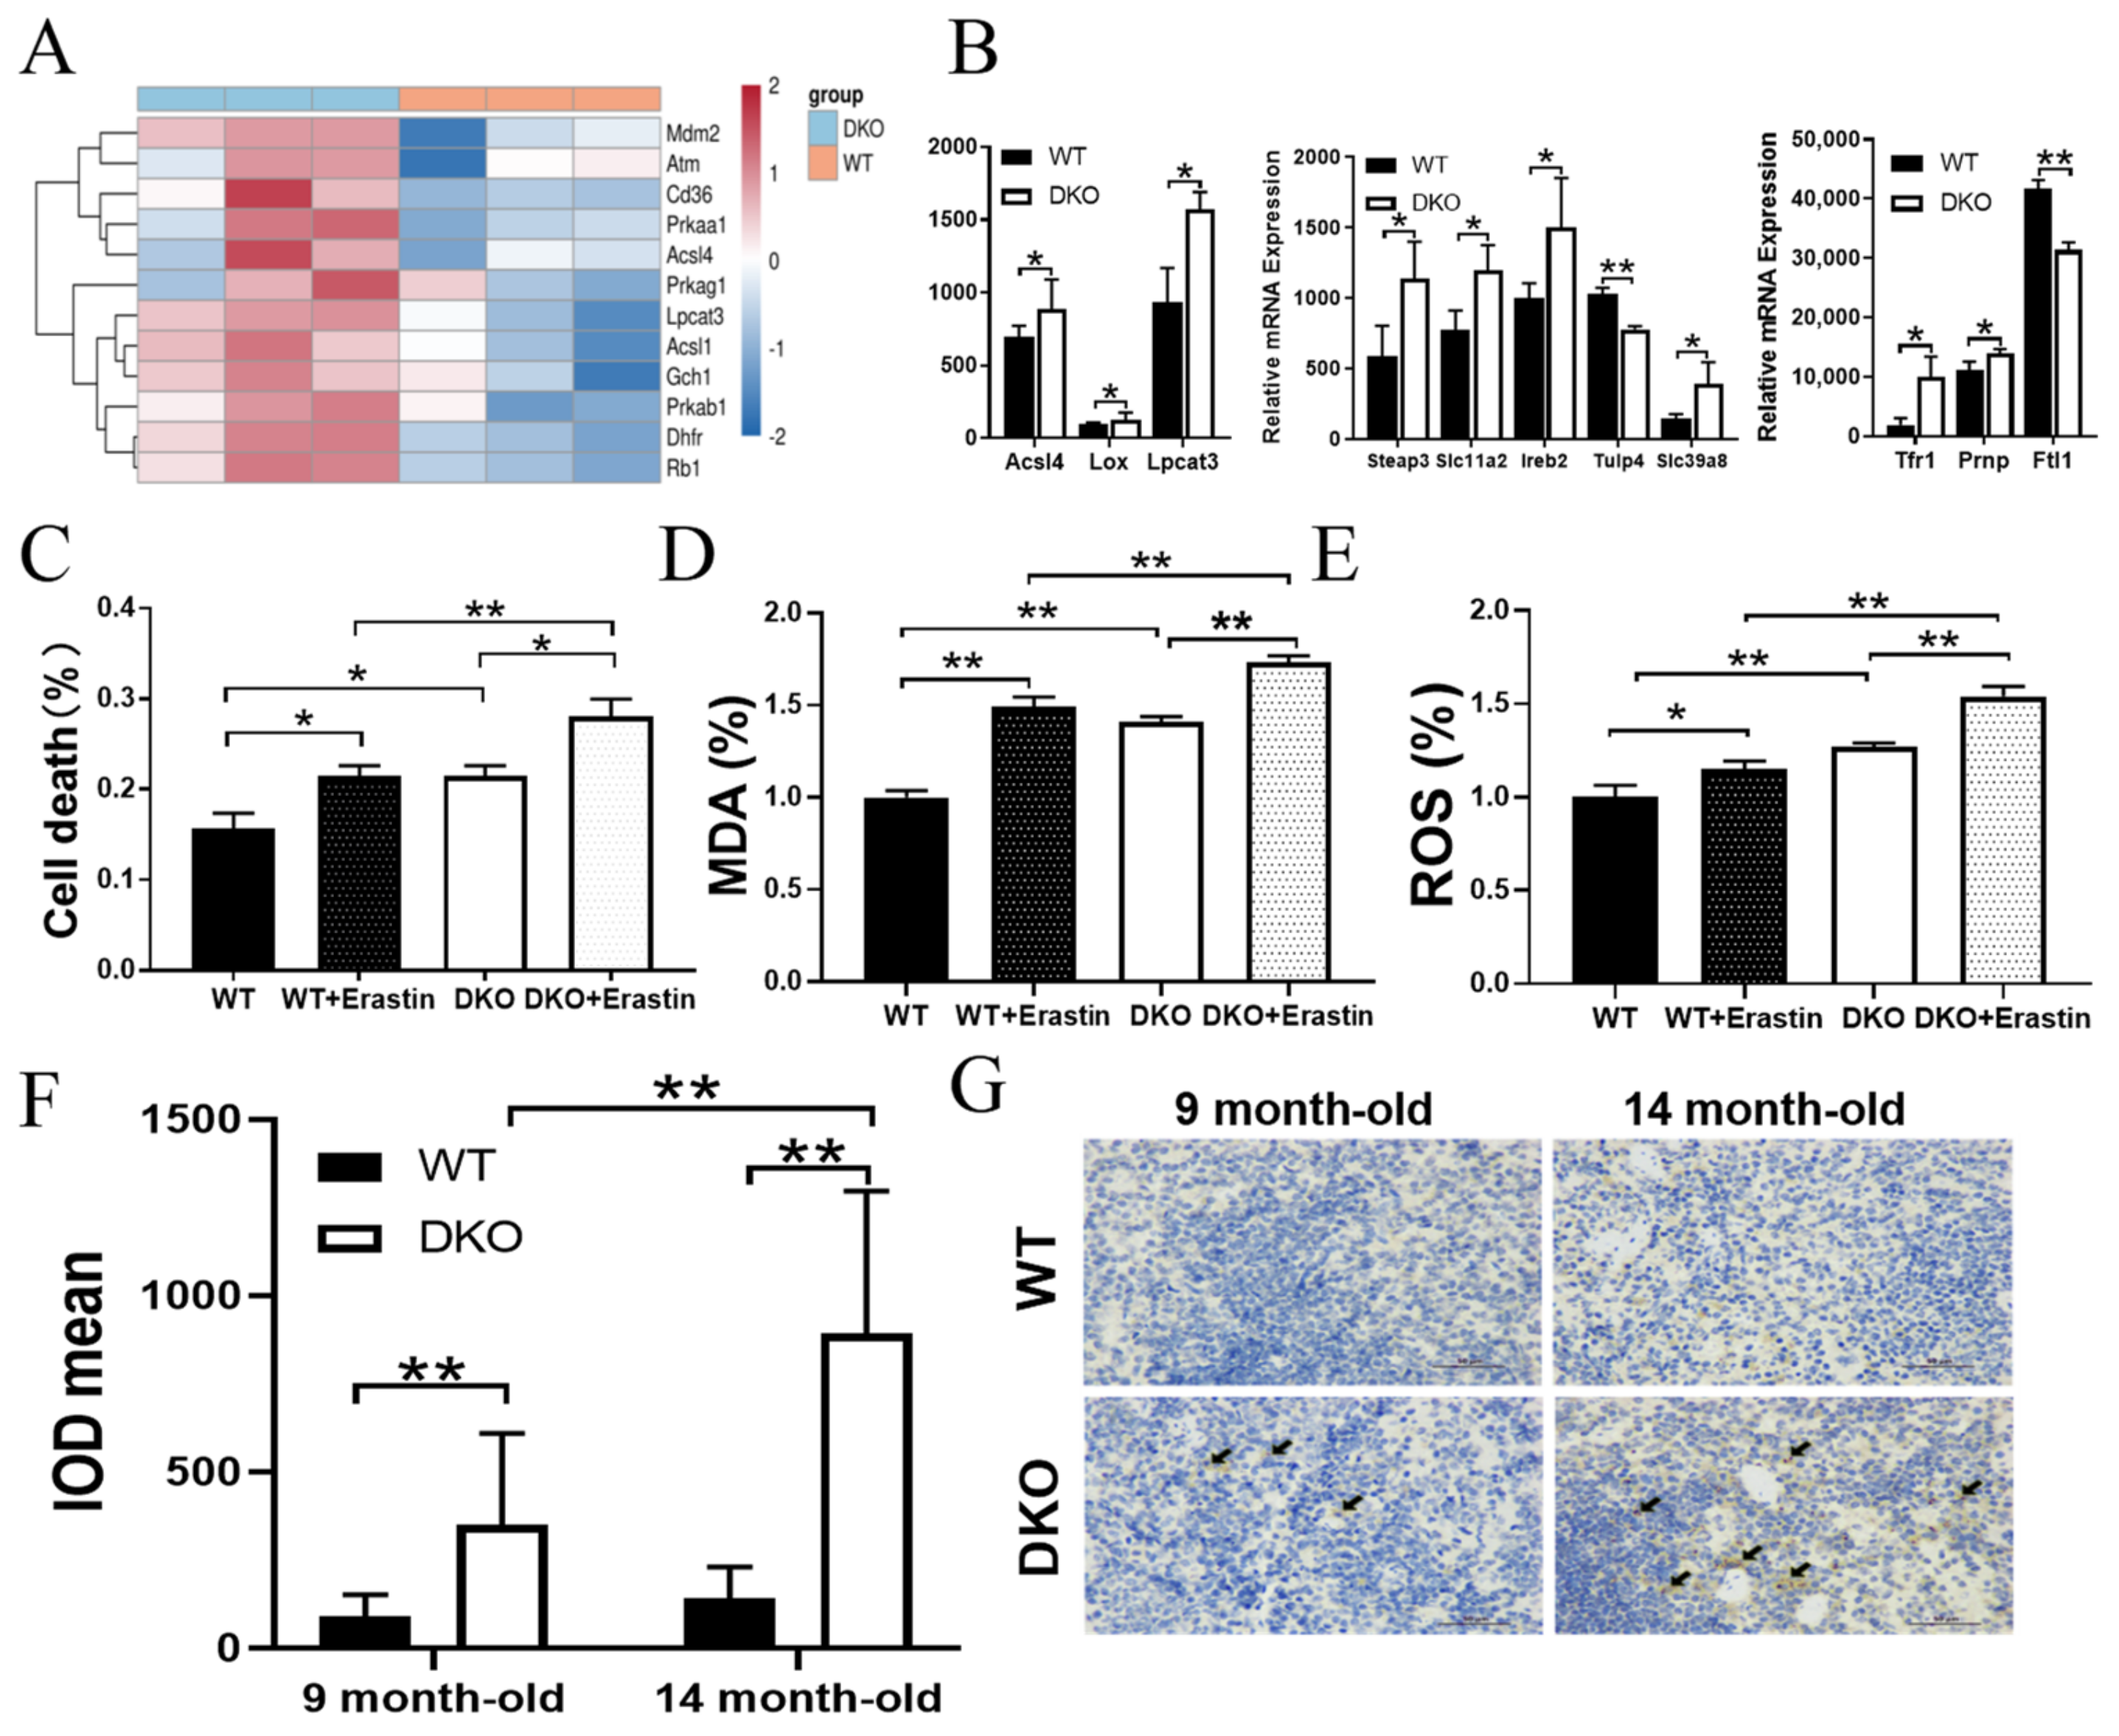
2.5. Per1/Per2 Knockout Activated Ferroptosis in the Spleen of 14-Month-Old Mice

Analyzing the ferroptosis-inducing genes in the spleen cells of 14-month-old DKO and WT mice (Figure 6A), we observed that most ferroptosis activators, including Prkaa1, Prkab1, Prkag1, Cd36, Acsl1, Dhfr, Gch1, Rb1, Mdm2, and Atm, were up-regulated in the DKO mice. Next, we analyzed the lipid peroxidation-related genes and iron metabolism genes (Figure 6B). The results indicated that the expression levels of Acsl4, Lpcat3, lipoxygenase (Lox), Tfr1, Prnp, Steap3, slc11a2, Ireb2, and Slc39a8 [18] were higher in the DKO mice than in WT mice. In contrast, the iron storage genes Ftl1 and Tulp4 [19] were down-regulated in the DKO mice compared with the WT mice (p < 0.05, Figure 6B and Table S1).
Compared with WT, the splenic lymphocyte mortality, MDA levels, and ROS levels were increased significantly in DKO mice (p < 0.05, Figure 6C–E). In addition, these indicators in primary lymphocytes of DKO mice stimulated with erastin (one of the activators of ferroptosis) incubation were significantly higher than those of similarly stimulated primary lymphocytes of WT mice (p < 0.05; Figure 6C–E). These results indicated that the spleens of DKO mice were more susceptible to oxidative damage.
Immunohistochemical staining of TFR1 in spleen sections obtained from 9- and 14-month-old DKO and WT mice (Figure 6F,G) indicated that TFR1 expression was significantly higher in DKO than in WT spleen tissues. In addition, the spleen sections from 14-month-old mice had significantly higher TFR1 levels than those of 9-month-old mice.

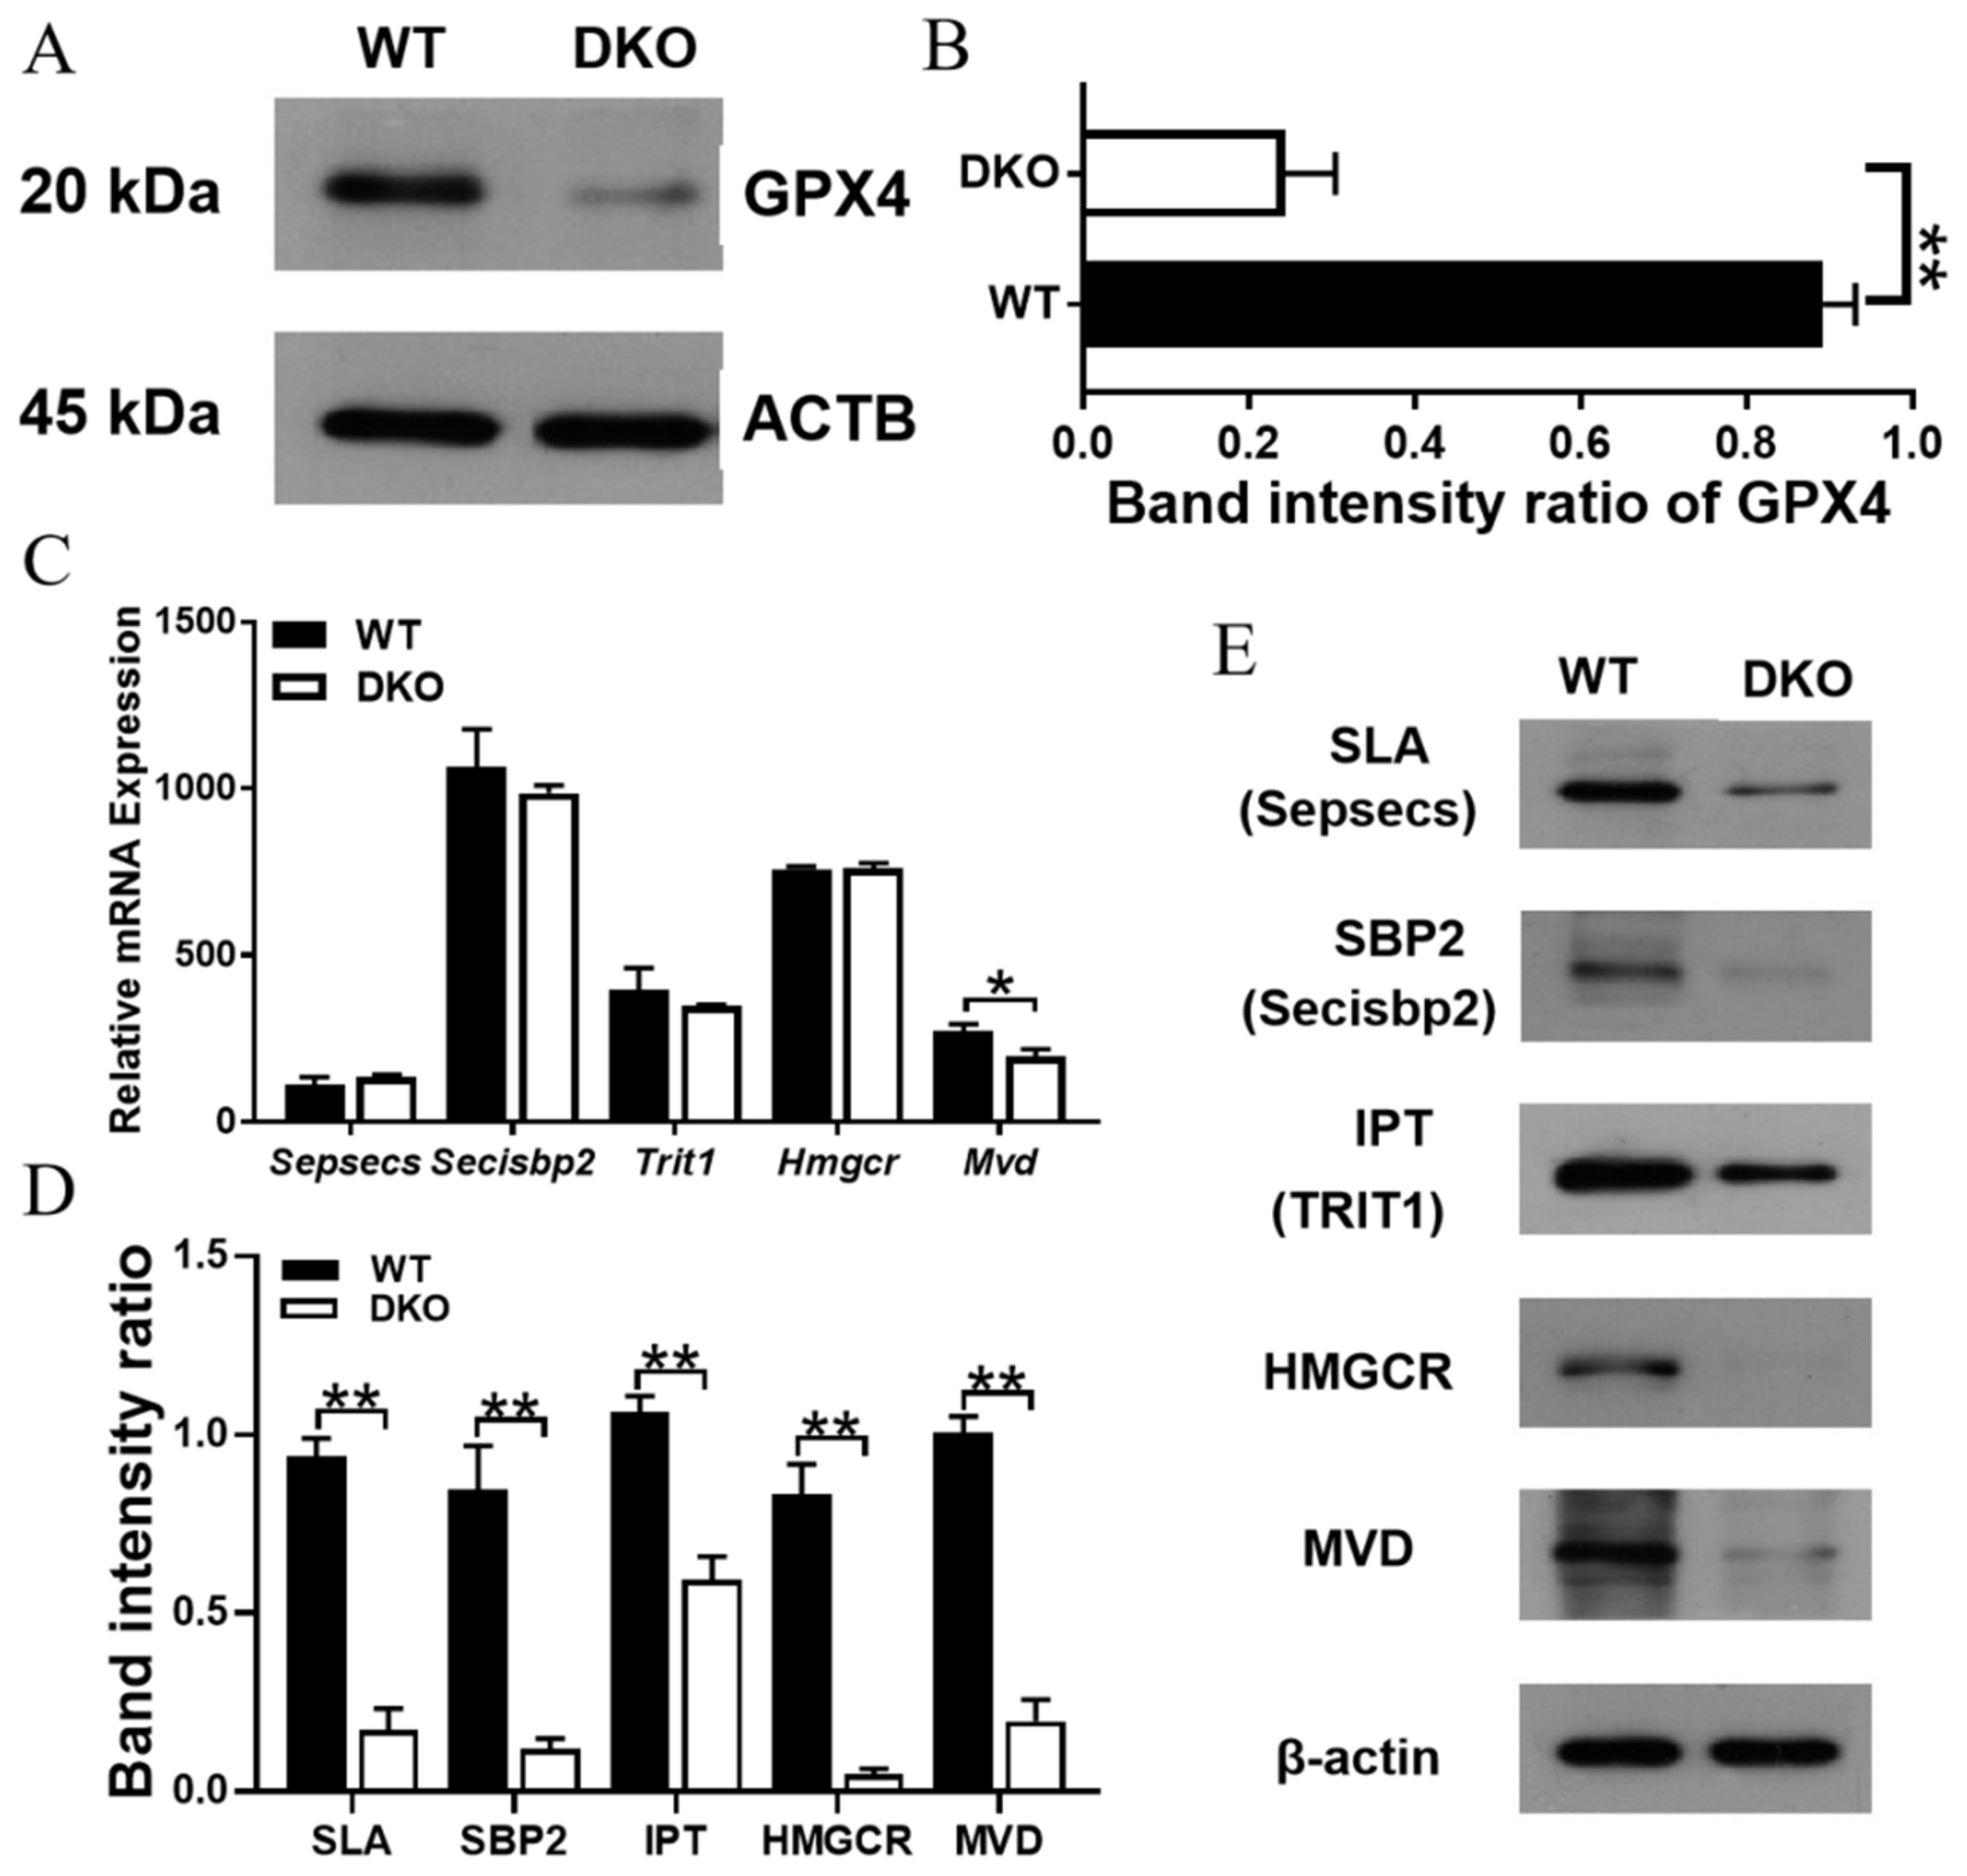
2.6. Per1/Per2 DKO Promotes Ferroptosis in the Spleen of 14-Month-Old Mice

Western blot analysis indicated that the levels of GPX4, a key regulator of ferroptosis, were significantly lower in the splenic lymphocytes of 14-month-old DKO mice than in those of WT mice (p < 0.01; Figure 7A,B). In addition, the transcriptome levels of Hmgcr, Mvd, Trit1 (IPT), Sepsecs (SLA), and Secisbp2 (SBP2) genes were not changed, except Mvd (Figure 7C, Table S1), but the levels of corresponding proteins were down-regulated in 14-month-old DKO mice spleens as compared to those in 14-month-old WT mice spleens (p < 0.05; Figure 7D,E). RT-PCR and RNA sequencing analyses indicated that Rorγ and Srebp2 were also down-regulated in DKO mice (Figure S4, Table S1).

3. Discussion

Previous studies have demonstrated the impact and regulatory influence of circadian rhythms on immune functions [20]. In addition, the age-related declines in cellular immune functions and humoral immune responses may partly explain the increased prevalence and severity of infectious diseases, and the impaired effectiveness of immunization in the elderly [21]. Circadian rhythms act to optimize physiological activities and metabolic health via temporal coordination of cell function, tissue function, and behavior. However, these internal rhythms weaken with age, thus affecting the body’s metabolism and immunity [22,23]. Nonetheless, the impact of age-related long-term circadian rhythm disturbances on spleen immune function are unclear. Hence, the current study demonstrated the effects of double-knockout Per1/Per2 on the spleen’s immune functions in mice aged 14 months. We observed that 4- and 9-month-old DKO mice had fairly normal spleen structures, and that thinning of the spleen WP and blurring of the marginal area occurred only in 14-month-old DKO mice, suggesting that the Per1/Per2 knockout effects on the spleen tissue merged with age.
The interactions between T and B lymphocytes are central to the regulation of immune functions [24]. Flow cytometry and immune cell infiltration analyses showed that the numbers of T and B lymphocytes in the spleen of 14-month-old DKO mice were significantly lower than those in the spleen of WT mice of the same age. This indicates that long-term circadian disturbances could affect lymphocyte numbers and immune functions in mice. We also found that the numbers of mast cells were significantly higher in the spleens of DKO mice than of those in the spleens of WT mice [25]. Mast cells are driven by circadian clocks and allergic responses [26,27]. The abnormal production of mast cells results in the development of allergies [28]. Thus, this result suggests that long-term circadian abnormalities could predispose individuals to develop allergies, not only by activating mast cells in the spleen, but also but also by causing mastocytosis, both of which cause oxidative stress and heightened inflammatory responses. However, the detailed mechanisms of these processes need to be further explored.
We then analyzed DEmRNAs based on transcriptome sequencing data, followed by pathway analysis. GO analysis indicated that most of the DEGs identified were involved in DNA damage repair-related pathways, including DNA repair (GO-BP), ATPase activity (GO-MF), and chromosomal region (GO-CC). KEGG and GSEA analyses indicated that genes related to immuno-regulation and oxidative stress resistance were also enriched. Research indicated that in radiation therapy for tumors, DNA damage is rapidly detected by the ATM (ataxia telangiectasia-mutated gene) and ATR (ataxia telangiectasia and Rad3-related) serine/threonine kinases. These kinases initiate the DDR (DNA damage response) signaling cascades that activate the downstream checkpoint kinases 1/2 (CHEK1/2), which then arrest the cell cycle so that the DNA can be repaired [29]. Oxidative DNA damage can also lead to ferroptosis, caused by CD36-mediated PUFA uptake [30,31], acetyl-CoA carboxylase (ACAC)-dependent PUFA synthesis [32], or lipophagy-induced PUFA production [33]. At the molecular level, multiple regulators may be involved in ATM- or p53-mediated crosstalk between ferroptosis and other regulated cell death (RCD) responses that are activated when DSBs occur [14].
Transcriptomic analysis indicated that the expression levels of ATM, ATR, CHEK1/2, CD36, RB, ACSL4, and LPCAT, which are involved in detecting/repairing DNA damage and mediating ferroptosis [14], were significantly up-regulated in the DKO mice (Table S1). It is worth noting that we obtained similar expression profiles comparing the spleen tissues of DKO mice to tissue exposed to radiation therapy used to treat tumors. Our results indicate that long-term disturbances in circadian rhythms damage the spleen in a similar way to how radiotherapy damages tumor cells—by activating ferroptosis via oxidative damage and decreased immune function.
We next explored the molecular mechanism that connect the loss of Per1/Per2 gene expression with the occurrence of ferroptosis in the spleen cells of aging mice. It is known that ROS and MDA production promote cell death via ferroptosis [34,35], and that both are signals produced by aging bodies [36] in response to abnormal circadian rhythms [37]. In our study, spleen cell mortality and levels of ROS, and MDA were all significantly higher in DKO spleen lymphocyte than in WT spleen lymphocyte. In addition, the spleen lymphocytes from DKO mice were more sensitive to erastin than those of WT mice, which indicates that the loss of Per1/Per2 reduces spleen lymphocyte tolerance to oxidative damage. Correspondingly, the up-regulation of Tfr1, Prnp, Steap3, and Slc39a8 in 14-month-old DKO mice showed that iron metabolism and iron transport were enhanced in the spleens of the DKO mice. In addition, the down-regulation of Ftl1 and Tulp4 in these mice indicated abnormal iron storage, which could increase the production of ROS in the spleen cells due to the Fenton reaction [19,38].
Research by Tang et al. [39] indicated that SQSTM1 is responsible for autophagic degradation of ARNTL/BMAL1. The degradation of ARNTL can promote EGLN2 (Egl-9 family hypoxia inducible factor 2) transcription, which leads to the proteasomal degradation of HIF1A. The decrease in HIF1A levels limits lipid storage and promotes lipid peroxidation and ferroptosis. In our study, the expression levels of ARNTL/BMAL1, SQSTM1, and EGLN2 were significantly lower in 14-month-old DKO mice than those in WT mice; however, the expression level of HIF1A remained unchanged (Figure S5A,B and Table S1). We found that the Ube2o (ubiquitin-conjugating enzyme E2 O) [40] and Ube3a (ubiquitin protein ligase E3A) [41] genes (both of which inhibit ARNTL levels) and Sumo1 and Sumo2 [42] genes (both of which protect the stability of HIF-1α protein) were up-regulated in the spleens of DKO mice (Figure S5B). Thus, we predict that ferroptosis in the spleens of DKO mice may not be triggered by the clock gene, and that other molecular mechanisms may be responsible for ferroptosis.
The accumulation of iron-dependent lipid peroxidase [43,44], which can detoxify lipid peroxides and maintain them at non-toxic levels, is an important defense against ferroptosis. There is a constant battle between anti-ferroptosis systems (including both GPX4-dependent and -independent systems) and pro-ferroptosis systems (including PUFA-PL metabolism and peroxidation, and iron metabolism). At the transcriptome level, we found that pro-ferroptosis genes such as Acsl4 and Lpcat3 were significantly up-regulated in the DKO mice, whereas the expression levels of GPX4 were unchanged. To confirm whether Per1/Per2 DKO affects spleen ferroptosis defense systems, we investigated the expression levels of GPX4 protein. Our results indicated that the expression levels of GPX4 proteins, upstream of the RORγ-SREBP2 pathway, and those of the mevalonate pathway were significantly lower in DKO mice than in WT mice. The levels of key enzymes such as HMGCR, MVD, TRIT1, and SBP2 were also lower in DKO mice than in WT mice. This indicates that Per1/Per2 DKO-induced circadian disruption can inhibit the translation of GPX4; this affects the ferroptosis defense systems in the spleen and predisposes the spleen cells to death via ferroptosis.
Studies have revealed that ferroptosis plays a direct role in the immune response, and that immune cells undergo ferroptosis under specific conditions, causing impaired immune activity [45]. These facts, combined with our work, lead us to believe that immune cell ferroptosis increased in Per1/Per2 DKO mice in old age (14 months), and is responsible for the decreases in immune cell numbers, affecting the spleen’s immune function in mice. However, the C57BL/6J strain of mice used in our work is deficient in the biosynthesis of melatonin, an important effector of circadian clocks in the brain and retina, which might have affected our results [46]. Hence, in future studies, our experiments need to be replicated in other mice strains to further elucidate the impacts of circadian rhythm disturbances on the spleen’s immune functions.

4. Materials and Methods

4.1. Animals

C57BL/6J mice with knockout of the Per1 and Per2 genes (DKO, n = 20) were bred from Per1+/−/Per2+/− heterozygotes (purchased from the Experimental Animal Center of Soochow University), as described previously [47]. Mice aged 4, 9, and 14 months were housed in a clean laboratory environment at a room temperature of 22 ± 2 °C, relative humidity of 60 ± 10%, and a 12 h light/12 dark cycle at a density of 2–3 mice per cage. Mice had access to laboratory chow and water ad libitum. This experiment was carried out according to the Guidelines for the Care and Use of Experimental Animals and approved by the Experimental Animal Ethics Committee of Wuhan Light Industry University (ID: 20210705006). At the end of the experiment, mice were fasted for 12 h and sacrificed by CO2 asphyxiation. Blood was collected in heparin sodium EP tubes (1.5 mL) and stored at 4 °C. Spleens were harvested, weighed, and cut into two portions, with one portion stored at −80 °C for transcriptome analysis and the other fixed with 4% paraformaldehyde and embedded in paraffin for histological studies.

4.2. Histological Study and Immunohistochemical Staining

4.2.1. Histology

Paraformaldehyde-fixed, paraffin-embedded tissue was dehydrated with an ethanol gradient and sliced into thin sections by microtome for hematoxylin–eosin (HE) staining. Histopathological changes were observed by the OLYMPUS-BX51 microscope.

4.2.2. Immunohistochemistry

Sections were dewaxed, incubated with 3% H2O2 at room temperature to eliminate endogenous peroxidase activity, washed with distilled water, soaked in 1× phosphate-buffered saline (PBS), and sealed with 5–10% normal goat serum before incubation with anti-TFR1 antibody (1: 1000, 10084-2-AP, Proteintech, Rosemont, IL, USA) overnight at 4 °C. Following a wash with PBS, HRP-labeled secondary antibody was added with incubation at 37 °C. The tissue was washed with PBS and re-stained with DAB chromogenic agent. Immunohistochemical changes were observed by the OLYMPUS-BX51 microscope.

4.3. Flow Cytometry

All spleens were removed under sterile conditions; the spleen capsule was excised and the tissue was cut into small pieces with ophthalmic scissors. Spleen tissue was ground with a syringe piston on a cell filter screen after the addition of buffer. After grinding, the screen was washed with tissue diluent to collect the cell suspension and filter. Spleen lymphocytes were prepared from a 108~109 cells/mL suspension using a mouse spleen lymphocyte isolation kit, according to the manufacturer’s instructions. Blood was diluted with buffer (1:1) and mononuclear cells were isolated using a mouse blood lymphocyte isolation kit, according to the manufacturer’s instructions. Cell suspensions (108~109 cells/mL) were incubated with FITC anti-mouse CD3+ monoclonal, PE anti-mouse CD4+ monoclonal, APC anti-mouse CD8+ monoclonal, and APC anti-mouse CD19 monoclonal antibodies (all from Biolegend, USA) according to the manufacturer’s instructions and detected by a BECKMAN COULTER CytoFLEX flow cytometer. All data were analyzed by Kaluza.2.1 software (version: 2.1) (Becton Dickinson Beckman Coulter, Brea, CA, USA), and at least 10,000 events/samples were obtained.

4.4. BGISEQ-500 RNA-Seq

Spleen transcriptome sequencing of 14-month-old WT and DKO mice was commissioned to BGI Medical Laboratory Co., Ltd. Total RNA was extracted from the spleen samples of each mouse and three samples from each group were pooled (100 mg/sample). RNA integrity was confirmed using an Agilent 2100 bioanalyzer before cDNA library construction.
Target sequences were purified and enriched by PCR amplification and samples from Qubit quantitative PCR were pooled to make a single-stranded DNA loop (ssDNA loop) for library construction. Replication of ssDNA was used to generate DNA nanospheres and amplify the fluorescence signal during sequencing. DNA was loaded into a graphical nanoarray, and a 50 bp single-ended read was taken on the BGISEG-500 platform for subsequent data analysis studies.
Reference genome data were derived from the NCBI database (Mus musculus version GCF_000001635.26_GRCm38.p6 https://www.ncbi.nlm.nih.gov, accessed on 29 December 2020). The differential gene expression was analyzed by edgeR (version 3.34.1). Differentially expressed genes (DEGs) met the following criteria: log2 (fold change) > 0.1; p-value < 0.05. GO, KEGG, and GSEA pathway enrichment analyses were performed. The R package “mMCP-counter” (version 1.1.0) was used to quantify immune and stromal cell populations.

4.5. Cell Culture

A 108–109 cells/mL suspension of spleen lymphocytes was prepared from 14-month-old WT and DKO mice, cultured in RPMI 1640 medium containing serum (10,491, Solarbio, Beijing, China). Lymphocytes were incubated with PBS (pH 7.4) for 12 h as the control group, and 0.5 µM erastin (HY-15763, MCE, Princeton, NJ, USA) for 12 h as the experimental group according to the manufacturer’s instructions. Cell mortality was measured with Trypan blue solution (72-57-1, Solarbio, Beijing, China).

4.6. MDA and ROS Assays

4.6.1. MDA

Following incubation with erastin and PBS, lymphocytes were sonicated to disrupt the cell integrity and MDA was measured using a malondialdehyde (MDA) detection kit (BC0025, Solarbio, Beijing, China), according to the manufacturer’s instructions. The assay relies on the reaction between MDA and thiobarbituric acid (TBA) to generate an MDA–TBA adduct. Absorbances were simultaneously measured at 600 nm, 532 nm, and 450 nm, and MDA content was calculated from the absorbance differentials.

4.6.2. ROS

Following incubation with erastin and PBS, 106 cells/mL lymphocytes were suspended in diluted DCFH-DA and incubated at 37 °C for 20 min before washing three times with serum-free cell culture solution. An ROS detection kit was used (CA1410, Solarbio, Beijing, China), according to the manufacturer’s instructions, with flow cytometry to detect and calculate ROS levels.

4.7. Western Blot Analysis

Total protein was extracted and quantified using a BCA protein assay kit (A8020, Solarbio, Beijing, China) and mixed with sample buffer in a ratio of 1:1 (v/v). Samples were incubated in boiling water for 5 min, and 30 mg of protein from each sample were separated by 12.5% SDS-PAGE gel electrophoresis at a constant voltage (120 V) and transferred to a PVDF membrane. The membrane was sealed with 5% skim milk and incubated overnight at 4 °C with the primary antibodies shown in Table S2. β-actin was used as a loading control. Optical densities were analyzed quantitatively by Image J software.

4.8. qPCR Analysis

Lymphocyte total RNA was extracted using Trizol reagent and concentrations were assessed by measurements of absorbance at 260/280 nm. cDNA was synthesized from 5 µg total RNA using SuperScript IV reverse transcriptase, and quantitative PCR was performed in a total volume of 20 µL with 300 nM reverse and forward primers (Table S3) using a CFX96 real-time PCR system (Bio-RAD, Hercules, CA, USA). Thermal cycling conditions were as follows: 2 min at 50 °C, 3 min at 95 °C, 40 times at 95 °C for 15 s, 60 times at 30 °C, 72 times at 30 °C. Target mRNA was normalized to the expression of β-actin, and fold changes were expressed by 2−ΔΔCt values. The purity of the PCR product was verified by the melting curve.

4.9. Statistical Analysis

All data are presented as means ± SD with normal distribution. The significant differences between DKO and WT mice in transcriptome expression levels of all genes were annotated according to the results of differential gene analysis using the R package “edgeR” (version 3. 34.1), shown in Figure 6B, Figure 7C and Figure S4 (RNA-seq), and Figure S5B; the predicted cor_pvalue for immune cells is based on the calculation of the R package “mMCP-counter” (version 1.1.0). The significant differences among four groups were determined by one-way ANOVA using GraphPad Prism (version 7.0), shown in Figure 6 C–E. The significant differences between two groups were determined by the multiple t test-one per row using GraphPad Prism (version 7.0), shown in Figure 1A,B, Figure 2, Figure 5A, Figure 6F, Figure 7B,D and Figure S4 (RT-qPCR), and Figure S5B. Differences were considered statistically significant if p < 0.05.

5. Conclusions

In summary, knockout of the circadian rhythm genes, Per1 and Per2, induced the expression of DNA damage repair genes and increased the incidence of ferroptosis in spleen lymphocytes. These processes changed the expression profiles of several genes in the following manner: (1) increased expression of Cd36, Acsl4, Acsl1, and Lpcat3, which up-regulated PUFA-PL and PUFA-ePLs synthesis; (2) increased expression of TFR1 and other iron transport proteins, which led to an increase in the levels of ferritin-bound iron into the labile iron pool, thereby sensitizing cells to ferroptosis; (3) increased the expression of Rb, Atm, Atr, and Ampk, which up-regulated SLC7A11 and SLC3A2, and suppressed GPX4; (4) decreased Rorγ activity, which inhibited the expression of Srebp2, and decreased the expression levels of HMGCR, MVD, TRIT1, and SBP2 proteins, which in turn suppressed GPX4 RNA translation.

Supplementary Materials

The following supporting information can be downloaded at: https://0-www-mdpi-com.brum.beds.ac.uk/article/10.3390/ijms232112962/s1.

Author Contributions

Conceptualization, Z.L. and R.H.; methodology, Z.L. and R.H.; validation, R.H. and S.Z.; data curation, X.Y., J.W., F.W., Y.Q., W.Z., and F.R.; writing—original draft preparation, R.H., S.Z., and J.Y.; writing—review and editing, Z.L. and R.H.; visualization, R.H. and S.Z. All authors have read and agreed to the published version of the manuscript.

Funding

This research was funded by the National Natural Science Foundation of China (grant no. 31271855), the Major Scientific and Technological Research Project of Tianjin (grant no. TSBICIP-KJGG-010), the Central Government Guides Local Science and Technology Development Projects (grant no. 2019ZYYD 032), and the State Key Laboratory of Biocatalysis and Enzyme Engineering Project (SKLBEE2021018).

Institutional Review Board Statement

The study was approved by the Experimental Animal Ethics Committee of Wuhan Polytechnic University (ID: 20190709003).

Data Availability Statement

The data presented in this study are available on request from the corresponding author.

Acknowledgments

We are grateful to Ying Xu (CAM-SU Genomic Resource Center, Soochow University, China) for providing Per1/Per2 DKO mice and technical support.

Conflicts of Interest

The authors declare no conflict of interest. The funders had no role in the design of the study; in the collection, analyses, or interpretation of data; in the writing of the manuscript, or in the decision to publish the results.

References

  1. Bass, J.; Takahashi, J.S. Circadian integration of metabolism and energetics. Science 2010, 330, 1349–1354. [Google Scholar] [CrossRef] [PubMed] [Green Version]
  2. Takeda, Y.; Kang, H.S.; Angers, M.; Jetten, A.M. Retinoic acid-related orphan receptor gamma directly regulates neuronal PAS domain protein 2 transcription in vivo. Nucleic Acids Res. 2011, 39, 4769–4782. [Google Scholar] [CrossRef] [PubMed] [Green Version]
  3. Zhao, C.; Gammie, S.C. The circadian gene Nr1d1 in the mouse nucleus accumbens modulates sociability and anxiety-related behaviour. Eur. J. Neurosci. 2018, 48, 1924–1943. [Google Scholar] [CrossRef] [PubMed]
  4. Chellappa, S.L.; Vujovic, N.; Williams, J.S.; Scheer, F. Impact of Circadian Disruption on Cardiovascular Function and Disease. Trends Endocrinol. Metab. 2019, 30, 767–779. [Google Scholar] [CrossRef] [PubMed]
  5. Konturek, P.C.; Brzozowski, T.; Konturek, S.J. Gut clock: Implication of circadian rhythms in the gastrointestinal tract. J. Physiol. Pharmacol. 2011, 62, 139–150. [Google Scholar]
  6. Yang, Y.; Zhang, J. Bile acid metabolism and circadian rhythms. Am. J. Physiol. Gastrointest. Liver Physiol. 2020, 319, G549–G563. [Google Scholar] [CrossRef]
  7. Mills, J.; Kuohung, W. Impact of circadian rhythms on female reproduction and infertility treatment success. Curr. Opin. Endocrinol. Diabetes Obes. 2019, 26, 317–321. [Google Scholar] [CrossRef]
  8. Logan, R.W.; McClung, C.A. Rhythms of life: Circadian disruption and brain disorders across the lifespan. Nat. Rev. Neurosci. 2019, 20, 49–65. [Google Scholar] [CrossRef]
  9. Cermakian, N.; Stegeman, S.K.; Tekade, K.; Labrecque, N. Circadian rhythms in adaptive immunity and vaccination. Semin. Immunopathol. 2022, 44, 193–207. [Google Scholar] [CrossRef]
  10. Gray, K.J.; Gibbs, J.E. Adaptive immunity, chronic inflammation and the clock. Semin. Immunopathol. 2022, 44, 209–224. [Google Scholar] [CrossRef]
  11. Xie, L.; Kang, H.; Xu, Q.; Chen, M.J.; Liao, Y.; Thiyagarajan, M.; O’Donnell, J.; Christensen, D.J.; Nicholson, C.; Iliff, J.J.; et al. Sleep drives metabolite clearance from the adult brain. Science 2013, 342, 373–377. [Google Scholar] [CrossRef]
  12. Aiello, I.; Fedele, M.L.M.; Roman, F.; Marpegan, L.; Caldart, C.; Chiesa, J.J.; Golombek, D.A.; Finkielstein, C.V.; Paladino, N. Circadian disruption promotes tumor-immune microenvironment remodeling favoring tumor cell proliferation. Sci. Adv. 2020, 6, eaaz4530. [Google Scholar] [CrossRef]
  13. Lewis, S.M.; Williams, A.; Eisenbarth, S.C. Structure and function of the immune system in the spleen. Sci. Immunol. 2019, 4, eaau6085. [Google Scholar] [CrossRef]
  14. Lei, G.; Mao, C.; Yan, Y.; Zhuang, L.; Gan, B. Ferroptosis, radiotherapy, and combination therapeutic strategies. Protein Cell 2021, 12, 836–857. [Google Scholar] [CrossRef]
  15. Becht, E.; Giraldo, N.A.; Lacroix, L.; Buttard, B.; Elarouci, N.; Petitprez, F.; Selves, J.; Laurent-Puig, P.; Sautes-Fridman, C.; Fridman, W.H.; et al. Erratum to: Estimating the population abundance of tissue-infiltrating immune and stromal cell populations using gene expression. Genome Biol. 2016, 17, 249. [Google Scholar] [CrossRef] [Green Version]
  16. Rutsche, D.; Michalak-Micka, K.; Zielinska, D.; Moll, H.; Moehrlen, U.; Biedermann, T.; Klar, A.S. The Role of CD200-CD200 Receptor in Human Blood and Lymphatic Endothelial Cells in the Regulation of Skin Tissue Inflammation. Cells 2022, 11, 1055. [Google Scholar] [CrossRef]
  17. Ma, X.; Xiao, L.; Liu, L.; Ye, L.; Su, P.; Bi, E.; Wang, Q.; Yang, M.; Qian, J.; Yi, Q. CD36-mediated ferroptosis dampens intratumoral CD8(+) T cell effector function and impairs their antitumor ability. Cell Metab. 2021, 33, 1001–1012.e1005. [Google Scholar] [CrossRef]
  18. Zhang, H.L.; Hu, B.X.; Li, Z.L.; Du, T.; Shan, J.L.; Ye, Z.P.; Peng, X.D.; Li, X.; Huang, Y.; Zhu, X.Y.; et al. PKCbetaII phosphorylates ACSL4 to amplify lipid peroxidation to induce ferroptosis. Nat. Cell Biol. 2022, 24, 88–98. [Google Scholar] [CrossRef]
  19. Zhou, B.R.; Liu, J.; Kang, R.; Klionsky, D.J.; Kroemer, G.; Tang, D.L. Ferroptosis is a type of autophagy-dependent cell death. Semin. Cancer Biol. 2020, 66, 89–100. [Google Scholar] [CrossRef]
  20. Ganz, F.D. Sleep and immune function. Crit. Care Nurse 2012, 32, e19–e25. [Google Scholar] [CrossRef] [Green Version]
  21. Pierzyna, M.; Twardoch, M.; Mazur, B. The aging of the immune system. Wiad. Lek. 2015, 68, 388–392. [Google Scholar] [PubMed]
  22. Vitlic, A.; Lord, J.M.; Phillips, A.C. Stress, ageing and their influence on functional, cellular and molecular aspects of the immune system. Age 2014, 36, 1169–1185. [Google Scholar] [CrossRef] [PubMed] [Green Version]
  23. Manoogian, E.N.C.; Panda, S. Circadian rhythms, time-restricted feeding, and healthy aging. Ageing Res. Rev. 2017, 39, 59–67. [Google Scholar] [CrossRef] [PubMed]
  24. LeBien, T.W.; Tedder, T.F. B lymphocytes: How they develop and function. Blood 2008, 112, 1570–1580. [Google Scholar] [CrossRef] [PubMed]
  25. Hallgren, J.; Gurish, M.F. Mast Cell Progenitor Trafficking and Maturation. Mast Cell Biol. Contemp. Emerg. Top. 2011, 716, 14–28. [Google Scholar] [CrossRef]
  26. Christ, P.; Sowa, A.S.; Froy, O.; Lorentz, A. The Circadian Clock Drives Mast Cell Functions in Allergic Reactions. Front. Immunol. 2018, 9, 1526. [Google Scholar] [CrossRef] [Green Version]
  27. Jackson, C.W.; Pratt, C.M.; Rupprecht, C.P.; Pattanaik, D.; Krishnaswamy, G. Mastocytosis and Mast Cell Activation Disorders: Clearing the Air. Int. J. Mol. Sci. 2021, 22, 11270. [Google Scholar] [CrossRef]
  28. Akin, C. Mast cell activation syndromes. J. Allergy Clin. Immunol. 2017, 140, 349–355. [Google Scholar] [CrossRef] [Green Version]
  29. Huang, R.X.; Zhou, P.K. DNA damage response signaling pathways and targets for radiotherapy sensitization in cancer. Signal Transduct. Target. Ther. 2020, 5, 60. [Google Scholar] [CrossRef]
  30. Bae, Y.S.; Oh, H.; Rhee, S.G.; Yoo, Y.D. Regulation of reactive oxygen species generation in cell signaling. Mol. Cells 2011, 32, 491–509. [Google Scholar] [CrossRef] [Green Version]
  31. Russo, M.W.; Hoofnagle, J.H.; Gu, J.; Fontana, R.J.; Barnhart, H.; Kleiner, D.E.; Chalasani, N.; Bonkovsky, H.L. Spectrum of statin hepatotoxicity: Experience of the drug-induced liver injury network. Hepatology 2014, 60, 679–686. [Google Scholar] [CrossRef]
  32. Swierczynski, J.; Goyke, E.; Korczynska, J.; Jankowski, Z. Acetyl-CoA carboxylase and fatty acid synthase activities in human hypothalamus. Neurosci. Lett. 2008, 444, 209–211. [Google Scholar] [CrossRef]
  33. Chen, X.; Kang, R.; Kroemer, G.; Tang, D. Organelle-specific regulation of ferroptosis. Cell Death Differ. 2021, 28, 2843–2856. [Google Scholar] [CrossRef]
  34. Hu, Z.; Zhang, H.; Yi, B.; Yang, S.; Liu, J.; Hu, J.; Wang, J.; Cao, K.; Zhang, W. VDR activation attenuate cisplatin induced AKI by inhibiting ferroptosis. Cell Death Dis. 2020, 11, 73. [Google Scholar] [CrossRef] [Green Version]
  35. Park, E.; Chung, S.W. ROS-mediated autophagy increases intracellular iron levels and ferroptosis by ferritin and transferrin receptor regulation. Cell Death Dis. 2019, 10, 822. [Google Scholar] [CrossRef] [Green Version]
  36. Moosmann, B.; Behl, C. Selenoproteins, cholesterol-lowering drugs, and the consequences: Revisiting of the mevalonate pathway. Trends Cardiovasc. Med. 2004, 14, 273–281. [Google Scholar] [CrossRef]
  37. Finkel, T. Signal transduction by mitochondrial oxidants. J. Biol. Chem. 2012, 287, 4434–4440. [Google Scholar] [CrossRef] [Green Version]
  38. Liu, J.; Kang, R.; Tang, D. Signaling pathways and defense mechanisms of ferroptosis. FEBS J. 2021. ahead of print. [Google Scholar] [CrossRef]
  39. Liu, J.; Yang, M.; Kang, R.; Klionsky, D.J.; Tang, D. Autophagic degradation of the circadian clock regulator promotes ferroptosis. Autophagy 2019, 15, 2033–2035. [Google Scholar] [CrossRef]
  40. Chen, S.P.; Yang, J.; Zhang, Y.; Duan, C.Y.; Liu, Q.; Huang, Z.Y.; Xu, Y.; Zhou, L.; Xu, G.Q. Ubiquitin-conjugating enzyme UBE2O regulates cellular clock function by promoting the degradation of the transcription factor BMAL1. J. Biol. Chem. 2018, 293, 11296–11309. [Google Scholar] [CrossRef]
  41. Gossan, N.C.; Zhang, F.; Guo, B.Q.; Jin, D.; Yoshitane, H.; Yao, A.Y.; Glossop, N.; Zhang, Y.Q.; Fukada, Y.; Meng, Q.J. The E3 ubiquitin ligase UBE3A is an integral component of the molecular circadian clock through regulating the BMAL1 transcription factor. Nucleic Acids Res. 2014, 42, 5765–5775. [Google Scholar] [CrossRef] [PubMed] [Green Version]
  42. Han, X.; Wang, X.L.; Li, Q.; Dong, X.X.; Zhang, J.S.; Yan, Q.C. HIF-1alpha SUMOylation affects the stability and transcriptional activity of HIF-1alpha in human lens epithelial cells. Graefes Arch. Clin. Exp. Ophthalmol. 2015, 253, 1279–1290. [Google Scholar] [CrossRef] [PubMed]
  43. Stockwell, B.R.; Friedmann Angeli, J.P.; Bayir, H.; Bush, A.I.; Conrad, M.; Dixon, S.J.; Fulda, S.; Gascon, S.; Hatzios, S.K.; Kagan, V.E.; et al. Ferroptosis: A Regulated Cell Death Nexus Linking Metabolism, Redox Biology, and Disease. Cell 2017, 171, 273–285. [Google Scholar] [CrossRef] [PubMed] [Green Version]
  44. Zheng, J.; Conrad, M. The Metabolic Underpinnings of Ferroptosis. Cell Metab. 2020, 32, 920–937. [Google Scholar] [CrossRef]
  45. Wang, P.; Lu, Y.Q. Ferroptosis: A Critical Moderator in the Life Cycle of Immune Cells. Front. Immunol. 2022, 13, 877634. [Google Scholar] [CrossRef]
  46. Zhang, Z.J.; Silveyra, E.; Jin, N.E.; Ribelayga, C.P. A congenic line of the C57BL/6J mouse strain that is proficient in melatonin synthesis. J. Pineal Res. 2018, 65, e12509. [Google Scholar] [CrossRef]
  47. Zheng, B.H.; Albrecht, U.; Kaasik, K.; Sage, M.; Lu, W.Q.; Vaishnav, S.; Li, Q.; Sun, Z.S.; Eichele, G.; Bradley, A.; et al. Nonredundant roles of the mPer1 and mPer2 genes in the mammalian circadian clock. Cell 2001, 105, 683–694. [Google Scholar] [CrossRef]
Figure 1. Physiological effect indices and HE staining of spleen from DKO and WT mice of different ages. (A) Spleen weight (g). (B) Spleen organ coefficient (%). (C) Spleen HE staining. White pulp (WP), red pulp (RP), periarterial lymphatic sheath (P), and marginal area (MZ), scale = 200 µm. Data are presented as mean ± SD, n = 20. * p < 0.05, ** p < 0.01.
Ijms 23 12962 g001
Figure 2. B, CD3+-CD4+T, and CD3+-CD8+T cells in the blood (AC) and spleen (DF) of DKO and WT mice at different months of age. Data are presented as mean ± SD, n = 6. * p < 0.05, ** p < 0.01.
Ijms 23 12962 g002
Figure 3. GO analysis of DEmRNAs in 14-month-old DKO male mice spleen. (A) GO-BP; (B) GO-MF; (C) GO-CC. Colored dots represent the fold change in gene expression in different pathways. The y-axis represents the gene count. The x-axis gives enrichment analysis terms. Plot colors represent p-values and sizes represent gene numbers. (DF) Heatmap for differentially expressed mRNAs enriched in DNA repair (BP), ATPase activity (MF), and chromosomal region (CC). Blue: DKO mice; red: WT mice. DEmRNAs: differentially expressed mRNAs; GO: Gene Ontology; BP: biological process; CC: cell component.
Ijms 23 12962 g003
Figure 4. KEGG and GSEA analysis of DEmRNA in 14-month-old DKO mice spleen. (A) KEGG pathway analysis of mRNAs. Colored dots represent the fold change in gene expression in different pathways. The x-axis represents the gene ratio. The y-axis gives the enrichment analysis terms. (B) The net plot of KEGG pathways shows the enrichment of DEmRNAs in different pathways. Plot colors represent the p-values and sizes represent the gene numbers. (C) Gene set enrichment analysis (GSEA) for DEmRNAs. The x-axis represents the gene ratio. The y-axis gives the enrichment analysis terms. Plot colors represent the p-values and sizes represent the gene numbers. DEmRNAs: differentially expressed mRNAs; KEGG: Kyoto Encyclopedia of Genes and Genomes; GSEA: gene set enrichment analysis.
Ijms 23 12962 g004
Figure 5. Differences in the immune microenvironment between the DKO and WT mice spleen. (A) The mMCP-counter of different immune and stromal cells in DKO and WT mice spleen. Data are presented as mean ± SD, n = 3. * p < 0.05. (B) The correlation between DKO score and immune cell infiltration in mice spleen. * cor_pvalue < 0.05, ** cor_pvalue < 0.01. (C) The differential expression of immune checkpoint genes in DKO and WT mice spleen. Blue: DKO mice; red: WT mice. mMCP-counter: murine Microenvironment Cell Population counter.
Ijms 23 12962 g005
Figure 6. Expression analysis of spleen tissue and spleen lymphocytes. (A) Heat map of spleen DNA damage and ferroptosis gene expression levels in 14-month-old mice. (B) Relative mRNA expression of lipid peroxidation-related genes and iron metabolism-related genes. n = 3, * p < 0.05. (C) Cell mortality, (D) MDA levels, and (E) ROS levels of WT and DKO spleen lymphocytes from 14-month-old mice as well as treatment with 0.5 µM erastin. Data are presented as mean ± SD, n = 6. * p < 0.05, ** p < 0.01. (F,G) IHC staining of spleen TFR1 in mice aged 9 and 14 months. Data are presented as mean ± SD, n = 3. ** p < 0.01.
Ijms 23 12962 g006
Figure 7. Analysis of GPX4 synthesis regulation in 14-month-old mice. (A,B) GPX4 protein expression in WT mice and DKO. Data are presented as mean ± SD, n = 2. ** p < 0.01. (C) Relative mRNA expression and protein expression (D,E) related to the pathway of mevalonate metabolism and selenoprotein synthesis in WT mice and DKO. Data are presented as mean ± SD, n = 3. * p < 0.05, ** p < 0.01.
Ijms 23 12962 g007
Publisher’s Note: MDPI stays neutral with regard to jurisdictional claims in published maps and institutional affiliations.

