
Development of a Chemically Modified Sensor Based on a Pentapeptide and Its Application for Sensitive Detection of Verbascoside in Extra Virgin Olive Oil


Abstract
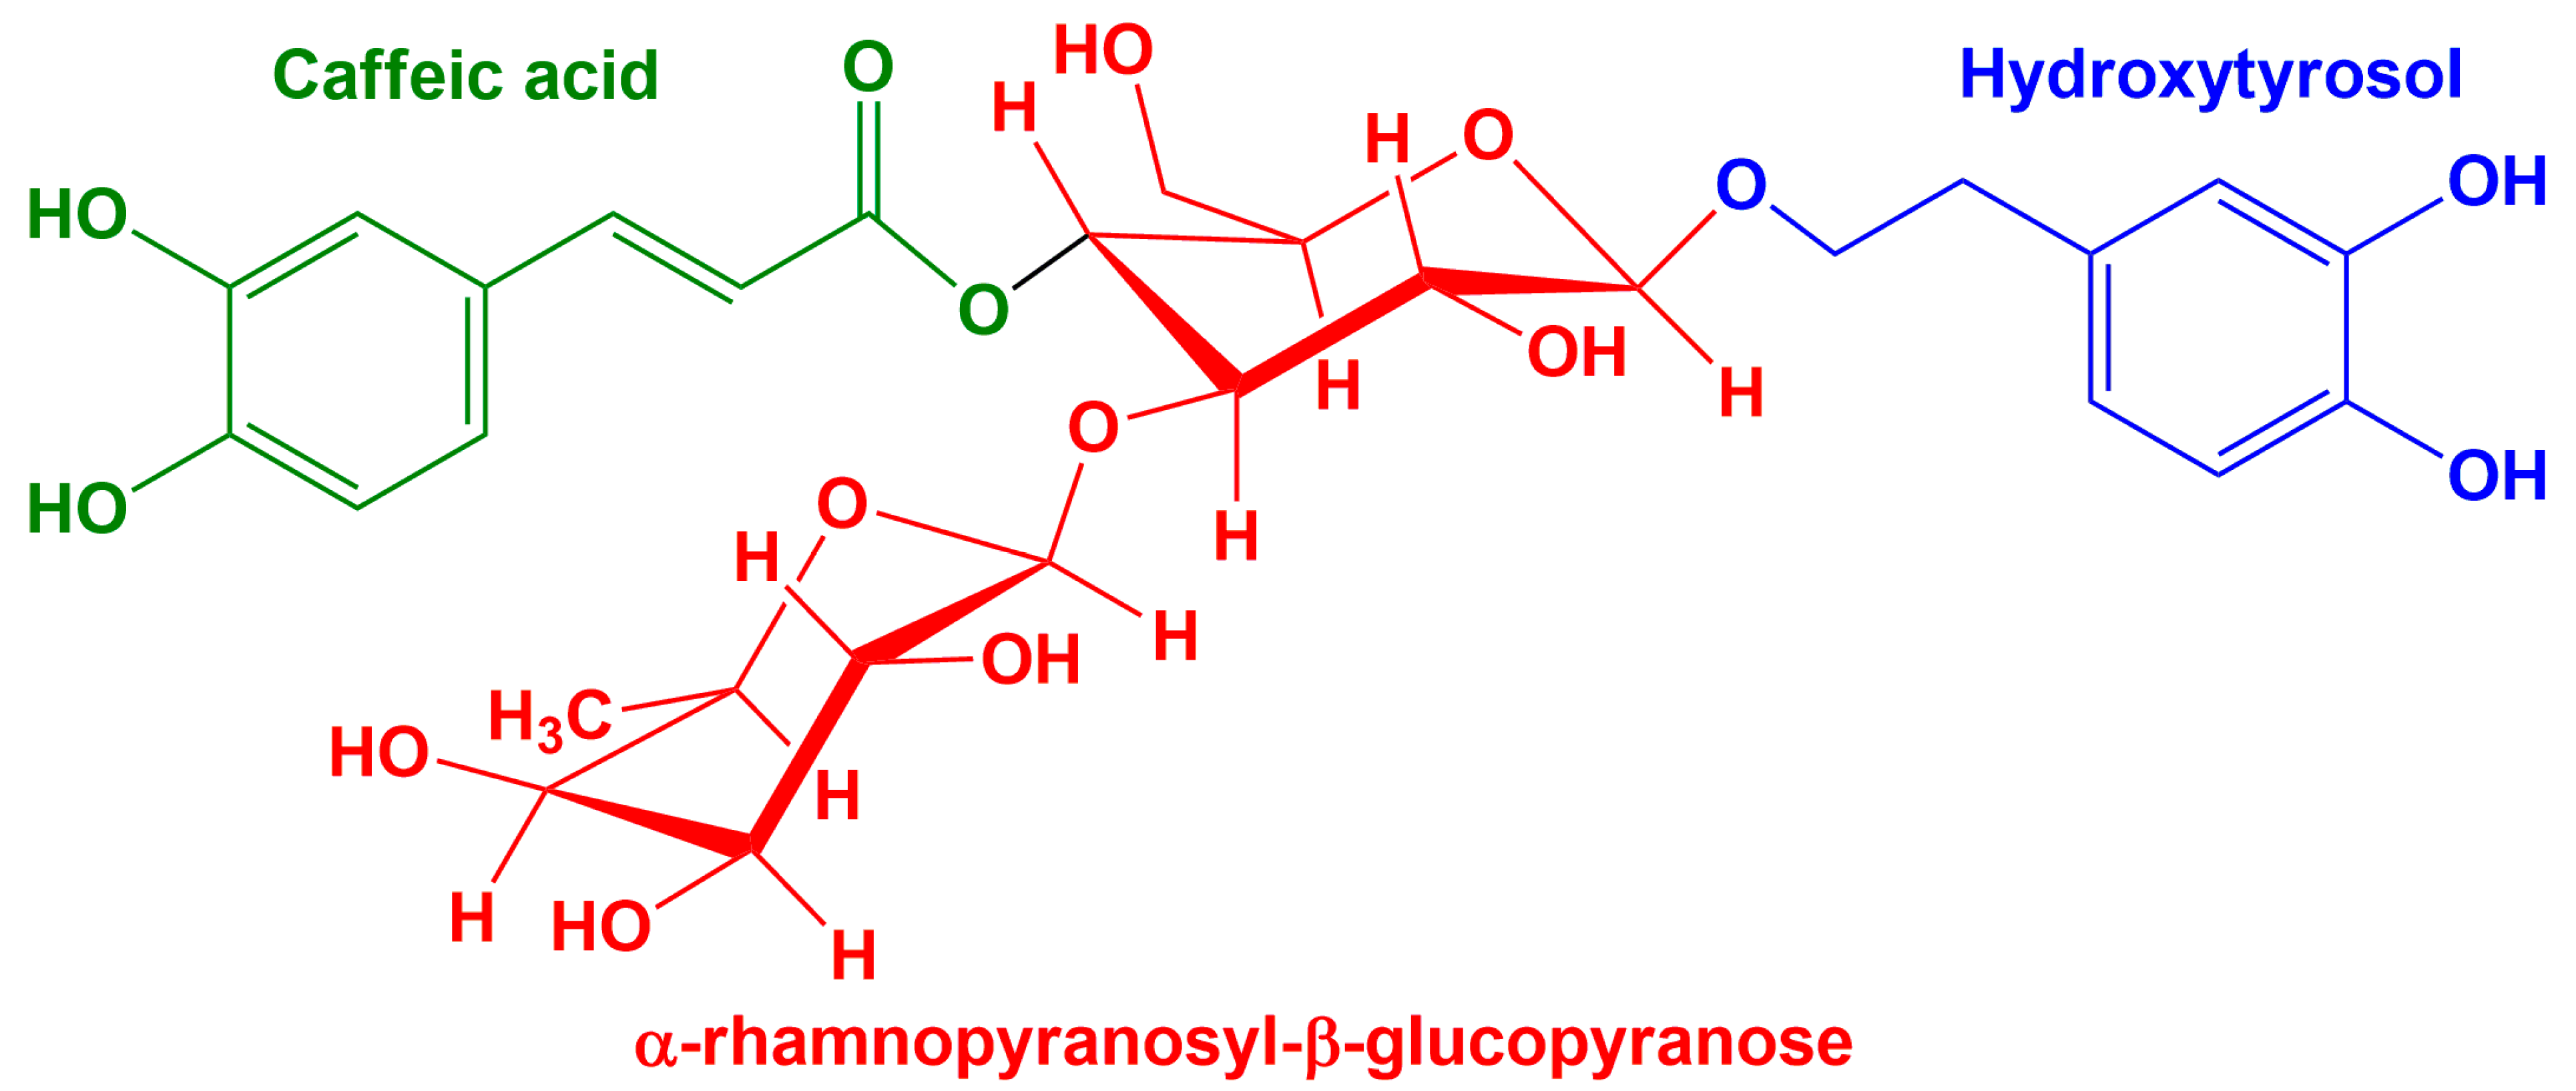
:1. Introduction
2. Results and Discussions
2.1. Electrode Characterisation
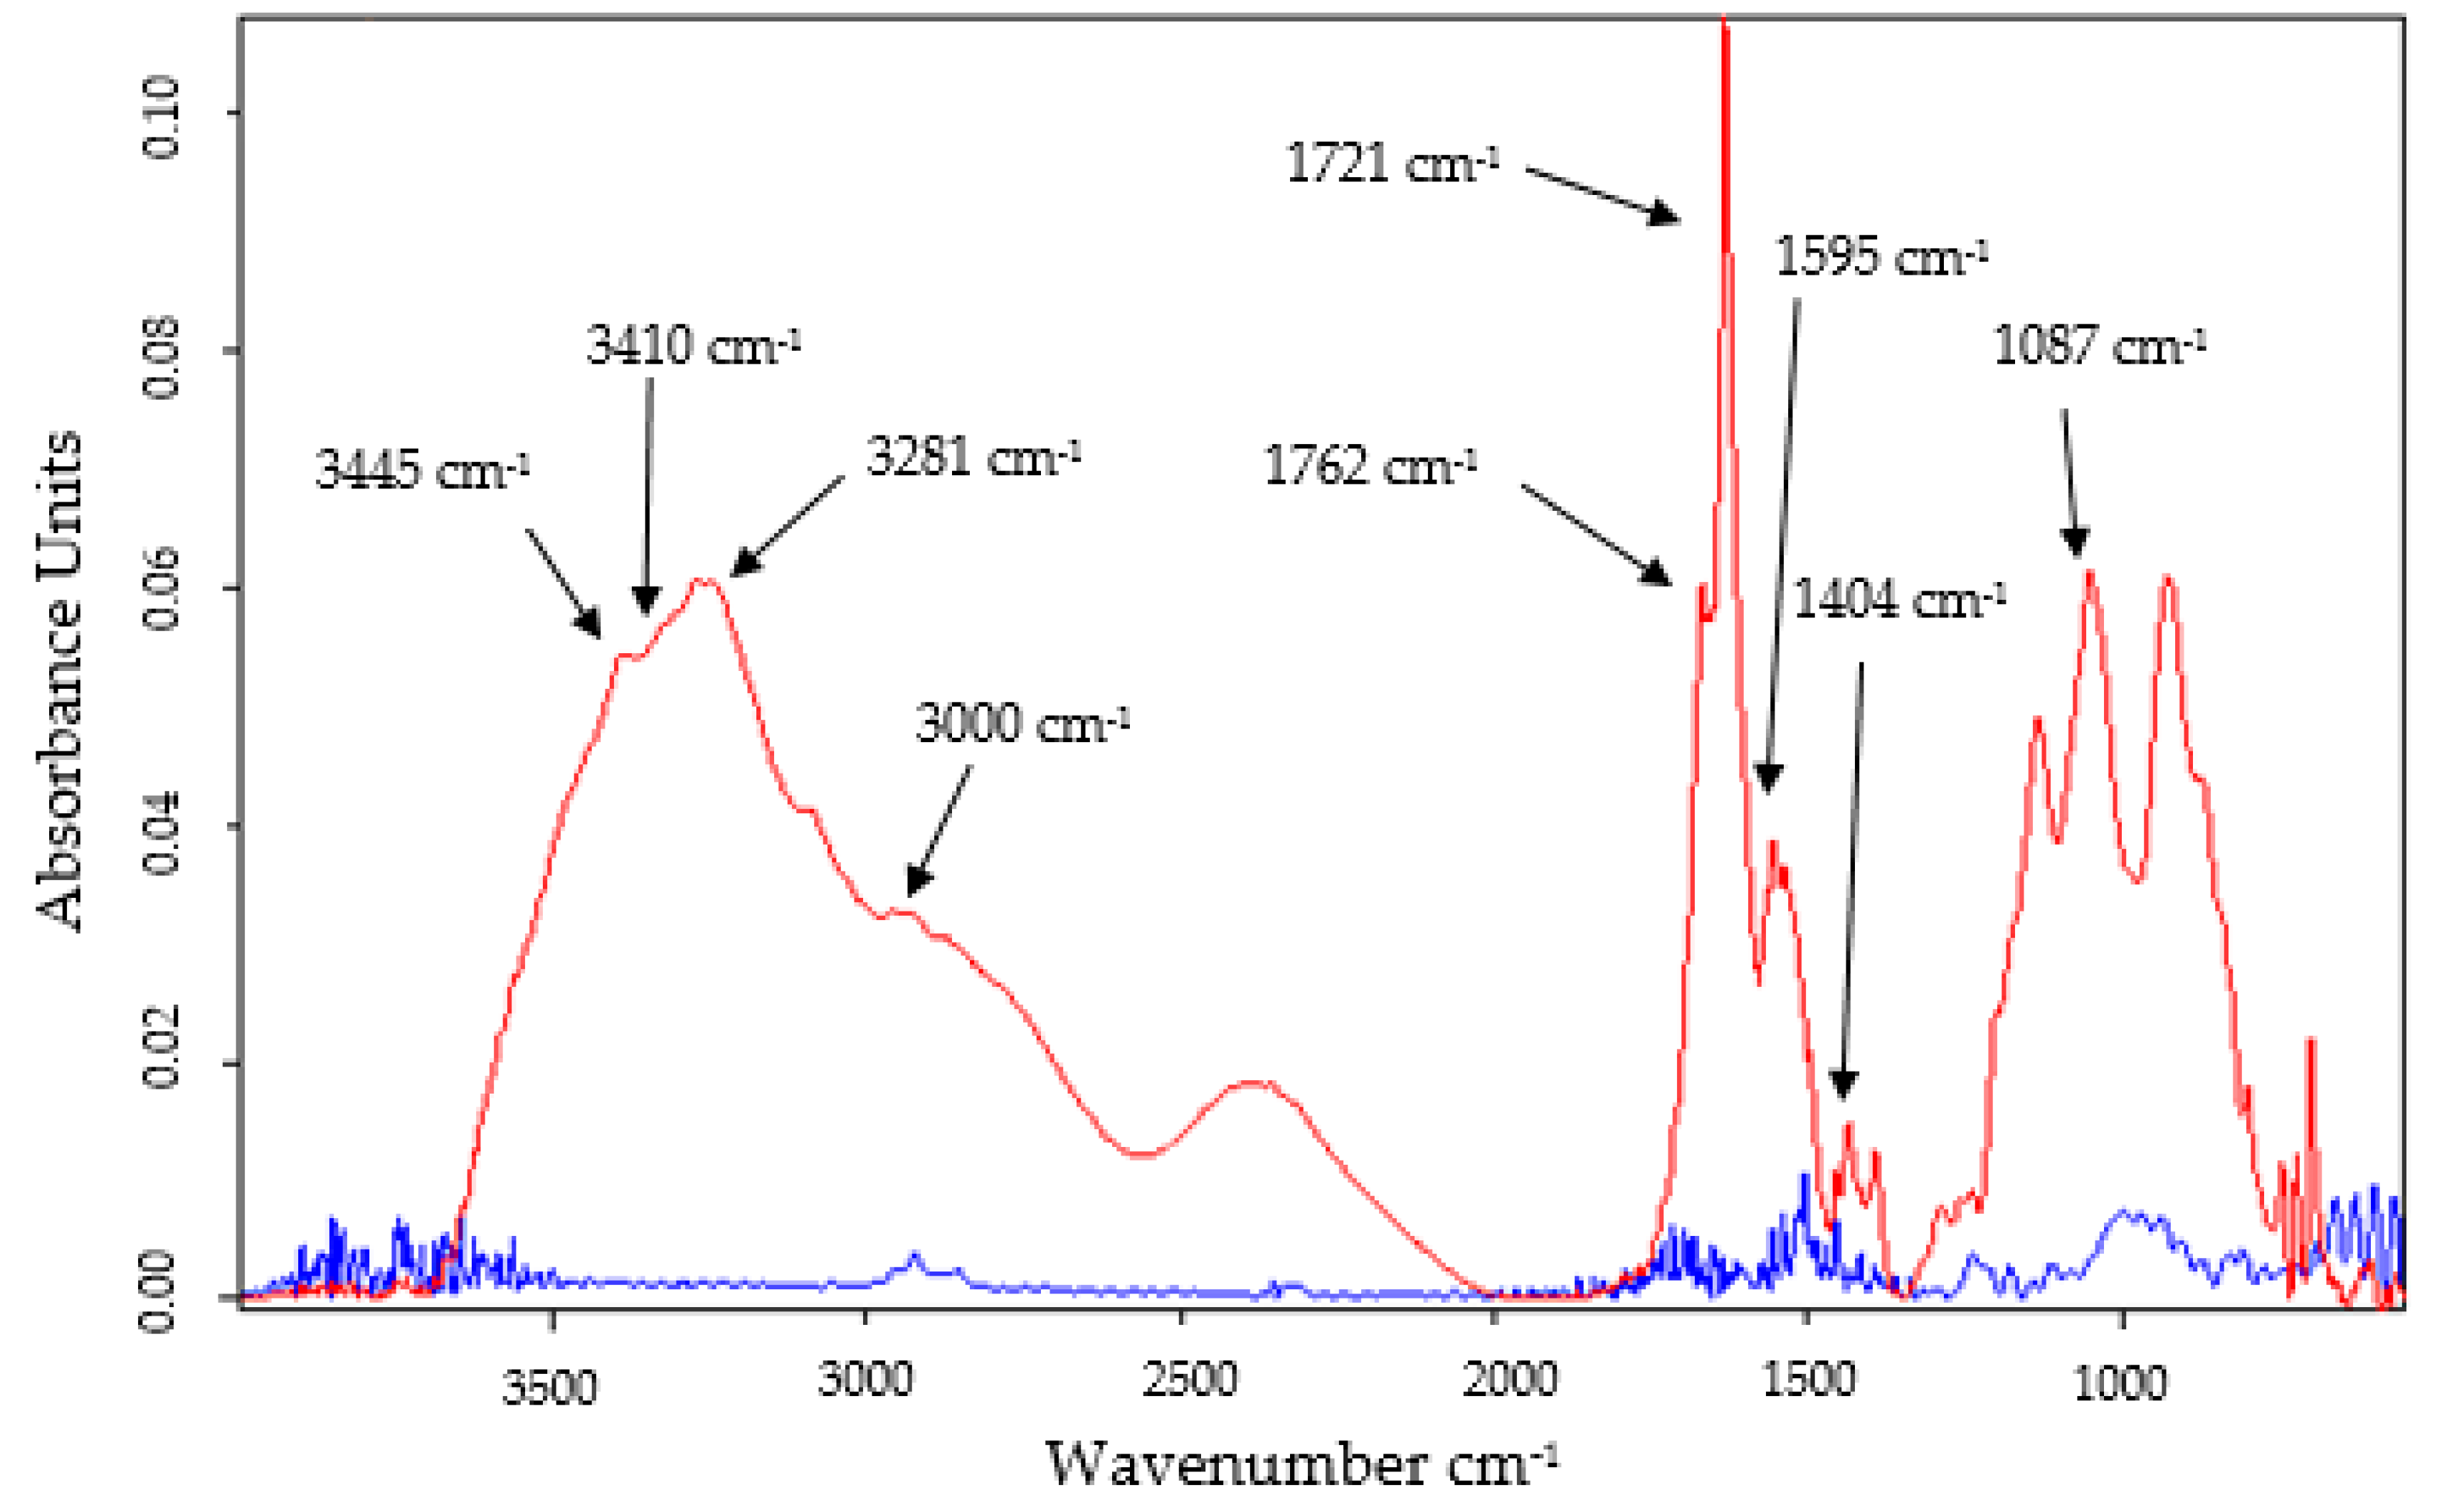
2.1.1. FTIR Spectrometric Method
2.1.2. Morphological Characterisation Using SEM
2.2. Preliminary Studies for the Characterisation of SPCE/GPHOX-Pentapeptide
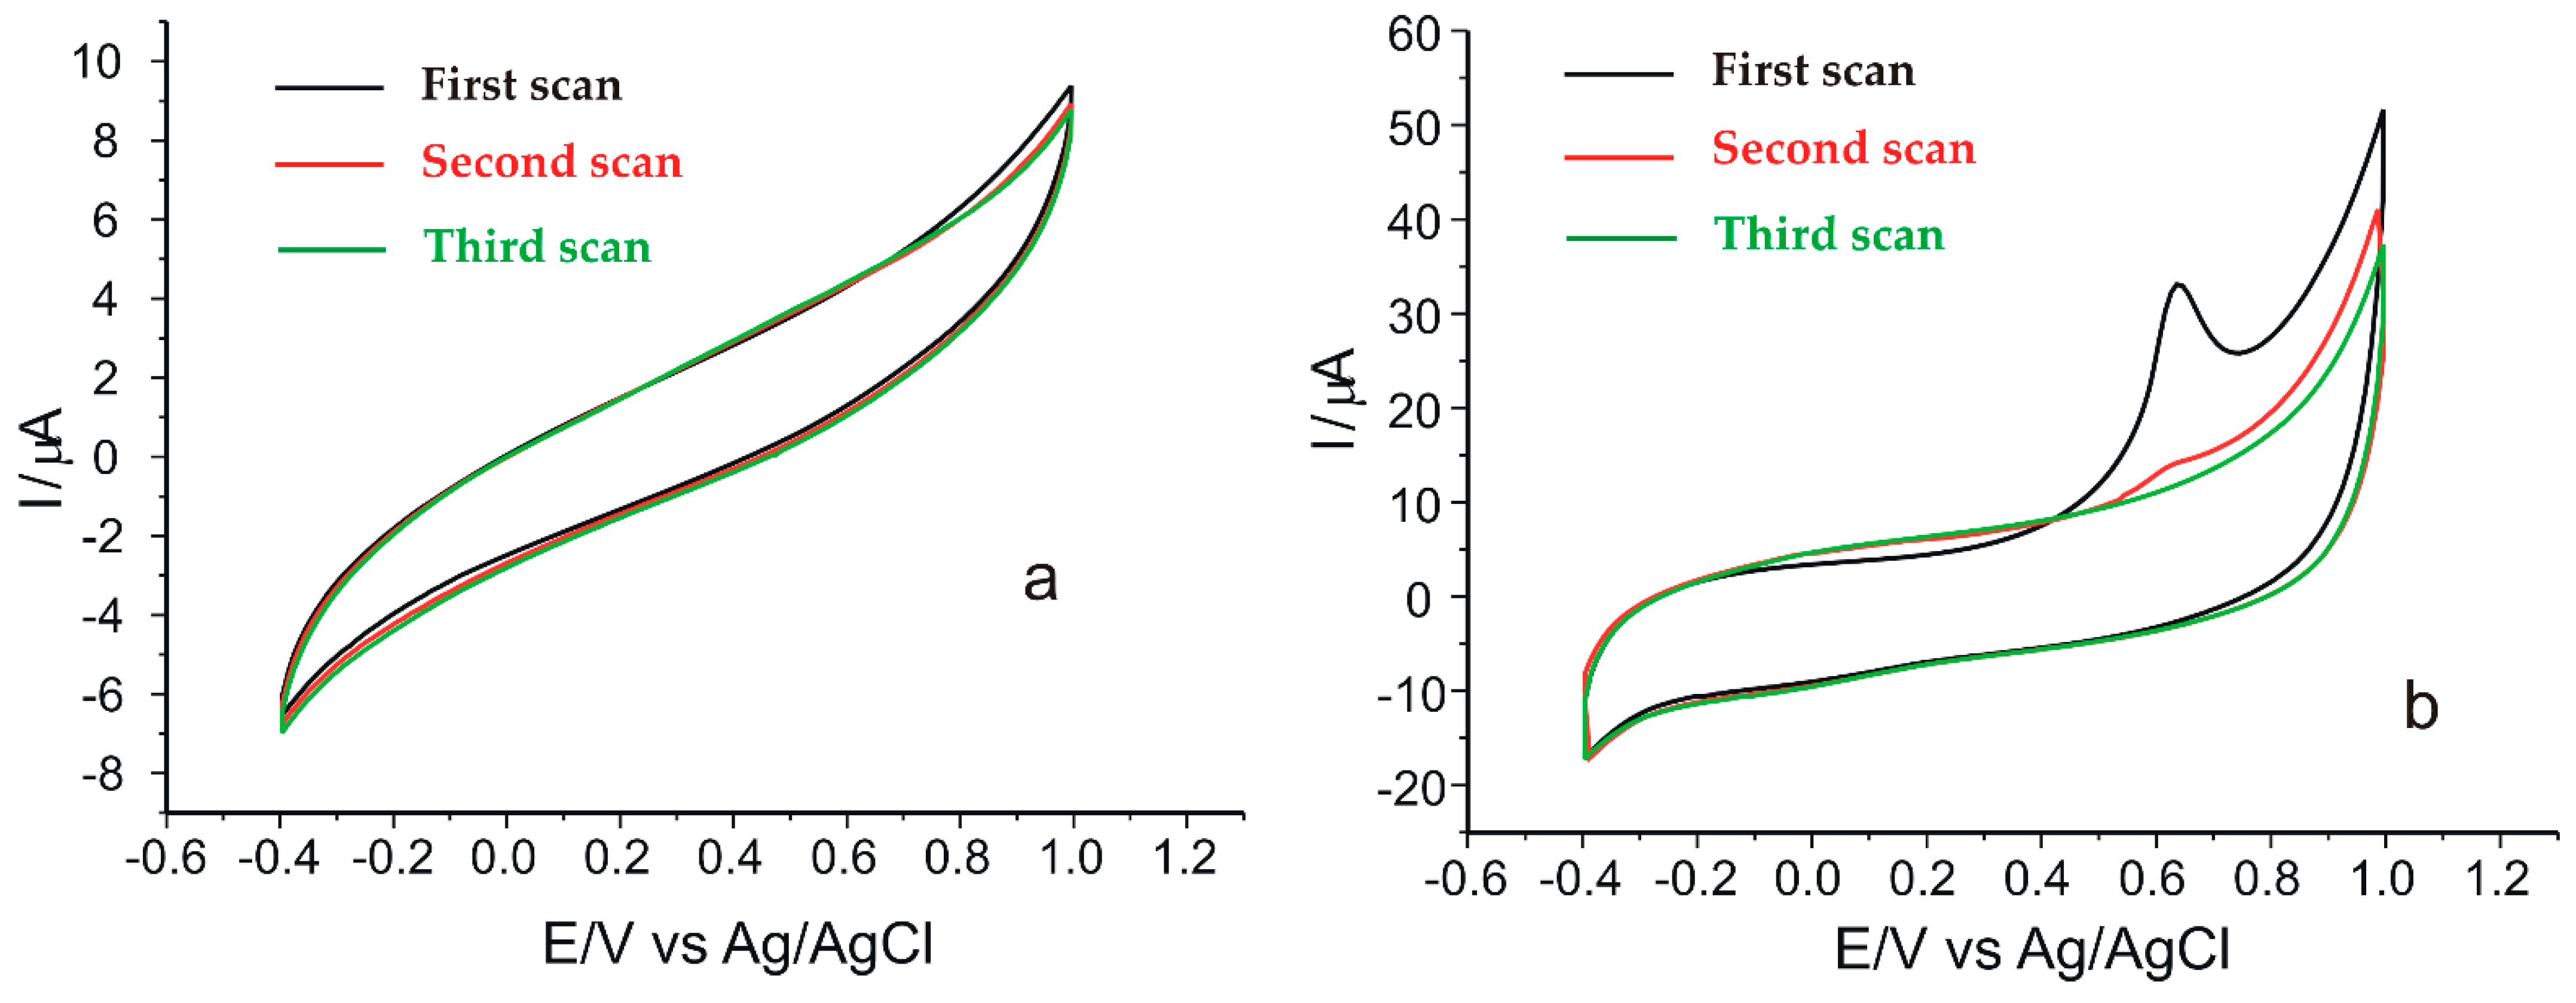
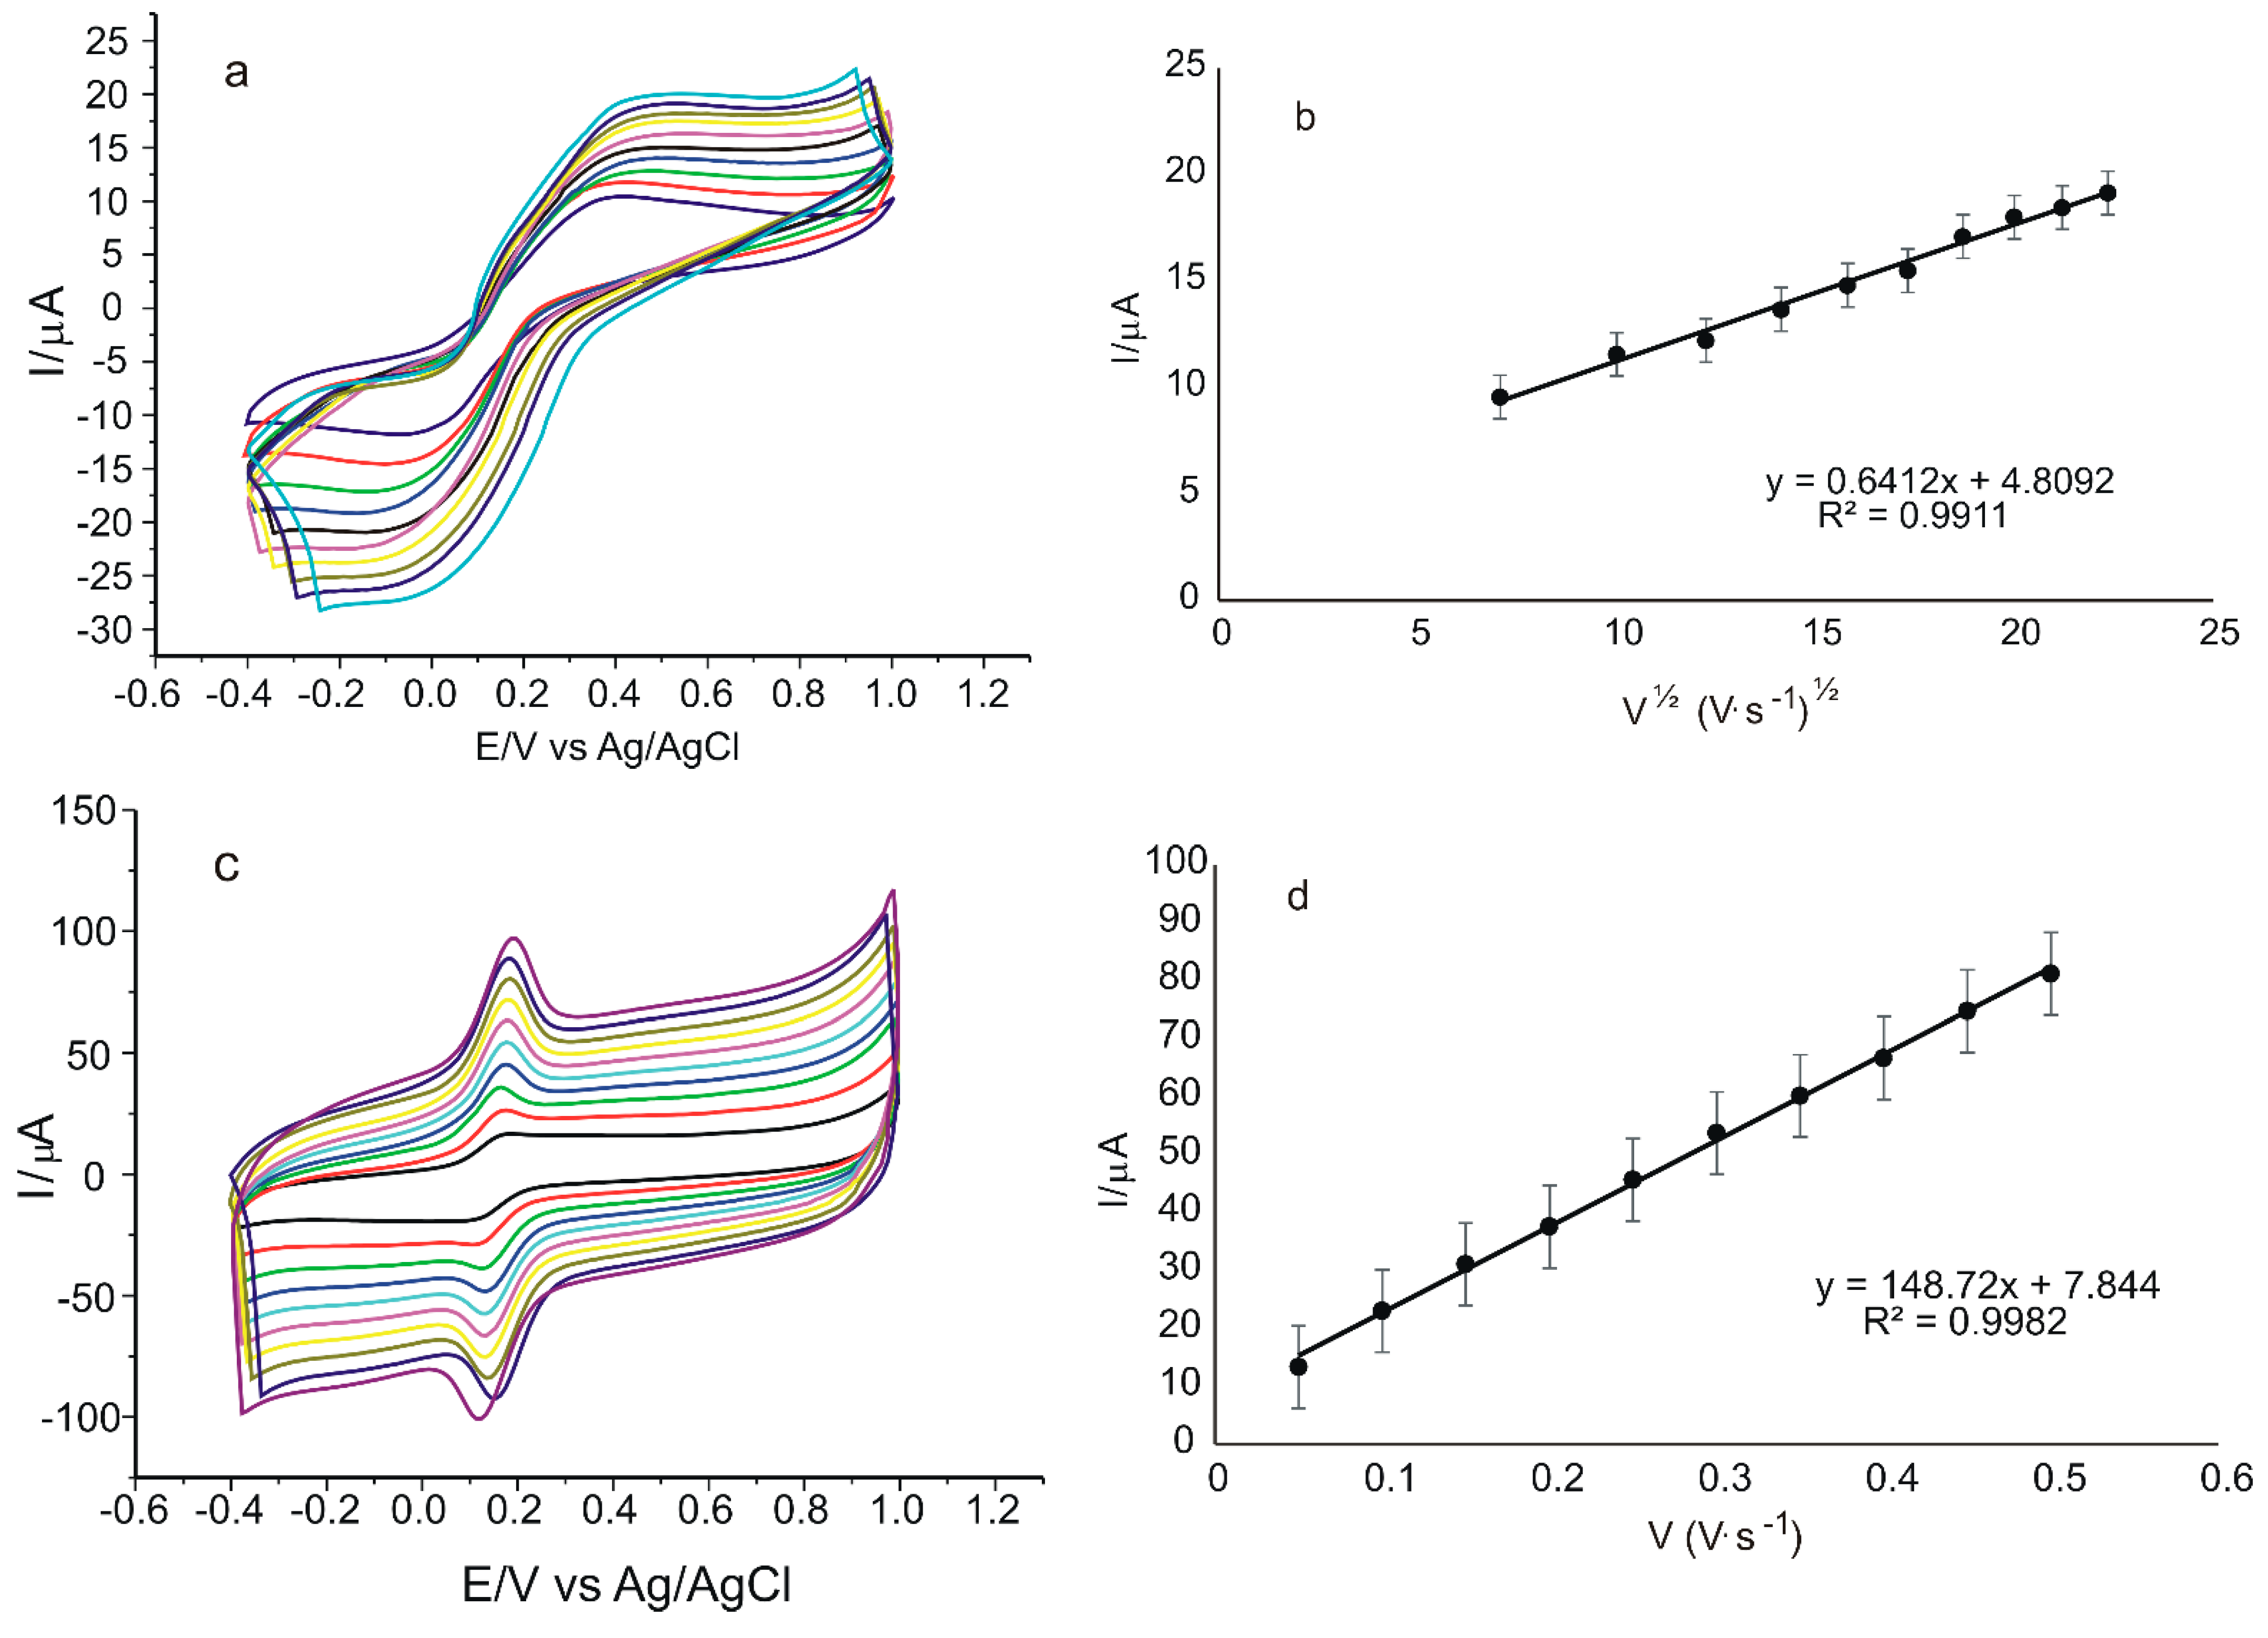
2.3. Electrochemical Properties of SPCE/GPHOX-Pentapeptide in K4[Fe(CN)6]/K3[Fe(CN)6] Solution
2.4. Electrochemical Sensor Responses in Verbascoside Solution
2.5. Development of Calibration Curve
2.6. Accuracy of the Method
2.7. Stability, Reproducibility, Repeatability and Interference Studies
2.8. Quantitative Determination of Verbascoside in EVOO
2.9. Determination of the Antioxidant Activity of Verbascoside by DPPH Method; Correlation between Sensor Response and Spectrophotometric Measurements to Determine Antioxidant Activity
3. Materials and Methods
3.1. Chemicals and Solutions
3.2. Electrodes and Equipment
3.3. Obtaining the Chemically Modified Sensor
3.4. Methods of Analysis
3.5. Real Samples and Preparation of the Solutions to Be Analysed
3.6. Antioxidant Activity (DPPH Free Radical Scavenging Activity)
3.7. Data Analysis
4. Conclusions
Author Contributions
Funding
Institutional Review Board Statement
Informed Consent Statement
Data Availability Statement
Acknowledgments
Conflicts of Interest
References
- Akbi, H.; Mekki, A.; Rafai, S.; Touidjine, S.; Boudina, N.; Bekkar Djeloul Sayeh, Z. Phenomenological Description of the Thermal Reduction Kinetics in Graphene Oxide Films. Mater. Chem. Phys. 2022, 277, 125477. [Google Scholar] [CrossRef]
- Dreyer, D.R.; Park, S.; Bielawski, C.W.; Ruoff, R.S. The Chemistry of Graphene Oxide. Chem. Soc. Rev. 2010, 39, 228–240. [Google Scholar] [CrossRef] [PubMed]
- Akbi, H.; Yu, L.; Wang, B.; Liu, Q.; Wang, J.; Liu, J.; Song, D.; Sun, Y.; Liu, L. Effect of Reducing System on Capacitive Behavior of Reduced Graphene Oxide Film: Application for Supercapacitor. J. Solid State Chem. 2015, 221, 338–344. [Google Scholar] [CrossRef]
- El-Kady, M.F.; Strong, V.; Dubin, S.; Kaner, R.B. Laser Scribing of High-Performance and Flexible Graphene-Based Electrochemical Capacitors. Science 2012, 335, 1326–1330. [Google Scholar] [CrossRef] [PubMed] [Green Version]
- Yeh, C.-N.; Raidongia, K.; Shao, J.; Yang, Q.-H.; Huang, J. On the Origin of the Stability of Graphene Oxide Membranes in Water. Nat. Chem. 2015, 7, 166–170. [Google Scholar] [CrossRef] [PubMed]
- Pham, V.H.; Cuong, T.V.; Hur, S.H.; Shin, E.W.; Kim, J.S.; Chung, J.S.; Kim, E.J. Fast and Simple Fabrication of a Large Transparent Chemically-Converted Graphene Film by Spray-Coating. Carbon 2010, 48, 1945–1951. [Google Scholar] [CrossRef]
- Muniyalakshmi, M.; Sethuraman, K.; Silambarasan, D. Synthesis and Characterization of Graphene Oxide Nanosheets. Mater. Today Proc. 2020, 21, 408–410. [Google Scholar] [CrossRef]
- Zhu, S.-E.; Krishna Ghatkesar, M.; Zhang, C.; Janssen, G.C.A.M. Graphene Based Piezoresistive Pressure Sensor. Appl. Phys. Lett. 2013, 102, 161904. [Google Scholar] [CrossRef] [Green Version]
- Saxena, S.; Tyson, T.A. Interacting Quasi-Two-Dimensional Sheets of Interlinked Carbon Nanotubes: A High-Pressure Phase of Carbon. ACS Nano 2010, 4, 3515–3521. [Google Scholar] [CrossRef]
- Choi, B.G.; Yang, M.; Hong, W.H.; Choi, J.W.; Huh, Y.S. 3D Macroporous Graphene Frameworks for Supercapacitors with High Energy and Power Densities. ACS Nano 2012, 6, 4020–4028. [Google Scholar] [CrossRef]
- Bao, Q.; Loh, K.P. Graphene Photonics, Plasmonics, and Broadband Optoelectronic Devices. ACS Nano 2012, 6, 3677–3694. [Google Scholar] [CrossRef]
- Li, F.; Jiang, X.; Zhao, J.; Zhang, S. Graphene Oxide: A Promising Nanomaterial for Energy and Environmental Applications. Nano Energy 2015, 16, 488–515. [Google Scholar] [CrossRef] [Green Version]
- Yan, J.-A.; Chou, M.Y. Oxidation Functional Groups on Graphene: Structural and Electronic Properties. Phys. Rev. B 2010, 82, 125403. [Google Scholar] [CrossRef]
- Chen, D.; Feng, H.; Li, J. Graphene Oxide: Preparation, Functionalization, and Electrochemical Applications. Chem. Rev. 2012, 112, 6027–6053. [Google Scholar] [CrossRef]
- Perrozzi, F.; Prezioso, S.; Ottaviano, L. Graphene Oxide: From Fundamentals to Applications. J. Phys. Condens. Matter 2014, 27, 013002. [Google Scholar] [CrossRef] [Green Version]
- Zuo, X.; He, S.; Li, D.; Peng, C.; Huang, Q.; Song, S.; Fan, C. Graphene Oxide-Facilitated Electron Transfer of Metalloproteins at Electrode Surfaces. Langmuir 2010, 26, 1936–1939. [Google Scholar] [CrossRef]
- Kröner, A.; Hirsch, T. Current Trends in the Optical Characterization of Two-Dimensional Carbon Nanomaterials. Front. Chem. 2019, 7, 927. [Google Scholar] [CrossRef]
- Gugasyan, R.; Velazquez, C.; Vidavsky, I.; Deck, B.M.; van der Drift, K.; Gross, M.L.; Unanue, E.R. Independent Selection by I-Ak Molecules of Two Epitopes Found in Tandem in an Extended Polypeptide Antigen1. J. Immunol. 2000, 165, 3206–3213. [Google Scholar] [CrossRef] [Green Version]
- Xie, B.; Sharp, J.S. Relative Quantification of Sites of Peptide and Protein Modification Using Size Exclusion Chromatography Coupled with Electron Transfer Dissociation. J. Am. Soc. Mass Spectrom. 2016, 27, 1322–1327. [Google Scholar] [CrossRef] [Green Version]
- Liu, Q.; Wang, J.; Boyd, B.J. Peptide-Based Biosensors. Talanta 2015, 136, 114–127. [Google Scholar] [CrossRef]
- Olesen, L.E.; Ford, M.G.J.; Schmid, E.M.; Vallis, Y.; Babu, M.M.; Li, P.H.; Mills, I.G.; McMahon, H.T.; Praefcke, G.J.K. Solitary and Repetitive Binding Motifs for the AP2 Complex α-Appendage in Amphiphysin and Other Accessory Proteins. J. Biol. Chem. 2008, 283, 5099–5109. [Google Scholar] [CrossRef] [PubMed] [Green Version]
- Choulier, L.; Enander, K. Environmentally Sensitive Fluorescent Sensors Based on Synthetic Peptides. Sensors 2010, 10, 3126–3144. [Google Scholar] [CrossRef] [PubMed] [Green Version]
- Munteanu, I.G.; Grădinaru, V.R.; Apetrei, C. Sensitive Detection of Rosmarinic Acid Using Peptide-Modified Graphene Oxide Screen-Printed Carbon Electrode. Nanomaterials 2022, 12, 3292. [Google Scholar] [CrossRef] [PubMed]
- Huang, Y.; Hu, F.; Zhao, R.; Zhang, G.; Yang, H.; Zhang, D. Tetraphenylethylene Conjugated with a Specific Peptide as a Fluorescence Turn-On Bioprobe for the Highly Specific Detection and Tracing of Tumor Markers in Live Cancer Cells. Chem.–Eur. J. 2014, 20, 158–164. [Google Scholar] [CrossRef]
- Wang, C.; Wang, J.; Liu, D.; Wang, Z. Gold Nanoparticle-Based Colorimetric Sensor for Studying the Interactions of β-Amyloid Peptide with Metallic Ions. Talanta 2010, 80, 1626–1631. [Google Scholar] [CrossRef]
- Clarke, S.; Pinaud, F.; Beutel, O.; You, C.; Piehler, J.; Dahan, M. Covalent Monofunctionalization of Peptide-Coated Quantum Dots for Single-Molecule Assays. Nano Lett. 2010, 10, 2147–2154. [Google Scholar] [CrossRef]
- Feng, T.; Feng, D.; Shi, W.; Li, X.; Ma, H. A Graphene Oxide-Peptide Fluorescence Sensor for Proteolytically Active Prostate-Specific Antigen. Mol. Biosyst. 2012, 8, 1441–1445. [Google Scholar] [CrossRef]
- Yan, X.; Yang, L.; Wang, Q. Lanthanide-Coded Protease-Specific Peptide–Nanoparticle Probes for a Label-Free Multiplex Protease Assay Using Element Mass Spectrometry: A Proof-of-Concept Study. Angew. Chem. Int. Ed. 2011, 50, 5130–5133. [Google Scholar] [CrossRef] [Green Version]
- Zhao, N.; He, Y.; Mao, X.; Sun, Y.; Zhang, X.; Li, C.; Lin, Y.; Liu, G. Electrochemical Assay of Active Prostate-Specific Antigen (PSA) Using Ferrocene-Functionalized Peptide Probes. Electrochem. Commun. 2010, 12, 471–474. [Google Scholar] [CrossRef]
- Vanova, V.; Mitrevska, K.; Milosavljevic, V.; Hynek, D.; Richtera, L.; Adam, V. Peptide-Based Electrochemical Biosensors Utilized for Protein Detection. Biosens. Bioelectron. 2021, 180, 113087. [Google Scholar] [CrossRef]
- Anter, J.; Tasset, I.; Demyda-Peyrás, S.; Ranchal, I.; Moreno-Millán, M.; Romero-Jimenez, M.; Muntané, J.; Luque de Castro, M.D.; Muñoz-Serrano, A.; Alonso-Moraga, Á. Evaluation of Potential Antigenotoxic, Cytotoxic and Proapoptotic Effects of the Olive Oil by-Product “Alperujo”, Hydroxytyrosol, Tyrosol and Verbascoside. Mutat. Res. Toxicol. Environ. Mutagen. 2014, 772, 25–33. [Google Scholar] [CrossRef]
- Cardinali, A.; Linsalata, V.; Lattanzio, V.; Ferruzzi, M.G. Verbascosides from Olive Mill Waste Water: Assessment of Their Bioaccessibility and Intestinal Uptake Using an In Vitro Digestion/Caco-2 Model System. J. Food Sci. 2011, 76, H48–H54. [Google Scholar] [CrossRef]
- Casaburi, I.; Puoci, F.; Chimento, A.; Sirianni, R.; Ruggiero, C.; Avena, P.; Pezzi, V. Potential of Olive Oil Phenols as Chemopreventive and Therapeutic Agents against Cancer: A Review of in Vitro Studies. Mol. Nutr. Food Res. 2013, 57, 71–83. [Google Scholar] [CrossRef]
- Ciriminna, R.; Meneguzzo, F.; Fidalgo, A.; Ilharco, L.M.; Pagliaro, M. Extraction, Benefits and Valorization of Olive Polyphenols. Eur. J. Lipid Sci. Technol. 2016, 118, 503–511. [Google Scholar] [CrossRef]
- Cicerale, S.; Lucas, L.; Keast, R. Biological Activities of Phenolic Compounds Present in Virgin Olive Oil. Int. J. Mol. Sci. 2010, 11, 458–479. [Google Scholar] [CrossRef] [Green Version]
- Del Carlo, M.; Amine, A.; Haddam, M.; della Pelle, F.; Fusella, G.C.; Compagnone, D. Selective Voltammetric Analysis of O-Diphenols from Olive Oil Using Na2MoO4 as Electrochemical Mediator. Electroanalysis 2012, 24, 889–896. [Google Scholar] [CrossRef]
- Yang, C.; Denno, M.E.; Pyakurel, P.; Venton, B.J. Recent Trends in Carbon Nanomaterial-Based Electrochemical Sensors for Biomolecules: A Review. Anal. Chim. Acta 2015, 887, 17–37. [Google Scholar] [CrossRef] [Green Version]
- Alessandri, S.; Ieri, F.; Romani, A. Minor Polar Compounds in Extra Virgin Olive Oil: Correlation between HPLC-DAD-MS and the Folin-Ciocalteu Spectrophotometric Method. J. Agric. Food Chem. 2014, 62, 826–835. [Google Scholar] [CrossRef]
- Paradiso, V.M.; Clemente, A.; Summo, C.; Pasqualone, A.; Caponio, F. Towards Green Analysis of Virgin Olive Oil Phenolic Compounds: Extraction by a Natural Deep Eutectic Solvent and Direct Spectrophotometric Detection. Food Chem. 2016, 212, 43–47. [Google Scholar] [CrossRef]
- Ricciutelli, M.; Marconi, S.; Boarelli, M.C.; Caprioli, G.; Sagratini, G.; Ballini, R.; Fiorini, D. Olive Oil Polyphenols: A Quantitative Method by High-Performance Liquid-Chromatography-Diode-Array Detection for Their Determination and the Assessment of the Related Health Claim. J. Chromatogr. A 2017, 1481, 53–63. [Google Scholar] [CrossRef]
- Ferro, M.D.; Santos, S.A.O.; Silvestre, A.J.D.; Duarte, M.F. Chromatographic Separation of Phenolic Compounds from Extra Virgin Olive Oil: Development and Validation of a New Method Based on a Biphenyl HPLC Column. Int. J. Mol. Sci. 2019, 20, 201. [Google Scholar] [CrossRef] [PubMed] [Green Version]
- Apetrei, C.; Rodríguez-Méndez, M.L.; de Saja, J.A. Modified Carbon Paste Electrodes for Discrimination of Vegetable Oils. Sens. Actuators B Chem. 2005, 111, 403–409. [Google Scholar] [CrossRef]
- Bounegru, A.V.; Apetrei, C. Evaluation of Olive Oil Quality with Electrochemical Sensors and Biosensors: A Review. Int. J. Mol. Sci. 2021, 22, 12708. [Google Scholar] [CrossRef] [PubMed]
- Combination of an E-Nose, an e-Tongue and an e-Eye for the Characterisation of Olive Oils with Different Degree of Bitterness-PubMed. Available online: https://pubmed.ncbi.nlm.nih.gov/20172102/ (accessed on 31 October 2022).
- Munteanu, I.G.; Apetrei, C. A Review on Electrochemical Sensors and Biosensors Used in Chlorogenic Acid Electroanalysis. Int. J. Mol. Sci. 2021, 22, 13138. [Google Scholar] [CrossRef] [PubMed]
- Sudesh; Kumar, N.; Das, S.; Bernhard, C.; Varma, G.D. Effect of Graphene Oxide Doping on Superconducting Properties of Bulk MgB 2. Supercond. Sci. Technol. 2013, 26, 095008. [Google Scholar] [CrossRef] [Green Version]
- He, Q.; Sudibya, H.G.; Yin, Z.; Wu, S.; Li, H.; Boey, F.; Huang, W.; Chen, P.; Zhang, H. Centimeter-Long and Large-Scale Micropatterns of Reduced Graphene Oxide Films: Fabrication and Sensing Applications. ACS Nano 2010, 4, 3201–3208. [Google Scholar] [CrossRef]
- Ma, M.; Fan, X.P.; Dai, Z.; Liu, X.; Xu, S.C.; Wei, J.; Shi, S.; Chen, G.P. Graphene Oxide Modified DNA Electrochemical Biosensors. Appl. Mech. Mater. 2012, 155, 82–86. [Google Scholar] [CrossRef]
- Liu, J.; Fu, S.; Yuan, B.; Li, Y.; Deng, Z. Toward a Universal “Adhesive Nanosheet” for the Assembly of Multiple Nanoparticles Based on a Protein-Induced Reduction/Decoration of Graphene Oxide. J. Am. Chem. Soc. 2010, 132, 7279–7281. [Google Scholar] [CrossRef]
- Çiplak, Z.; Yildiz, N.; Çalimli, A. Investigation of Graphene/Ag Nanocomposites Synthesis Parameters for Two Different Synthesis Methods. Fuller. Nanotub. Carbon Nanostructures 2015, 23, 361–370. [Google Scholar] [CrossRef]
- Ghosh, T.K.; Gope, S.; Mondal, D.; Bhowmik, B.; Mollick, M.R.; Maity, D.; Roy, I.; Sarkar, G.; Sadhukhan, S.; Rana, D.; et al. Assessment of Morphology and Property of Graphene Oxide-Hydroxypropylmethylcellulose Nanocomposite Films. Int. J. Biol. Macromol. 2014, 66, 338–345. [Google Scholar] [CrossRef]
- Adochitei, A.; Drochioiu, G. Rapid Characterization of Peptide Secondary Structure by FT-IR Spectroscopy. Rev. Roum. Chim. 2011, 56, 783–791. [Google Scholar]
- Arul, A.; Sivagnanam, S.; Dey, A.; Mukherjee, O.; Ghosh, S.; Das, P. The Design and Development of Short Peptide-Based Novel Smart Materials to Prevent Fouling by the Formation of Non-Toxic and Biocompatible Coatings. RSC Adv. 2020, 10, 13420–13429. [Google Scholar] [CrossRef]
- López De La Paz, M.; Goldie, K.; Zurdo, J.; Lacroix, E.; Dobson, C.M.; Hoenger, A.; Serrano, L. De Novo Designed Peptide-Based Amyloid Fibrils. Proc. Natl. Acad. Sci. USA 2002, 99, 16052–16057. [Google Scholar] [CrossRef] [Green Version]
- Eckhart, K.E.; Holt, B.D.; Laurencin, M.G.; Sydlik, S.A. Covalent Conjugation of Bioactive Peptides to Graphene Oxide for Biomedical Applications. Biomater. Sci. 2019, 7, 3876–3885. [Google Scholar] [CrossRef]
- Rothschild, K.J. The Early Development and Application of FTIR Difference Spectroscopy to Membrane Proteins: A Personal Perspective. Biomed. Spectrosc. Imaging 2016, 5, 231–267. [Google Scholar] [CrossRef] [Green Version]
- Surewicz, W.K.; Mantsch, H.H.; Chapman, D. Determination of Protein Secondary Structure by Fourier Transform Infrared Spectroscopy: A Critical Assessment. Biochemistry 1993, 32, 389–394. [Google Scholar] [CrossRef]
- Adhikari, B.; Nanda, J.; Banerjee, A. Pyrene-Containing Peptide-Based Fluorescent Organogels: Inclusion of Graphene into the Organogel. Chem. Weinh. Bergstr. Ger. 2011, 17, 11488–11496. [Google Scholar] [CrossRef]
- Chronopoulou, L.; Di Nitto, A.; Papi, M.; Parolini, O.; Falconi, M.; Teti, G.; Muttini, A.; Lattanzi, W.; Palmieri, V.; Ciasca, G.; et al. Biosynthesis and Physico-Chemical Characterization of High Performing Peptide Hydrogels@graphene Oxide Composites. Colloids Surf. B Biointerfaces 2021, 207, 111989. [Google Scholar] [CrossRef]
- Pwavodi, P.C.; Ozyurt, V.H.; Asir, S.; Ozsoz, M. Electrochemical Sensor for Determination of Various Phenolic Compounds in Wine Samples Using Fe3O4 Nanoparticles Modified Carbon Paste Electrode. Micromachines 2021, 12, 312. [Google Scholar] [CrossRef]
- Li, X.; Gao, Y.; Xiong, H.; Yang, Z. The Electrochemical Redox Mechanism and Antioxidant Activity of Polyphenolic Compounds Based on Inlaid Multi-Walled Carbon Nanotubes-Modified Graphite Electrode. Open Chem. 2021, 19, 961–973. [Google Scholar] [CrossRef]
- Dinu, A.; Apetrei, C. Voltammetric Determination of Phenylalanine Using Chemically Modified Screen-Printed Based Sensors. Chemosensors 2020, 8, 113. [Google Scholar] [CrossRef]
- Apetrei, I.M.; Apetrei, C. Voltammetric Determination of Melatonin Using a Graphene-Based Sensor in Pharmaceutical Products. Int. J. Nanomedicine 2016, 11, 1859–1866. [Google Scholar] [CrossRef] [Green Version]
- Bounegru, A.V.; Apetrei, C. Development of a Novel Electrochemical Biosensor Based on Carbon Nanofibers–Cobalt Phthalocyanine–Laccase for the Detection of p-Coumaric Acid in Phytoproducts. Int. J. Mol. Sci. 2021, 22, 9302. [Google Scholar] [CrossRef] [PubMed]
- Dăscălescu, D.; Apetrei, C. Development of a Novel Electrochemical Biosensor Based on Organized Mesoporous Carbon and Laccase for the Detection of Serotonin in Food Supplements. Chemosensors 2022, 10, 365. [Google Scholar] [CrossRef]
- Abrha, T.; Pal, R.; Saini, R.C. A Study on Voltametric Electro-Kinetic Mechanism of Catechol at l-Glutamic Acid-Carbon Paste Sensor. J. Surf. Sci. Technol. 2017, 33, 1. [Google Scholar] [CrossRef]
- Gil, E.; Enache, T.; Oliveira-Brett, A. Redox Behaviour of Verbascoside and Rosmarinic Acid. Comb. Chem. High Throughput Screen. 2013, 16, 92–97. [Google Scholar] [CrossRef]
- Enache, T.; Oliveira-Brett, A. Phenol and Para-Substituted Phenols Electrochemical Oxidation Pathways. J. Electroanal. Chem. 2013, 655, 9. [Google Scholar] [CrossRef]
- Zhuang, W.-R.; Wang, Y.; Cui, P.-F.; Xing, L.; Lee, J.; Kim, D.; Jiang, H.-L.; Oh, Y.-K. Applications of π-π Stacking Interactions in the Design of Drug-Delivery Systems. J. Control. Release 2019, 294, 311–326. [Google Scholar] [CrossRef]
- Vilian, A.T.E.; Chen, S.-M. Preparation of Carbon Nanotubes Decorated with Manganese Dioxide Nanoparticles for Electrochemical Determination of Ferulic Acid. Microchim. Acta 2015, 182, 1103–1111. [Google Scholar] [CrossRef]
- Apetrei, I.; Apetrei, C. Development of a Novel Biosensor Based on Tyrosinase/Platinum Nanoparticles/Chitosan/Graphene Nanostructured Layer with Applicability in Bioanalysis. Materials 2019, 12, 1009. [Google Scholar] [CrossRef] [Green Version]
- Apetrei, I.M.; Apetrei, C. Amperometric Biosensor Based on Diamine Oxidase/Platinum Nanoparticles/Graphene/Chitosan Modified Screen-Printed Carbon Electrode for Histamine Detection. Sensors 2016, 16, 422. [Google Scholar] [CrossRef]
- Dinu, A.; Apetrei, C. Quantification of Tyrosine in Pharmaceuticals with the New Biosensor Based on Laccase-Modified Polypyrrole Polymeric Thin Film. Polymers 2022, 14, 441. [Google Scholar] [CrossRef]
- Apetrei, I.M.; Apetrei, C. A Modified Nanostructured Graphene-Gold Nanoparticle Carbon Screen-Printed Electrode for the Sensitive Voltammetric Detection of Rutin. Measurement 2018, 114, 37–43. [Google Scholar] [CrossRef]
- Pérez-Gregorio, R.; Soares, S.; Mateus, N.; de Freitas, V. Bioactive Peptides and Dietary Polyphenols: Two Sides of the Same Coin. Molecules 2020, 25, 3443. [Google Scholar] [CrossRef]
- Buitimea-Cantúa, N.E.; Gutiérrez-Uribe, J.A.; Serna-Saldívar, S.O. Phenolic-Protein Interactions: Effects on Food Properties and Health Benefits. J. Med. Food 2018, 21, 188–198. [Google Scholar] [CrossRef]
- Caporale, A.; Adorinni, S.; Lamba, D.; Saviano, M. Peptide–Protein Interactions: From Drug Design to Supramolecular Biomaterials. Molecules 2021, 26, 1219. [Google Scholar] [CrossRef]
- Gruschwitz, F.V.; Klein, T.; Catrouillet, S.; Brendel, J.C. Supramolecular Polymer Bottlebrushes. Chem. Commun. 2020, 56, 5079–5110. [Google Scholar] [CrossRef]
- Yang, J.; An, H.-W.; Wang, H. Self-Assembled Peptide Drug Delivery Systems. ACS Appl. Bio Mater. 2021, 4, 24–46. [Google Scholar] [CrossRef]
- Thalassinos, K.; Pandurangan, A.P.; Xu, M.; Alber, F.; Topf, M. Conformational States of Macromolecular Assemblies Explored by Integrative Structure Calculation. Structure 2013, 21, 1500–1508. [Google Scholar] [CrossRef] [Green Version]
- Zhu, P.; Zhao, Y. Cyclic Voltammetry Measurements of Electroactive Surface Area of Porous Nickel: Peak Current and Peak Charge Methods and Diffusion Layer Effect. Mater. Chem. Phys. 2019, 233, 60–67. [Google Scholar] [CrossRef]
- Bounegru, A.V.; Apetrei, C. Simultaneous Determination of Caffeic Acid and Ferulic Acid Using a Carbon Nanofiber-Based Screen-Printed Sensor. Sensors 2022, 22, 4689. [Google Scholar] [CrossRef]
- Gunache (Roșca), R.O.; Bounegru, A.V.; Apetrei, C. Determination of Atorvastatin with Voltammetric Sensors Based on Nanomaterials. Inventions 2021, 6, 57. [Google Scholar] [CrossRef]
- Tran, M.T.; Tran, H.V. Verbascoside Extracted from Clerodendrum Inerme: A Natural Monomer for the Fabrication of a Sensitive Electrochemical Cu(II) Sensor. J. Chem. Res. 2022, 46, 6596. [Google Scholar] [CrossRef]
- Matos, P.; Paranhos, A.; Batista, M.T.; Figueirinha, A. Synergistic Effect of DIBOA and Verbascoside from Acanthus Mollis Leaf on Tyrosinase Inhibition. Int. J. Mol. Sci. 2022, 23, 13536. [Google Scholar] [CrossRef]
- Ribeiro, G.D.S.; Carneiro, A.D.A.; Martins, D.H.N.; Simeoni, L.A.; Silveira, D.; Magalhães, P.O.; Fonseca-Bazzo, Y.M. Determination of Harpagoside in Harpagophytum Procumbens DC Tablet’s Using Analytical Method by High Performance Liquid Chromatography. Eclética Quím. J. 2020, 45, 47. [Google Scholar] [CrossRef]
- Araujo, P. Key Aspects of Analytical Method Validation and Linearity Evaluation. J. Chromatogr. B 2009, 877, 2224–2234. [Google Scholar] [CrossRef]
- Gustavo González, A.; Ángeles Herrador, M. A Practical Guide to Analytical Method Validation, Including Measurement Uncertainty and Accuracy Profiles. TrAC Trends Anal. Chem. 2007, 26, 227–238. [Google Scholar] [CrossRef]
- Gali, L.; Bedjou, F. Antioxidant and Anticholinesterase Effects of the Ethanol Extract, Ethanol Extract Fractions and Total Alkaloids from the Cultivated Ruta Chalepensis. S. Afr. J. Bot. 2019, 120, 163–169. [Google Scholar] [CrossRef]
- Akar, Z.; Küçük, M.; Doğan, H. A New Colorimetric DPPH• Scavenging Activity Method with No Need for a Spectrophotometer Applied on Synthetic and Natural Antioxidants and Medicinal Herbs. J. Enzyme Inhib. Med. Chem. 2017, 32, 640–647. [Google Scholar] [CrossRef] [Green Version]
- Zielińska, D.; Turemko, M. Electroactive Phenolic Contributors and Antioxidant Capacity of Flesh and Peel of 11 Apple Cultivars Measured by Cyclic Voltammetry and HPLC–DAD–MS/MS. Antioxidants 2020, 9, 1054. [Google Scholar] [CrossRef]
- Munteanu, I.G.; Apetrei, C. Tyrosinase-Based Biosensor—A New Tool for Chlorogenic Acid Detection in Nutraceutical Formulations. Materials 2022, 15, 3221. [Google Scholar] [CrossRef]
- Munteanu, I.G.; Apetrei, C. Assessment of the Antioxidant Activity of Catechin in Nutraceuticals: Comparison between a Newly Developed Electrochemical Method and Spectrophotometric Methods. Int. J. Mol. Sci. 2022, 23, 8110. [Google Scholar] [CrossRef]
- Bounegru, A.V.; Apetrei, C. Sensitive Detection of Hydroxytyrosol in Extra Virgin Olive Oils with a Novel Biosensor Based on Single-Walled Carbon Nanotubes and Tyrosinase. Int. J. Mol. Sci. 2022, 23, 9132. [Google Scholar] [CrossRef]
- Arteaga, J.F.; Ruiz-Montoya, M.; Palma, A.; Alonso-Garrido, G.; Pintado, S.; Rodríguez-Mellado, J.M. Comparison of the Simple Cyclic Voltammetry (CV) and DPPH Assays for the Determination of Antioxidant Capacity of Active Principles. Mol. Basel Switz. 2012, 17, 5126–5138. [Google Scholar] [CrossRef]
- Rodriguez-Mendez, M.L.; Apetrei, C.; Gay, M.; Medina-Plaza, C.; de Saja, J.A.; Vidal, S.; Aagaard, O.; Ugliano, M.; Wirth, J.; Cheynier, V. Evaluation of Oxygen Exposure Levels and Polyphenolic Content of Red Wines Using an Electronic Panel Formed by an Electronic Nose and an Electronic Tongue. Food Chem. 2014, 155, 91–97. [Google Scholar] [CrossRef]
- Alipieva, K.; Korkina, L.; Orhan, I.E.; Georgiev, M.I. Verbascoside—A Review of Its Occurrence, (Bio)Synthesis and Pharmacological Significance. Biotechnol. Adv. 2014, 32, 1065–1076. [Google Scholar] [CrossRef]
- Vertuani, S.; Beghelli, E.; Scalambra, E.; Malisardi, G.; Copetti, S.; Toso, R.D.; Baldisserotto, A.; Manfredini, S. Activity and Stability Studies of Verbascoside, a Novel Antioxidant, in Dermo-Cosmetic and Pharmaceutical Topical Formulations. Molecules 2011, 16, 7068–7080. [Google Scholar] [CrossRef]


| Sensor | Ipa 1 (µA) | Ipc 2 (µA) | Ipc/Ipa | Epa 3 (V) | Epc 4 (V) | E1/2 5 (V) | ΔEp 6 (V) |
|---|---|---|---|---|---|---|---|
| SPCE/GPHOX | 10.19 | −10.82 | 1.06 | 0.33 | 0.01 | 0.170 | 0.32 |
| SPCE/GPHOX-Pentapeptide | 16.77 | −19.07 | 1.13 | 0.18 | 0.09 | 0.135 | 0.09 |
| Sensor | Epa1 (V) | Epa2 (V) | Ipa1 (µA) | Ipa2 (µA) | Epc1 (V) | Epc2 (V) | Ipc1 (µA) | Ipc2 (µA) |
|---|---|---|---|---|---|---|---|---|
| SPCE/GPHOX | 0.38 | - | 6.05 | - | 0.21 | - | −3.46 | - |
| SPCE/GPHOX-Pentapeptide | 0.08 | 0.35 | 4.79 | 10.74 | 0.01 | 0.22 | −7.20 | −5.22 |
| Theoretical Concentration (µM) | Discovered Concentration (µM) | Recovery % |
|---|---|---|
| 1.59 | 1.55 | 97.5 |
| 2.39 | 2.48 | 103.8 |
| 3.99 | 3.93 | 98.7 |
| 5.57 | 5.61 | 100.8 |
| 6.56 | 6.66 | 101.7 |
| Interfering Compound | Concentration of the Interfering Compound (M) | Recovery % | RSD % (±%) |
|---|---|---|---|
| Tyrosol | 10−5 M | 101.09 | 1.22 |
| Hydroxytyrosol | 10−5 M | 103.18 | 1.31 |
| Oleuropein | 10−5 M | 102.85 | 1.28 |
| EVOO Samples | mg/kg Verbascoside Achieved by CV | RSD (±%) |
|---|---|---|
| Pietro Coricelli | 1.36 | 0.02 |
| TopSeller Oil | 1.42 | 0.03 |
| Regina | 1.38 | 0.01 |
| Mazza | 1.41 | 0.03 |
| Olitalia | 1.49 | 0.04 |
| Costa d’Oro Il Grezzo | 1.54 | 0.04 |
| Minerva | 1.55 | 0.06 |
| Costa D’Oro L’extra | 1.72 | 0.05 |
| Monastiri | 1.36 | 0.02 |
| Rivano Olio | 1.39 | 0.03 |
| EVOO Samples | % Inhibition-DPPH |
|---|---|
| Pietro Coricelli | 10.3 |
| TopSeller Oil | 13.1 |
| Regina | 14.5 |
| Mazza | 18.7 |
| Olitalia | 21.2 |
| Costa d’Oro Il Grezzo | 16.3 |
| Minerva | 22.9 |
| Costa D’Oro L’extra | 24.7 |
| Monastiri | 20.3 |
| Rivano Olio | 20.6 |
| Calibration | CV-DPPH |
|---|---|
| Slope | 0.954 |
| Offset | 0.847 |
| Correlation | 0.977 |
| RMSEC | 0.939 |
| Validation | |
| Slope | 0.930 |
| Offset | 1.271 |
| Correlation | 0.956 |
| RMSEP | 1.285 |
| No. | Oils Denomination | Country of Provenience |
|---|---|---|
| 1 | Pietro Coricelli | Italy |
| 2 | TopSeller Oil | Spain |
| 3 | Regina | Italy |
| 4 | Mazza | Italy |
| 5 | Olitalia | Italy |
| 6 | Costa d’Oro Il Grezzo | Italy |
| 7 | Minerva | Greece |
| 8 | Costa D’Oro L’extra | Italy |
| 9 | Monastiri | Greece |
| 10 | Rivano Olio | Italy |
Publisher’s Note: MDPI stays neutral with regard to jurisdictional claims in published maps and institutional affiliations. |
© 2022 by the authors. Licensee MDPI, Basel, Switzerland. This article is an open access article distributed under the terms and conditions of the Creative Commons Attribution (CC BY) license (https://creativecommons.org/licenses/by/4.0/).
Share and Cite
Munteanu, I.G.; Grădinaru, V.R.; Apetrei, C. Development of a Chemically Modified Sensor Based on a Pentapeptide and Its Application for Sensitive Detection of Verbascoside in Extra Virgin Olive Oil. Int. J. Mol. Sci. 2022, 23, 15704. https://0-doi-org.brum.beds.ac.uk/10.3390/ijms232415704
Munteanu IG, Grădinaru VR, Apetrei C. Development of a Chemically Modified Sensor Based on a Pentapeptide and Its Application for Sensitive Detection of Verbascoside in Extra Virgin Olive Oil. International Journal of Molecular Sciences. 2022; 23(24):15704. https://0-doi-org.brum.beds.ac.uk/10.3390/ijms232415704
Chicago/Turabian StyleMunteanu, Irina Georgiana, Vasile Robert Grădinaru, and Constantin Apetrei. 2022. "Development of a Chemically Modified Sensor Based on a Pentapeptide and Its Application for Sensitive Detection of Verbascoside in Extra Virgin Olive Oil" International Journal of Molecular Sciences 23, no. 24: 15704. https://0-doi-org.brum.beds.ac.uk/10.3390/ijms232415704