
A Genome-Wide Association Study of 2304 Extreme Longevity Cases Identifies Novel Longevity Variants
 , , , ,
  , add
Show full author list
, add
Show full author list
Abstract
:1. Introduction
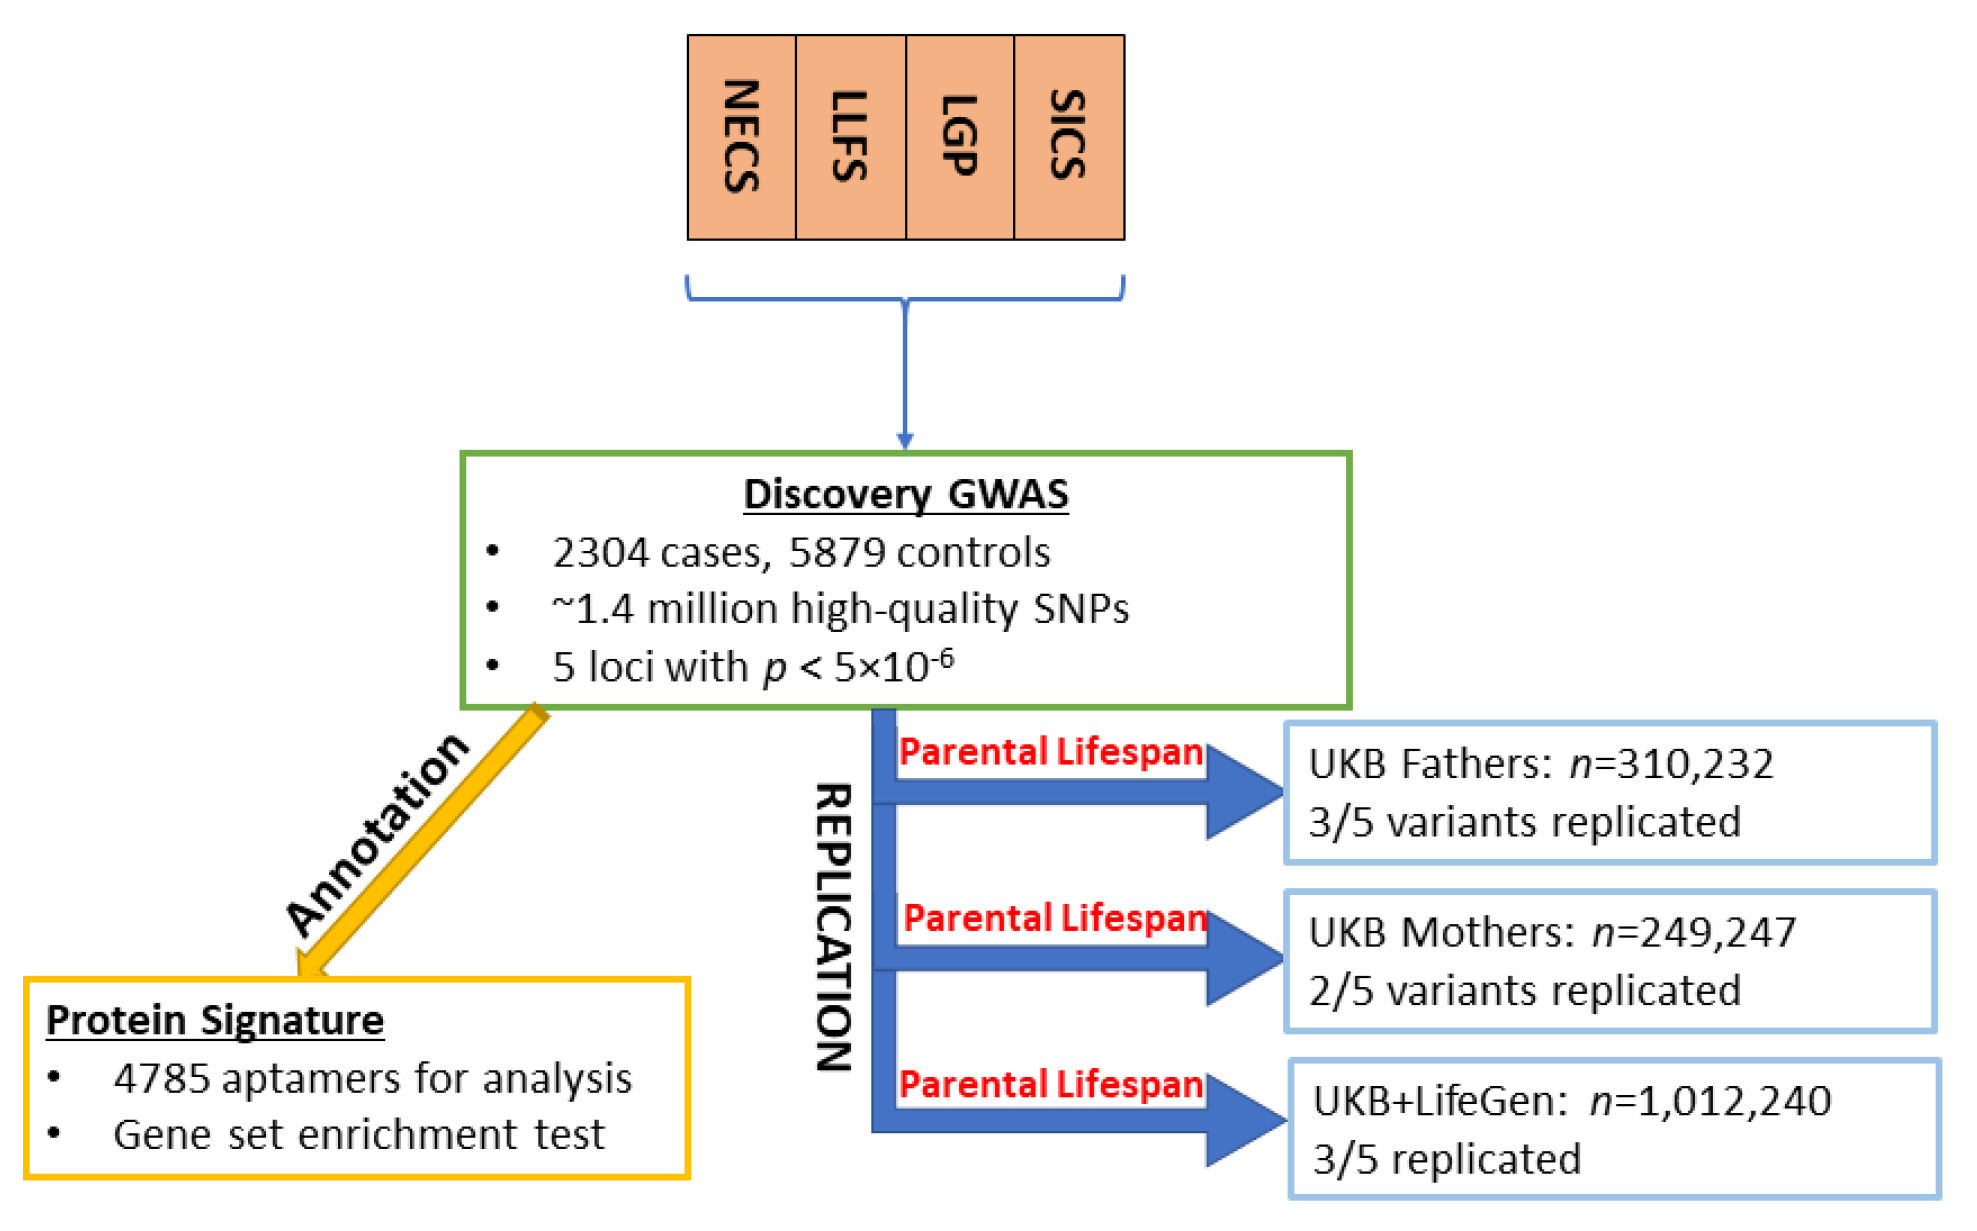
2. Materials and Methods
2.1. Study Populations and Genetic Data
Longevity Studies
2.2. Definition of Extreme Longevity Phenotype
2.3. Replication Cohorts
2.3.1. UKB Father and Mother
2.3.2. UKB+LifeGen
2.4. Statistical Analysis
2.5. Replication Criteria
2.6. Protein Quantitative Trait Loci (pQTL) Analysis

| Discovery GWAS | UKB-F | UKB-M | UKB+LifeGen | |||||||||||||||
|---|---|---|---|---|---|---|---|---|---|---|---|---|---|---|---|---|---|---|
| rsID | Gene | Chr | Pos | EA/NEA | EAF in Cases | EAF in Controls | Beta | SE | p | Beta | SE | p | Beta | SE | p | Beta | SE | p |
| rs429358 | APOE | 19 | 45411941 | T/C | 0.95 | 0.88 | 0.84 | 0.065 | 1.94 × 10−36 | 0.020 | 0.0034 | 3.27 × 10⁻⁹ | 0.019 | 0.0036 | 2.58 × 10⁻⁷ | 0.106 | 0.0055 | 3.14 × 10−83 |
| rs6475609 | CDKN2B-AS1 | 9 | 22106271 | A/G | 0.49 | 0.42 | 0.21 | 0.039 | 7.13 × 10⁻⁸ | 0.019 | 0.0025 | 1.41 × 10⁻¹⁴ | 0.006 | 0.0027 | 0.03 | 0.024 | 0.0039 | 9.98 × 10⁻¹⁰ |
| rs145265196 | RPLP0P2 | 11 | 61401362 | G/T | 0.007 | 0.002 | 1.74 | 0.347 | 6.29 × 10⁻⁷ | −0.022 | 0.0405 | 0.59 | 0.025 | 0.0443 | 0.57 | NA | NA | NA |
| rs9657521 | OR7E161P| DEFB136 | 8 | 11830502 | A/C | 0.76 | 0.71 | 0.20 | 0.044 | 3.86 × 10⁻⁶ | 0.009 | 0.0027 | 0.0012 | 0.005 | 0.0029 | 0.07 | 0.013 | 0.0043 | 0.0021 |
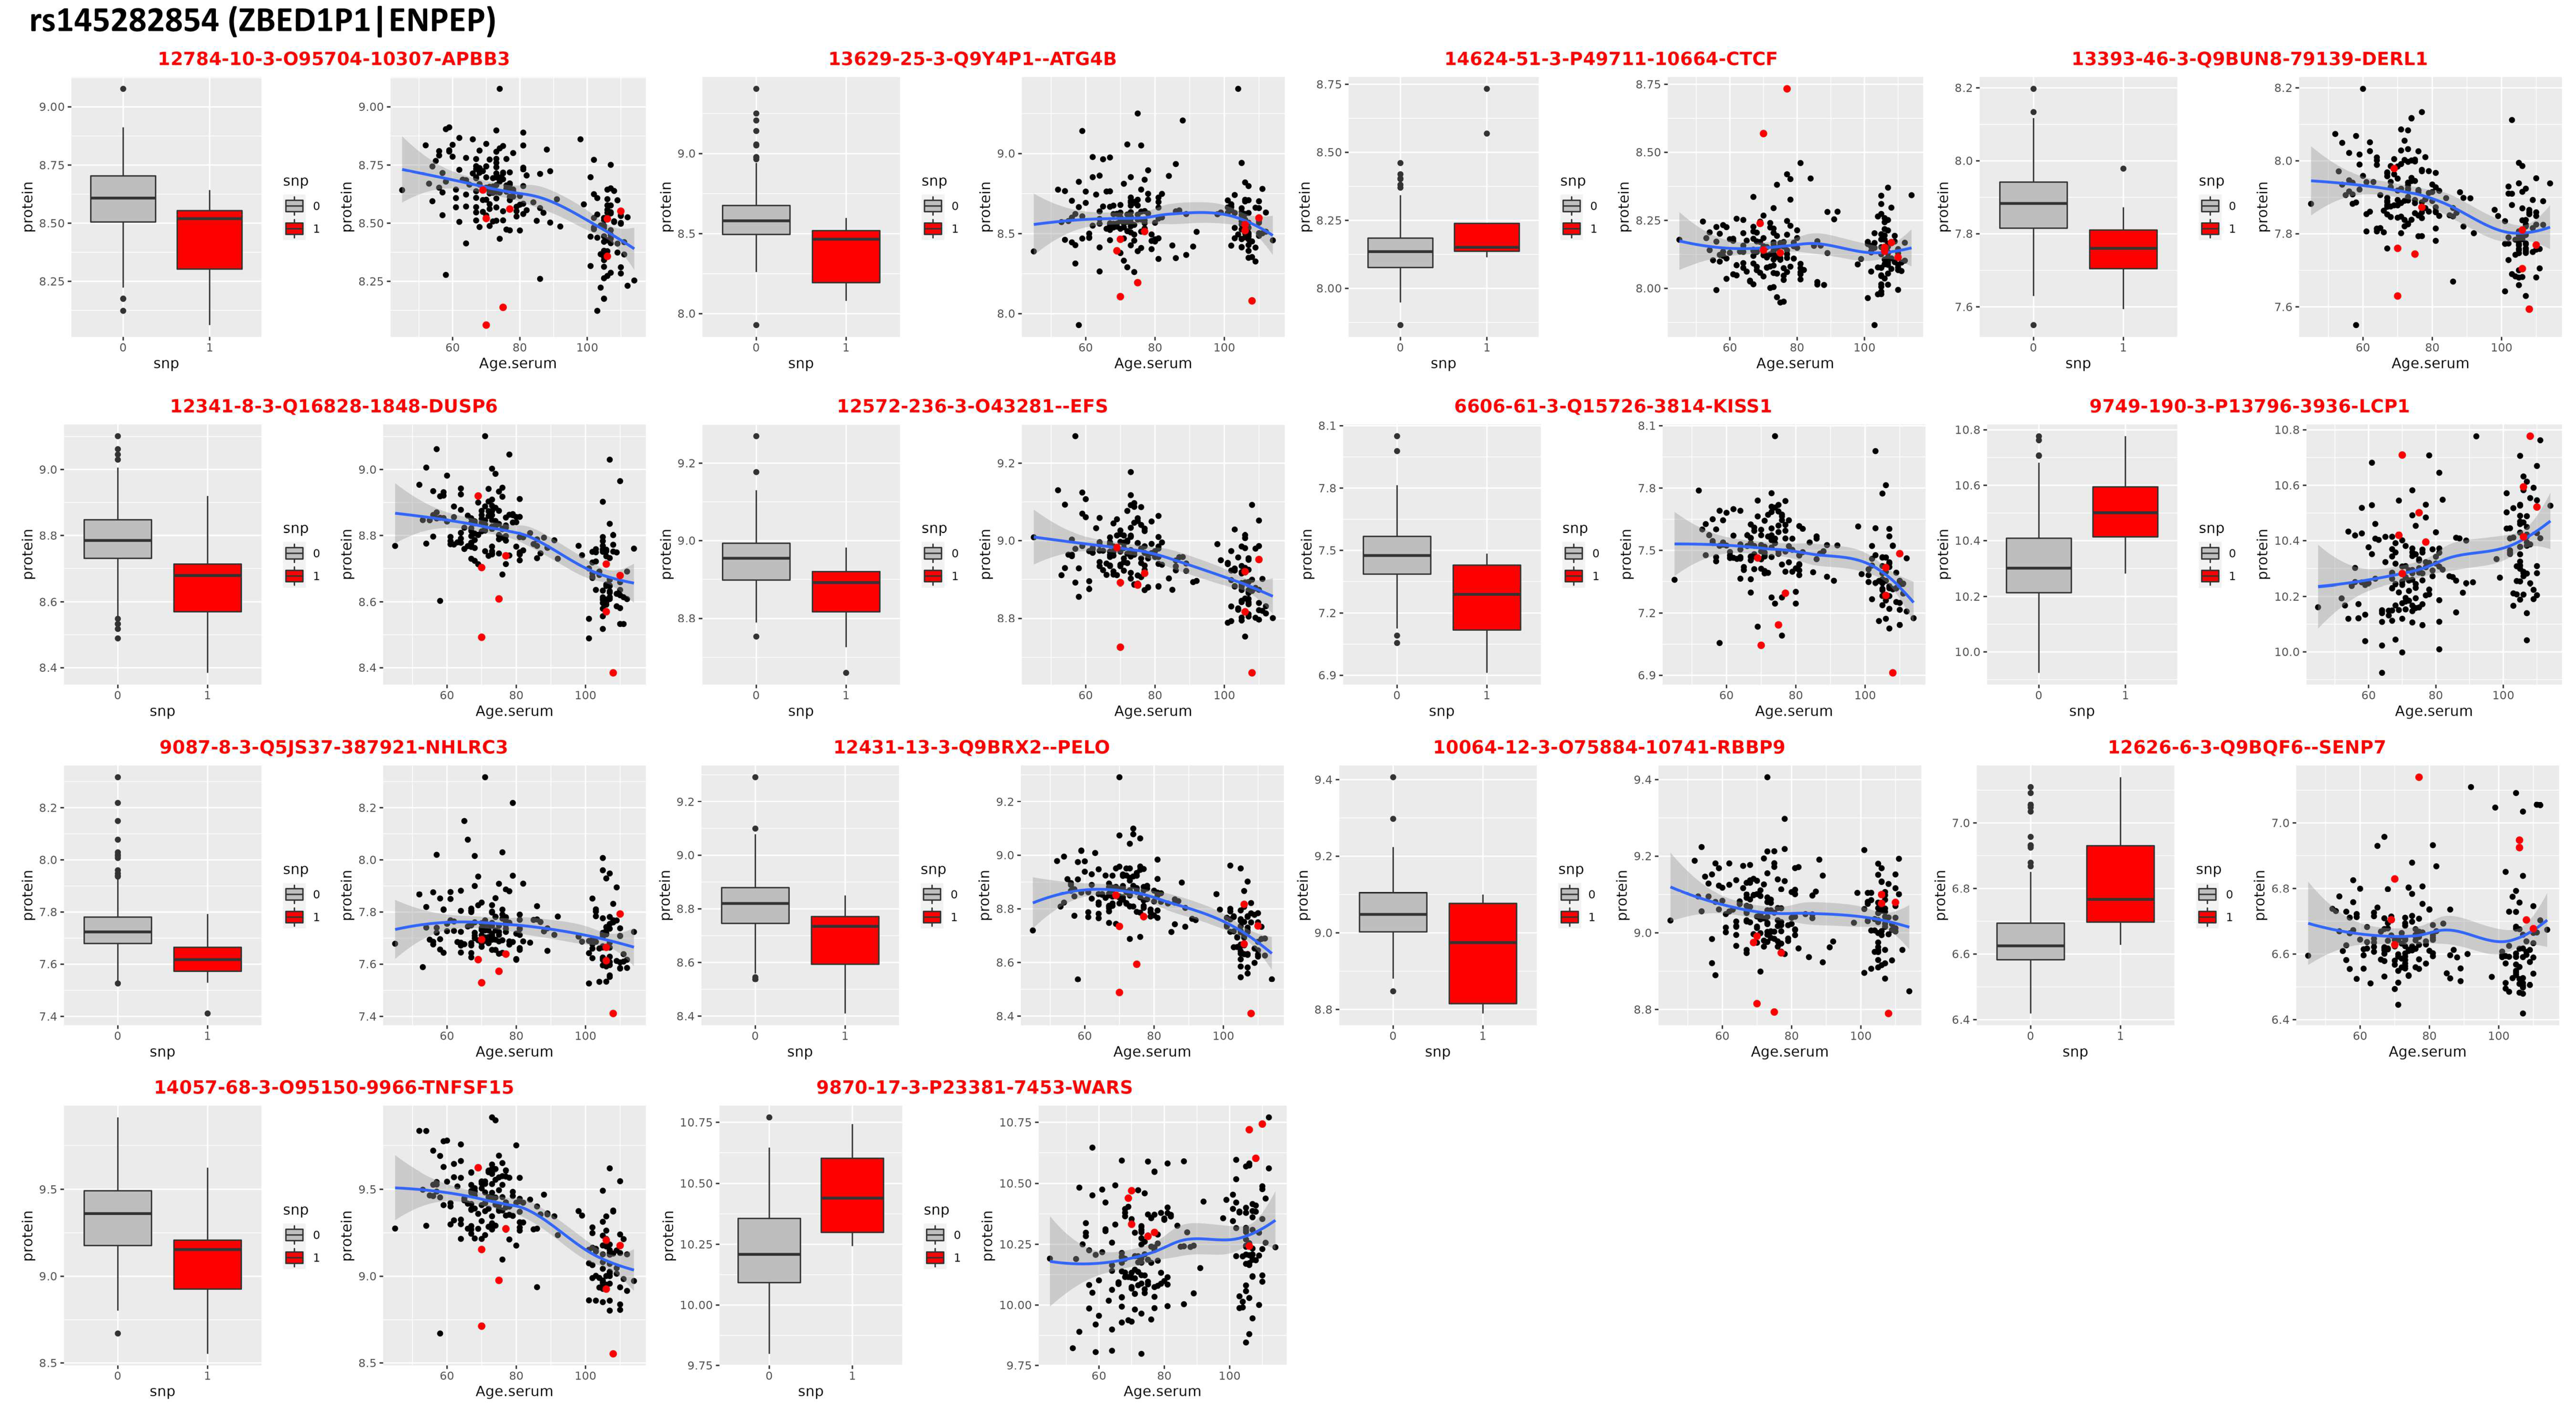
| rs145282854 * | ZBED1P1| ENPEP | 4 | 111244992 | A/G | 0.022 | 0.013 | 0.72 | 0.157 | 5.47 × 10⁻⁶ | −0.013 | 0.0124 | 0.29 | −0.014 | 0.0134 | 0.30 | 0.003 | 0.0195 | 0.89 |
2.7. Gene Set Enrichment Analysis
2.8. Phenome-Wide Association Study (PheWAS) Search
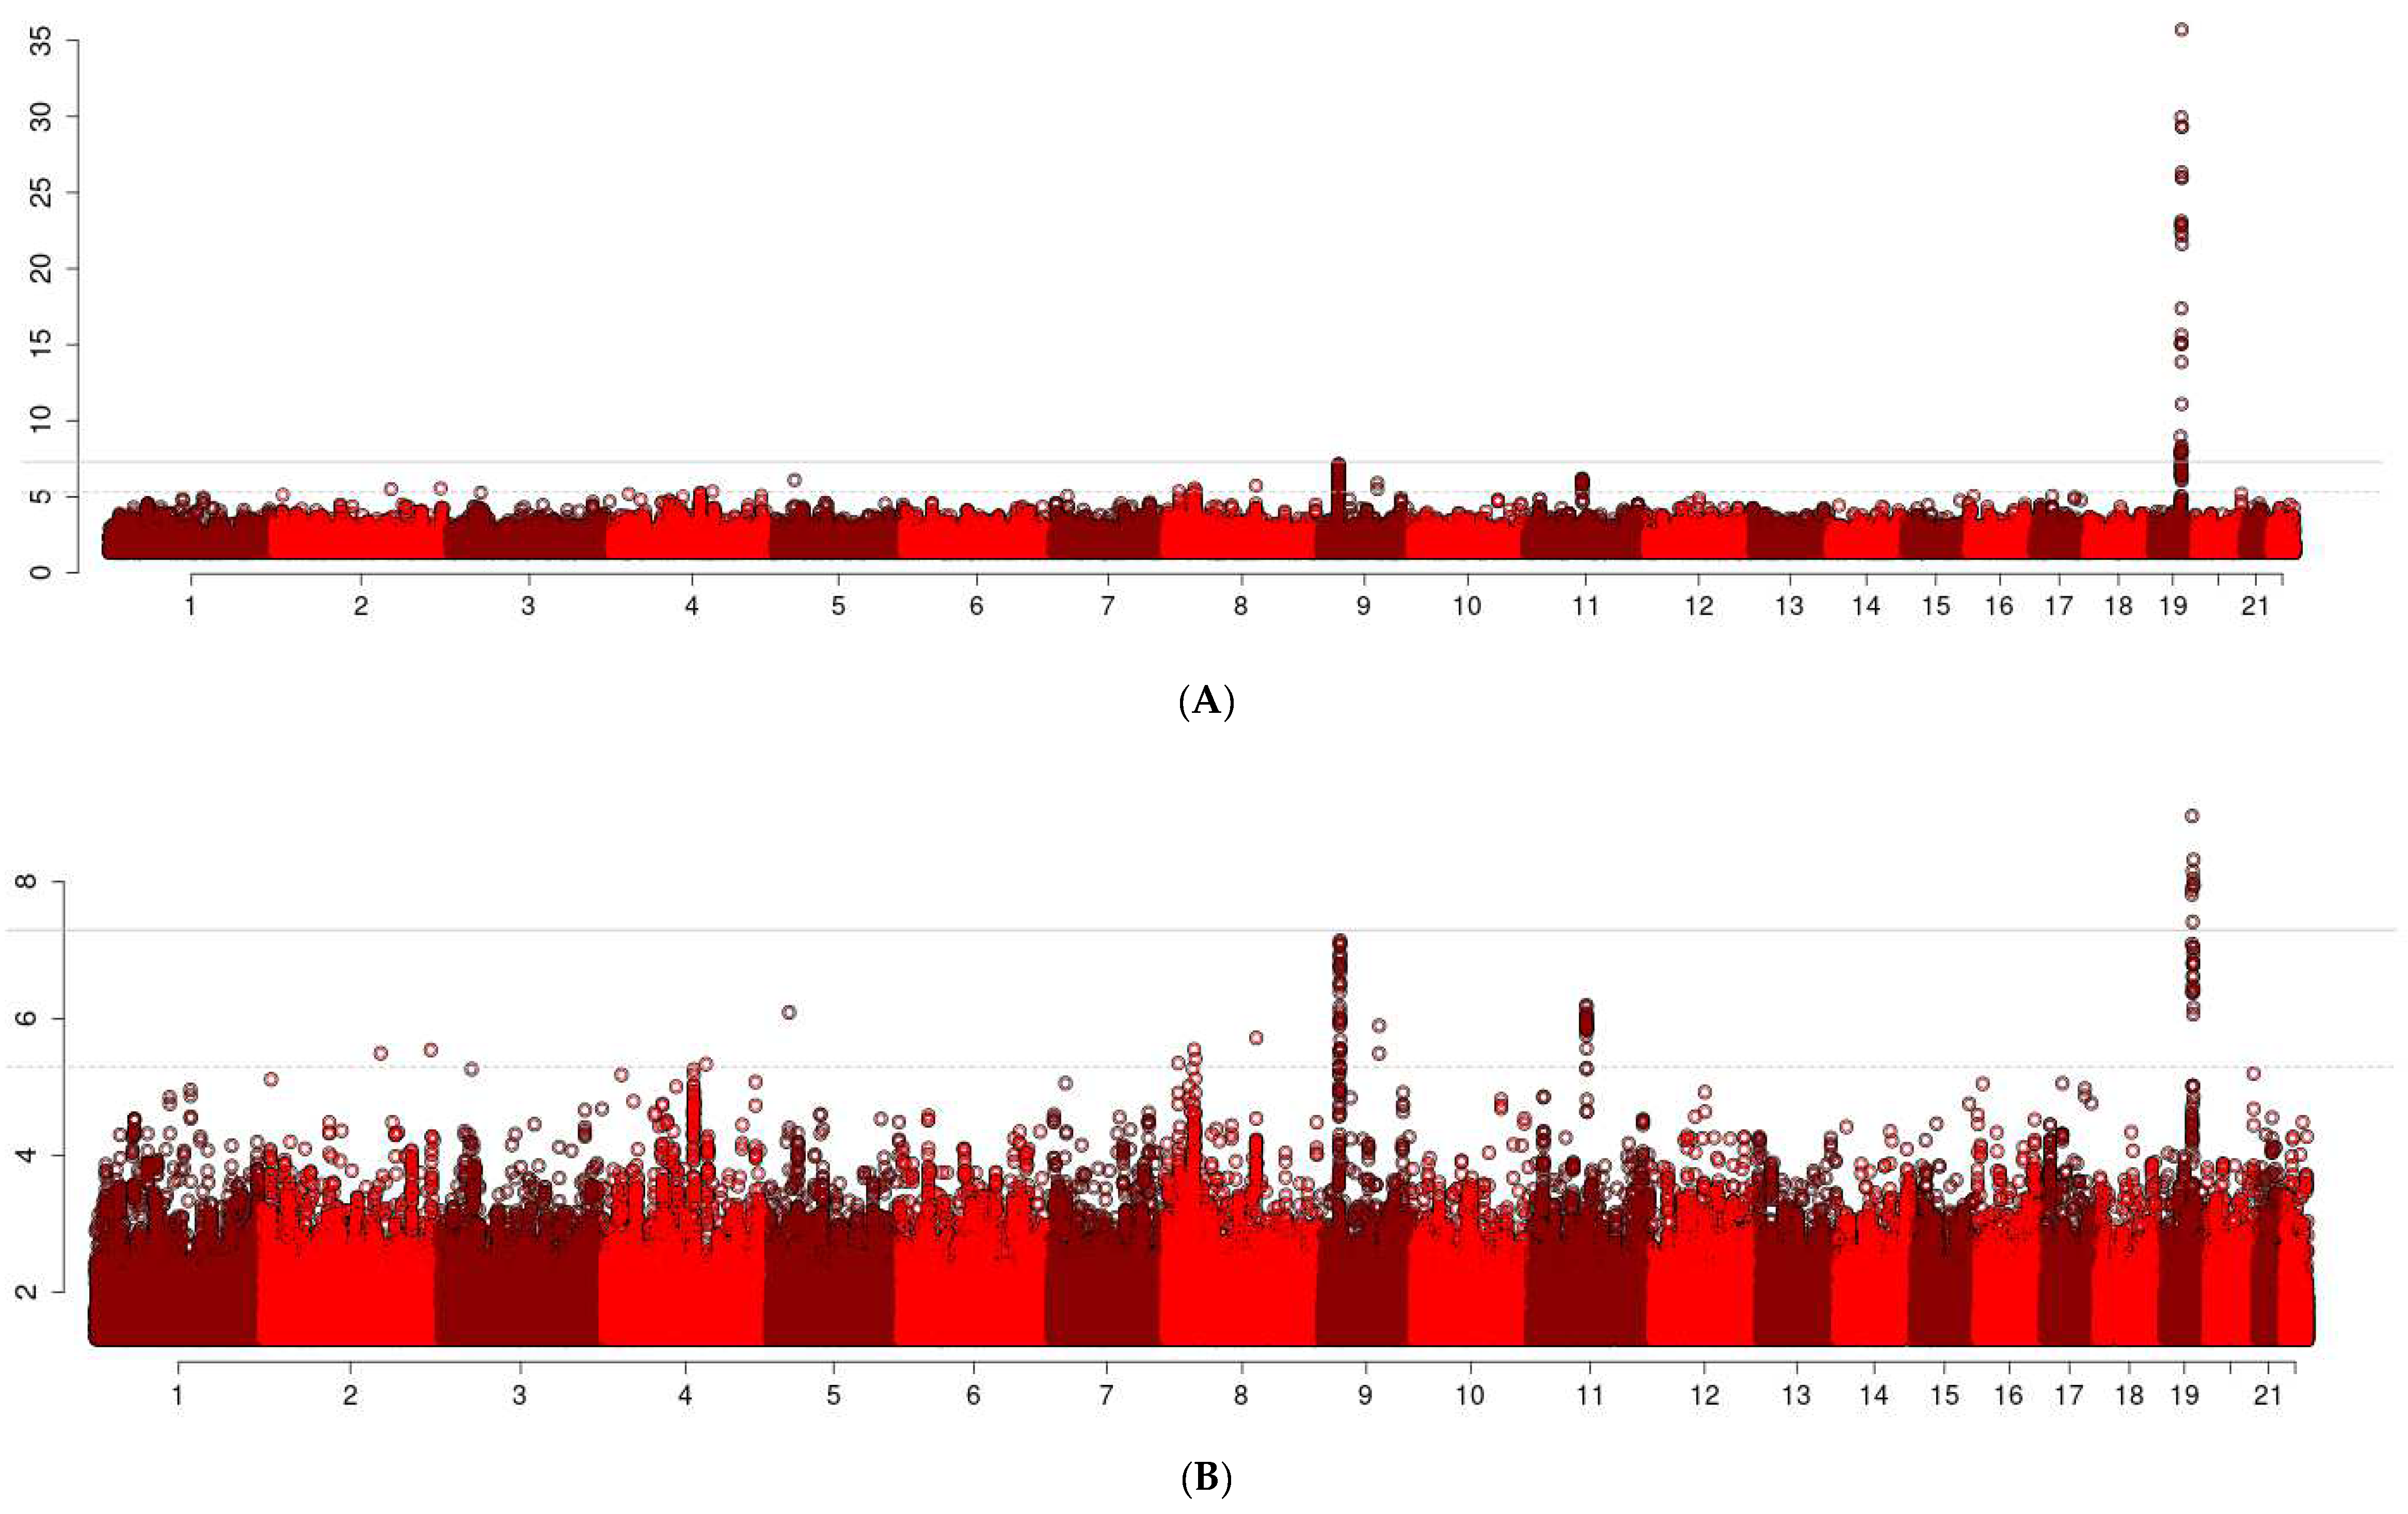
3. Results
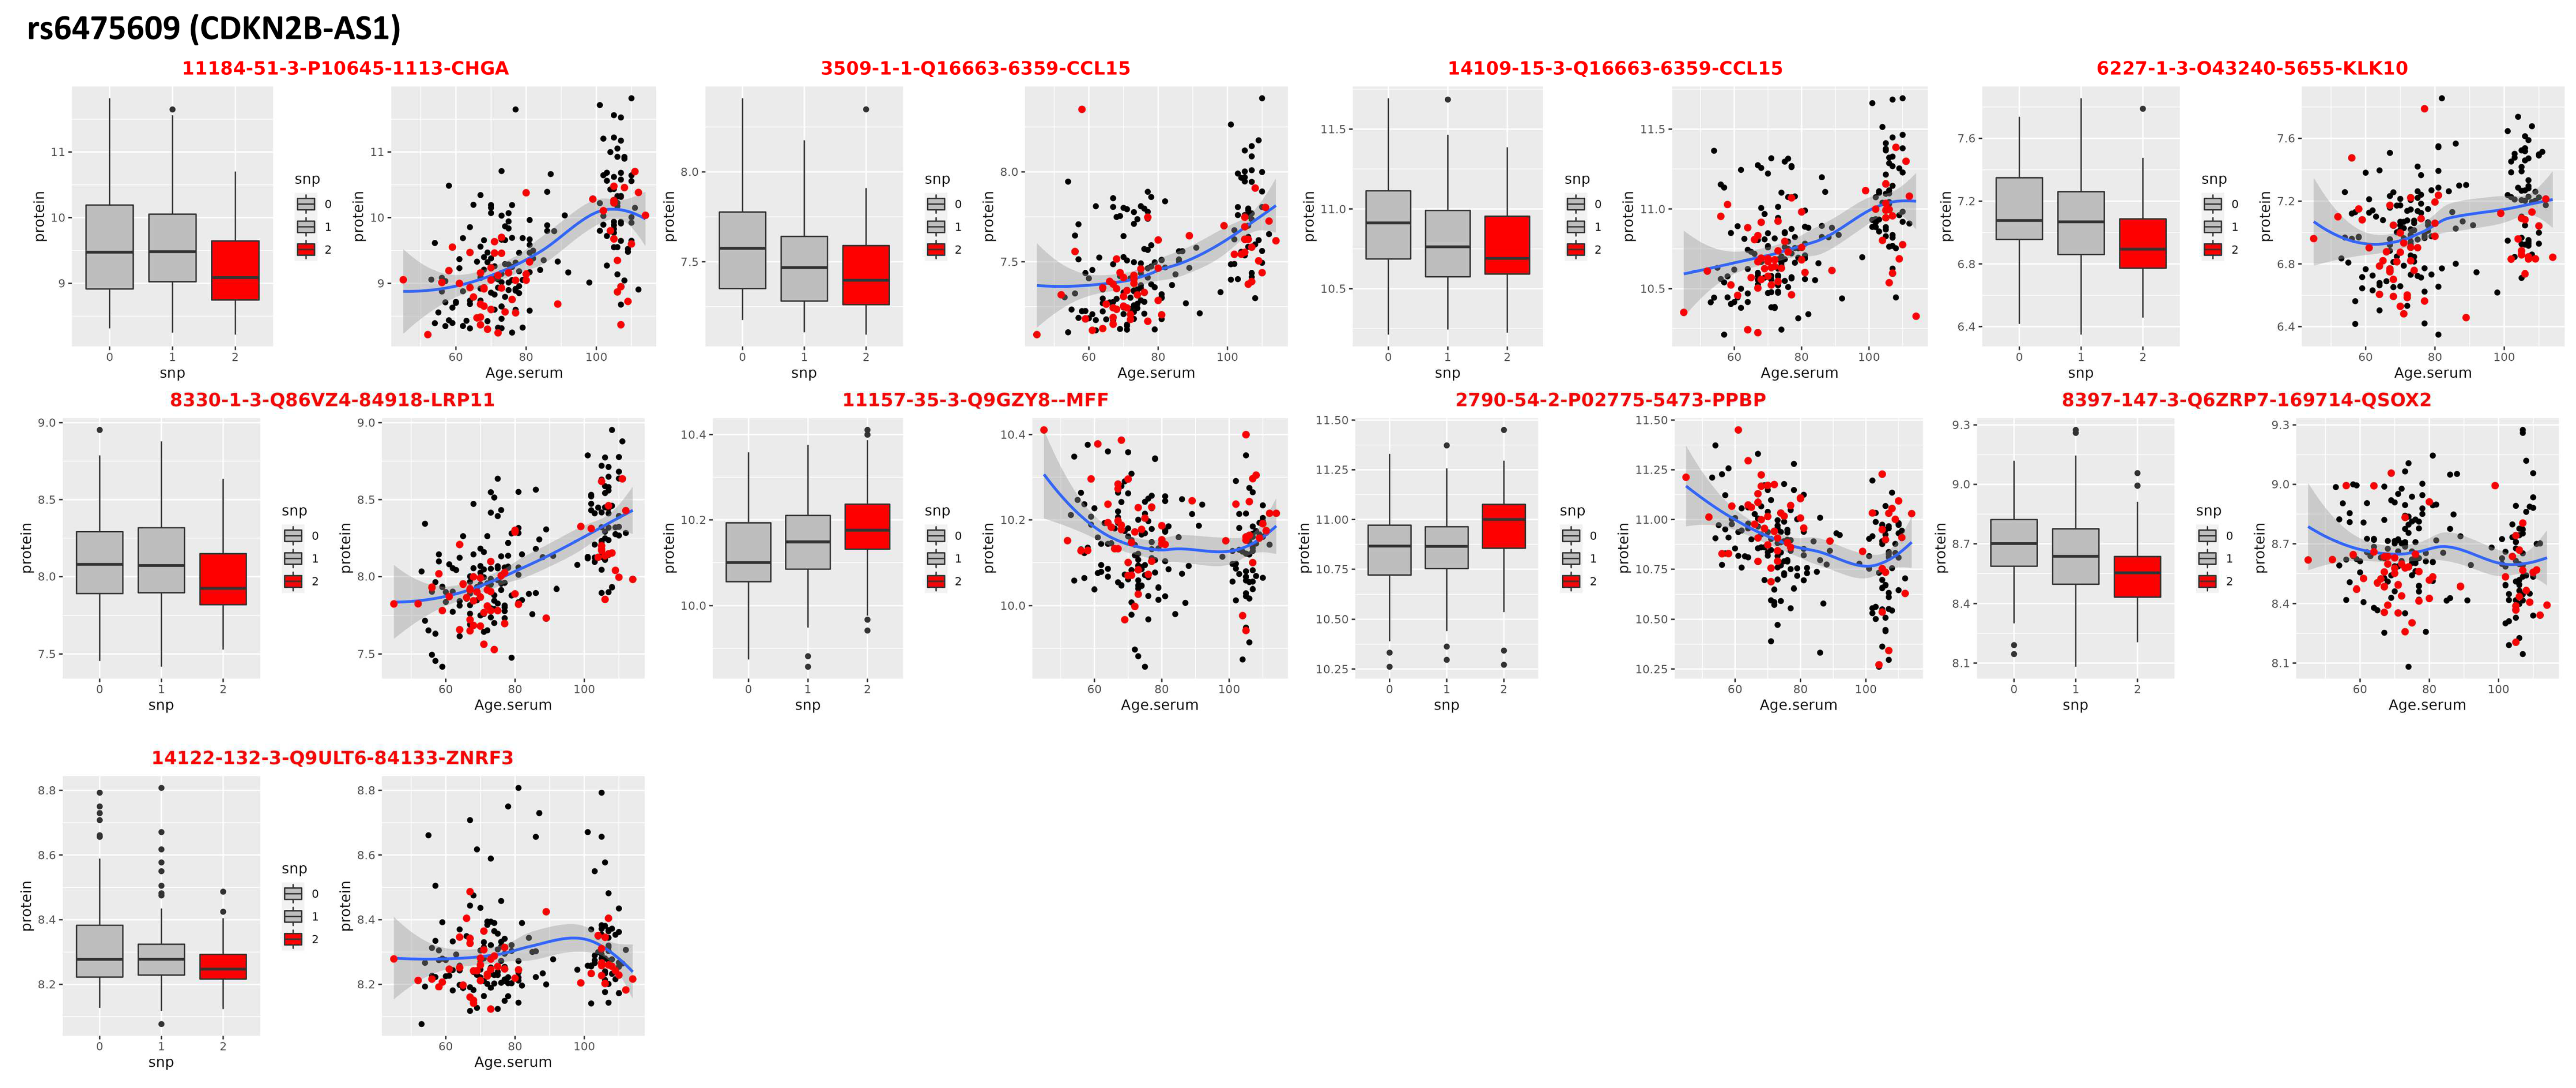
3.1. Locus on Chromosome 9: CDKN2B-AS1
3.2. Locus on Chromosome 11: RPLPOP2
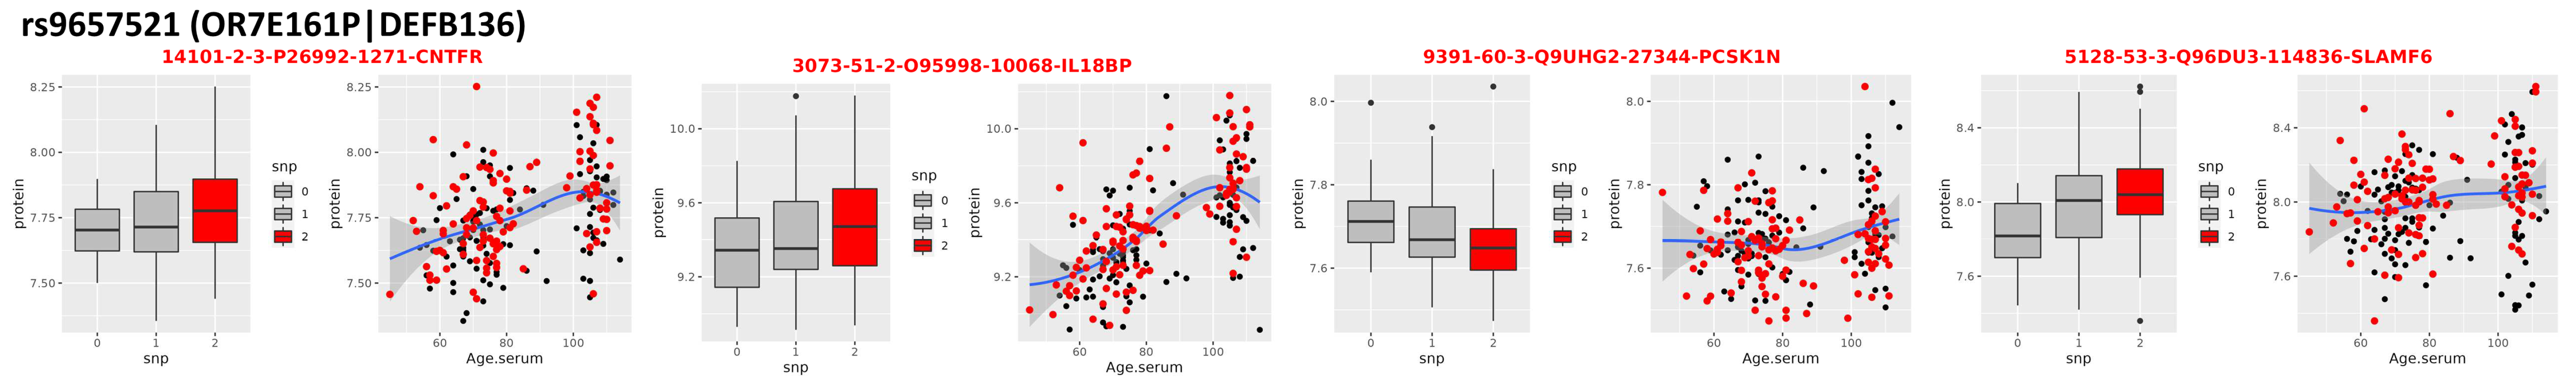
3.3. Locus on Chromosome 8
3.4. Locus on Chromosome 4
4. Discussion
5. Conclusions
Supplementary Materials
Author Contributions
Funding
Institutional Review Board Statement
Informed Consent Statement
Data Availability Statement
Conflicts of Interest
References
- Andersen, S.L.; Sebastiani, P.; Dworkis, D.A.; Feldman, L.; Perls, T.T. Health span approximates life span among many supercentenarians: Compression of morbidity at the approximate limit of life span. J. Gerontol. Ser. A Biomed. Sci. Med. Sci. 2012, 67, 395–405. [Google Scholar] [CrossRef] [PubMed]
- Pignolo, R.J. Exceptional Human Longevity. Mayo Clin. Proc. 2019, 94, 110–124. [Google Scholar] [CrossRef] [PubMed] [Green Version]
- Perls, T.; Shea-Drinkwater, M.; Bowen-Flynn, J.; Ridge, S.B.; Kang, S.; Joyce, E.; Daly, M.; Brewster, S.J.; Kunkel, L.; Puca, A.A. Exceptional familial clustering for extreme longevity in humans. J. Am. Geriatr. Soc. 2000, 48, 1483–1485. [Google Scholar] [CrossRef] [PubMed]
- Perls, T.T.; Wilmoth, J.; Levenson, R.; Drinkwater, M.; Cohen, M.; Bogan, H.; Joyce, E.; Brewster, S.; Kunkel, L.; Puca, A. Life-long sustained mortality advantage of siblings of centenarians. Proc. Natl. Acad. Sci. USA 2002, 99, 8442–8447. [Google Scholar] [CrossRef] [PubMed] [Green Version]
- Sebastiani, P.; Nussbaum, L.; Andersen, S.L.; Black, M.J.; Perls, T.T. Increasing Sibling Relative Risk of Survival to Older and Older Ages and the Importance of Precise Definitions of “Aging”, “Life Span”, and “Longevity”. J. Gerontol. Ser. A Biomed. Sci. Med. Sci. 2016, 71, 340–346. [Google Scholar] [CrossRef] [Green Version]
- Deelen, J.; Evans, D.S.; Arking, D.E.; Tesi, N.; Nygaard, M.; Liu, X.; Wojczynski, M.K.; Biggs, M.L.; van der Spek, A.; Atzmon, G.; et al. A meta-analysis of genome-wide association studies identifies multiple longevity genes. Nat. Commun. 2019, 10, 3669. [Google Scholar] [CrossRef] [Green Version]
- Bae, H.; Gurinovich, A.; Malovini, A.; Atzmon, G.; Andersen, S.L.; Villa, F.; Barzilai, N.; Puca, A.; Perls, T.T.; Sebastiani, P. Effects of FOXO3 Polymorphisms on Survival to Extreme Longevity in Four Centenarian Studies. J. Gerontol. Ser. A 2018, 73, 1439–1447. [Google Scholar] [CrossRef] [Green Version]
- Sebastiani, P.; Gurinovich, A.; Bae, H.; Andersen, S.; Malovini, A.; Atzmon, G.; Villa, F.; Kraja, A.T.; Ben-Avraham, D.; Barzilai, N.; et al. Four Genome-Wide Association Studies Identify New Extreme Longevity Variants. J. Gerontol. A Biol. Sci. Med. Sci. 2017, 72, 1453–1464. [Google Scholar] [CrossRef] [Green Version]
- Abondio, P.; Sazzini, M.; Garagnani, P.; Boattini, A.; Monti, D.; Franceschi, C.; Luiselli, D.; Giuliani, C. The Genetic Variability of APOE in Different Human Populations and Its Implications for Longevity. Genes 2019, 10, 222. [Google Scholar] [CrossRef] [Green Version]
- Gurinovich, A.; Bae, H.; Farrell, J.J.; Andersen, S.L.; Monti, S.; Puca, A.; Atzmon, G.; Barzilai, N.; Perls, T.T.; Sebastiani, P. PopCluster: An algorithm to identify genetic variants with ethnicity-dependent effects. Bioinformatics 2019, 35, 3046–3054. [Google Scholar] [CrossRef]
- Giuliani, C.; Garagnani, P.; Franceschi, C. Genetics of Human Longevity Within an Eco-Evolutionary Nature-Nurture Framework. Circ. Res. 2018, 123, 745–772. [Google Scholar] [CrossRef] [PubMed]
- Marron, M.M.; Wojczynski, M.K.; Minster, R.L.; Boudreau, R.M.; Sebastiani, P.; Cosentino, S.; Thyagarajan, B.; Ukraintseva, S.V.; Schupf, N.; Feitosa, M.; et al. Heterogeneity of healthy aging: Comparing long-lived families across five healthy aging phenotypes of blood pressure, memory, pulmonary function, grip strength, and metabolism. Geroscience 2019, 41, 383–393. [Google Scholar] [CrossRef] [PubMed] [Green Version]
- McCarthy, S.; Das, S.; Kretzschmar, W.; Delaneau, O.; Wood, A.R.; Teumer, A.; Kang, H.M.; Fuchsberger, C.; Danecek, P.; Sharp, K.; et al. A reference panel of 64,976 haplotypes for genotype imputation. Nat. Genet. 2016, 48, 1279–1283. [Google Scholar] [PubMed] [Green Version]
- Chen, M.H.; Pitsillides, A.; Yang, Q. An evaluation of approaches for rare variant association analyses of binary traits in related samples. Sci. Rep. 2021, 11, 3145. [Google Scholar] [CrossRef]
- Dey, R.; Schmidt, E.M.; Abecasis, G.R.; Lee, S. A Fast and Accurate Algorithm to Test for Binary Phenotypes and Its Application to PheWAS. Am. J. Hum. Genet. 2017, 101, 37–49. [Google Scholar] [CrossRef]
- Bycroft, C.; Freeman, C.; Petkova, D.; Band, G.; Elliott, L.T.; Sharp, K.; Motyer, A.; Vukcevic, D.; Delaneau, O.; O’Connell, J.; et al. The UK Biobank resource with deep phenotyping and genomic data. Nature 2018, 562, 203–209. [Google Scholar] [CrossRef] [Green Version]
- Timmers, P.R.; Mounier, N.; Lall, K.; Fischer, K.; Ning, Z.; Feng, X.; Bretherick, A.D.; Clark, D.W.; Agbessi, M.; Ahsan, H.; et al. Genomics of 1 million parent lifespans implicates novel pathways and common diseases and distinguishes survival chances. Elife 2019, 8, 856. [Google Scholar] [CrossRef]
- Das, S.; Forer, L.; Schonherr, S.; Sidore, C.; Locke, A.E.; Kwong, A.; Vrieze, S.I.; Chew, E.Y.; Levy, S.; McGue, M.; et al. Next-generation genotype imputation service and methods. Nat. Genet. 2016, 48, 1284–1287. [Google Scholar] [CrossRef] [Green Version]
- Bell, F.; Miller, M. Life Tables for the United States Social Security Area 1900–2100; Social Security Administration, Office of the Chief Actuary: Baltimore, MD, USA, 2005; p. 21235.
- Pan-UKB T. 2020. Available online: https://pan.ukbb.broadinstitute.org (accessed on 31 May 2022).
- Gurinovich, A.; Li, M.; Leshchyk, A.; Bae, H.; Song, Z.; Arbeev, K.G.; Nygaard, M.; Feitosa, M.F.; Perls, T.T.; Sebastiani, P. Evaluation of GENESIS, SAIGE, REGENIE and fastGWA-GLMM for genome-wide association studies of binary traits in correlated data. Front. Genet. 2022, 13, 897210. [Google Scholar] [CrossRef]
- Song, Z.; Gurinovich, A.; Federico, A.; Monti, S.; Sebastiani, P. nf-gwas-pipeline: A Nextflow Genome-Wide Association Study Pipeline. J. Open Source Softw. 2021, 6, 2957. [Google Scholar] [CrossRef] [PubMed]
- Sebastiani, P.; Monti, S.; Morris, M.; Gurinovich, A.; Toshiko, T.; Andersen, S.L.; Sweigart, B.; Ferrucci, L.; Jennings, L.L.; Glass, D.J.; et al. A serum protein signature of APOE genotypes in centenarians. Aging Cell 2019, 18, e13023. [Google Scholar] [CrossRef] [PubMed] [Green Version]
- Gao, X.; Starmer, J.; Martin, E.R. A multiple testing correction method for genetic association studies using correlated single nucleotide polymorphisms. Genet. Epidemiol. 2008, 32, 361–369. [Google Scholar] [CrossRef]
- Subramanian, A.; Tamayo, P.; Mootha, V.K.; Mukherjee, S.; Ebert, B.L.; Gillette, M.A.; Paulovich, A.; Pomeroy, S.L.; Golub, T.R.; Lander, E.S.; et al. Gene set enrichment analysis: A knowledge-based approach for interpreting genome-wide expression profiles. Proc. Natl. Acad. Sci. USA 2005, 102, 15545–15550. [Google Scholar] [CrossRef] [PubMed] [Green Version]
- Federico, A.; Monti, S. hypeR: An R package for geneset enrichment workflows. Bioinformatics 2020, 36, 1307–1308. [Google Scholar] [CrossRef] [PubMed]
- Canela-Xandri, O.; Rawlik, K.; Tenesa, A. An atlas of genetic associations in UK Biobank. Nat. Genet. 2018, 50, 1593–1599. [Google Scholar] [CrossRef] [PubMed]
- Sebastiani, P.; Gurinovich, A.; Nygaard, M.; Sasaki, T.; Sweigart, B.; Bae, H.; Andersen, S.L.; Villa, F.; Atzmon, G.; Christensen, K.; et al. APOE Alleles and Extreme Human Longevity. J. Gerontol. Ser. A 2019, 74, 44–51. [Google Scholar] [CrossRef] [Green Version]
- Gurinovich, A.; Song, Z.; Zhang, W.; Federico, A.; Monti, S.; Andersen, S.L.; Jennings, L.L.; Glass, D.J.; Barzilai, N.; Millman, S.; et al. Effect of longevity genetic variants on the molecular aging rate. Geroscience 2021, 43, 1237–1251. [Google Scholar] [CrossRef]
- Fortney, K.; Dobriban, E.; Garagnani, P.; Pirazzini, C.; Monti, D.; Mari, D.; Atzmon, G.; Barzilai, N.; Franceschi, C.; Owen, A.B.; et al. Genome-Wide Scan Informed by Age-Related Disease Identifies Loci for Exceptional Human Longevity. PLoS Genet. 2015, 11, e1005728. [Google Scholar] [CrossRef]
- Sebastiani, P.; Federico, A.; Morris, M.; Gurinovich, A.; Tanaka, T.; Chandler, K.B.; Andersen, S.L.; Denis, G.; Costello, C.E.; Ferrucci, L.; et al. Protein signatures of centenarians and their offspring suggest centenarians age slower than other humans. Aging Cell 2021, 20, e13290. [Google Scholar] [CrossRef]
- Guo, Z.; Wang, Y.; Xiang, S.; Wang, S.; Chan, F.L. Chromogranin A is a predictor of prognosis in patients with prostate cancer: A systematic review and meta-analysis. Cancer Manag. Res. 2019, 11, 2747–2758. [Google Scholar] [CrossRef] [PubMed]
- Li, Y.; Yu, H.P.; Zhang, P. CCL15 overexpression predicts poor prognosis for hepatocellular carcinoma. Hepatol. Int. 2016, 10, 488–492. [Google Scholar] [CrossRef] [PubMed]
- Wu, M.; Li, X.; Zhang, T.; Liu, Z.; Zhao, Y. Identification of a Nine-Gene Signature and Establishment of a Prognostic Nomogram Predicting Overall Survival of Pancreatic Cancer. Front. Oncol. 2019, 9, 996. [Google Scholar] [CrossRef] [PubMed] [Green Version]
- Pohlkamp, T.; Wasser, C.R.; Herz, J. Functional Roles of the Interaction of APP and Lipoprotein Receptors. Front. Mol. Neurosci. 2017, 10, 54. [Google Scholar] [CrossRef] [Green Version]
- Smith, N.L.; Bromley, M.J.; Denning, D.W.; Simpson, A.; Bowyer, P. Elevated levels of the neutrophil chemoattractant pro-platelet basic protein in macrophages from individuals with chronic and allergic aspergillosis. J. Infect. Dis. 2015, 211, 651–660. [Google Scholar] [CrossRef] [Green Version]
- Sharma, A.; Smith, H.J.; Yao, P.; Mair, W.B. Causal roles of mitochondrial dynamics in longevity and healthy aging. EMBO Rep. 2019, 20, e48395. [Google Scholar] [CrossRef]
- Shakya, M.; Yildirim, T.; Lindberg, I. Increased expression and retention of the secretory chaperone proSAAS following cell stress. Cell Stress Chaperones 2020, 25, 929–941. [Google Scholar] [CrossRef]
- Mathys, H.; Davila-Velderrain, J.; Peng, Z.; Gao, F.; Mohammadi, S.; Young, J.Z.; Menon, M.; He, L.; Abdurrob, F.; Jiang, X.; et al. Single-cell transcriptomic analysis of Alzheimer’s disease. Nature 2019, 570, 332–337. [Google Scholar] [CrossRef]
- Pedrero-Prieto, C.M.; Garcia-Carpintero, S.; Frontinan-Rubio, J.; Llanos-González, E.; García, C.A.; Alcaín, F.J.; Lindberg, I.; Durán-Prado, M.; Peinado, J.R.; Rabanal-Ruiz, Y. A comprehensive systematic review of CSF proteins and peptides that define Alzheimer’s disease. Clin. Proteom. 2020, 17, 21. [Google Scholar] [CrossRef]
- Satis, H.; Ozger, H.S.; Aysert Yildiz, P.; Hızel, K.; Gulbahar, Ö.; Erbaş, G.; Aygencel, G.; Tunccan, O.G.; Öztürk, M.A.; Dizbay, M.; et al. Prognostic value of interleukin-18 and its association with other inflammatory markers and disease severity in COVID-19. Cytokine 2021, 137, 155302. [Google Scholar] [CrossRef]
- Ghoussaini, M.; Mountjoy, E.; Carmona, M.; Peat, G.; Schmidt, E.M.; Hercules, A.; Fumis, L.; Miranda, A.; Carvalho-Silva, D.; Buniello, A.; et al. Open Targets Genetics: Systematic identification of trait-associated genes using large-scale genetics and functional genomics. Nucleic Acids Res. 2021, 49, D1311–D1320. [Google Scholar] [CrossRef] [PubMed]
- Bellenguez, C.; Kucukali, F.; Jansen, I.E.; Kleineidam, L.; Moreno-Grau, S.; Amin, N.; Naj, A.C.; Campos-Martin, R.; Grenier-Boley, B.; Andrade, V.; et al. New insights into the genetic etiology of Alzheimer’s disease and related dementias. Nat. Genet. 2022, 54, 412–436. [Google Scholar] [CrossRef] [PubMed]
- Kia, D.A.; Zhang, D.; Guelfi, S.; Manzoni, C.; Hubbard, L.; Reynolds, R.H.; Botía, J.; Ryten, M.; Ferrari, R.; Lewis, P.A.; et al. Identification of Candidate Parkinson Disease Genes by Integrating Genome-Wide Association Study, Expression, and Epigenetic Data Sets. JAMA Neurol. 2021, 78, 464–472. [Google Scholar] [CrossRef]
- Pilling, L.C.; Atkins, J.L.; Duff, M.O.; Beaumont, R.N.; Jones, S.E.; Tyrrell, J.; Kuo, C.-L.; Ruth, K.S.; Tuke, M.A.; Yaghootkar, H.; et al. Red blood cell distribution width: Genetic evidence for aging pathways in 116,666 volunteers. PLoS ONE 2017, 12, e0185083. [Google Scholar] [CrossRef] [Green Version]
- Franceschi, C.; Garagnani, P.; Olivieri, F.; Salvioli, S.; Giuliani, C. The Contextualized Genetics of Human Longevity: JACC Focus Seminar. J. Am. Coll. Cardiol. 2020, 75, 968–979. [Google Scholar] [CrossRef] [PubMed]
- Wu, Z.; Huang, H.; Han, Q.; Hu, Z.; Teng, X.-L.; Ding, R.; Ye, Y.; Yu, X.; Zhao, R.; Wang, Z.; et al. SENP7 senses oxidative stress to sustain metabolic fitness and antitumor functions of CD8+ T cells. J. Clin. Investig. 2022, 132, 224. [Google Scholar] [CrossRef]
- Juarez-Vicente, F.; Luna-Pelaez, N.; Garcia-Dominguez, M. The Sumo protease Senp7 is required for proper neuronal differentiation. Biochim Biophys Acta. 2016, 1863, 1490–1498. [Google Scholar] [CrossRef]
- Scopa, C.; Marrocco, F.; Latina, V.; Ruggeri, F.; Corvaglia, V.; La Regina, F.; Ammassari-Teule, M.; Middei, S.; Amadoro, G.; Meli, G.; et al. Impaired adult neurogenesis is an early event in Alzheimer’s disease neurodegeneration, mediated by intracellular Abeta oligomers. Cell Death Differ. 2020, 27, 934–948. [Google Scholar] [CrossRef] [PubMed] [Green Version]
- Tanwar, V.S.; Jose, C.C.; Cuddapah, S. Role of CTCF in DNA damage response. Mutat. Res. Mol. Mech. Mutagen. 2019, 780, 61–68. [Google Scholar] [CrossRef]
- Garagnani, P.; Marquis, J.; Delledonne, M.; Pirazzini, C.; Marasco, E.; Kwiatkowska, K.M.; Iannuzzi, V.; Bacalini, M.G.; Valsesia, A.; Carayol, J.; et al. Whole-genome sequencing analysis of semi-supercentenarians. Elife 2021, 10, e57849. [Google Scholar] [CrossRef]
- Sebastiani, P.; Bae, H.; Gurinovich, A.; Soerensen, M.; Puca, A.; Perls, T.T. Limitations and risks of meta-analyses of longevity studies. Mech. Ageing Dev. 2017, 165, 139–146. [Google Scholar] [CrossRef] [PubMed]
- Das, S.; Abecasis, G.R.; Browning, B.L. Genotype Imputation from Large Reference Panels. Annu. Rev. Genom. Hum. Genet. 2018, 19, 73–96. [Google Scholar] [CrossRef] [PubMed]
- Song, Z.; Gurinovich, A.; Nygaard, M.; Mengel-From, J.; Andersen, S.; Cosentino, S.; Schupfs, N.; Lee, J.; Zmuda, J.; Ukraintseva, S.; et al. Rare Genetic Variants Correlate with Better Processing Speed. Neurobiol. Aging 2022, 2022, 30. [Google Scholar] [CrossRef]
- Zheng, X.; Levine, D.; Shen, J.; Gogarten, S.M.; Laurie, C.; Weir, B.S. A high-performance computing toolset for relatedness and principal component analysis of SNP data. Bioinformatics 2012, 28, 3326–3328. [Google Scholar] [CrossRef] [PubMed] [Green Version]
- Gogarten, S.M.; Sofer, T.; Chen, H.; Yu, C.; Brody, A.J.; Thornton, A.T.; Rice, K.M.; Conomos, M.P. Genetic association testing using the GENESIS R/Bioconductor package. Bioinformatics 2019, 35, 5346–5348. [Google Scholar] [CrossRef]


| rs6475609 (CDKN2B-AS1) | ||||||||
|---|---|---|---|---|---|---|---|---|
| SomaScan ID | UniProt ID | Gene | beta | se | t | p-Value | FC ** | AdjP *** |
| 6227-1_3 | O43240 | KLK10 | −0.09431 | 0.025082 | −3.75987 | 0.00022 | 1.244114 | 0.004196 |
| 11157-35_3 | Q9GZY8 | MFF | 0.034337 | 0.009403 | 3.651539 | 0.000328 | 0.96116 | 0.112067 |
| 3509-1_1 | Q16663 | CCL15 | −0.07418 | 0.020842 | −3.55895 | 0.00046 | 1.309531 | 9.30 × 10⁻⁷ |
| 11184-51_3 | P10645 | CHGA | −0.20668 | 0.058159 | −3.55364 | 0.000467 | 2.041239 | 7.03 × 10⁻⁷ |
| 8397-147_3 | Q6ZRP7 | QSOX2 | −0.06864 | 0.019382 | −3.54119 | 0.000488 | 0.894969 | 0.075736 |
| 14122-132_3 | Q9ULT6 | ZNRF3 | −0.04099 | 0.01168 | −3.50934 | 0.00055 | 0.976452 | 0.424986 |
| 14109-15_3 | Q16663 | CCL15 | −0.08507 | 0.024385 | −3.48852 | 0.000591 | 1.245471 | 0.000548 |
| 8330-1_3 | Q86VZ4 | LRP11 | −0.07416 | 0.021678 | −3.42106 | 0.000746 | 1.361808 | 2.42 × 10⁻⁹ |
| 2790-54_2 | P02775 | PPBP | 0.06303 | 0.018485 | 3.40968 | 0.000777 | 0.873098 | 0.006294 |
| rs9657521 (OR7E161P|DEFB136) | ||||||||
| 5128-53_3 | Q96DU3 | SLAMF6 | −0.09213 | 0.025586 | −3.60081 | 0.000395 | 1.174195 | 0.006707 |
| 3073-51_2 | O95998 | IL18BP * | −0.08158 | 0.02414 | −3.37965 | 0.000862 | 1.313291 | 1.73 × 10⁻⁸ |
| 9391-60_3 | Q9UHG2 | PCSK1N * | 0.034867 | 0.010381 | 3.358835 | 0.000929 | 1.044992 | 0.163917 |
| 14101-2_3 | P26992 | CNTFR * | −0.05845 | 0.017439 | −3.35168 | 0.000949 | 1.149051 | 3.33 × 10⁻⁵ |
| rs145282854 (ZBED1P1|ENPEP) | ||||||||
| 12626-6_3 | Q9BQF6 | SENP7 | 0.185977 | 0.044871 | 4.144741 | 4.93 × 10⁻⁵ | 0.973749 | 0.619881 |
| 12341-8_3 | Q16828 | DUSP6 | −0.11968 | 0.030611 | −3.90953 | 0.000124 | 0.905893 | 4.91 × 10⁻⁷ |
| 12431-13_3 | Q9BRX2 | PELO | −0.12712 | 0.032736 | −3.88324 | 0.000138 | 0.899788 | 5.94 × 10⁻⁶ |
| 6606-61_3 | Q15726 | KISS1 | −0.20633 | 0.054011 | −3.82019 | 0.000178 | 0.936344 | 0.141048 |
| 14624-51_3 | P49711 | CTCF | 0.13336 | 0.035568 | 3.749403 | 0.000228 | 0.992483 | 0.129235 |
| 9870-17_3 | P23381 | WARS | 0.228915 | 0.061876 | 3.699553 | 0.000275 | 1.092315 | 0.041444 |
| 13629-25_3 | Q9Y4P1 | ATG4B | −0.23443 | 0.063475 | −3.6932 | 0.000282 | 0.975495 | 0.854651 |
| 9749-190_3 | P13796 | LCP1 | 0.181824 | 0.049431 | 3.678319 | 0.000297 | 1.089198 | 0.040104 |
| 14057-68_3 | O95150 | TNFSF15 | −0.22904 | 0.063327 | −3.61671 | 0.000372 | 0.780793 | 1.10 × 10⁻⁹ |
| 12572-236_3 | O43281 | EFS | −0.08412 | 0.023752 | −3.54161 | 0.000488 | 0.933805 | 5.38 × 10⁻⁵ |
| 12784-10_3 | O95704 | APBB3 | −0.17642 | 0.049996 | −3.52875 | 0.000511 | 0.870573 | 7.23 × 10⁻⁶ |
| 10064-12_3 | O75884 | RBBP9 | −0.10174 | 0.028931 | −3.51656 | 0.000534 | 0.994783 | 0.918297 |
| 13393-46_3 | Q9BUN8 | DERL1 | −0.1092 | 0.031437 | −3.4736 | 0.000622 | 0.957411 | 0.010074 |
| 9087-8_3 | Q5JS37 | NHLRC3 | −0.13061 | 0.037984 | −3.4386 | 0.000704 | 0.928668 | 0.018714 |
Disclaimer/Publisher’s Note: The statements, opinions and data contained in all publications are solely those of the individual author(s) and contributor(s) and not of MDPI and/or the editor(s). MDPI and/or the editor(s) disclaim responsibility for any injury to people or property resulting from any ideas, methods, instructions or products referred to in the content. |
© 2022 by the authors. Licensee MDPI, Basel, Switzerland. This article is an open access article distributed under the terms and conditions of the Creative Commons Attribution (CC BY) license (https://creativecommons.org/licenses/by/4.0/).
Share and Cite
Bae, H.; Gurinovich, A.; Karagiannis, T.T.; Song, Z.; Leshchyk, A.; Li, M.; Andersen, S.L.; Arbeev, K.; Yashin, A.; Zmuda, J.; et al. A Genome-Wide Association Study of 2304 Extreme Longevity Cases Identifies Novel Longevity Variants. Int. J. Mol. Sci. 2023, 24, 116. https://0-doi-org.brum.beds.ac.uk/10.3390/ijms24010116
Bae H, Gurinovich A, Karagiannis TT, Song Z, Leshchyk A, Li M, Andersen SL, Arbeev K, Yashin A, Zmuda J, et al. A Genome-Wide Association Study of 2304 Extreme Longevity Cases Identifies Novel Longevity Variants. International Journal of Molecular Sciences. 2023; 24(1):116. https://0-doi-org.brum.beds.ac.uk/10.3390/ijms24010116
Chicago/Turabian StyleBae, Harold, Anastasia Gurinovich, Tanya T. Karagiannis, Zeyuan Song, Anastasia Leshchyk, Mengze Li, Stacy L. Andersen, Konstantin Arbeev, Anatoliy Yashin, Joseph Zmuda, and et al. 2023. "A Genome-Wide Association Study of 2304 Extreme Longevity Cases Identifies Novel Longevity Variants" International Journal of Molecular Sciences 24, no. 1: 116. https://0-doi-org.brum.beds.ac.uk/10.3390/ijms24010116