
Perspectives of Cell Sensitivity/Resistance Assay in Soft Tissue Sarcomas Chemotherapy

 , and
, and
Abstract
:1. Introduction
2. Results
3. Discussion
4. Materials and Methods
4.1. Tumor Samples
4.2. Chemotheraputic Drugs
4.3. Chemosensitivity Measurement
4.4. Cytological Analysis
4.5. Statistical Analysis
Author Contributions
Funding
Institutional Review Board Statement
Informed Consent Statement
Data Availability Statement
Conflicts of Interest
Abbreviations
| ChT | Chemotherapy |
| CSA | Cell Sensitivity assay |
| CSRA | Cell Sensitivity/Resistance Assay |
| Doc | Docetaxel |
| Dox | Doxorubicin |
| Gem | Gemcitabine |
| IFO | Ifosfamide |
| LMS | Leiomyosarcomas |
| LPS | Liposarcomas |
| PS | Pleomorphic sarcomas |
| RFS | Recurrence-free survival |
| SRI | Sensitivity/resistance index |
| SS | Synovial sarcomas |
| STS | Soft tissue sarcomas |
| TDC | Test drug concentration |
References
- Waclawiczek, A.; Leppä, A.M.; Renders, S.; Stumpf, K.; Reyneri, C.; Betz, B.; Janssen, M.; Shahswar, R.; Donato, E.; Karpova, D.; et al. Combinatorial BCL2 Family Expression in Acute Myeloid Leukemia Stem Cells Predicts Clinical Response to Azacitidine/Venetoclax. Cancer Discov. 2023, 13, 1408–1427. [Google Scholar] [CrossRef] [PubMed]
- Silva, A.; Silva, M.C.; Sudalagunta, P.; Distler, A.; Jacobson, T.; Collins, A.; Nguyen, T.; Song, J.; Chen, D.T.; Chen, L.; et al. An Ex Vivo Platform for the Prediction of Clinical Response in Multiple Myeloma. Cancer Res. 2017, 77, 3336–3351. [Google Scholar] [CrossRef] [Green Version]
- Stebbing, J.; Paz, K.; Schwartz, G.K.; Wexler, L.H.; Maki, R.; Pollock, R.E.; Morris, R.; Cohen, R.; Shankar, A.; Blackman, G.; et al. Patient-derived xenografts for individualized care in advanced sarcoma. Cancer 2014, 120, 2006–2015. [Google Scholar] [CrossRef] [PubMed] [Green Version]
- Kirsanov, K.I.; Lesovaya, E.A.; Fetisov, T.I.; Bokhyan, B.Y.; Belitsky, G.A.; Yakubovskaya, M.G. Current Approaches for Personalized Therapy of Soft Tissue Sarcomas. Sarcoma 2020, 2020, 6716742. [Google Scholar] [CrossRef] [PubMed] [Green Version]
- Hoffmann, J.; Schmidt-Peter, P.; Hänsch, W.; Naundorf, H.; Bunge, A.; Becker, M.; Fichtner, I. Anticancer drug sensitivity and expression of multidrug resistance markers in early passage human sarcomas. Clin. Cancer Res. Off. J. Am. Assoc. Cancer Res. 1999, 5, 2198–2204. [Google Scholar]
- Moiseeva, N.I.; Laletina, L.A.; Fetisov, T.I.; Makhmudova, L.F.; Manikaylo, A.E.; Fomina, L.Y.; Burov, D.A.; Lesovaya, E.A.; Bokhyan, B.Y.; Zinovieva, V.Y.; et al. Analysis of Multiple Drug Resistance Mechanism in Different Types of Soft Tissue Sarcomas: Assessment of the Expression of ABC-Transporters, MVP, YB-1, and Analysis of Their Correlation with Chemosensitivity of Cancer Cells. Int. J. Mol. Sci. 2022, 23, 3183. [Google Scholar] [CrossRef]
- The Cancer Genome Atlas Research Network. Comprehensive and Integrated Genomic Characterization of Adult Soft Tissue Sarcomas. Cell 2017, 171, 950–965.e28. [Google Scholar] [CrossRef] [Green Version]
- Kirilin, E.M.; Fetisov, T.I.; Moiseeva, N.I.; Lesovaya, E.A.; Laletina, L.A.; Makhmudova, L.F.; Manikaylo, A.E.; Fomina, L.Y.; Burov, D.A.; Bokhyan, B.Y.; et al. Soft Tissue Sarcoma Study: Association of Genetic Alterations in the Apoptosis Pathways with Chemoresistance to Doxorubicin. Cancers 2022, 14, 1796. [Google Scholar] [CrossRef]
- Zhang, J.; Chen, M.; Zhao, Y.; Xiong, H.; Sneh, T.; Fan, Y.; Wang, J.; Zhou, X.; Gong, C. Complement and coagulation cascades pathway correlates with chemosensitivity and overall survival in patients with soft tissue sarcoma. Eur. J. Pharmacol. 2020, 879, 173121. [Google Scholar] [CrossRef]
- Berclaz, L.M.; Altendorf-Hofmann, A.; Dürr, H.R.; Klein, A.; Angele, M.K.; Albertsmeier, M.; Schmidt-Hegemann, N.S.; Di Gioia, D.; Knösel, T.; Lindner, L.H. Expression Patterns of TOP2A and SIRT1 Are Predictive of Survival in Patients with High-Risk Soft Tissue Sarcomas Treated with a Neoadjuvant Anthracycline-Based Chemotherapy. Cancers 2021, 13, 4877. [Google Scholar] [CrossRef]
- Kurbacher, C.M.; Grecu, O.M.; Stier, U.; Gilster, T.J.; Janát, M.M.; Untch, M.; Konecny, G.; Bruckner, H.W.; Cree, I.A. ATP chemosensitivity testing in ovarian and breast cancer: Early clinical trials. Recent Results Cancer Res. 2003, 161, 221–230. [Google Scholar] [CrossRef]
- Volm, M.; Efferth, T. Prediction of Cancer Drug Resistance and Implications for Personalized Medicine. Front. Oncol. 2015, 5, 282. [Google Scholar] [CrossRef]
- Lehnhardt, M.; Muehlberger, T.; Kuhnen, C.; Brett, D.; Steinau, H.U.; Jafari, H.J.; Steinstraesser, L.; Müller, O.; Homann, H.H. Feasibility of chemosensitivity testing in soft tissue sarcomas. World J. Surg. Oncol. 2005, 3, 20. [Google Scholar] [CrossRef] [PubMed] [Green Version]
- Gu, F.; Ma, Y.; Fan, Y.; Lang, R.; Ding, T.; Hao, X.; Gong, Y.; Kobayahsi, H.; Fang, Z.; Fu, L. Synovial sarcoma individual chemotherapy directed by collagen gel droplet embedded culture drug sensitivity test: A case report. Oncol. Lett. 2010, 1, 885–888. [Google Scholar] [CrossRef]
- Berlow, N.E.; Grasso, C.S.; Quist, M.J.; Cheng, M.; Gandour-Edwards, R.; Hernandez, B.S.; Michalek, J.E.; Ryan, C.; Spellman, P.; Pal, R.; et al. Deep Functional and Molecular Characterization of a High-Risk Undifferentiated Pleomorphic Sarcoma. Sarcoma 2020, 2020, 6312480. [Google Scholar] [CrossRef]
- Loum, E.; Giraud, S.; Bessette, B.; Battu, S.; Mathonnet, M.; Lautrette, C. Oncogramme, a new individualized tumor response testing method: Application to colon cancer. Cytotechnology 2010, 62, 381–388. [Google Scholar] [CrossRef] [Green Version]
- Giraud, S.; Bounaix Morand du Puch, C.; Fermeaux, V.; Guillaudeau, A.; Lautrette, C. Oncogramme responses of breast tumour cells treated with herceptin correlate with HER2/C-ERB B2 pathological status. Anticancer. Res. 2012, 32, 1323–1325. [Google Scholar]
- Maki, R.G.; Wathen, J.K.; Patel, S.R.; Priebat, D.A.; Okuno, S.H.; Samuels, B.; Fanucchi, M.; Harmon, D.C.; Schuetze, S.M.; Reinke, D.; et al. Randomized phase II study of gemcitabine and docetaxel compared with gemcitabine alone in patients with metastatic soft tissue sarcomas: Results of sarcoma alliance for research through collaboration study 002 [corrected]. J. Clin. Oncol. Off. J. Am. Soc. Clin. Oncol. 2007, 25, 2755–2763. [Google Scholar] [CrossRef]
- Gronchi, A.; Ferrari, S.; Quagliuolo, V.; Broto, J.M.; Pousa, A.L.; Grignani, G.; Basso, U.; Blay, J.Y.; Tendero, O.; Beveridge, R.D.; et al. Histotype-tailored neoadjuvant chemotherapy versus standard chemotherapy in patients with high-risk soft-tissue sarcomas (ISG-STS 1001): An international, open-label, randomised, controlled, phase 3, multicentre trial. Lancet Oncol. 2017, 18, 812–822. [Google Scholar] [CrossRef]
- Davis, E.J.; Chugh, R.; Zhao, L.; Lucas, D.R.; Biermann, J.S.; Zalupski, M.M.; Feng, M.; Wong, S.L.; Jacobson, J.; Zyczynski, L.; et al. A randomised, open-label, phase II study of neo/adjuvant doxorubicin and ifosfamide versus gemcitabine and docetaxel in patients with localised, high-risk, soft tissue sarcoma. Eur. J. Cancer 2015, 51, 1794–1802. [Google Scholar] [CrossRef]
- Lorigan, P.; Verweij, J.; Papai, Z.; Rodenhuis, S.; Le Cesne, A.; Leahy, M.G.; Radford, J.A.; Van Glabbeke, M.M.; Kirkpatrick, A.; Hogendoorn, P.C.; et al. Phase III trial of two investigational schedules of ifosfamide compared with standard-dose doxorubicin in advanced or metastatic soft tissue sarcoma: A European Organisation for Research and Treatment of Cancer Soft Tissue and Bone Sarcoma Group Study. J. Clin. Oncol. Off. J. Am. Soc. Clin. Oncol. 2007, 25, 3144–3150. [Google Scholar] [CrossRef]
- Katz, D.; Palmerini, E.; Pollack, S.M. More Than 50 Subtypes of Soft Tissue Sarcoma: Paving the Path for Histology-Driven Treatments. Am. Soc. Clin. Oncol. Educ. Book 2018, 38, 925–938. [Google Scholar] [CrossRef]
- Iqbal, N.; Shukla, N.K.; Deo, S.V.; Agarwala, S.; Sharma, D.N.; Sharma, M.C.; Bakhshi, S. Prognostic factors affecting survival in metastatic soft tissue sarcoma: An analysis of 110 patients. Clin. Transl. Oncol. 2016, 18, 310–316. [Google Scholar] [CrossRef]
- Young, R.J.; Litière, S.; Lia, M.; Hogendoorn, P.C.W.; Fisher, C.; Mechtersheimer, G.; Daugaard, S.; Sciot, R.; Collin, F.; Messiou, C.; et al. Predictive and prognostic factors associated with soft tissue sarcoma response to chemotherapy: A subgroup analysis of the European Organisation for Research and Treatment of Cancer 62012 study. Acta Oncol. 2017, 56, 1013–1020. [Google Scholar] [CrossRef] [Green Version]
- Zhang, Y.; Wang, J.; Hui, B.; Sun, W.; Li, B.; Shi, F.; Che, S.; Chai, L.; Song, L. Pristimerin enhances the effect of cisplatin by inhibiting the miR-23a/Akt/GSK3β signaling pathway and suppressing autophagy in lung cancer cells. Int. J. Mol. Med. 2019, 43, 1382–1394. [Google Scholar] [CrossRef] [Green Version]
- Zhang, J.; Hu, J.; Li, W.; Zhang, C.; Su, P.; Wang, Y.; Sun, W.; Wang, X.; Li, L.; Wu, X. Rapamycin Antagonizes BCRP-Mediated Drug Resistance Through the PI3K/Akt/mTOR Signaling Pathway in mPRα-Positive Breast Cancer. Front. Oncol. 2021, 11, 608570. [Google Scholar] [CrossRef]
- Qian, J.; Rankin, E.B. Hypoxia-Induced Phenotypes that Mediate Tumor Heterogeneity. Adv. Exp. Med. Biol. 2019, 1136, 43–55. [Google Scholar] [CrossRef]
- Assaraf, Y.G.; Brozovic, A.; Gonçalves, A.C.; Jurkovicova, D.; Linē, A.; Machuqueiro, M.; Saponara, S.; Sarmento-Ribeiro, A.B.; Xavier, C.P.R.; Vasconcelos, M.H. The multi-factorial nature of clinical multidrug resistance in cancer. Drug Resist. Updates 2019, 46, 100645. [Google Scholar] [CrossRef]
- Cao, J.; Wang, J.; He, C.; Fang, M. Angiosarcoma: A review of diagnosis and current treatment. Am. J. Cancer Res. 2019, 9, 2303–2313. [Google Scholar]
- Florou, V.; Wilky, B.A. Current Management of Angiosarcoma: Recent Advances and Lessons From the Past. Curr. Treat. Opt. Oncol. 2021, 22, 61. [Google Scholar] [CrossRef]
- Andreotti, P.E.; Cree, I.A.; Kurbacher, C.M.; Hartmann, D.M.; Linder, D.; Harel, G.; Gleiberman, I.; Caruso, P.A.; Ricks, S.H.; Untch, M.; et al. Chemosensitivity testing of human tumors using a microplate adenosine triphosphate luminescence assay: Clinical correlation for cisplatin resistance of ovarian carcinoma. Cancer Res. 1995, 55, 5276–5282. [Google Scholar]
- Tapias, L.F.; Gilpin, S.E.; Ren, X.; Wei, L.; Fuchs, B.C.; Tanabe, K.K.; Lanuti, M.; Ott, H.C. Assessment of Proliferation and Cytotoxicity in a Biomimetic Three-Dimensional Model of Lung Cancer. Ann. Thorac. Surg. 2015, 100, 414–421. [Google Scholar] [CrossRef]
- Zhang, J.; Li, H. Heterogeneity of tumor chemosensitivity in ovarian epithelial cancer revealed using the adenosine triphosphate-tumor chemosensitivity assay. Oncol. Lett. 2015, 9, 2374–2380. [Google Scholar] [CrossRef] [Green Version]
- Fischer, A.H.; Zhao, C.; Li, Q.K.; Gustafson, K.S.; Eltoum, I.E.; Tambouret, R.; Benstein, B.; Savaloja, L.C.; Kulesza, P. The cytologic criteria of malignancy. J. Cell. Biochem. 2010, 110, 795–811. [Google Scholar] [CrossRef]


| Parameters | Quantity (%) |
|---|---|
| Sex | |
| F | 78 (53%) |
| M | 70 (47%) |
| Age | Average age: 51 |
| <40 | 34 (23%) |
| >40 | 114 (77%) |
| Malignancy grade | |
| G1–2 | 40 (27%) |
| G3 | 108 (73%) |
| Primary site | |
| Extremities | 108 (73%) |
| Trunk | 35 (24%) |
| Head | 5 (3%) |
| Newly diagnosed | 91 (61%) |
| Recurrence | 57 (39%) |
| Previous ChT | |
| No | 84 (57%) |
| Yes | 62 (42%) |
| N/A | 2 (1%) |
| Histology | |
| Pleomorphic sarcoma (PS) | 41 (28%) |
| Liposarcoma (LPS) | 39 (26%) |
| Synovial sarcoma (SS) | 25 (17%) |
| Leiomyosarcoma (LMS) | 14 (9%) |
| Other | 29 (20%) |
| Drug Tested in CSRA | |||||||
|---|---|---|---|---|---|---|---|
| Compared Groups | n | Dox | IFO | Dox + IFO | Doc | Gem | Doc + Gem |
| Age <40 vs. >40 | 148 | ND p = 0.75 | ND p = 0.12 | ND p = 0.24 | ND p = 0.41 | ND p = 0.13 | ND p = 0.35 |
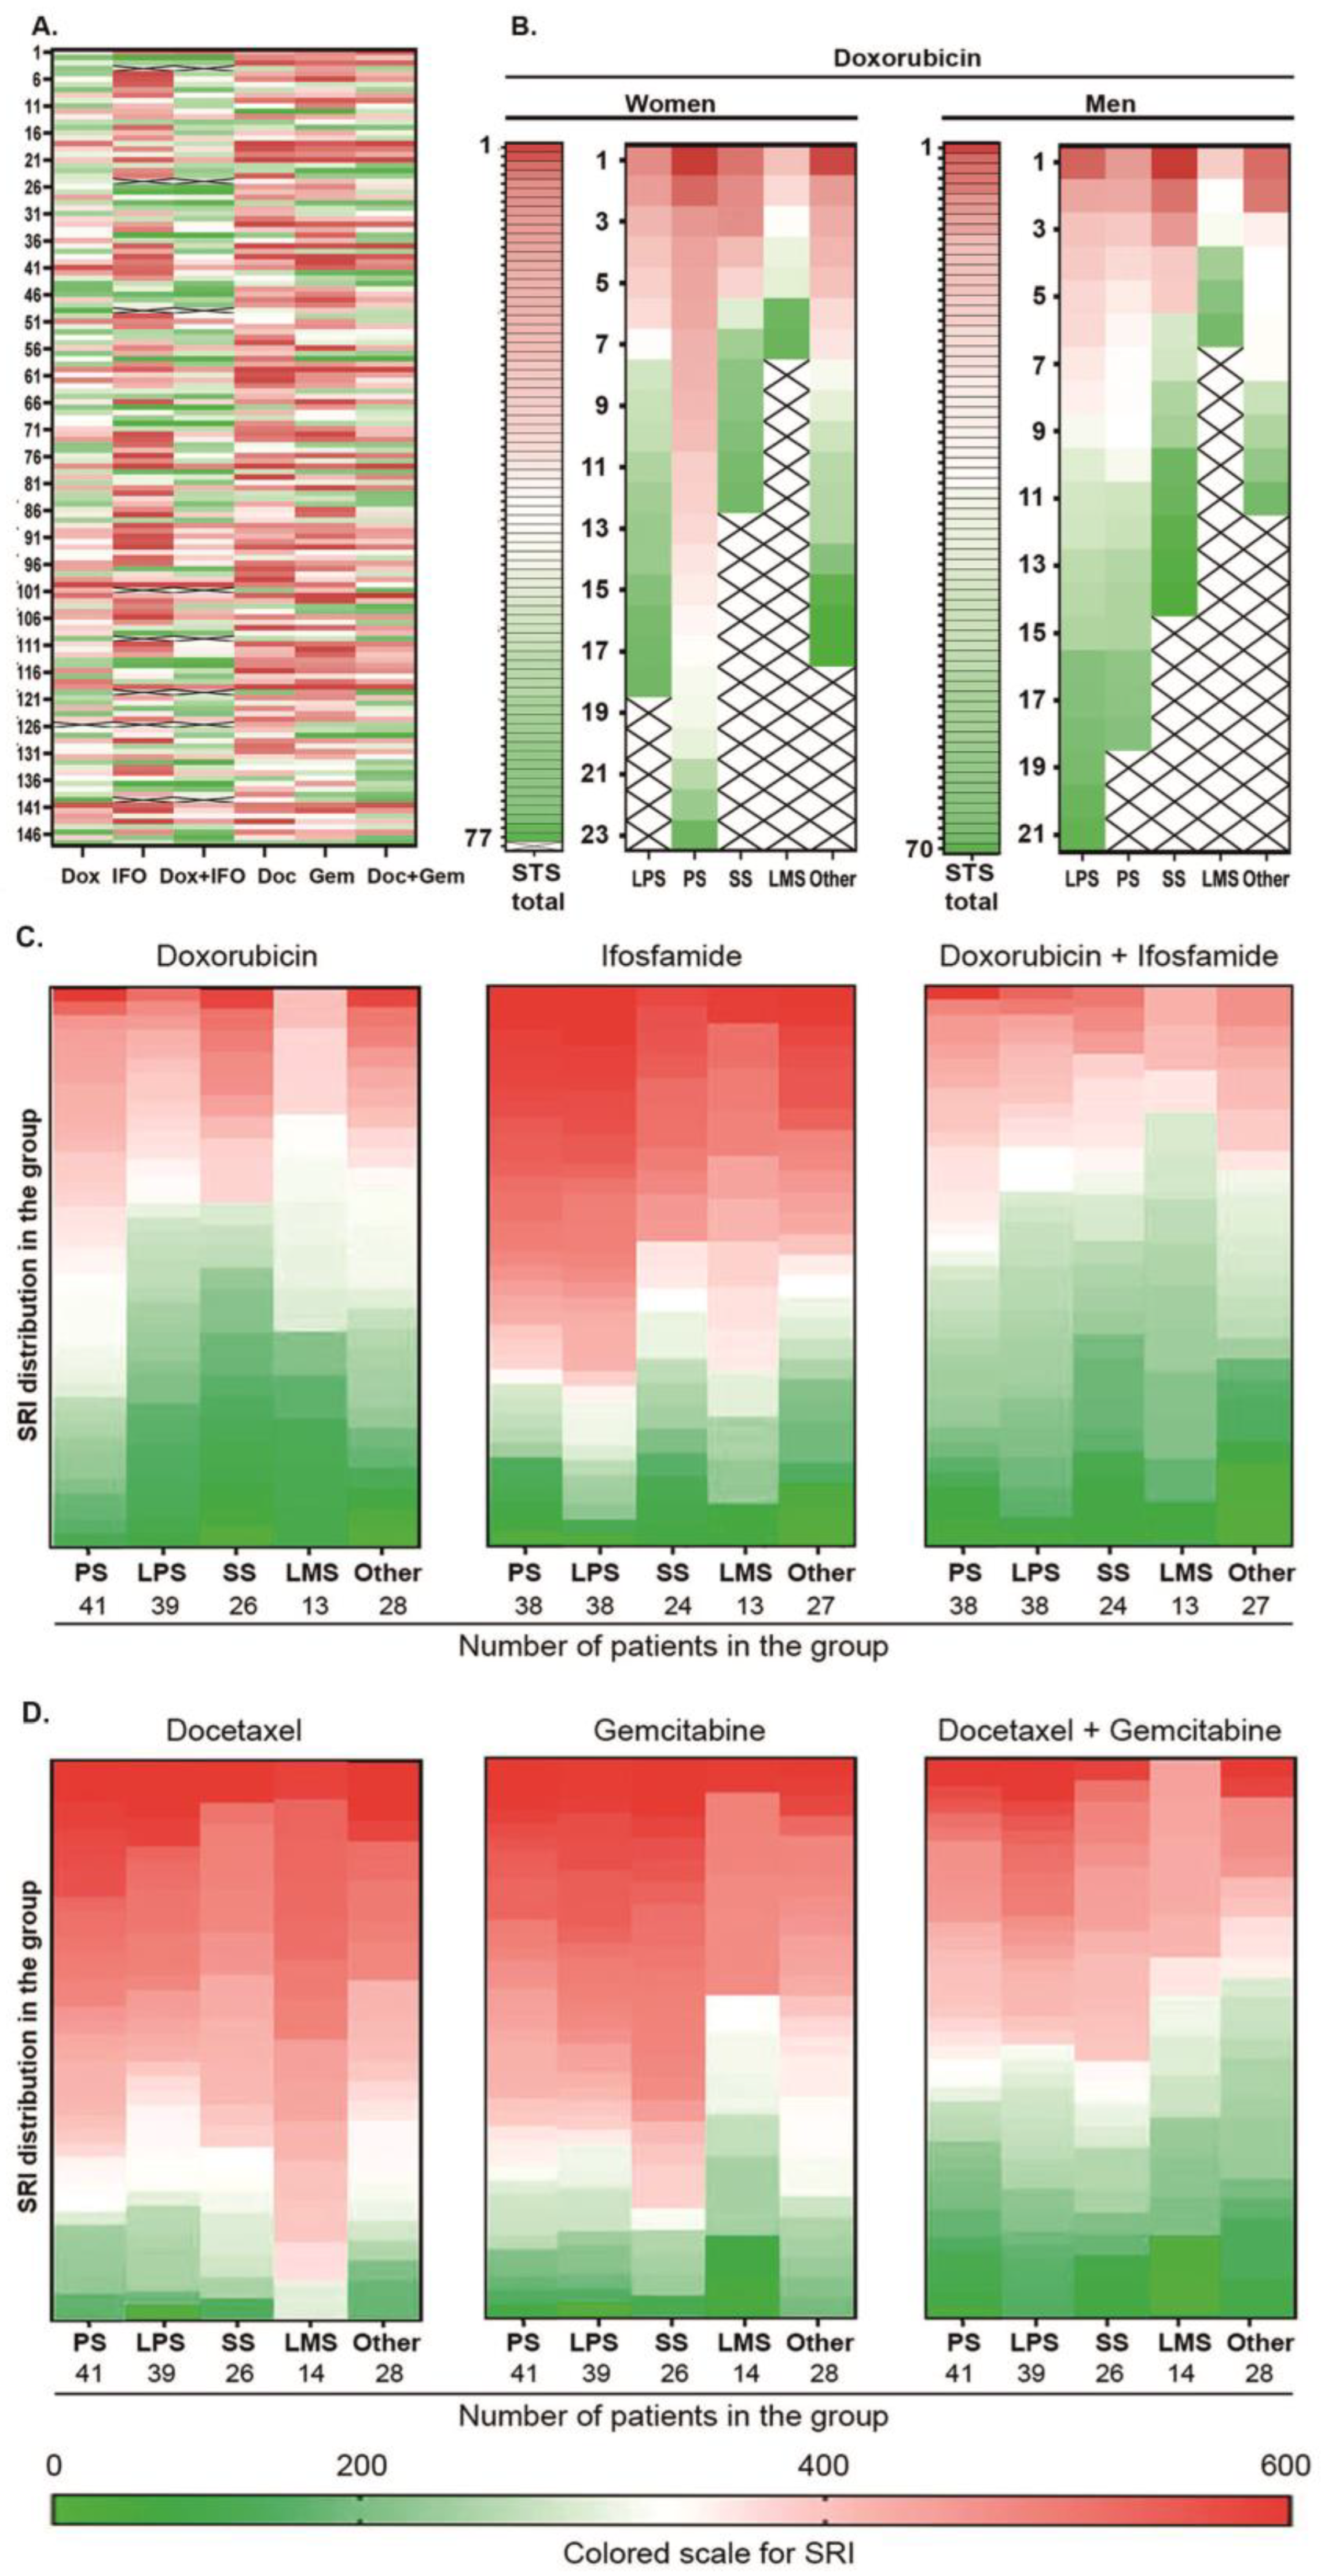
| Sex F vs. M | 148 | SD (higher resistance of STS in the female group) p = 0.035 | ND p = 0.074 | ND p = 0.076 | ND p = 0.861 | ND p = 0.989 | ND p = 0.779 |
| Malignancy grade G1–G2 vs. G3 | 148 | ND p = 0.514 | ND p = 0.277 | ND p = 0.578 | ND p = 0.362 | ND p = 0.961 | ND p = 0.359 |
| Newly diagnosed vs. Recurrent (with no ChT) | 148 | ND p = 0.939 | ND p = 0.5 | ND p = 0.306 | ND p = 0.244 | ND p = 0.229 | ND p = 0.25 |
| Newly diagnosed vs. Recurrent (with ChT) | 62 | ND p = 0.28 | ND p = 0.443 | ND p = 0.857 | ND p = 0.237 | ND p = 0.859 | ND p = 0.885 |
| Histology Liposarcoma (LPS) Pleomorphic sarcoma (PS) Synovial sarcoma (SS) Leiomyosarcoma (LMS) | SD (higher resistance of pleomorphic sarcomas) p = 0.015 | Lower resistance of synovial sarcomas p = 0.053 | ND p = 0.861 | ND p = 0.556 | SD (lower resistance of leiomyosarcomas) p = 0.024 | SD (low resistance of leiomyosarcomas) p = 0.027 | |
| Drug/Combination | 100% TDC (mg/mL) |
|---|---|
| Dox | 3.0 |
| Ifo | 3.0 |
| Dox + IFO | 3.0 + 3.0 |
| Doc | 11.3 |
| Gem | 25.0 |
| Doc + Gem | 11.3 + 25.0 |
Disclaimer/Publisher’s Note: The statements, opinions and data contained in all publications are solely those of the individual author(s) and contributor(s) and not of MDPI and/or the editor(s). MDPI and/or the editor(s) disclaim responsibility for any injury to people or property resulting from any ideas, methods, instructions or products referred to in the content. |
© 2023 by the authors. Licensee MDPI, Basel, Switzerland. This article is an open access article distributed under the terms and conditions of the Creative Commons Attribution (CC BY) license (https://creativecommons.org/licenses/by/4.0/).
Share and Cite
Fetisov, T.I.; Khazanova, S.A.; Shtompel, P.A.; Trapeznikova, E.S.; Zinovieva, V.Y.; Marshall, V.I.; Lovenger, A.A.; Rogozhin, D.V.; Anastasia, T.A.; Bokhyan, B.Y.; et al. Perspectives of Cell Sensitivity/Resistance Assay in Soft Tissue Sarcomas Chemotherapy. Int. J. Mol. Sci. 2023, 24, 12292. https://0-doi-org.brum.beds.ac.uk/10.3390/ijms241512292
Fetisov TI, Khazanova SA, Shtompel PA, Trapeznikova ES, Zinovieva VY, Marshall VI, Lovenger AA, Rogozhin DV, Anastasia TA, Bokhyan BY, et al. Perspectives of Cell Sensitivity/Resistance Assay in Soft Tissue Sarcomas Chemotherapy. International Journal of Molecular Sciences. 2023; 24(15):12292. https://0-doi-org.brum.beds.ac.uk/10.3390/ijms241512292
Chicago/Turabian StyleFetisov, Timur I., Sofya A. Khazanova, Polina A. Shtompel, Ekaterina S. Trapeznikova, Victoria Y. Zinovieva, Valeria I. Marshall, Anastasia A. Lovenger, Dmitriy V. Rogozhin, Tararykova A. Anastasia, Beniamin Yu. Bokhyan, and et al. 2023. "Perspectives of Cell Sensitivity/Resistance Assay in Soft Tissue Sarcomas Chemotherapy" International Journal of Molecular Sciences 24, no. 15: 12292. https://0-doi-org.brum.beds.ac.uk/10.3390/ijms241512292