Development of National Newborn Screening Quality Indicators in the United States

 , , , , ,
Abstract
:1. Introduction
2. Materials and Methods
2.1. Subject Matter Expert Meeting
2.2. Pilot Testing
2.3. Additional Subject Matter Expert Engagement
2.4. Public Comment and Final Subject Matter Expert Engagement
2.5. Ongoing Refinement of National Newborn Screening Quality Indicators
3. Results
3.1. Development of National Newborn Screening Quality Indicators
3.1.1. Subject Matter Expert Meeting
3.1.2. Pilot Testing
3.1.3. Additional Subject Matter Expert Feedback
3.2. Dissemination of National Newborn Screening Quality Indicators
4. Discussion
Collection of Quality Indicators
5. Conclusions
Supplementary Materials
Author Contributions
Funding
Conflicts of Interest
References
- Association of Public Health Laboratories (APHL). The newborn screening story: How one simple test changed lives, science, and health in America. Available online: http://www.aphl.org/aboutAPHL/publications/Documents/NBS_2013May_The-Newborn-Screening-Story_How-One-Simple-Test-Changed-Lives-Science-and-Health-in-America.pdf (accessed on 25 June 2019).
- NewSTEPs. Available online: https://www.newsteps.org/ (accessed on 25 June 2019).
- Association of Public Health Laboratories (APHL) Newborn screening: Four facts policymakers need to know. Available online: https://www.aphl.org/AboutAPHL/publications/Documents/NBS_2012Dec20_Newborn-Screening-Four-Facts-Policymakers-Need-to-Know.pdf (accessed on 24 June 2019).
- Ojodu, J.; Singh, S.; Kellar-Guenther, Y.; Yusuf, C.; Jones, E.; Wood, T.; Sontag, M. NewSTEPs: The establishment of a national newborn screening technical assistance resource center. Int. J. Neonatal Screen. 2017, 4, 1. [Google Scholar] [CrossRef]
- Informational Guide for the NewSTEPs Data Repository. Available online: https://data.newsteps.org/newsteps-web/ (accessed on 25 June 2019).
- Stewert, R.J.; Caird, J.; Oliver, K.; Oliver, S. Patients’ and clinicians’ research priorities. Health Expect. 2010, 14, 439–448. [Google Scholar] [CrossRef] [PubMed]
- Macfarlane, A.; Galvin, R.; O’Sullivan, M.; Mcinerney, C.; Meagher, E.; Burke, D.; Lemaster, J.W. Participatory methods for research prioritization in primary care: An analysis of the World Café approach in Ireland and the USA. Fam. Pract. 2016, 34, 278–284. [Google Scholar] [CrossRef] [PubMed]
- Hertzberg, V.S.; Hinton, C.F.; Therrell, B.L.; Shapira, S.K. Birth prevalence rates of newborn screening disorders in relation to screening practices in the United States. J. Pediatr 2011, 159, 555–560. [Google Scholar] [CrossRef] [PubMed]
- The National Newborn Screening and Global Resource Center. Available online: https://genes-r-us.uthscsa.edu/ (accessed on 25 June 2019).
- Brown, J.; Isaacs, D. The World Café: Shaping our futures through conversations that matter; Berrett-Koehler Publishers: Oakland, CA, USA, 2005. [Google Scholar]
- Shone, S.M. Improving QIs associated with specimen collection and transport. Presented at the Newborn Screening and Genetic Testing Symposium, Anaheim, CA. Available online: https://www.aphl.org/conferences/proceedings/Documents/2014/NBS/69Shone.pdf (accessed on 5 January 2018).
- Timeliness of Newborn Screening: Suggested Recommendations from DACHDNC Laboratory Standards and Procedures Subcommittee. Rockville, MD: US Department of Health and Human Services, Health Resources and Services Administration. Available online: https://www.hrsa.gov/sites/default/files/hrsa/advisory-committees/heritable-disorders/meetings/Heritable%20Disorders%202004-2015/2015/February%2012-13,%202015/kelm-tanksley.pdf (accessed on 5 January 2018).
- Hsu, C.C. The Delphi technique: Making sense of consensus. Pract. Assess. Res. Eval. 2007, 12, 1–8. [Google Scholar]
- Hannon, H.W. Blood collection on filter paper for newborn screening programs; Clinical and Laboratory Standards Institute: Wayne, PA, USA, 2013. [Google Scholar]
- NewSTEPs. Newborn screening QIs. Available online: https://www.newsteps.org/sites/default/files/quality-indicators/quality_indicator_source_document_july_17_2018_se.pdf (accessed on 25 June 2019).
- United States Government Accountability Office (GAO). Newborn screening timeliness: Most states had not met screening goals, but some are developing strategies to address barriers. Available online: https://www.gao.gov/assets/690/681635.pdf (accessed on 25 June 2019).
- NewSTEPs timeliness report. Available online: https://www.newsteps.org/sites/default/files/newsteps_timeliness_report_to_gao_corrected_9-7-16.pdf (accessed on 8 January 2018).
- Healthcare Improvement Scotland. Pregnancy and Newborn Screening Indicators. Available online: http://www.healthcareimprovementscotland.org/our_work/standards_and_guidelines/stnds/pnbs_indicators.aspx (accessed on 3 September 2019).


| Date | Activity | Methodologies | Result |
|---|---|---|---|
| June 2011 | Subject Matter Experts Meeting |
| 10 QIs established |
| Fall 2012 | Pilot Testing | Pilot testing of the 10 QIs in New Jersey | Understanding the feasibility of the collection and utility of the 10 QIs |
| July 2012 | Subject Matter Experts Meeting |
| Refinements to proposed QIs and associated definitions |
| January 2013 | Subject Matter Experts Meeting | Consensus building | Reduction in number of QIs from 10 to 8; finalization of definitions of QIs |
| July 2013 | Public Comment Period | Public comment requested on QIs, their utility and interpretation of definitions | Consensus building and community engagement |
| December 2015 | Subject Matter Experts Meeting | Part one of a two-part Delphi process | Consensus on the purpose and definition of each QI |
| February 2016 | Subject Matter Experts Meeting | Part two of Delphi process In-person feedback | Finalization of conceptual and operational definitions of the QIs |
| Data Element(s) Being Collected | Quality Indicator Definition | |
|---|---|---|
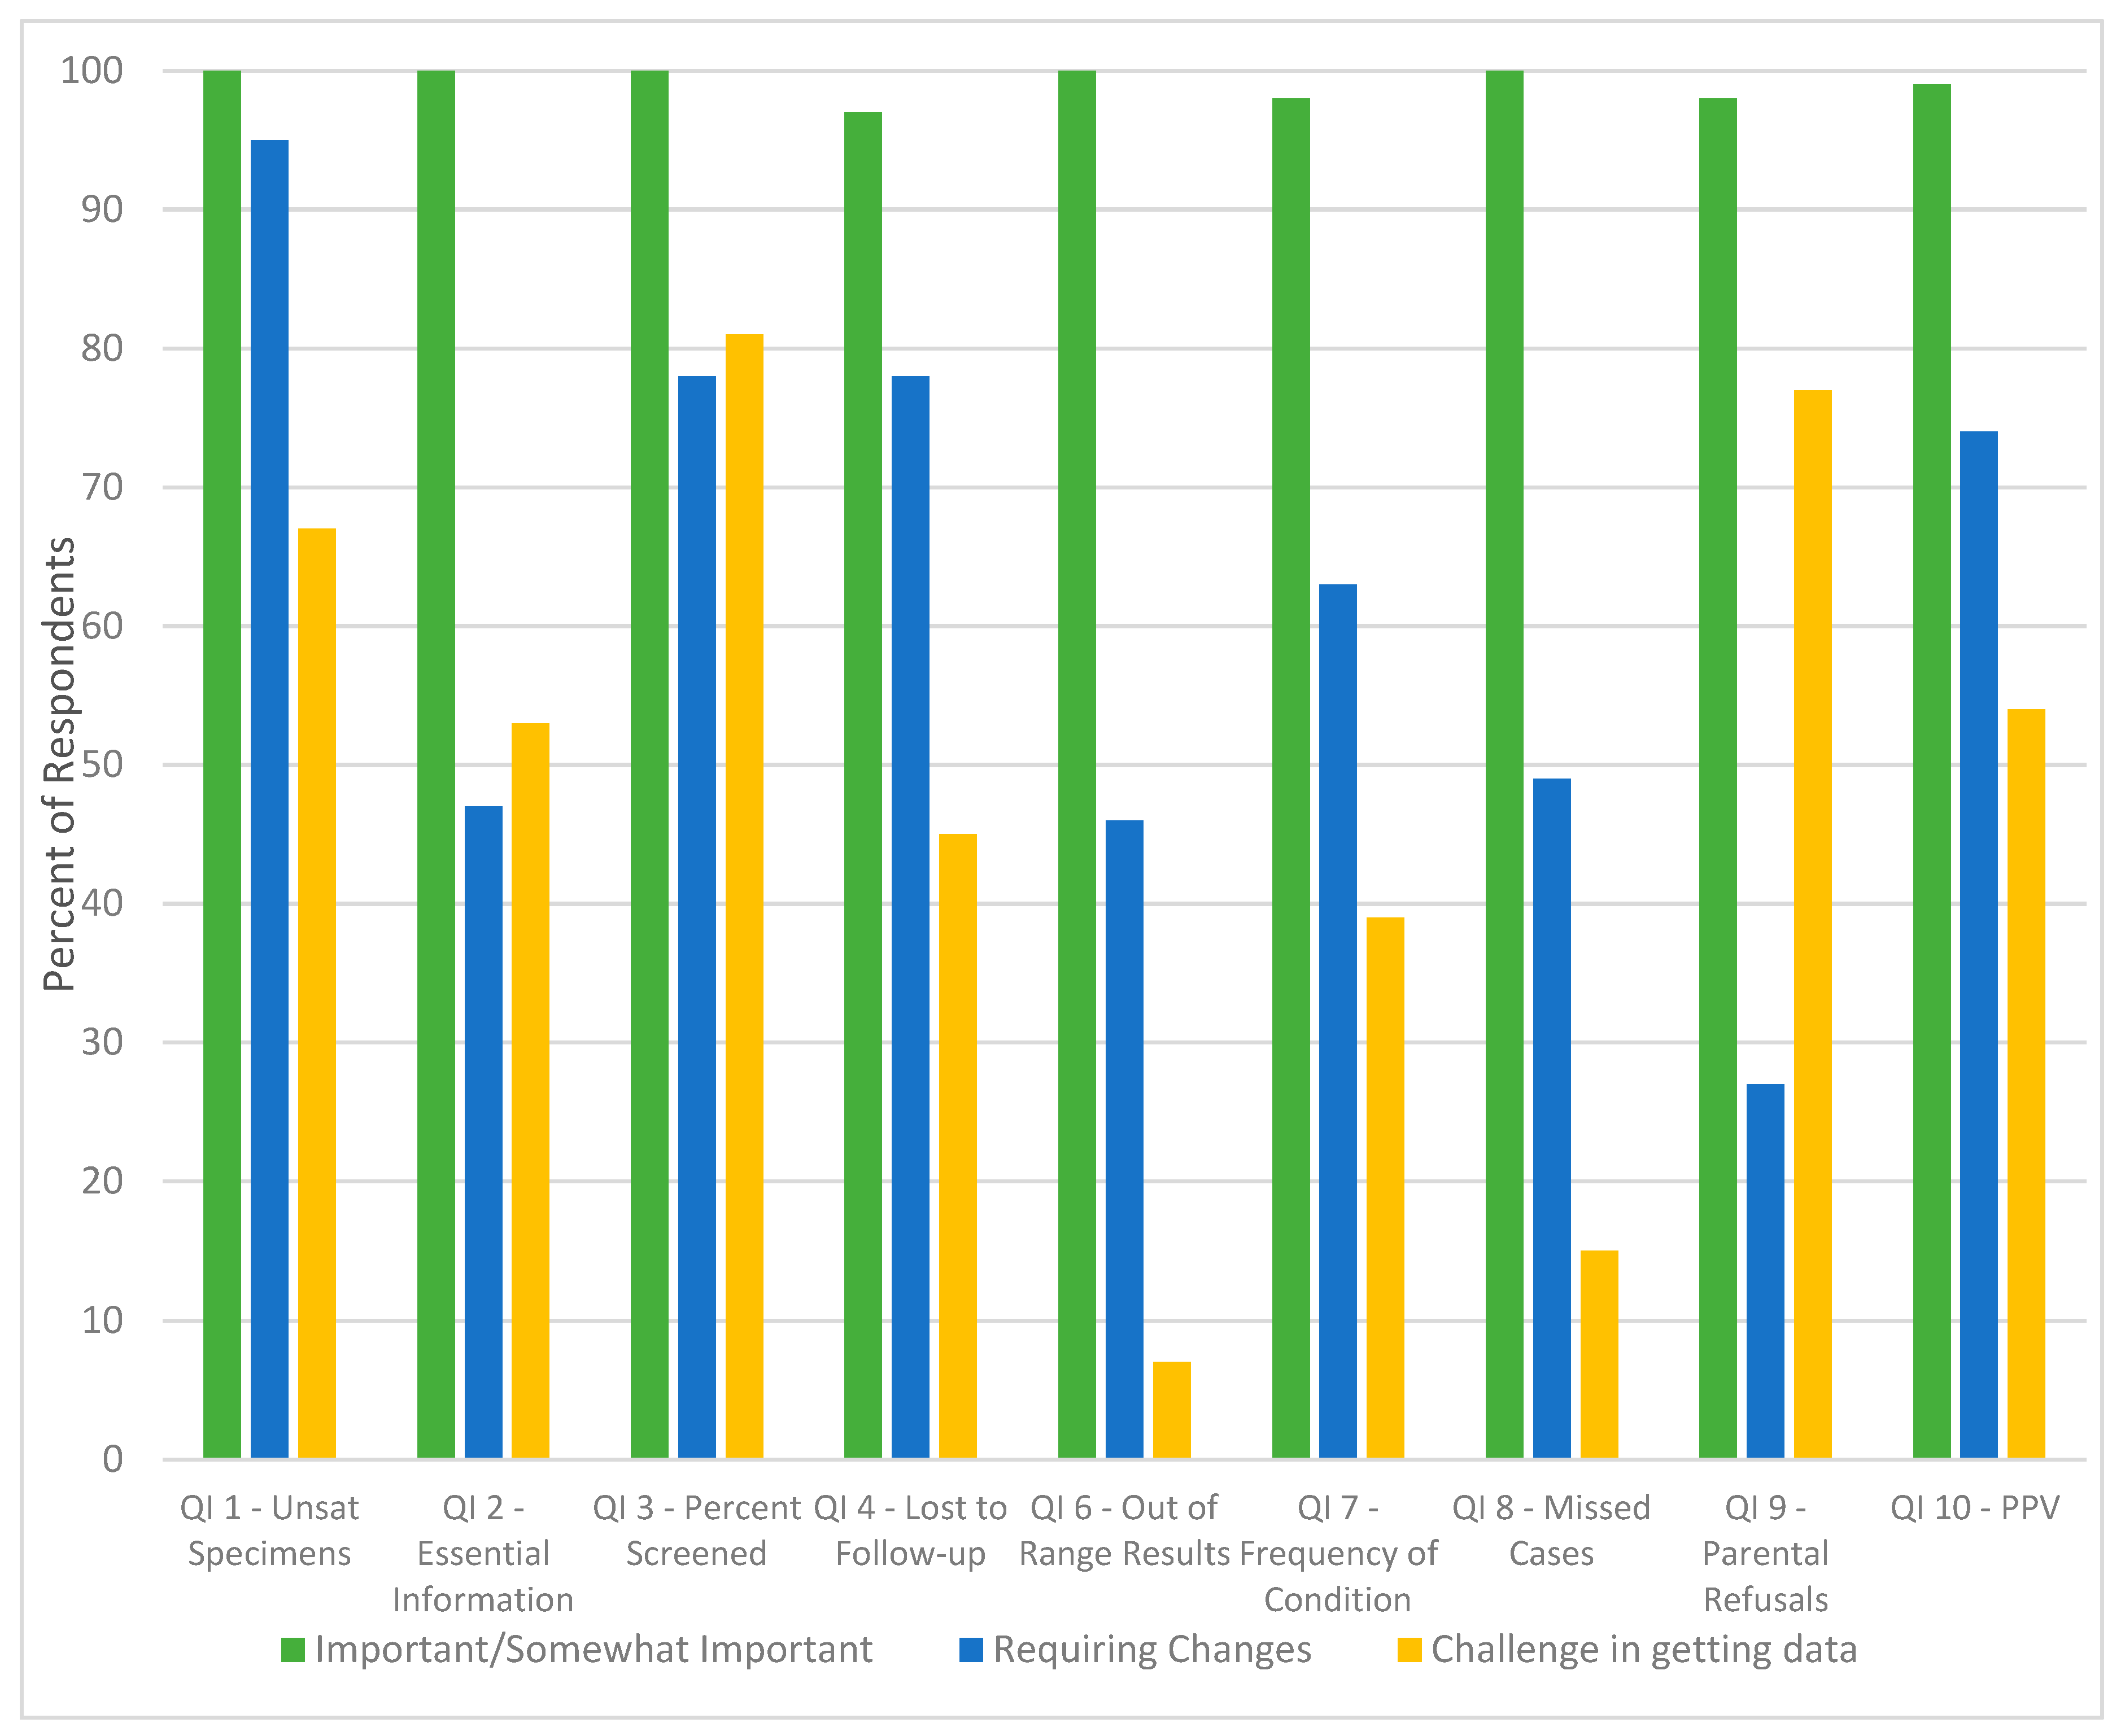
| 1 | Percent of unsatisfactory specimens due to improper collection | Number of specimens on which laboratories cannot perform a complete newborn screening panel due to errors in collection divided by the number of specimens submitted |
| 2 | Percent of cards with all essential information | All dried blood spot (DBS) cards with state-defined essential information divided by all DBS cards received |
| 3 | Percent of eligible infants receiving a valid newborn screening test | Number of babies with a satisfactory and valid newborn screening result divided by number of live births in the same time period |
| 4 | Rate of loss to follow-up: unsatisfactory and out-of-range | Number of babies with an unsatisfactory specimen (and no previous or later satisfactory specimen) and out-of-range result that were lost to follow-up per state protocols at six months of age divided by the total number of infants in the state with unsatisfactory specimen and out-of-range test result. |
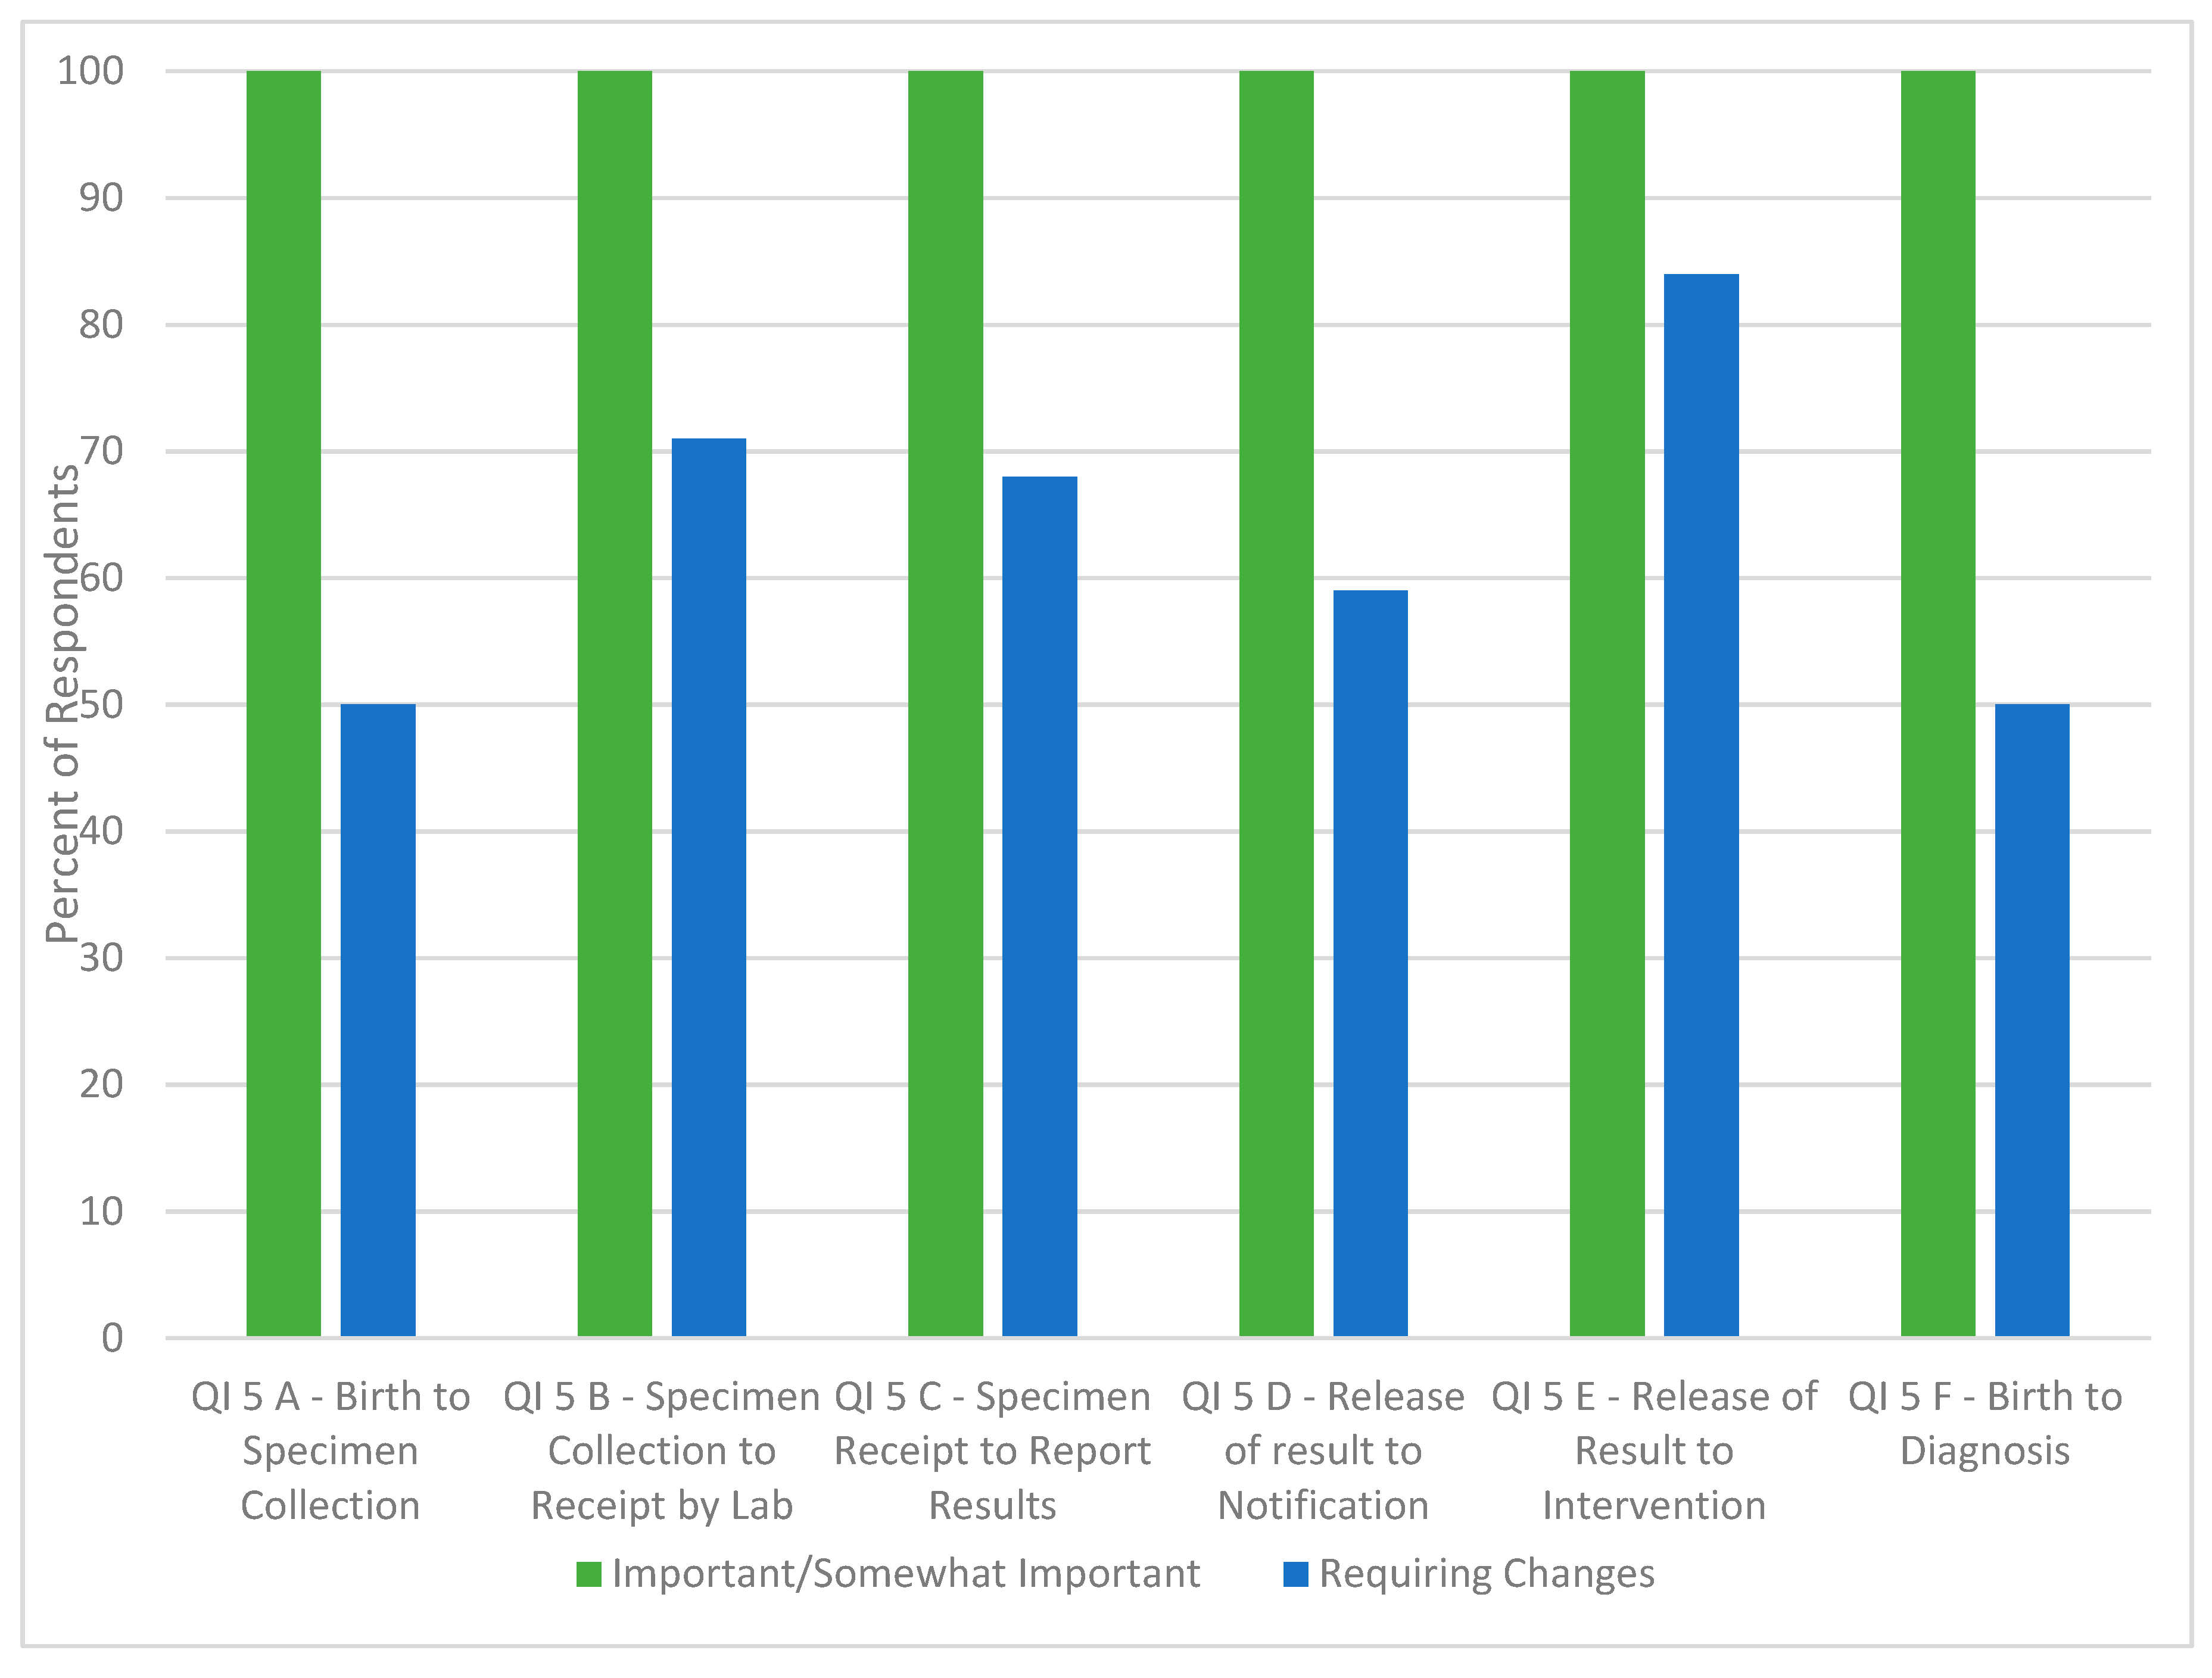
| 5 | Average time from: birth to specimen collection; specimen collection to receipt by laboratory; specimen receipt to reporting out results; release of out-of-range results to notification of medical provider; release of out-of-range results to medical intervention; birth to diagnosis | Number of specimens within each category divided by the summation of values in each time category. |
| 6 | Rate of out-of-range results, any referral to evaluation | Number of infants screened positive and need a repeat divided by the total number of infants screened; Number infants with the out-of-range result that need referral for evaluation divided by total number of infants screened |
| 7 | Prevalence of condition detected at birth: First screen versus Second screen | Number of infants confirmed affected based on an out-of-range first (versus subsequent) valid specimen divided by the number of infants screened |
| 8 | Rate of missed cases (false negatives) | Number of babies with disease who were not identified on newborn screening (but had a valid newborn screen) divided by all the babies who were screened and diagnosed with a disorder (true positives and false negatives combined). |
| 9 | Percent of parental refusals | Number of babies whose parents refused the complete newborn screening panel divided by the total number of live births |
| 10 | Positive predictive value (PPV) of out-of-range screening results | Number of babies with a “not normal” screen with a confirmed diagnosis divided by the number of all babies with a “not normal” screen; Number of babies referred for evaluation with a confirmed diagnosis divided by the number of all babies referred for evaluation |
| Quality Indicator | New Jersey Newborn Screening Program Assessment of Feasibility and Utility | |
|---|---|---|
| 1 | Percent of unsatisfactory specimens due to improper collection | The Newborn Screening Program was unable to differentiate between initial and repeat specimens (results include both). The program was also unable to exclude percent of specimens rejected per CLSI guidelines [12], specimens collected <24 h after birth or following a transfusion including those that were collected too soon due to state protocol. These specimens could not be delineated when providing data for Quality Indicator 1. |
| 2 | Percent of cards with all essential information | Results include all initial and repeat specimens that were initially received with missing essential demographic information even if the data was later provided. States that require fewer demographic fields are more likely to have better compliance with this QI. |
| 3 | Percent of eligible infants receiving a valid newborn screening test | Infants were identified by matching births in the state electronic birth certificate system (EBC) and the number of first specimens received by the laboratory, the number of unrepeated unsatisfactory first specimens, the number of “valid” first specimens (first specimen minus unrepeated). Results include initial specimens, repeat specimens with no previous specimen in the laboratory information management system (LIMS), and out of state births. In addition, actual patient data is not matched between the state EBC and LIMS. |
| 4 | Rate of loss to follow-up: unsatisfactory and out-of-range | This QI was feasible and straight forward to collect. |
| 5 | Average time from: birth to specimen collection; specimen collection to receipt by laboratory; specimen receipt to reporting out results; release of out-of-range results to notification of medical provider; release of out-of-range results to medical intervention; birth to diagnosis | Results for the time from the release of out-of-range results to notification of medical provider are presented as the time from receipt until a written report is issued by the laboratory. The immediate notification of critical results was not included; report date changes are made in the LIMS when duplicate reports are issued. The date of notification of medical provider was not recorded electronically, and thus results included both borderline cases (mailed letter) and presumptive cases (phone call). Results indicate that time to diagnosis varies significantly by disorder and stratification of results by disorder would be beneficial. |
| 6 | Rate of out-of-range results, any referral to evaluation | Results were beneficial as being described by the disorder to better describe assay performance and workload. |
| 7 | Prevalence of condition detected at birth: First screen versus Second screen | This QI was feasible and straight forward to collect. |
| 8 | Rate of missed cases (false negatives) | Results indicate that case definitions are important to determine false negatives. |
| 9 | Percent of parental refusals | The New Jersey Newborn Screening program was unable to calculate this QI at the time of the pilot study as this metric was being monitored by each birthing hospital and not the New Jersey Newborn Screening program. |
| 10 | Positive predictive value (PPV) of out-of-range screening results | Results indicate that calculations of PPV will vary based on a laboratory’s results categories and definition of out of range results and case definitions. |
| Quality Indicator Number | Data Element(s) Being Collected |
|---|---|
| 1 | Percent of dried blood spot specimens that were unacceptable due to improper collection and/or transport. |
| 2 | Percent of dried blood spot specimens with at least one missing state-defined essential data field upon receipt at the laboratory. |
| 3 | Percent of eligible newborns not receiving a newborn screen, reported by dried blood spot or point-of-care screen(s). |
| 4 | Percent of infants that have no recorded final resolution (confirmed diagnosis or diagnosis ruled out by an appropriate medical professional) with the newborn screening program. |
| 5 | Timeliness of newborn screening activities: a) Time from birth to specimen collection/ point-of-care testing. b) Time from specimen collection to receipt at your state’s newborn screening laboratory. c) Time from specimen receipt at your state’s newborn screening laboratory to reporting out specimen results. d) Time from birth to reporting out specimen results. e) Time from reporting out-of-range results to medical intervention by an appropriate medical professional for infants with a confirmed clinical diagnosis. f) Time from birth to confirmation of clinical diagnosis by an appropriate medical professional. g) For infants with an out-of-range newborn screen result requiring a clinical diagnostic workup by an appropriate medical professional, time from birth to time of determining if a result was a false positive. |
| 6 | Percent of infants with an out-of-range newborn screen result requiring clinical diagnostic workup reported by disorder category. |
| 7 | Percent of disorders detected by newborn screening with a confirmed diagnosis by an appropriate medical professional. |
| 8 | Percent of missed cases, reported by disorder. |
| Name: | |
|---|---|
| Organization Name: | |
| Email Address: | |
| Quality Indicator Specific Questions | For Each QI please respond to the following two questions: |
| Quality Indicator 1: Percent of invalid dried blood spot specimens/cards due to improper collection | Is this QI Important to capture? (Yes/No; if no, please specify why this Quality Indicator is not important) Is the definition for this QI concise and clear? (Yes/No; if no, please specify what changes would make this QI more relevant) |
| Quality Indicator 2: Percent of dried blood spot specimens/cards missing essential information | |
| Quality Indicator 3: Percent of eligible infants not receiving valid newborn screening test, reported by dried blood spot or point of care test(s) | |
| Quality Indicator 4: Percent of loss to follow-up | |
| Quality Indicator 5: Time elapsed from birth to screening, follow-up testing, confirmed diagnosis | |
| Quality Indicator 6: Percent of out of range results | |
| Quality Indicator 7: Prevalence of condition detected by newborn screening for each disorder | |
| Quality Indicator 8: Percent of missed cases (false negatives), reported by disorder | |
| Question | Percent Agreement | Proposed Changes to the Quality Indicator |
|---|---|---|
| Quality Indicator 1: Percent of dried blood spot specimens that were unacceptable due to improper collection and/or transport. | ||
| Question 1.1: Do you agree that the use of the term “unacceptable” is used correctly for this Quality Indicator? | 100% | Add text in italics: requiring an additional sample collected from the newborn and submitted to the laboratory |
| Question 1.2: Should errors due to collection and errors due to transportation be reported separately as Quality Indicator 1a and Quality Indicator 1b? | 78.6% | Improper transport definition has been amended to (in italics): Any specimen received after the state-defined length of time that deems a specimen unacceptable for testing. In addition, the CLSI guidelines include placing specimens in a sealed plastic bag without a desiccant as a transport error. Specimens that are not completely dry are now accounted for in errors due to collection. |
| Question 1.3: Should an additional quality indicator capture unacceptable specimens based on laboratory errors (e.g., DNA contamination)? | 61.5% | None. Do not add new QI. |
| Question 1.4: Can you see opportunities for multiple interpretations using these definitions? | 53.8% | Removed the word “card” in favor of using “specimen” throughout the document. Inclusion of the following phrase to the purpose statement: “and, therefore, requiring additional work for laboratory personnel to acquire an acceptable specimen.” |
© 2019 by the authors. Licensee MDPI, Basel, Switzerland. This article is an open access article distributed under the terms and conditions of the Creative Commons Attribution (CC BY) license (http://creativecommons.org/licenses/by/4.0/).
Share and Cite
Yusuf, C.; Sontag, M.K.; Miller, J.; Kellar-Guenther, Y.; McKasson, S.; Shone, S.; Singh, S.; Ojodu, J. Development of National Newborn Screening Quality Indicators in the United States. Int. J. Neonatal Screen. 2019, 5, 34. https://0-doi-org.brum.beds.ac.uk/10.3390/ijns5030034
Yusuf C, Sontag MK, Miller J, Kellar-Guenther Y, McKasson S, Shone S, Singh S, Ojodu J. Development of National Newborn Screening Quality Indicators in the United States. International Journal of Neonatal Screening. 2019; 5(3):34. https://0-doi-org.brum.beds.ac.uk/10.3390/ijns5030034
Chicago/Turabian StyleYusuf, Careema, Marci K. Sontag, Joshua Miller, Yvonne Kellar-Guenther, Sarah McKasson, Scott Shone, Sikha Singh, and Jelili Ojodu. 2019. "Development of National Newborn Screening Quality Indicators in the United States" International Journal of Neonatal Screening 5, no. 3: 34. https://0-doi-org.brum.beds.ac.uk/10.3390/ijns5030034