Investigating Users’ Continued Usage Intentions of Online Learning Applications

1
Department of Safety and Security, Huzhou University, Huzhou 313000, China
2
School of Information Management Engineering, Shanghai University of Finance and Economics, Shanghai 200086, China
3
Business School, Huzhou University, Huzhou 313000, China
4
Data Science and Cloud Service Research Centre, Shanghai University of Finance and Economics, Shanghai 200086, China
*
Author to whom correspondence should be addressed.
†
These authors contributed equally to this work.
Information 2019, 10(6), 198; https://0-doi-org.brum.beds.ac.uk/10.3390/info10060198
Submission received: 4 May 2019
/
Revised: 31 May 2019
/
Accepted: 31 May 2019
/
Published: 4 June 2019
(This article belongs to the Section Information Applications)
Abstract
:Understanding users’ continued usage intentions for online learning applications is significant for online education. In this paper, we explore a scale to measure users’ usage intentions of online learning applications and empirically investigate the factors that influence users’ continued usage intentions of online learning applications based on 275 participant data. Using the extended Technology Acceptance Model (TAM) and the Structural Equation Modelling (SEM), the results show that males or users off campus are more likely to use online learning applications; that system characteristics (SC), social influence (SI), and perceived ease of use (PEOU) positively affect the perceived usefulness (PU), with coefficients of 0.74, 0.23, and 0.04, which imply that SC is the most significant to the PU of online learning applications; that facilitating conditions (FC) and individual differences (ID) positively affect the PEOU, with coefficients of 0.72 and 0.37, which suggest that FC is more important to the PEOU of online learning applications; and that both PEOU and PU positively affect the behavioral intention (BI), with coefficients of 0.83 and 0.51, which indicate that PEOU is more influential than PU to users’ continued usage intentions of online learning applications. In particular, the output quality, perceived enjoyment, and objective usability are critical to the users’ continued usage intentions of online learning applications. This study contributes to the technology acceptance research field with a fast growing market named online learning applications. Our methods and results would benefit both academics and managers with useful suggestions for research directions and user-centered strategies for the design of online learning applications.
1. Introduction
Online learning is defined more clearly as any class that offers its entire curriculum in an online course delivery mode, allowing students to participate regardless of geographic location and independent of time and place [1]. The worldwide online learning market shows fast and significant growth for the past several years. Almost all the Internet companies and educational institutions have shown interest in releasing related courses and applications. Take the App Store of Apple Inc. as an example; there are at least 178,000 applications classified in the category of education until March 31, 2016. Docebo [2] reported that the worldwide market for self-paced e-Learning (for example, online learning) reached $35.6 billion in 2011. The five-year compound annual growth rate is estimated around 7.6%, and revenues would reach $51.5 billion by 2016. Mobile learning is a new form of learning utilizing the unique capabilities of mobile devices [3]; Frohberg, Göth, and Schwabe [4] provided a critical analysis of Mobile Learning projects. Therefore, to investigate users’ continued usage intentions of online learning applications may benefit both academics, about the continued acceptance of online learning, and managers, with considerable insight into the market to obtain more popularity for their online learning applications.
In particular, online learning applications must first be well-accepted by the potential users. As a large number of online learning applications is springing up in the market, one of the major challenges is to investigate users’ continued usage intentions. To combat this problem, theories of technology acceptance have to provide a theoretical basis, such as the Technology Acceptance Model (TAM) [5], the Theory of Planned Behavior (TPB) [6], the Unified Theory of Acceptance and Use of Technology (UTAUT) [7], etc. For instance, Giannakas, Kambourakis, Papasalouros, and Gritzalis introduced and applied a six-dimensional framework which consisted of Spatiotemporal, Collaboration/Social, Session, Personalization, Data security & privacy, and Pedagogy to scrutinize the contributions published from 2004 to 2016 in the field of mGBL [8]. Specifically, the TAM is one of the influential models for explaining technology acceptance and adoption. Since it has been developed, the TAM has been extensively used, tested, and extended in order to explain technology adoption and success in many application areas, e.g., paradigm shift [9], model extend [10], effect examine [11], etc.
The technology acceptance of online learning researches could be divided into two categories roughly: using the TAM or mixed models. First of all, researchers investigate the influencing factors of online learning acceptance with the TAM. For instance, Mallya and Lakshminarayanan [12] examined factors influencing the usage of the Internet with TAM as a research framework, and they suggested that the attitude and perceived usefulness of the Internet significantly influence the behavioral intention of students to use the Internet for academic purposes. In addition, researches also adopted the mixed models for this issue. For example, Daǧhan and Akkoyunlu [13] argued that confirmation of the usage of online learning environments could be explained by the information quality, system quality, and service quality. Wu and Chen [14] investigated the continuance intention of the use of massive open online courses (MOOCs), which is one style of online learning, and argued that perceived usefulness and attitude are critical factors. Thongsri, Shen, and Bao [15] found that performance expectancy, social influence, information quality, and system quality have significant effects on the intention to use ClassStart, which is a representative application of online learning. Barclay, Donalds, and Oseibryson [16] argued that the critical success factors influencing students’ perception include supportive cultural practices, access to computers, system or online environment availability, computer and online learning self-efficacy, user perception of usefulness, and ease of use.
It should be noted that great changes have taken place in the field of online learning, with the rapid development of mobile technology and applications. Faced with the increasing number of different online learning applications, users’ intentions of not only accepting but also using online learning applications is persistently becoming a new challenge today. For this reason, we explore the scale of users’ usage intentions for online learning applications and identify the factors that influence users’ continued usage intentions for online learning applications from the user perspective using the extended TAM in order to improve a user-centered design for mobile learning applications.
2. Theoretical Framework and Hypotheses
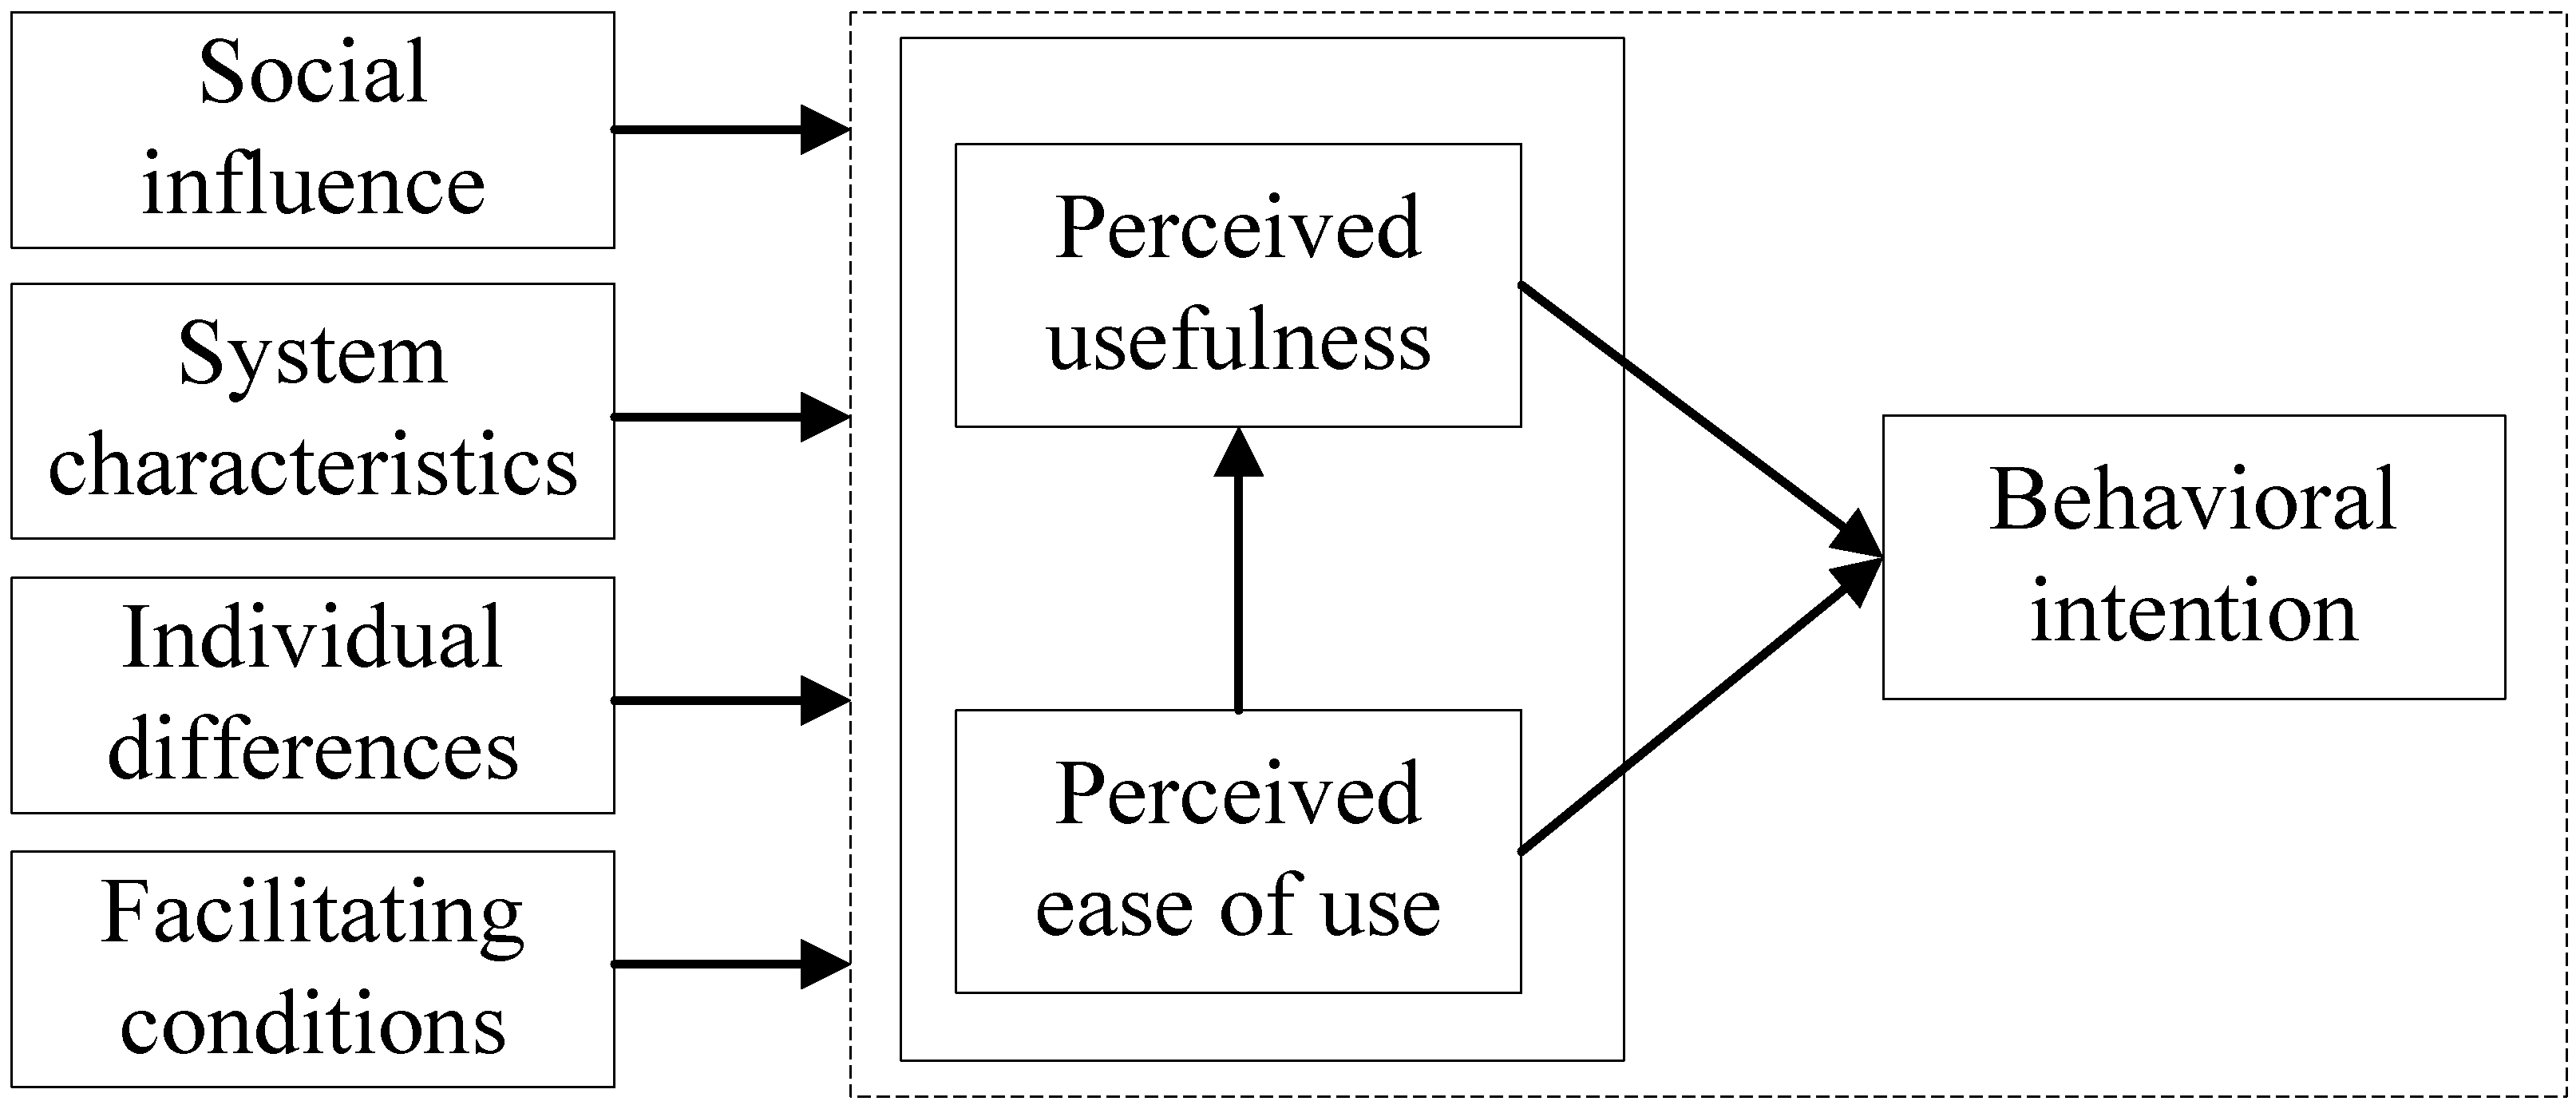
Synthesizing prior research on the TAM model, Venkatesh and Bala [17] developed a theoretical framework that represents the body of knowledge cumulated over the years from the TAM model, as shown in Figure 1. A detailed explanation follows.
2.1. Social Influence (SI)
Social influence (SI) was adopted and included in the TAM model in order to overcome a limitation of the TAM model in measuring the influence of social environments [18]. The causal relationship of the social influence on behavioral intention has been explored in TAM2 and UTAUT [7,18,19]. On one hand, the subjective norm, defined as a person’s perception that most people who are important to him/her think he/she should or should not perform the behavior in a question, was a key theoretical underpinning for the original TAM model. On the other hand, the image is defined as the degree to which the use of a new technology is perceived to enhance one’s status in one’s social system [20] because individuals often respond to the social influences to establish or maintain a favorable image within a reference group [21].
For online learning applications, we infer that the social influence, involving a subjective norm and image, may be the powerful and direct determinants of perceived usefulness, thereby impacting behavioral intention. Based on the above discussion, we thus hypothesize the following:
Hypothesis 1:
Social influence will have a positive influence on users’ perceived usefulness to use an online learning applications consistently.
2.2. System Characteristics (SC)
System characteristics (SC) can help individuals develop favorable (or unfavorable) perceptions regarding the usefulness or ease of use of a system. The determinants include the job relevance, output quality, and result demonstrability [17]. The job relevance is the key component for a potential user’s judgment and was defined as an individual’s perception regarding the degree to which the target system is applicable to one’s job. Output quality refers to the degree of the system accurately performs the user’s tasks. Result demonstrability is defined as the tangibility of the results of using the innovation [20].
Based on the literature above, some studies have linked job relevance, output quality, and result demonstrability to perceived usefulness. Meanwhile, in TAM3, Venkatesh [17] argued that these three determinants fall into the category of system characteristics. For online learning applications, we infer that system characteristics, involving job relevance, output quality, and result demonstrability, may be the powerful and direct determinants of perceived usefulness, thereby impacting behavioral intention. Based on the above discussion, we thus hypothesize the following:
Hypothesis 2:
System characteristics will have a positive influence on users’ perceived usefulness of online learning applications consistently.
2.3. Individual Differences (ID)
According to the TAM3 model, variable individual differences include computer self-efficacy, computer anxiety, computer playfulness, and perception of external control [17]. Firstly, computer self-efficacy refers to a judgment of one’s capability to use a computer. Secondly, computer anxiety means the degree of an individual’s apprehension, or even fear, when she/he is faced with the possibility of using computers [18]. Thirdly, computer playfulness infers the degree of cognitive spontaneity in microcomputer interactions [22]. Fourthly, the perception of external control means the degree to which an individual believes that organizational and technical resources exist to support the use of the system [7].
Based on the literature above, some studies have testified to the influence of computer self-efficacy, computer anxiety, computer playfulness, and perception of external control on perceived usefulness. In this work, users can use different devices, such as smartphone, ipad, computer, etc., to use online learning applications, so we use “device” instead “computer” in the following sections. For online learning applications, we infer that individual differences, including device self-efficacy, device anxiety, device playfulness, and perception of external control, may be the powerful and direct determinants of the perceived ease of use, thereby impacting behavioral intention. We thus hypothesize the following:
Hypothesis 3:
Individual differences will have a positive influence on users’ perceived ease of use of online learning applications consistently.
2.4. Facilitating Conditions (FC)
Facilitating conditions (FC) are defined as the degree to which an individual believes that organizational and technical infrastructures exist to support the use of the system [18]. Facilitating conditions were measured using two items, for example, perceived enjoyment and objective usability. Perceived enjoyment is defined as the extent to which the act of using a specific system is perceived to be enjoyable in its own right aside from any performance consequences resulting from the system use [23]. In addition, objective usability was operationalized consistently with the keystroke model from human-computer interaction research [24] and prior user acceptance research [25]. It measured the user interaction in the very early stages [18].
Based on prior research, the facilitating conditions are measured using two items, namely perceived enjoyment and objective usability, in this paper. For online learning applications, we infer that facilitating conditions may be the powerful and direct determinants of perceived ease of use, thereby impacting behavioral intention. Based on the above discussion, we hypothesize the following:
Hypothesis 4:
Facilitating conditions will have a positive influence on users’ perceived ease of use of online learning applications consistently.
2.5. Perceived Ease of Use (PEOU)
The perceived ease of use (PEOU) is defined as the degree to which a person believes that using Information Technology will be free of effort [5]. The PEOU was measured using four items, such as clarity and understandability, ease of use, ease to do the right thing, and mental effort [18], which are direct determinants of perceived usefulness, since, all else being equal, the less effort is required to use a system, the more using it can increase job performance. Based on the above discussion, we hypothesize the following:
Hypothesis 5:
The PEOU will have a positive influence on users’ perceived usefulness to use online learning applications consistently.
Moreover, there are extensive empirical evidences cumulated over a decade that the PEOU is significantly linked to the intention, both directly and indirectly via its impact on perceived usefulness. Summarizing the important theories, perceived ease of use is always a strong predictor of attitude [5,25]. We therefore hypothesize the following:
Hypothesis 6:
The PEOU will have a positive influence on users’ continued usage intention for online learning applications.
2.6. Perceived Usefulness (PU)
The perceived usefulness (PU) is defined as the degree to which a person believes that using a particular system would enhance his/her job performance [5]. Some researchers claimed that the perceived usefulness had a significant influence on the intent to use the system [26,27]. Venkatesh [28] proposed to measure the perceived usefulness with four items, namely performance improvement, productivity increase, effectiveness enhancement, and usefulness. We therefore hypothesize the following:
Hypothesis 7:
The PU will have a positive influence on users’ continued usage intention for online learning applications.
2.7. Behavioral Intention (BI)
Behavioral intention (BI) is considered an immediate antecedent of usage behaviour and gives an indication of an individuals’ readiness to perform a specific behaviour. There is considerable support in the literature for the relationship between behavioral intention and usage behaviour in general [5,7,18,29,30], which has recently been extended to an e-learning context [27,31,32]. Behavioral intention affects the usage behaviour greatly. However, in the context of this research, we only consider behavioral intention as a dependent variable in the theoretical framework for the focus question.
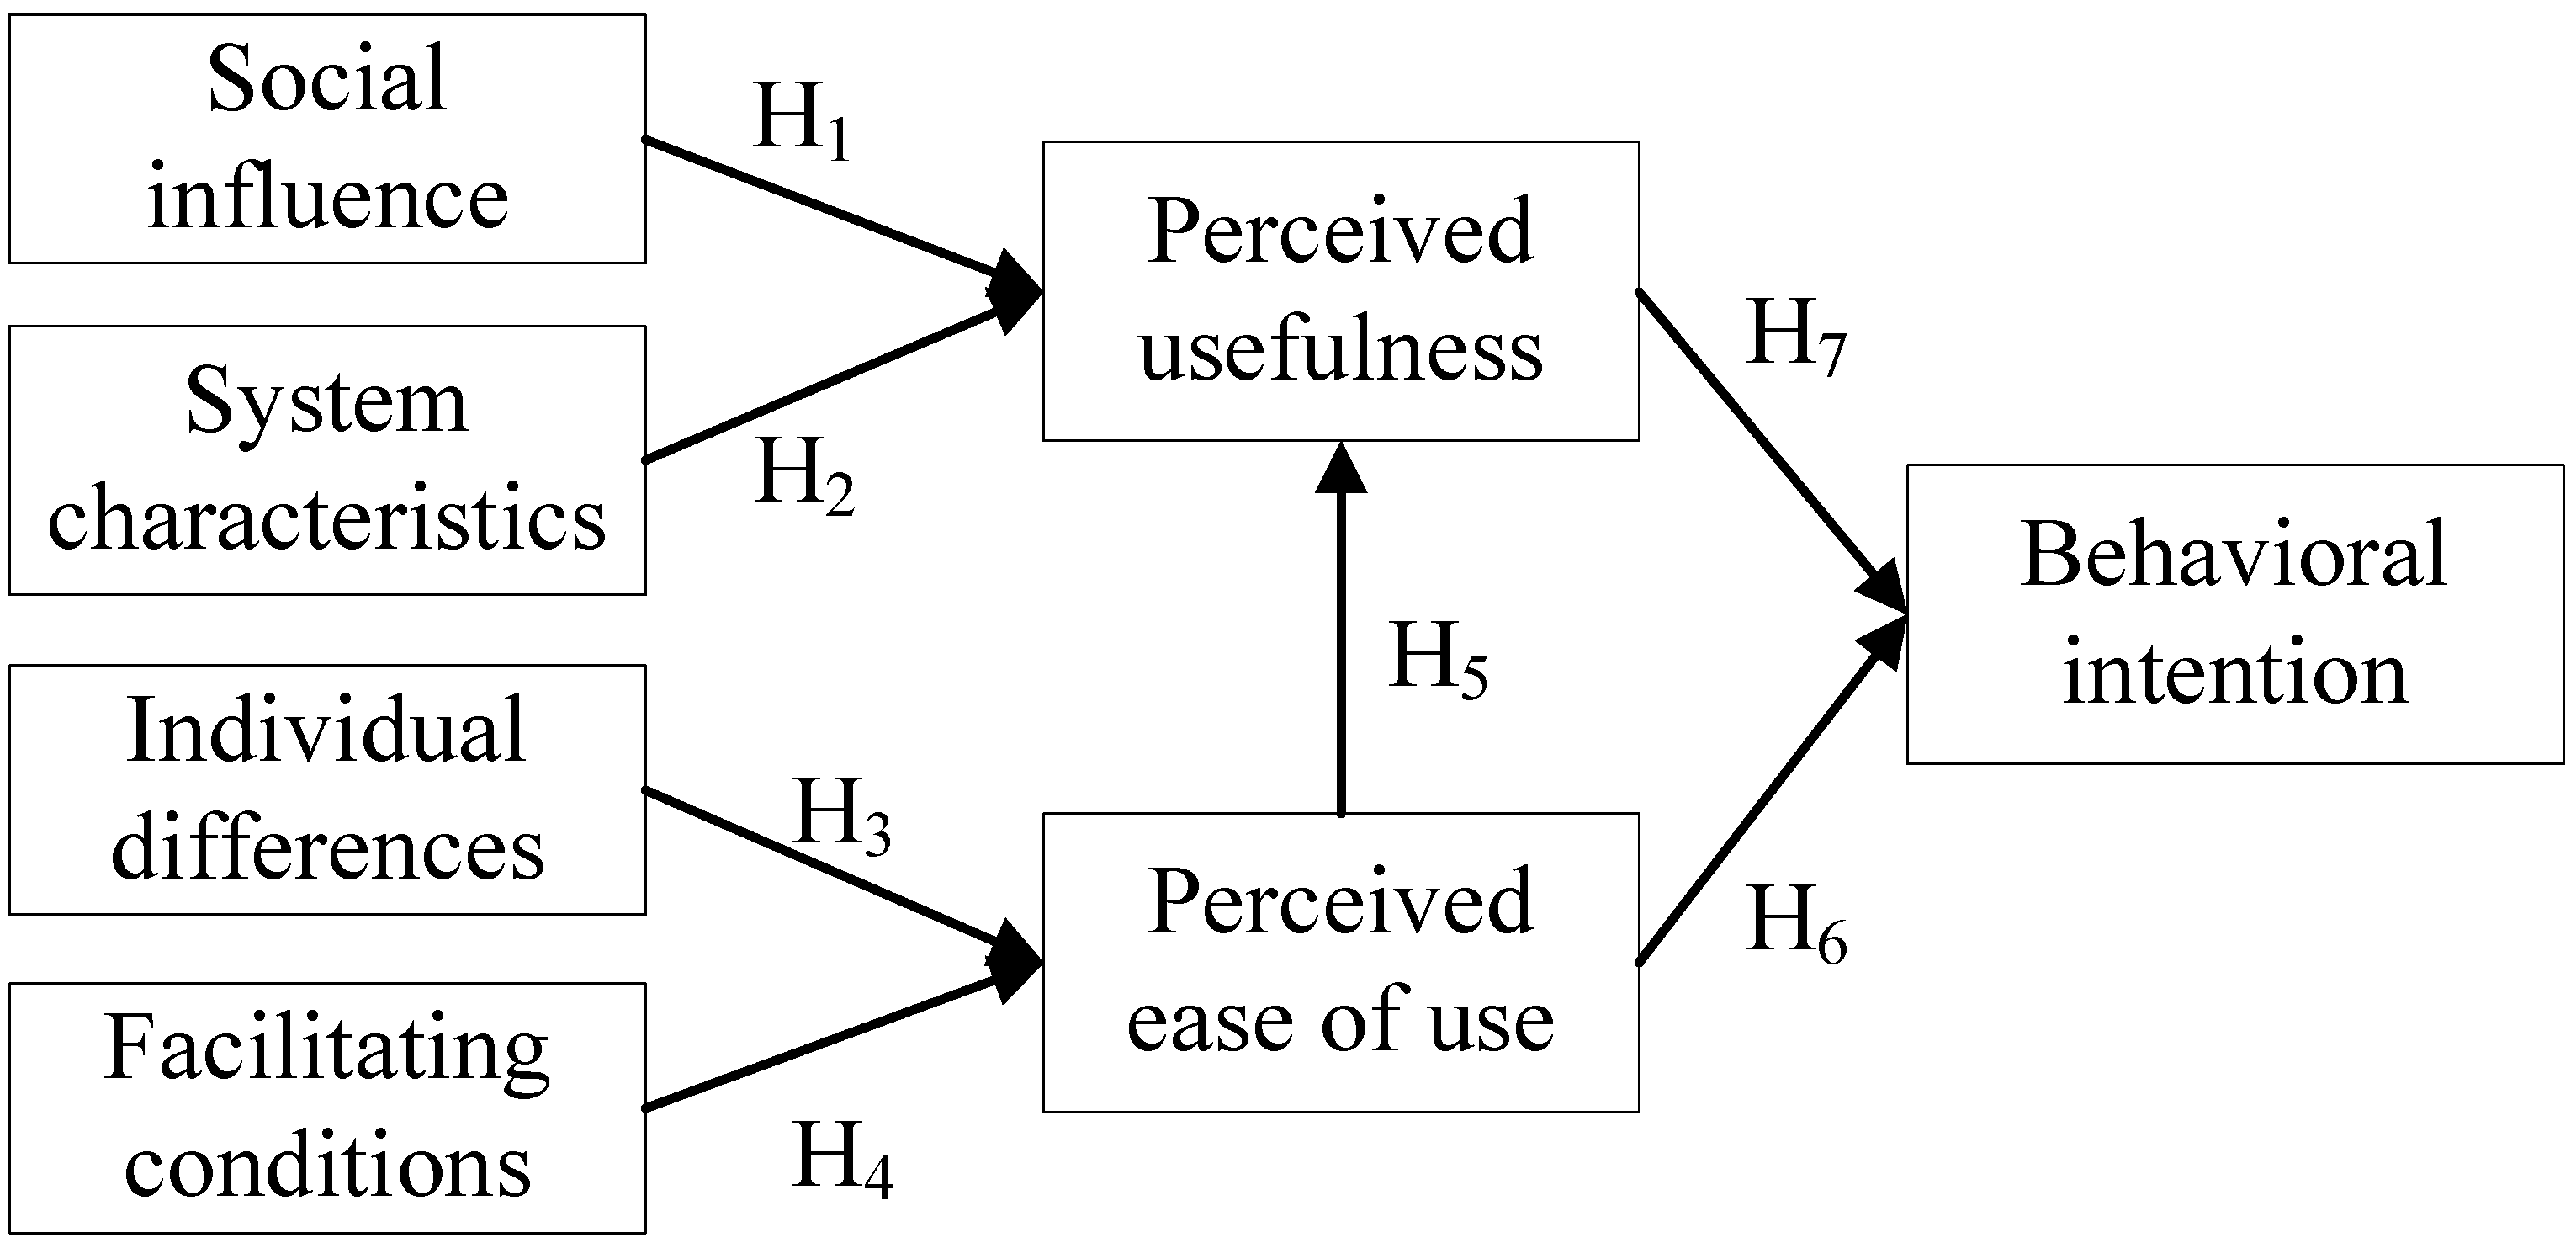
The full research model is shown in Figure 2.
3. Research Methods
3.1. Participants
A total of 300 online respondents were received during the questionnaire survey period; after removing 25 invalid responses, 275 responses (92%) remained. According to the argument that online surveys have more advantages than traditional surveys, such as low cost, high speed, accuracy, flexibility, multimedia, across space and time, and fixed time [33,34], the questionnaires of this paper were collected via the Internet. Among the valid samples, 151 respondents (54.9%) were female. The respondents included college students (86%) and staff (14%). The majors of respondents included management (42%), science (16%), literature and history specialty (13%), etc.(29%). The average amount of time respondents spent online with a smart phone was nearly three hours every day, in which about one hour was used for online learning applications. That is to say, the users would spend nearly one third of their online time to learn on average. The data collect duration was 55 days, from December 1st, 2015 to January 25th, 2016. The structural equation modeling (SEM) is used to test the model and hypotheses.
3.2. Procedure
The motivation of this study is to explore factors that influence users’ continued usage intention for online learning applications. To guarantee that respondents had the requisite knowledge, before the respondents answered the questionnaire, the respondents would be introduced to an explanation of the research aim, scope, process, as well as the full definition and the functionality of online learning applications. The scale in this research was designed by referring to relevant literatures and revised repeatedly based on the situation of online learning applications. The final scale is presented in the Appendix A. A five-point Likert scale was used to measure the items based on negative and positive anchors, ranging from 1 (strongly disagree) to 5(strongly agree). Gender was represented with a dummy variable, where 0 was female and 1 was male.
3.3. Reliability and Validity Measures
3.3.1. Internal Consistency Reliabilities (Cronbach’s Test; All Constructs Pass the Reliability Test)
The inherent reliability Cronbach’s is used to test the reliability [35]. The Cronbach’s for all constructs exceed 0.8, and the Cronbach’s for the total scale is 0.964 in this paper, listed in Table 1. Additionally, the Statistical Product and Service Solutions (SPSS) is used to test the standardized Cronbach’s .
3.3.2. Construct Validity (KMO (Kaiser–Meyer–Olkin) and Bartlett’s Spherical Test; All constructs Pass the Test)
The KMO and Bartlett’s spherical test are used to test the construct validity. If the KMO value is smaller than 0.5, it is considered unsuitable for factor analysis [33]. Fortunately, the KMO values of all constructs pass the test. Moreover, there are approximate chi-square and significance levels in the Bartlett’s spherical test in this paper, and the significance level of the Bartlett’s spherical test of all constructs is 0.000 ( 0.001), which listed in Table 1.
3.3.3. Discriminant Validity (All Constructs Pass the Test)
Discriminant validity tests whether all the constructs are clearly distinguished from each other. Tarhini [36] argued that discriminant validity can be observed in two ways: (1) comparing a constructs’ square root of the Average Variance Extracted (AVE) with correlations (R squares), the former should be greater than the latter, and (2) the loadings of items in the current construct in Partial Least Square (PLS) should be greater than the cross loadings with items of other constructs. In Table 2, the diagonal elements are the square roots of the AVEs and the off-diagonal ones are correlation values. All constructs satisfy the discriminant validity test.
4. Results
4.1. Significance Analysis
4.1.1. There were Significant Differences in Usage Intention for Gender
The results show that there are significant differences in usage intention (F = 6.718, p = 0.010 < 0.05) for online learning applications between genders. The perception of males with the intention of using online learning applications is higher than that of females; that is to say, more males would be likely to use online learning applications.
4.1.2. There were Significant Differences in Usage Intention among Different Groups
The results show that there are significant differences in usage intention (F = 3.022, p = 0.018 < 0.05) for online learning applications among different groups. Among college students, seniors have a stronger intention of using online learning applications than juniors. Especially, users who are off campus have a stronger intention of using online learning applications than users on campus.
4.2. The Measurement Model Analysis
The structural equation model of using online learning applications is tested by Analyse of Moment Structures (AMOS). As shown in Table 3, the assumption model A1 is fitted step by step to eventually get model A4. All the indicators of model A4 fulfill the judge guidelines of the Structural Equation Modeling (SEM) except Chi-square value (p). The main reason lies in the fact that the Chi-square value (p) is easily affected by sample size. Generally, according to the integrated judge, we think model A4, as the model of mobile application acceptance for online learning, is acceptable and fitted well.
4.3. Factor Analysis
In this paper, factor analysis is used to evaluate the influence level of measurement scales on the components. As shown in Table 4, the value of standardization load factor of most measurement scales in the model are greater than 0.5, which indicates the measurement scales could be explained and measured by the questions.
Based on the statistical results presented above, we can get several insights about the measurement scales for each determinant. (1) Social influence is explained by the subjective norm and image in this paper, with factor loads of 0.44 and 0.63 respectively, which suggest that users may pay more attention to the image because individuals often respond to social influences to establish or maintain a favorable image within a reference group. (2) System characteristics is explained by the job relevance, output quality, and result demonstrability, with factor loads of 0.58, 0.88, and 0.62, which imply that users prefer to choose products with a high output quality. With the increasing number of applications, it is convenient for users to choose the right product that highly correlates with one’s job. Therefore, users are like to pay more attention to a high output quality. (3) Individual differences is explained by device self-efficacy, device anxiety, device playfulness, and perception of external control, with factor loads of 0.77, 0.68, 0.65, and 0.72, indicating that one’s capability to use a device and the perception of organizational and technical resources are all important due to individual differences. (4) Facilitating conditions are explained by perceived enjoyment and objective usability, both with factor loads of 0.76, which indicate that an enjoyable perception and usability are both important to the facilitating conditions. (5) Perceived ease of use is measured using clarity and understandability, ease of use, ease to do the right thing, and mental effort, with factor loads of 0.69, 0.60, 0.68, and 0.60, which indicate that it is crucial to make the application process clear and easy. (6) Perceived usefulness is measured using performance improvement, productivity increase, effectiveness enhancement, and usefulness, with factor loads of 0.42, 0.88, 0.76, and 0.90, which show that more users expect to increase their job performance using useful applications. (7) Behavioral intention is explained by intention to use, prediction of use, and plan to use, with factor loads of 0.78, 0.78, and 0.68; that is to say, intention to and prediction of use both would be important to the usage intention.
4.4. Path Coefficients
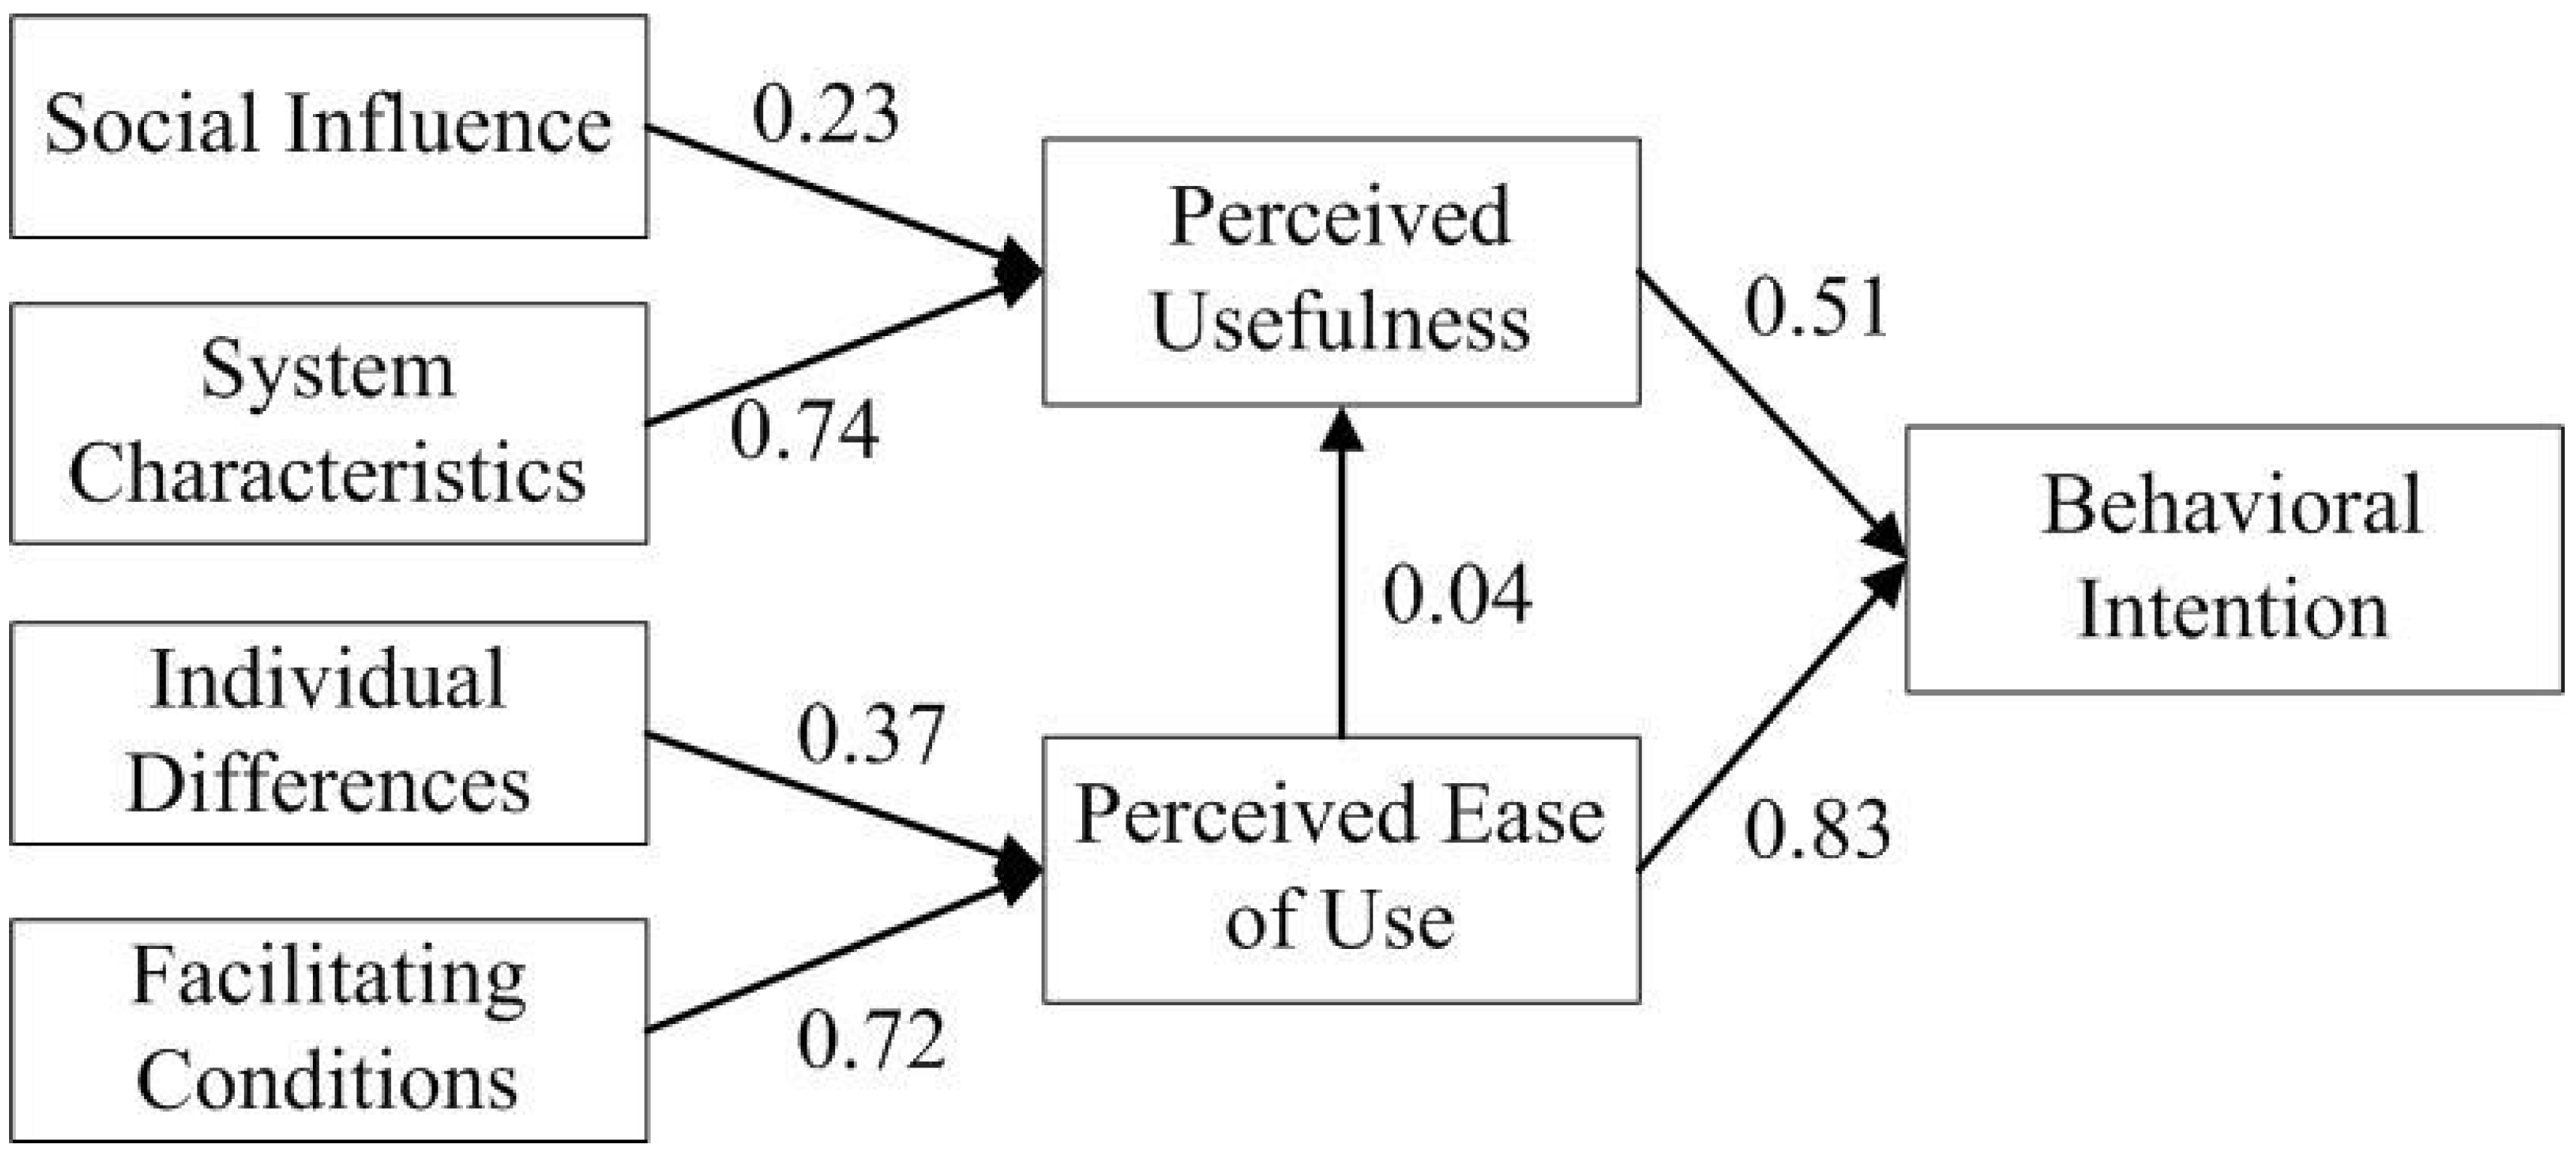
We got the path coefficients by SEM. Figure 3 shows that the seven standardization path coefficients are all above 0.01 and reached a significant level (<0.05), which means all the work hypotheses in this paper are acceptable. In detail, we find that (1) the key factors influencing the perceived usefulness of using online learning applications include system characteristics, social influence, and perceived ease of use, with coefficients of 0.74, 0.23, and 0.04, which indicate that system characteristics is the most significant factor to perceived usefulness. (2) The factors influencing perceived ease of use of online learning applications include facilitating conditions and individual differences, with coefficients of 0.72 and 0.37, which show that facilitating conditions are more important to the perceived ease of use. (3) The important factors influencing the usage intention of users for online learning applications include perceived usefulness and perceived ease of use, with coefficients of 0.51 and 0.83, which means perceived ease of use is more influential than the perceived usefulness to users’ continued usage intention for online learning applications.
5. Conclusion and Discussions
In this paper, we empirically investigated users’ continued usage intention for online learning applications from users’ perspectives. We contributed to the technology acceptance research field with a rapidly increasing market named online learning applications, investigating the factors that influence individual continued usage intentions for online learning applications. Based on the theoretical framework that represents the body of knowledge cumulated over the years from TAM research, a research model for investigating the users’ continuance usage intention of online learning applications was developed and the scale passed the test of reliability and validity. Then, the collected data from 275 participants in mainland China via an online questionnaire was analysed using a SEM technique based on AMOS methods in conjunction with a multi-group analysis. The quantitative methodology approach not only validated the hypotheses but also led to several findings.
The main findings are as follows: (1) Gender and on or off campus have significant effects on the usage of online learning applications; males or users off campus are more likely to use online learning applications. (2) System characteristics (SC), social influence (SI), and perceived ease of use (PEOU) positively affect the perceived usefulness (PU), with coefficients of 0.74, 0.23, and 0.04, which imply that SC is the most significant factor to PU. (3) Facilitating conditions (FC) and individual differences (ID) positively affect PEOU, with coefficients of 0.72 and 0.37, which show that FC is more important to PEOU. (4) PEOU and PU positively affect the behavioral intention (BI), with coefficients of 0.83 and 0.51, which mean PEOU is more influential than PU to users’ intentions of using online learning applications. It should be noted that, with the increasing number of different online learning applications, the most important factors which influence users’ intentions of using online learning applications are system characteristics and facilitating conditions. Specifically, the system characteristics (for example, output quality) and facilitating conditions (for example, perceived enjoyment and objective usability) are critical to users’ continued use of online learning applications.
Exploring users’ behavioral beliefs toward online learning applications, this study can serve as a reference for future researchers, managers, and designers. On the one hand, this study addressed a gap in the literature on user perceptions toward the usage of the online learning applications using an extended TAM. This research approach may be extensively applied to other mobile applications. On the other hand, in addition to academic contributions, this study is also expected to benefit online education design and marketing practices. For instance, traditionally, classic online educators often release products that ignore gender differences. However, the results of this study show that gender is a concern for online learning applications. Thus, designers and product managers could put some effort into the gender aspect. By the same token, on or off campus users also has influence design and marketing. Therefore, in order to attract more users, designers and marketers can develop differentiating learning content for different groups. As the system characteristics and facilitating conditions are the most important factors that influence users’ continued usage intention for online learning applications, it is significant in emphasizing the excellent output quality and great convenience of using online learning applications. In addition, if the online learning application can be pleasantly interactive, it will attract more users to participate in online learning. More implications could be found in the corresponding sections, such as factor analysis and path coefficients, which will offer detailed empirical results for realistic references.
Generally, this study can help online educational institutions find the right user-centered strategies. Although the preliminary results are encouraging, the model needs to be applied in more organizations to determine its real strengths and weaknesses. For one, cultural differences should be considered. For example, Tarhini et al. [36] argued that there might be individual-level cultural values on users’ acceptance. Since the experimental work was implemented in mainland China, an open question is whether the proposed model is feasible for other cultures. A next step in this research initiative considers applying the acceptance model of online learning applications in a larger number of samples, even in other countries. For another, the continued usage intention of other mobile applications is also an important issue. The proposed model also could be used to explore users’ continued usage intention toward mobile applications of other fields to test the model robustness further.
Author Contributions
Conceptualization, J.L. and Z.J.; methodology, Z.Y.; software, Z.Y.; validation, Z.J., Z.Y., and C.Y.; formal analysis, Z.J.; investigation, Z.J.; resources, Z.J.; data curation, Z.Y.; writing—original draft preparation, Z.J.; writing—review and editing, Z.Y.; visualization, Z.J.; supervision, J.L. and C.Y.; project administration, Z.J.; funding acquisition, Z.J.
Funding
This work is funded by the Humanities and Social Science Foundation (No:18YJCZH062) and the Graduate Innovation Fund in Shanghai University of Finance and Economics (No. 2017110357).
Acknowledgments
The authors gratefully acknowledge all anonymous reviewers and editors for their constructive suggestions for the improvement of this paper.
Conflicts of Interest
The authors declare no conflict of interest.
Appendix A. Questionnaire Items and References
Social Influence
Subjective Norm - The opinion of whether I should use the online learning application which comes from the persons around me, and those who I value would be important.
Image - Using the online learning application would help me to raise my social status.
System Characteristics
Job Relevance - I would be inclined to choose the online learning application that is related to my work closely.
Output Quality - I would be inclined to choose the online learning application that delivers the highest output quality.
Demonstrability Result - I would be inclined to choose the online learning application that produces effective job relevant results specifically.
Individual Differences
Device Self-Efficacy - I think I can use the device.
Device Anxiety - I think I can understand the device.
Device Playfulness - I think I can use the device with enjoyment.
Perception of External Control - I think there are organizational and technical resources to support the use of the device.
Facilitating Conditions
Perceived Enjoyment - I think I will perceive enjoyable as using the application.
Objective Usability - I think it is consistent with my purpose as using the application.
Perceived Ease of Use
Clear and Understandable - Learning to use a new online learning application would not be a challenge.
Easy to Use - I believe that the online learning application would be easy to use.
Easy to Do What Wanted to Do - I believe that the online learning application would be easy to learn what I want to learn.
Requirement of Less Mental Effort - I believe that the online learning application would not confuse me.
Perceived Usefulness
Performance Improvement - Using the online learning application would increase my productivity.
Productivity Increase - Using the online learning application would increase my job performance.
Effectiveness Enhancement - Using the online learning application would enhance my effectiveness on the job.
Usefulness - I find the online learning application is useful in my job.
Behavioral Intention
Intend to Use - I intend to use the online learning application.
Predict to Use- I predict to use the online learning application in the future.
Plan to Use - I plan to use the online learning application in the future.
References
- Harasim, L.M. Learning Networks: A Field Guide to Teaching and Learning Online; MIT Press: Cambridge, MA, USA, 1995. [Google Scholar]
- Docebo. E-Learning Market Trends & Forecast 2014–2016 Report. A Report by Docebo 2014. Available online: http://www. docebo.com/landing/contactform (accessed on 4 May 2019).
- Cheon, J.; Lee, S.; Crooks, S.M.; Song, G. An investigation of mobile learning readiness in higher education based on the theory of planned behavior. Comput. Educ. 2012, 59, 1054–1064. [Google Scholar] [CrossRef]
- Frohberg, D.; Göth, C.; Schwabe, G. Mobile Learning Projects: A critical analysis of the state of the art. J. Comput. Assist. Learn. 2009, 25, 307–331. [Google Scholar] [CrossRef]
- Davis, F.D. Perceived usefulness, perceived ease of use, and user acceptance of information technology. MIS Q. 1989, 13, 319. [Google Scholar] [CrossRef]
- Ajzen, I. The theory of planned behavior. Organ. Behav. Hum. Decis. Process. 1991, 50, 179–211. [Google Scholar] [CrossRef]
- Venkatesh, V.; Morris, M.G.; Davis, G.B.; Davis, F.D. User acceptance of information technology: Toward a unified view. MIS Q. 2003, 27, 425–478. [Google Scholar] [CrossRef]
- Giannakas, F.; Kambourakis, G.; Papasalouros, A.; Gritzalis, S. A critical review of 13 years of mobile game-based learning. Educ. Technol. Res. Dev. 2018, 66, 341–384. [Google Scholar] [CrossRef]
- Bagozzi, R.P. The legacy of the technology acceptance model and a proposal for a paradigm shift. J. Assoc. Inf. Syst. 2007, 8, 244–254. [Google Scholar] [CrossRef]
- Timothy, T.; Mingming, Z. The influence of teachers’ conceptions of teaching and learning on their technology acceptance. Interact. Learn. Environ. 2017, 25, 1–15. [Google Scholar] [CrossRef]
- Saeed, K.A.; Abdinnour-Helm, S. Examining the effects of information system characteristics and perceived usefulness on post adoption usage of information systems. Inf. Manag. 2008, 45, 376–386. [Google Scholar] [CrossRef]
- Mallya, J.; Lakshminarayanan, S. Factors influencing usage of Internet for academic purposes using technology acceptance model. DESIDOC J. Libr. Inf. Technol. 2017, 37. [Google Scholar] [CrossRef]
- Daǧhan, G.; Akkoyunlu, B. Modeling the continuance usage intention of online learning environments. Comput. Hum. Behav. 2016, 60, 198–211. [Google Scholar] [CrossRef]
- Wu, B.; Chen, X. Continuance intention to use MOOCs: Integrating the technology acceptance model (TAM) and task technology fit (TTF) model. Comput. Hum. Behav. 2017, 67, 221–232. [Google Scholar] [CrossRef]
- Thongsri, N.; Shen, L.; Bao, Y. Investigating factors affecting learners perception toward online learning evidence from ClassStart application in Thailand. Behav. Inf. Technol. 2019, 5, 1–16. [Google Scholar] [CrossRef]
- Barclay, C.; Donalds, C.; Oseibryson, K.M. Investigating critical success factors in online learning environments in higher education systems in the Caribbean. Inf. Technol. Dev. 2018, 24, 1–30. [Google Scholar] [CrossRef]
- Venkatesh, V.; Bala, H. Technology acceptance model 3 and a research agenda on interventions. Decis. Sci. 2008, 39, 273–315. [Google Scholar] [CrossRef]
- Venkatesh, V.; Davis, F.D. A theoretical extension of the technology acceptance model: Four longitudinal field studies. Manag. Sci. 2000, 46, 186–204. [Google Scholar] [CrossRef]
- Venkatesh, V.; Thong, J.Y.L.; Xu, X. Consumer acceptance and use of information technology: Extending the unified theory of acceptance and use of technology. MIS Q. 2012, 36, 157–178. [Google Scholar] [CrossRef]
- Moore, G.C.; Benbasat, I. Development of an instrument to measure the perceptions of adopting an information technology innovation. Inf. Syst. Res. 1991, 2, 192–222. [Google Scholar] [CrossRef]
- Kelman, H.C. Compliance, identification, and internalization: Three processes of attitude change. J. Confl. Resolut. 1958, 2, 51–60. [Google Scholar] [CrossRef]
- Webster, J.; Martocchio, J.J. Microcomputer playfulness: Development of a measure with workplace implications. MIS Q. 1992, 16, 201–226. [Google Scholar] [CrossRef]
- Davis, F.D.; Bagozzi, R.P.; Warshaw, P.R. Extrinsic and intrinsic motivation to use computers in the workplace. J. Appl. Soc. Psychol. 1992, 22, 1111–1132. [Google Scholar] [CrossRef]
- Card, S.K.; Moran, T.P.; Newell, A. The keystroke-level model for user performance time with interactive systems. Commun. ACM 1980, 23, 396–410. [Google Scholar] [CrossRef]
- Venkatesh, V. Creation of favorable user perceptions: Exploring the role of intrinsic motivation. MIS Q. 1999, 23, 239–260. [Google Scholar] [CrossRef]
- Park, S.Y.; Nam, M.W.; Cha, S.B. University students’ behavioral intention to use mobile learning: Evaluating the technology acceptance model. Br. J. Educ. Technol. 2012, 43, 592–605. [Google Scholar] [CrossRef]
- Tarhini, A.; Hone, K.; Liu, X. Factors affecting students’ acceptance of e-learning environments in developing countries: A structural equation modeling approach. Int. J. Inf. Educ. Technol. 2013, 3, 54–59. [Google Scholar]
- Venkatesh, V. Determinants of perceived ease of use: Integrating control, intrinsic motivation, and emotion into the technology acceptance model. Inf. Syst. Res. 2000, 11, 342–365. [Google Scholar] [CrossRef]
- Taylor, S.; Todd, P. Decomposition and crossover effects in the theory of planned behavior: A study of consumer adoption intentions. Int. J. Res. Mark. 1995, 12, 137–155. [Google Scholar] [CrossRef]
- Taylor, S.; Todd, P. Assessing IT usage: The role of prior experience. MIS Q. 1995, 19, 561–570. [Google Scholar] [CrossRef]
- Halawi, L.; McCarthy, R. Measuring students perceptions of blackboard using the technology acceptance model: A PLS approach. E-Learning 2008, 26, 18. [Google Scholar]
- Park, S.Y. An analysis of the technology acceptance model in understanding university students’ behavioral intention to use e-Learning. Educ. Technol. Soc. 2009, 12, 150–162. [Google Scholar]
- Rong, T. AMOS and Research Method; Press of Chongqing University: Chongqing, China, 2010; p. 65. [Google Scholar]
- Ji, Z. Empirical study on the network learning behavior of college students. Distance Educ. China 2013, 5, 59–63. [Google Scholar]
- Brown, J.D. The Cronbach alpha reliability estimate. JALT Test. Eval. SIG Newsl. 2002, 6, 17–19. [Google Scholar]
- Tarhini, A.; Hone, K.; Liu, X.; Tarhini, T. Examining the moderating effect of individual-level cultural values on users’ acceptance of e-learning in developing countries: A structural equation modeling of an extended technology acceptance model. Interact. Learn. Environ. 2016, 25, 306–328. [Google Scholar] [CrossRef]
- Beach, L.R. Image Theory: Theoretical and Eempirical Foundations; Lawrence Erlbaum Associates Publishers: Mahwah, NJ, USA, 1998; pp. 3–18. [Google Scholar]
- Beach, L.R. Decision Making in the Workplace: A Unified Perspective; Lawrence Erlbaum Associates: Mahwah, NJ, USA, 2014; p. 1. [Google Scholar]
- Compeau, D.; Higgins, C. Computer self-efficacy: Development of a measure and initial test. MIS Q. 1995, 19, 189–211. [Google Scholar] [CrossRef]
Figure 1.
The theoretical framework of the Technology Acceptance Model (TAM).

Figure 2.
The research model.

Figure 3.
The path coefficient graph of the structural equation model.


Table 1.
Test results of the reliability and validity measures.
| Component | Cronbach’s | KMO | Approximate | Significance | |
|---|---|---|---|---|---|
| Test | Chi-Square | Level | |||
| SI | 0.829 | 0.794 | 622 | 0 | |
| SC | 0.895 | 0.848 | 1090 | 0 | |
| ID | 0.841 | 0.724 | 468 | 0 | |
| FC | 0.893 | 0.883 | 1273 | 0 | |
| PEOU | 0.841 | 0.724 | 468 | 0 | |
| PU | 0.847 | 0.750 | 487 | 0 | |
| BI | 0.860 | 0.695 | 425 | 0 |
Table 2.
Discriminant Validity (The construct mean/standard deviation are noted by the construct; all constructs pass the validity test).
Table 2.
Discriminant Validity (The construct mean/standard deviation are noted by the construct; all constructs pass the validity test).
| Component | M | SD | SI | SC | ID | FC | PEOS | PU | BI | |
|---|---|---|---|---|---|---|---|---|---|---|
| SI | 3.210 | 0.695 | 0.785 | |||||||
| SC | 3.310 | 0.656 | 0.741 | 0.920 | ||||||
| ID | 3.150 | 0.775 | 0.453 | 0.630 | 0.803 | |||||
| FC | 3.140 | 0.732 | 0.434 | 0.594 | 0.690 | 0.761 | ||||
| PEOS | 3.150 | 0.775 | 0.453 | 0.630 | 0.740 | 0.690 | 0.868 | |||
| PU | 3.230 | 0.715 | 0.659 | 0.825 | 0.649 | 0.580 | 0.649 | 0.803 | ||
| BI | 3.130 | 0.799 | 0.382 | 0.518 | 0.635 | 0.729 | 0.506 | 0.635 | 0.760 |
Table 3.
The model fit summary for the structural model of online learning applications.
| Model | p | CMIN/DF | GFI | AGFI | NFI | TLI | CFI | RMSEA | IFI |
|---|---|---|---|---|---|---|---|---|---|
| > 0.05 | < 3.0 | > 0.90 | > 0.80 | > 0.90 | > 0.90 | > 0.90 | < 0.10 | > 0.90 | |
| A1 | 0 | 6.118 | 0.784 | 0.674 | 0.822 | 0.788 | 0.845 | 0.137 | 0.847 |
| A2 | 0 | 4.798 | 0.819 | 0.694 | 0.874 | 0.840 | 0.896 | 0.119 | 0.897 |
| A3 | 0 | 3.077 | 0.908 | 0.794 | 0.939 | 0.913 | 0.957 | 0.088 | 0.958 |
| A4 | 0 | 2.883 | 0.916 | 0.809 | 0.944 | 0.921 | 0.962 | 0.084 | 0.962 |
Table 4.
The standardization factor load of each measurement scale.
| Determinants | Measurement Scales | Factor Load |
|---|---|---|
| Social Influence | Subjective Norm | 0.44 |
| Image | 0.63 | |
| System Characteristics | Job Relevance | 0.58 |
| Output Quality | 0.88 | |
| Demonstrability Result | 0.62 | |
| Individual Differences | Device Self-Efficacy | 0.77 |
| Device Anxiety | 0.68 | |
| Device Playfulness | 0.65 | |
| Perception of External Control | 0.72 | |
| Facilitating Conditions | Perceived Enjoyment | 0.76 |
| Objective Usability | 0.76 | |
| Perceived Ease of Use | Clear and Understandable | 0.69 |
| Easy to Use | 0.60 | |
| Easy to Do What Wanted to Do | 0.68 | |
| Requirement of Less Mental Effort | 0.60 | |
| Perceived Usefulness | Performance Improvement | 0.42 |
| Productivity Increase | 0.88 | |
| Effectiveness Enhancement | 0.76 | |
| Usefulness | 0.90 | |
| Behavioral Intention | Intend to Use | 0.78 |
| Predict to Use | 0.78 | |
| Plan to Use | 0.69 |
© 2019 by the authors. Licensee MDPI, Basel, Switzerland. This article is an open access article distributed under the terms and conditions of the Creative Commons Attribution (CC BY) license (http://creativecommons.org/licenses/by/4.0/).
Share and Cite
MDPI and ACS Style
Ji, Z.; Yang, Z.; Liu, J.; Yu, C. Investigating Users’ Continued Usage Intentions of Online Learning Applications. Information 2019, 10, 198. https://0-doi-org.brum.beds.ac.uk/10.3390/info10060198
AMA Style
Ji Z, Yang Z, Liu J, Yu C. Investigating Users’ Continued Usage Intentions of Online Learning Applications. Information. 2019; 10(6):198. https://0-doi-org.brum.beds.ac.uk/10.3390/info10060198
Chicago/Turabian StyleJi, Zhi, Zhenhua Yang, Jianguo Liu, and Changrui Yu. 2019. "Investigating Users’ Continued Usage Intentions of Online Learning Applications" Information 10, no. 6: 198. https://0-doi-org.brum.beds.ac.uk/10.3390/info10060198
Note that from the first issue of 2016, this journal uses article numbers instead of page numbers. See further details here.