An Optimization Model for Demand-Responsive Feeder Transit Services Based on Ride-Sharing Car

1
School of air traffic management, Civil Aviation University of China, Tianjin 300300, China
2
Key laboratory of General Aviation Operation, Civil Aviation Administration of China (CAAC), Beijing 102202, China
*
Author to whom correspondence should be addressed.
Information 2019, 10(12), 370; https://0-doi-org.brum.beds.ac.uk/10.3390/info10120370
Submission received: 18 October 2019
/
Revised: 20 November 2019
/
Accepted: 22 November 2019
/
Published: 26 November 2019
(This article belongs to the Special Issue Smart Sensing, Data Communication, and Decision Making in Intelligent Transportation and Logistics Systems)
Abstract
:Ride-sharing (RS) plays an important role in saving energy and alleviating traffic pressure. The vehicles in the demand-responsive feeder transit services (DRT) are generally not ride-sharing cars. Therefore, we proposed an optimal DRT model based on the ride-sharing car, which aimed at assigning a set of vehicles, starting at origin locations and ending at destination locations with their service time windows, to transport passengers of all demand points to the transportation hub (i.e., railway, metro, airport, etc.). The proposed model offered an integrated operation of pedestrian guidance (from unvisited demand points to visited ones) and transit routing (from visited ones to the transportation hub). The objective was to simultaneously minimize weighted passenger walking and riding time. A two-stage heuristic algorithm based on a genetic algorithm (GA) was adopted to solve the problem. The methodology was tested with a case study in Chongqing City, China. The results showed that the model could select optimal pick-up locations and also determine the best pedestrian and route plan. Validation and analysis were also carried out to assess the effect of maximum walking distance and the number of share cars on the model performance, and the difference in quality between the heuristic and optimal solution was also compared.
1. Introduction
Demand-responsive feeder transit (DRT) system, which assigns a set of vehicles located at depots to visit all demand points to pick up passengers and transport all of them to the transportation hub, is the development trend of public transportation. Compared to traditional feeder transit services, DRTs with a door-to-door shared ride service are widely recognized as a competitive mode to shift travel demand from cars to public transportation. DRTs provide better customer service in remote areas with weak transportation infrastructures [1]. Generally speaking, the DRT operation company builds own depots and vehicle fleets. Although the service quality can be guaranteed, it leads to a high operating cost.
Traditional DRTs, as a further extension of the classical vehicle routing problem (VRP) with pickup and delivery (PDP) with time windows (VRPTW and PDPTW) [2,3], is based on the hypothesis of each demand point being visited by vehicles. When several demand points are adjacent to each other in space, their travel time may be very long in the real transit network, by taking the geometry and spatial distribution of the roads and demand points into account. In the case, one of them is selected as the pick-up location visited by the vehicle, the passengers at the remaining places could walk to a selected location to get on the bus, which would greatly improve the efficiency of vehicle operation and reduce total riding time of all passengers. At present, most studies have neglected the integrated operation of pick-up location selection (from some demand points to pick-up locations), pedestrian guidance (from unvisited demand points to selected ones), and transit routing (from these pick-up places to the transportation hub) [4,5,6]. Obviously, the assignment of unvisited places to these pick-up locations is determined by a pick-up location selection. Therefore, it is necessary to study DRT location-route problem to find the optimal relationship between service level and operating efficiency.
Another objective of this study was to address the DRT transit system in terms of ride-sharing cars, where private car owners gain access to provide dial-a-ride pick-up/delivery service by joining a DRT operation company when they have their origins and destinations on the service time windows. This is a new “product-as-service” approach to vehicle use. Obviously, it can reduce a fleet of company vehicles, increase the income of car owners, and reduce inefficient mileage to reduce carbon emissions, compared to traditional DRTs [7,8,9]. However, this problem is different from traditional ones, and the complexity of the former is more complex than that of the latter. Since solving such an issue has already been recognized as an effective tool to improve service efficiency, environmental concerns, and financial status, many scholars try to make some contributions to this area.
The main contribution of this study was to design an optimization framework for DRTs based on the ride-sharing car in order to reveal optimal relations between service level and operating efficiency. The research focused on the following aspects: (1) coordination of pedestrian guidance (from unvisited demand points to selected pick-up locations) and transit routing (from pick-up locations to the transportation hub) process to balance this with the total riding and walking time of all customers; (2) design of a two-stage heuristic algorithm based on genetic algorithm (GA) to resolve proposed mode efficiently. At last, a test case was used to evaluate the effectiveness of the proposed methodology.
The rest of this study is described as follows. A summary of related work on DRTs is presented in Section 2. Section 3 analyzes the framework of the proposed model. A two-stage heuristic algorithm based on GA is designed in Section 4. A case study is utilized to illustrate the application and feasibility of the proposed methodology in Section 5. Some conclusions and recommendations for future studies are discussed in Section 6.
2. Literature
DRTs are an extension of VRPTW and PDPTW [2,3], in which VRPTWs assign a set of vehicles to visit all demand points, while PDPTWs transport the number of goods from their origins to destinations. However, distinct differences between VRPTWs and PDPTWs in transporting goods and DRTs with the transportation of people decide that the latter is more complex than the former.
The existing studies on DRTs are mainly divided into analytic approaches and network approaches, in which: the former aims at finding the optimal relation between the stop space, route design, and the operating headway from a continuous perspective of the geometry and spatial distribution of the roads and demand points in the service area; the latter aims at finding links between these pickup locations and the segments of bus routes from the perspective of discrete traffic network. Many varieties of DRTs are summarized as follows: (1) DRTs with multiple use of vehicles, where the key difficulties in efficiently searching the solution space of multi-vehicle are compared to that of single-vehicle DRTs; (2) DRTs with multiple depots, where vehicles, leaving different depot,s have a different travel distance, leading the operation costs of multi-depot to be reduced compared to that of single-depot DRTs; (3) DRTs with the integration of the design of passenger rail service, station spacing, and headways [10,11]. The various objectives of the above varieties of DRTs involve the fleet size of the company, the travel distance or travel time of route, and their related operating costs [1,12,13,14,15]. However, those different objectives and constraints don’t usually change the properties of DRTs, which lead to the use of existing algorithms to resolve general models with a combination of one or more objectives.
The solution algorithm to DRTs can be divided into exact methods and heuristic algorithms [16], where the former can be further classified into Lagrange relaxation-based methods [17,18], column generation [19], and dynamic programming [20,21]; the latter can be also further classified into the route-building heuristics and metaheuristics. Since the VRPTW belongs to the NP-hard problem, exact methods often perform very poorly in computational efficiency and are unable to solve the large-scale instances [16,22,23,24]; heuristic algorithms thus turn to be more active. In the route-building method, a set of feasible routes is firstly generated and then used to search and fine-tune initial solutions according to the proposed constraints at a reasonable computational cost. In meta-heuristics method, simulated annealing [25,26,27], tabu search [18,23,28], genetic algorithms [29,30,31,32], and colony algorithm approach [33,34] are widely used to contend with DRTs.
On reviewing the literature on DRTs, some critical issues deserve further investigations:
- (1)
- Although several studies have formed a variety of DRTs, few of them have taken a shared car into account. Obviously, it can reduce a fleet of company vehicles, increase the income of car owners, and reduce inefficient mileage to reduce carbon emissions, compared to traditional DRTs. Both of these—DRTs and ride-sharing (RS)—assign vehicles to transport passengers from origins to destinations. The difference between them is that destinations of passengers in DRTs are the same (i.e., the transportation hub), while the destination of each passenger in RS is not the same. Since they are an extension of VRPs, their solution algorithms can be used with each other. However, an integration of DRTs and RS is much more complicated than DRTs and RS alone [7,8,9,31].
- (2)
- The basic assumption of traditional DRTs is all of the demand points must be visited by vehicles. The assumption is unable to reflect the characteristics of real traffic network, such as a one-way street or left-turn only intersection. When the shape and geometry distribution of the roads and customers are considered for model development, an integrated operation of transit (locating from unvisited locations to pick-up places) and transit routing (from pick-up places to the transportation hub), which not only reduces the travel time of residents but also improves the operation efficiency of vehicles, has been widely regarded as an effective tool in designing DRT network to the reliability of the result [4,5,6,34].
The main contribution of this study was to develop an operational methodology for the design of the DRT route based on a shared car with enough capability to capture the interaction between transit locating and routing process to meet travel demand. The research focused on the following aspects: (1) propose a mixed-integer optimization model that is capable of assigning a set of shared cars, starting at origin locations and ending at destination locations with their service time windows, to transport passengers of all demand points to the transportation hub; (2) develop a genetic algorithm (GA)-based two-stage heuristic to quickly obtain meta-optimal solutions of proposed model. At last, a test instance was given to best understand and apply the proposed models. This paper firstly proposed a service framework in which car owners and users could access the internet to define their preferred service time windows and locations, as well as receiving feedback from service providers, and then a mixed-integer linear program was formulated to handle a demand-responsive connector design problem with a time window constraint.
3. Methodology
3.1. Research Framework
This paper aimed at providing a special door-to-door shared-ride service, which assigns a set of shared cars to transport all customers from pick-up locations to the transportation hub [23,24]. Through cellphone platform, some car owners are willing to share their travel information, including origins/destinations and time windows, and many travel orders are also issued by passengers to gather their travel information for locations, number of people, and boarding time windows of demand points. This paper aimed at allocating these travel orders to shared cars to improve the service level by meeting the travel needs of both passengers and shared car owners. To increase the whole system efficiency, some demand points are selected as pick-up locations visited by shared cars, and other unvisited demand points are assigned to these selected ones. The proposed model is capable of seamlessly and simultaneously coordinating pedestrian guidance (from unvisited places to visited ones) and transit routing (from pick-up locations to the transportation hub). The key inputs of the model are travel information of passenger and car-sharer, involving number of passengers at demand points, boarding time windows, origins, destinations of shared cars, etc., obtained from a cellphone APP, as well as the traveling information matrix between these vehicular nodes obtained from Open Google or Baidu Map tool.
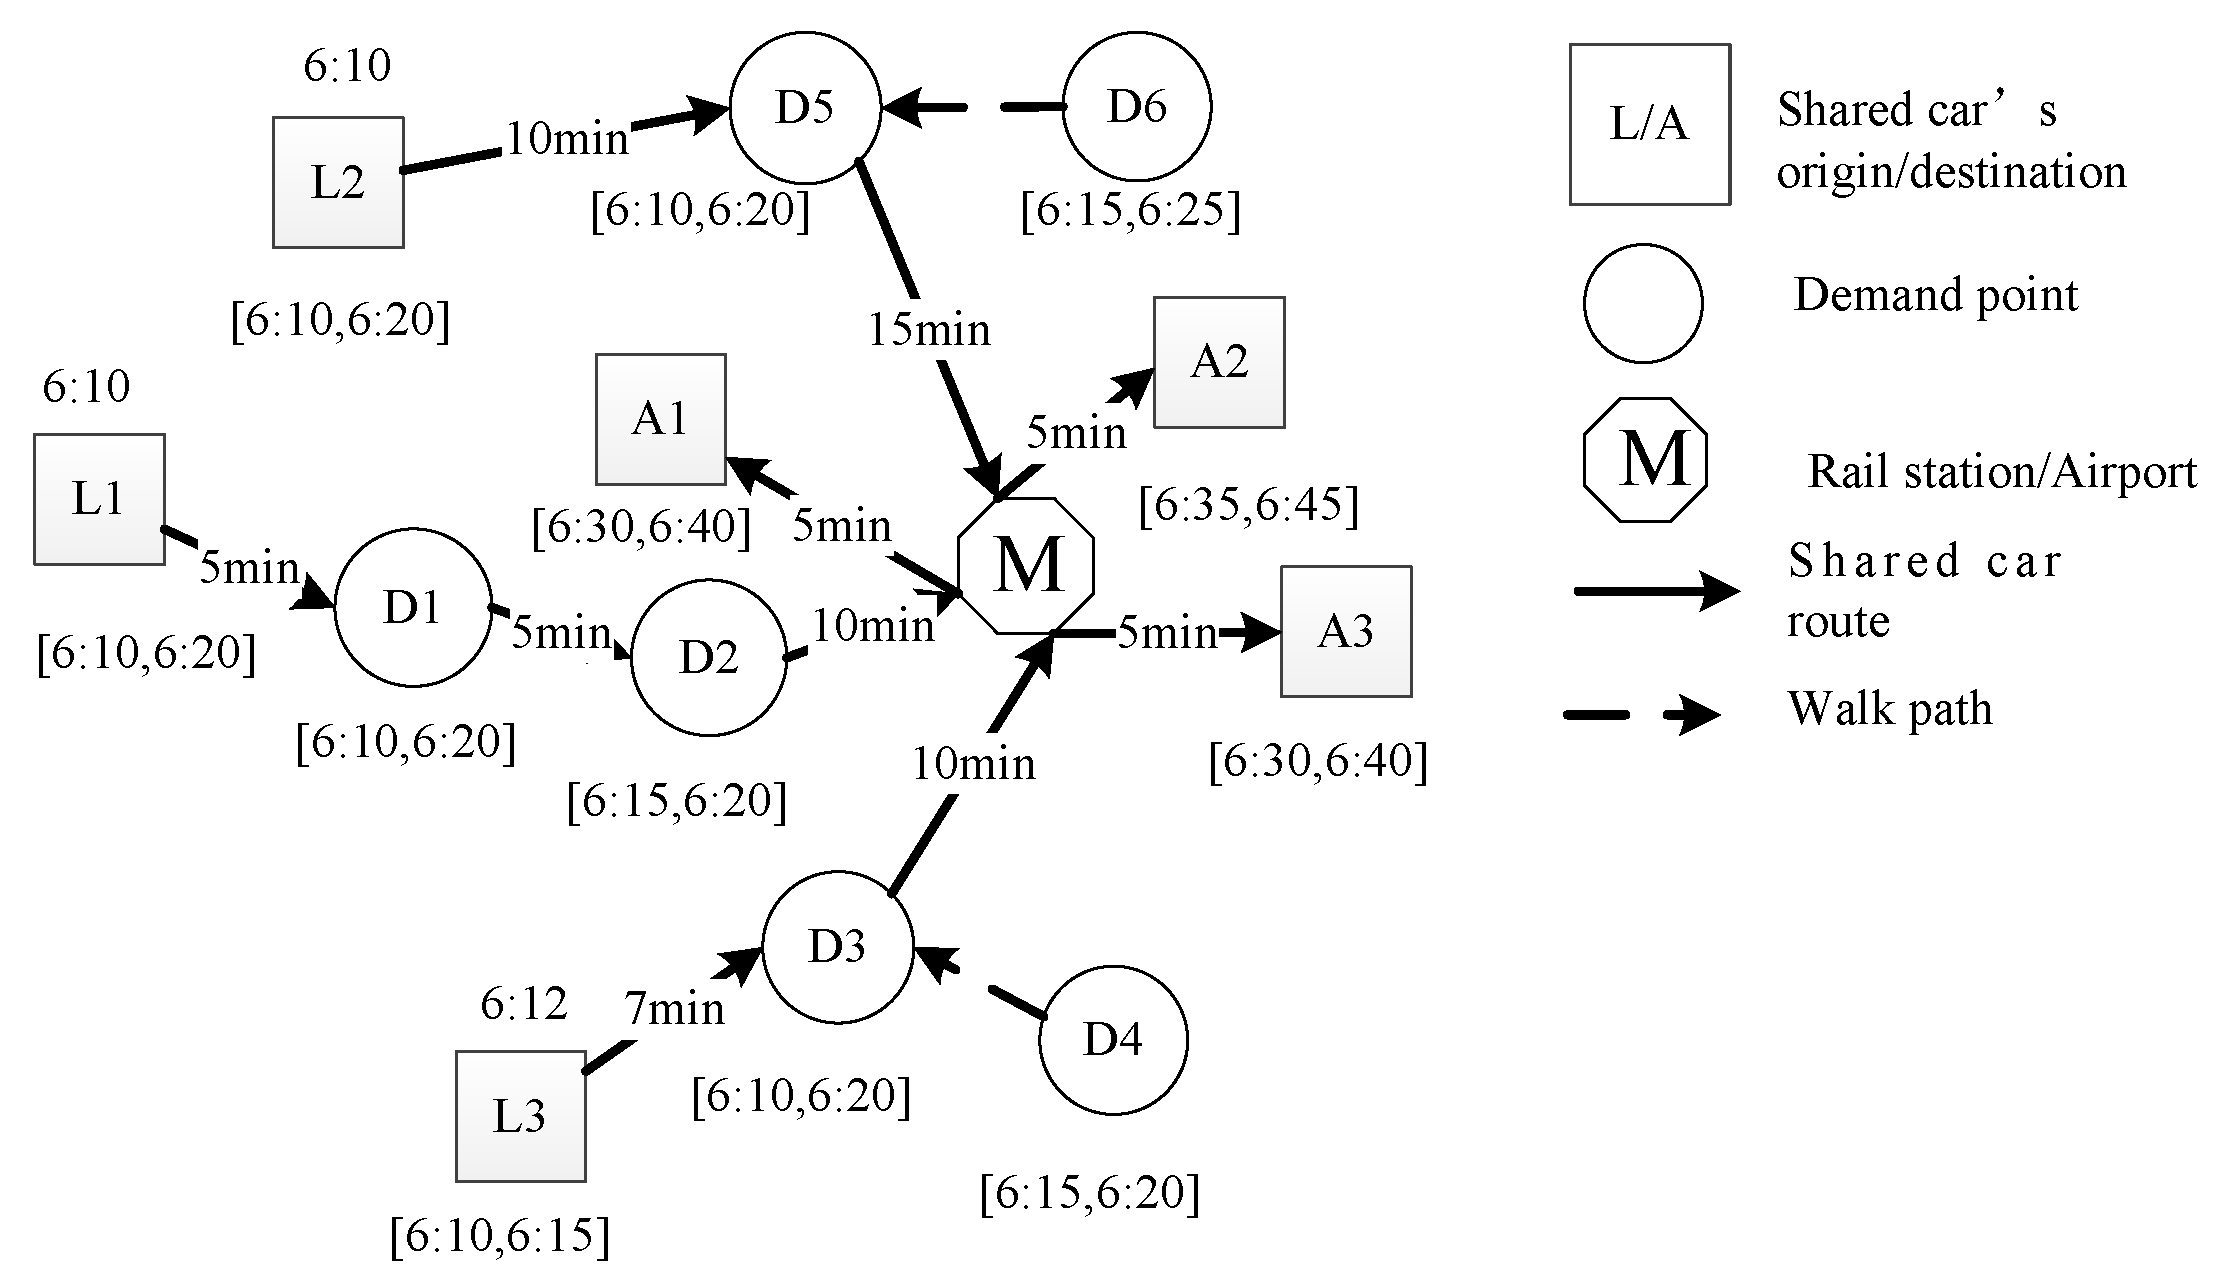
In Figure 1, a small example was used to further explain the detail in DRT model. The DRT route network consists of one rail station or airport (M), six demand points (Di, i = 1, 2…, 6), and three shared cars with their origin’s Li and destinations Ai (i = 1, 2, 3). The two numbers in brackets below each demand point denote preferred boarding time windows. The two numbers in brackets below origins Li and destinations Ai (i = 1, 2, 3) of shared cars denote departure and arrival time windows. There are three DRT routes obtained in the optimization process. Route 1 is denoted as a connecting line [L1-D1–D2–M-A1], Route 2 by [L2-D5(D6)-M-A2], and Route 3 by [L3-D3(D4)-M-A3]. D4 and D6 are not directly visited by shared cars, D3 is visited by the first car, and D5 is visited by the second car. The main objective was to minimize weighted total walking and riding time for all customers. To ensure that this methodology fits into real-world case quite well, this paper was based on the following assumptions:
- (1)
- Each shared car visits one demand point, at least.
- (2)
- A demand point must be visited once by one shared car, as a pick-up location, or a non-boarding location by walking to another place.
- (3)
- A ticket discount policy lets customers in unvisited demand points be willing to walk a certain distance to a pick-up location.
- (4)
- The influence of uncertainty in the traffic network on the scheduling scheme based on node-failure is not considered.
3.2. Model Formulation
Notation
To facilitate the presentation and analysis of the DRT model, all definitions and notations used throughout this work are described in Table 1.
Formulation
A mixed-integer program (MIP) model was proposed as follows.
s.t.:
Objective (1) was to minimize the total travel time, i.e., the sum of passenger walking and riding time. Constraint (2) indicates that if an unvisited demand point is assigned to another one, this demand point must be visited by the car. Constraint (3) indicates that an unvisited demand points must only be assigned to a visited demand point, and a visited demand point must not be assigned to another one. Constraint (4) ensures that the walking distance of passengers at an unvisited demand point does not exceed a certain threshold. Constraint (5) ensures that each car has visited at least one demand point. Constraint (6) specifies the shared car route links may exist between two visited demand points only if both of them are selected as pick-up locations. Constraint (7) guarantees each vehicular node (except origins and destinations of shared cars) being served to have only one incoming and outgoing cars. Constraint (8) is sub-tour elimination in the shared car routing (Miller, 1995). Constraints (9) and (10) represent the relation in arriving time between two adjacent demand points visited by the same shared car. Constraints (11) and (12) reveal the link in load changes between two adjacent demand points visited by the same shared car. Constraint (13) indicates that the number of passengers covered by a shared car does not exceed its maximum capacity. Constraint (14) indicates that the total mileage of the shared car is within a certain range. Constraint (15) indicates that the total travel time of the shared car is not higher than its upper limit. Constraints (16)–(19) indicate that the shared car starts from their origins and reaches their destinations. Constraints (20) and (21) limit the start and arrival time windows of shared cars.
As mentioned above, the proposed model, as an extension of VRP, is also a non-deterministic polynomial-time hard (NP-hard). Some exact heuristic approaches in some powerful solvers, such as IBM ILOG CPLEX, can’t resolve small-scale problems efficiently. Hence, a GA-based two-stage heuristic algorithm was further designed to find a good solution in a reasonable amount of running time.
4. A GA-Based Two-Stage Heuristic Algorithm
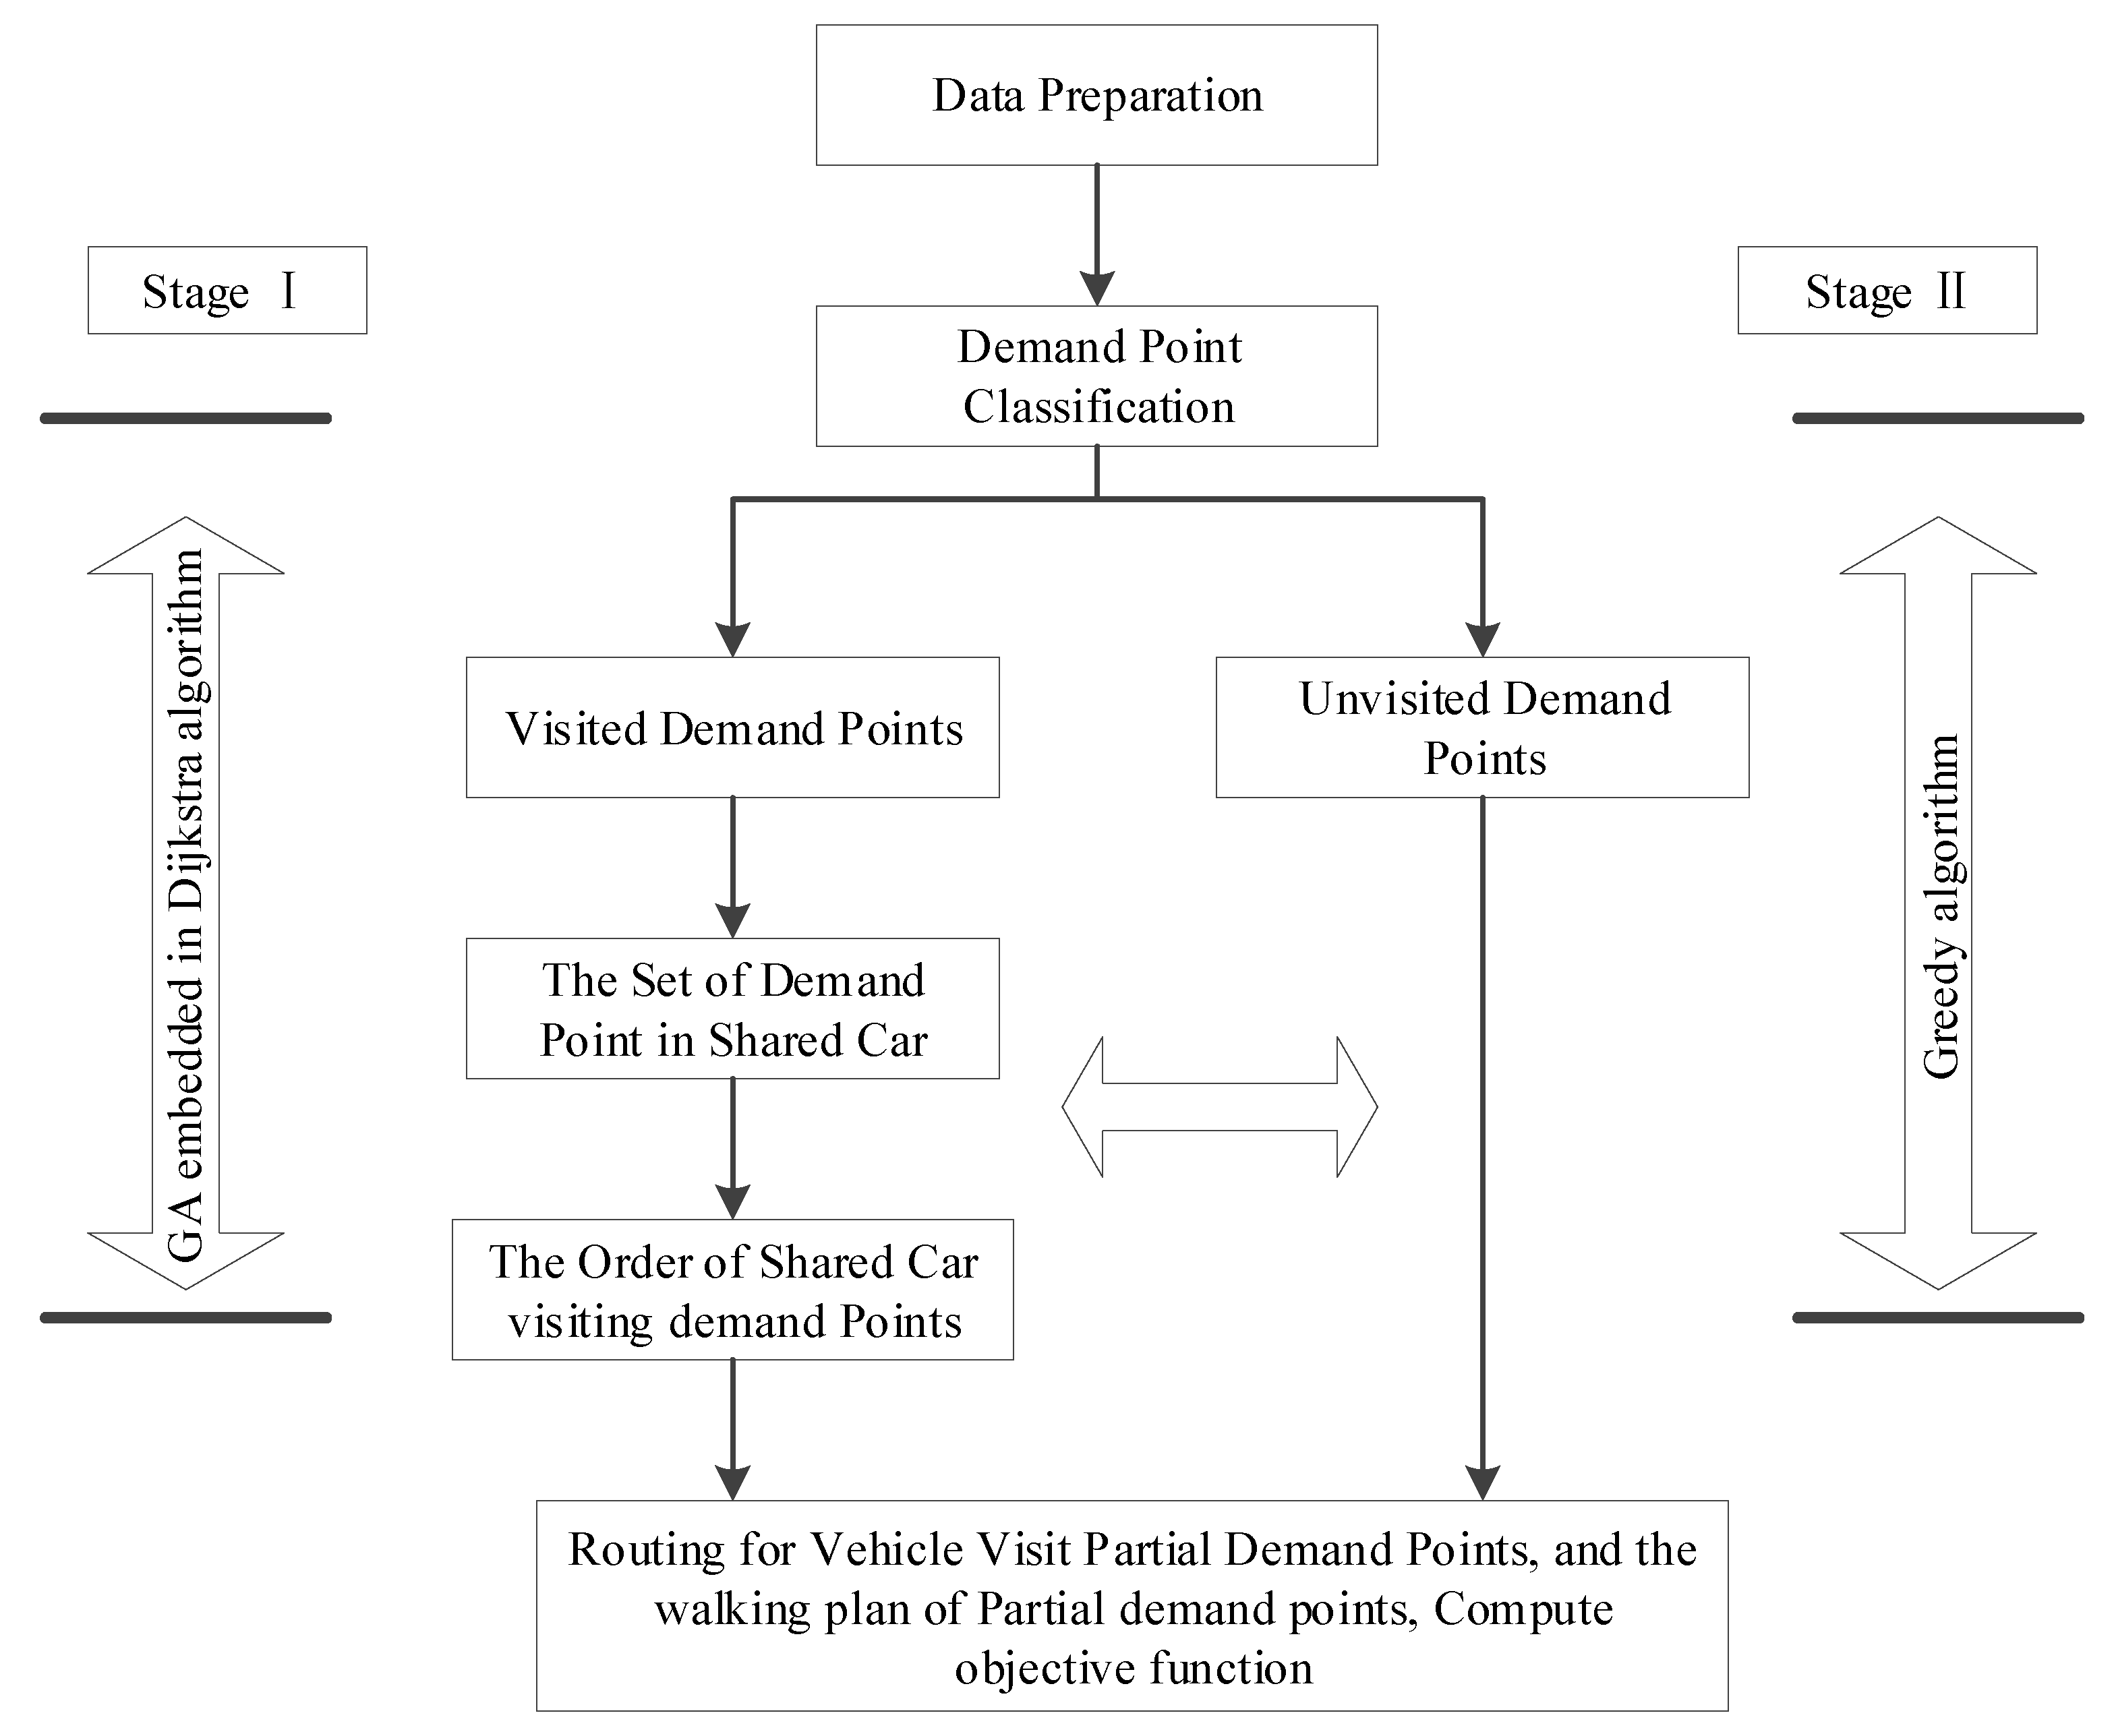
In the proposed DRT model, all demand points can be divided into selected and unselected ones, where selected demand points are visited by shared cars, and each unselected demand point is assigned to selected one based on the greed principle (passengers in unvisited demand points need to walk to this pick-up location to get on the bus). When the set of selected demand points visited by each shared car is determined, the order of the vehicle visiting these pick-up locations is obtained using the shortest path principle. Hence, a GA-based two-stage heuristic algorithm was designed to solve the problem [7,21,23,24,25]. The solution framework of the algorithm is shown in Figure 2. In the first stage, GA is used to determine selected demand points allocated to vehicles. By embedding the Dijkstra algorithm in GA, the order of the selected pick-up places visited by each vehicle access is determined, so as to pursue the shortest travel time of passengers. In the second stage, the unvisited demand points are allocated to their pick-up locations with the shortest walking distance based on the greed principle.
4.1. Coding of GA Chromosomes
The chromosome structure is the core of the GA searching solution. The main body of the DRT model is composed of selecting pick-up locations, matching unvisited demand points with pick-up locations, and designing routing plans that are corresponding to , , and , respectively. Therefore, a vector of GA chromosomes was designed to code and decode solutions of this model, in which:
- (1)
- The first part of GA chromosomes would be used to denote the decision of part of demand points selected as pick-up locations. If , then the corresponding demand point j is targeted as a feeder bus stop.
- (2)
- The second part of GA chromosomes would be used to denote the decision for assigning the selected demand points to different vehicles. Thus, each ranges from 1 to k, where represents the number of shared cars.
For example, a feasible solution for two vehicles and eight demand points (D1–D8) is (1 1 0 1 1 1 0 1 1 1 1 1 2 2 2 2), in which D1, D2, D4, D5, D7, D8 are selected as pick-up locations, and vehicle 1 and 2 visit the first set of D1, D2, D4 and the second set of D5, D7, D8 separately. A complete scheduling scheme can be obtained by matching the sequence of pick-up locations for a shared car and assignment of unvisited demand points to pick-up locations for using the following two-stage algorithm.
Stage I: Assignment of Pick-Up Locations to Shared Car Routes
By decoding the chromosomes, some demand points are selected as pick-up locations and assigned to shared car routes, i.e., . The Dijkstra algorithm is implemented to search the shortest route dispatching from the origin of a shared car to the transportation hub so as to order the sequence of pick-up locations for a shared car, i.e., (see Table 2).
Stage II: Pick-Up Location Selection for Unvisited Demand Points
Stage I has linked a sequence of pick-up locations along with designed shared car routes. Stage II aims to select the most appropriate pick-up location for each unvisited demand point based on the principle of minimization of walking distance, which has been declared within the objective function of , i.e., .
4.2. Fitness Evaluation
When calculating the fitness of an individual with violated constraints (13)–(15), (20), and (21), a penalty function is applied to reduce the fitness of the individual and reduce the probability of the individual being passed on to the next generation. Thus, the modified fitness function is defined as:
4.3. A Heuristic for Generating Initial Population
Because of the complexity of the problem, the randomly generated solutions maybe not necessarily feasible solutions. As it has been widely recognized, the quality of solutions in the initial population determines computational efficiency by applying the GA-based algorithm.
Thus, a heuristic algorithm, embed into the GA process, is designed to obtain some feasible solution in the initial population. The detail is described as in Algorithm 1.
| Algorithm 1 Heuristic algorithm to obtain some feasible solution in the initial population |
| Step 1: Input parameters of the proposed model, namely, I (a set of demand points), M (the transportation hub), and K (a set of shared cars). Step 2: For each shared car , determine its assignment of demand points and a sequence of pick-up locations along with the designed route. Step 3: Repeat removing a node (unvisited demand point) from the route of the shared car until no violation of the constraints (14), (15), (19), and (20). Step 4: Assign unvisited demand point to the shared car , and select the most appropriate pick-up location for it, considering the capacity constraints and minimum walking distance. Step 5: Use the obtained decision of , , and from Step 1 to 4 to generate initial population U. |
4.4. Genetic Operators
Selection
The selection operation is a genetic operation used to determine how individuals from a parent population are selected in a certain way to be passed on to the next generation. It is used to determine recombination or crossover individuals and how many offspring individuals will be produced by the selected individuals. The random league and the crowding out strategies are used in this paper.
Crossover and Mutation
Obviously, genetic crossover and mutation operator do not destroy the coding structure of the solution. Using the uniform crossover strategy, the genes on each locus of two paired individuals are exchanged with the same crossover probability, thus forming two new individuals. Similarly, the uniform mutation strategy is adopted to replace the original gene values on each locus in the individual coding string with random numbers that are uniformly distributed within a certain range and with a certain small probability.
4.5. Stopping Criteria
The algorithm stops to search a better solution until the stop condition is met, i.e., a pre-set maximal number or population diversity.
5. Numerical Example
5.1. Example Description and Data Preparation
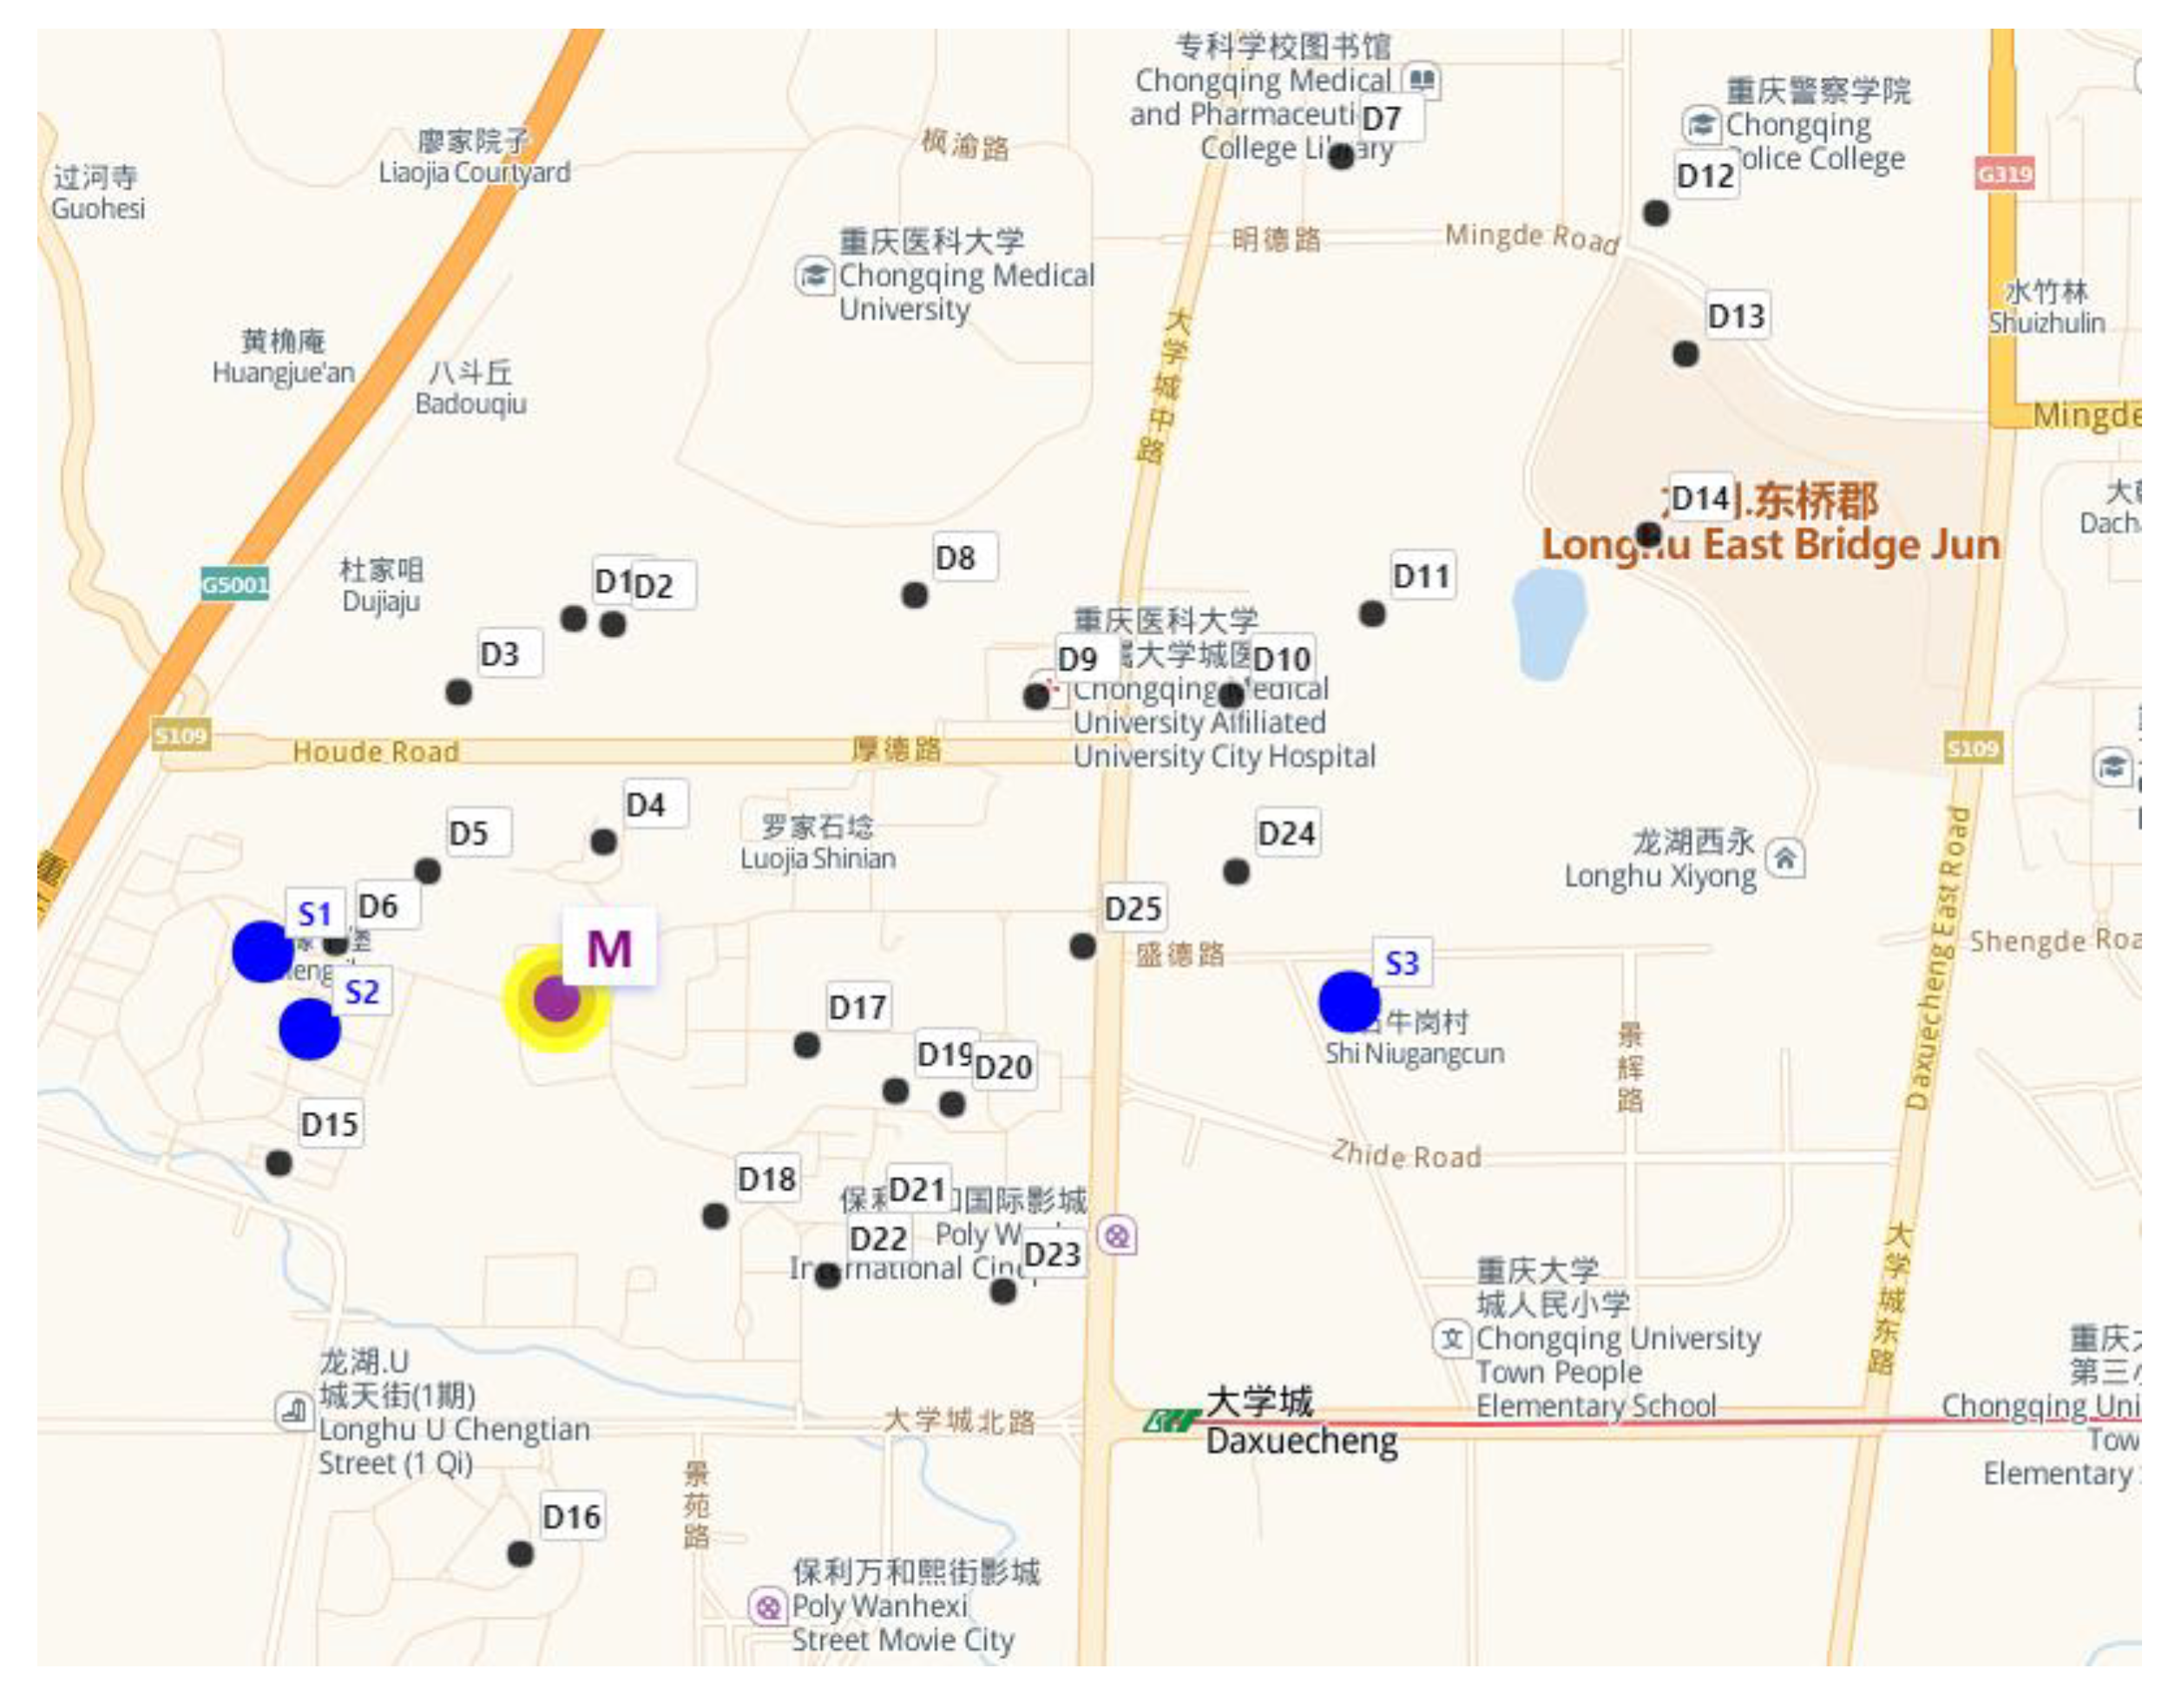
In this case study, there are twenty-five demand points (D1–D25), and three shared cars with their three origin or destination locations (S1–S3). The number of passengers and their time windows in demand points are shown in Table 3. Moreover, the origin and destination locations of these shared cars and their service time windows are shown in Table 4. Figure 3 is used to map the spatial distribution of origin/destination locations, demand points, the transportation hub (a rail station near the airport) in Google GIS. The key input of the model and the algorithm used in this paper are described as follows:
- Maximum capacity of the shared car: = 10 per;
- Minimum length of the shared car: = 4 KM;
- Maximum length of the shared car: = 15 KM;
- Maximum travel time of the shared car: = 30 MIN;
- Maximum walking distance: = 1000 m;
- Walking speed: = 110 m/min;
- The parameters of the hybrid algorithm: iteration times 100, chromosome number 500, crossover rate 0.7, the mutation rate of 0.1.
5.2. Results
As explained before, the proposed model could solve two dimensions, including pedestrian guidance and transit routing. Table 5 lists all visited demand points with the assignment of unvisited ones to them, which included numbers of people on the assigned vehicle and walking distance for each visited demand point. Taking demand point D1visited by the vehicle R1 as an example, passengers at unvisited demand point D3 got on at this selected pick-up location by walking 303.9 m. Due to one person waiting for the bus at D1 and D3, two people were getting on the bus. Table 6 also summarizes the number of passengers covered by the shared car.
Table 6 shows the DRT routes of three shared cars. Each of them had a total mileage of 13.4 km, 9.4 km, and 9.9 km, as well as total travel time of 26.5 min, 19.7 min, and 24.5 min, respectively. Taking R1 as an example, an empty car would depart from the original location of S1, and this car first visited D1 to pick up two passengers. After this, this car visited D2, D18, and D5 to pick up two passengers, two passengers, and one passenger, respectively, and arrived at the rail station M to deliver nine passengers. Finally, the car reached its destination of S3.
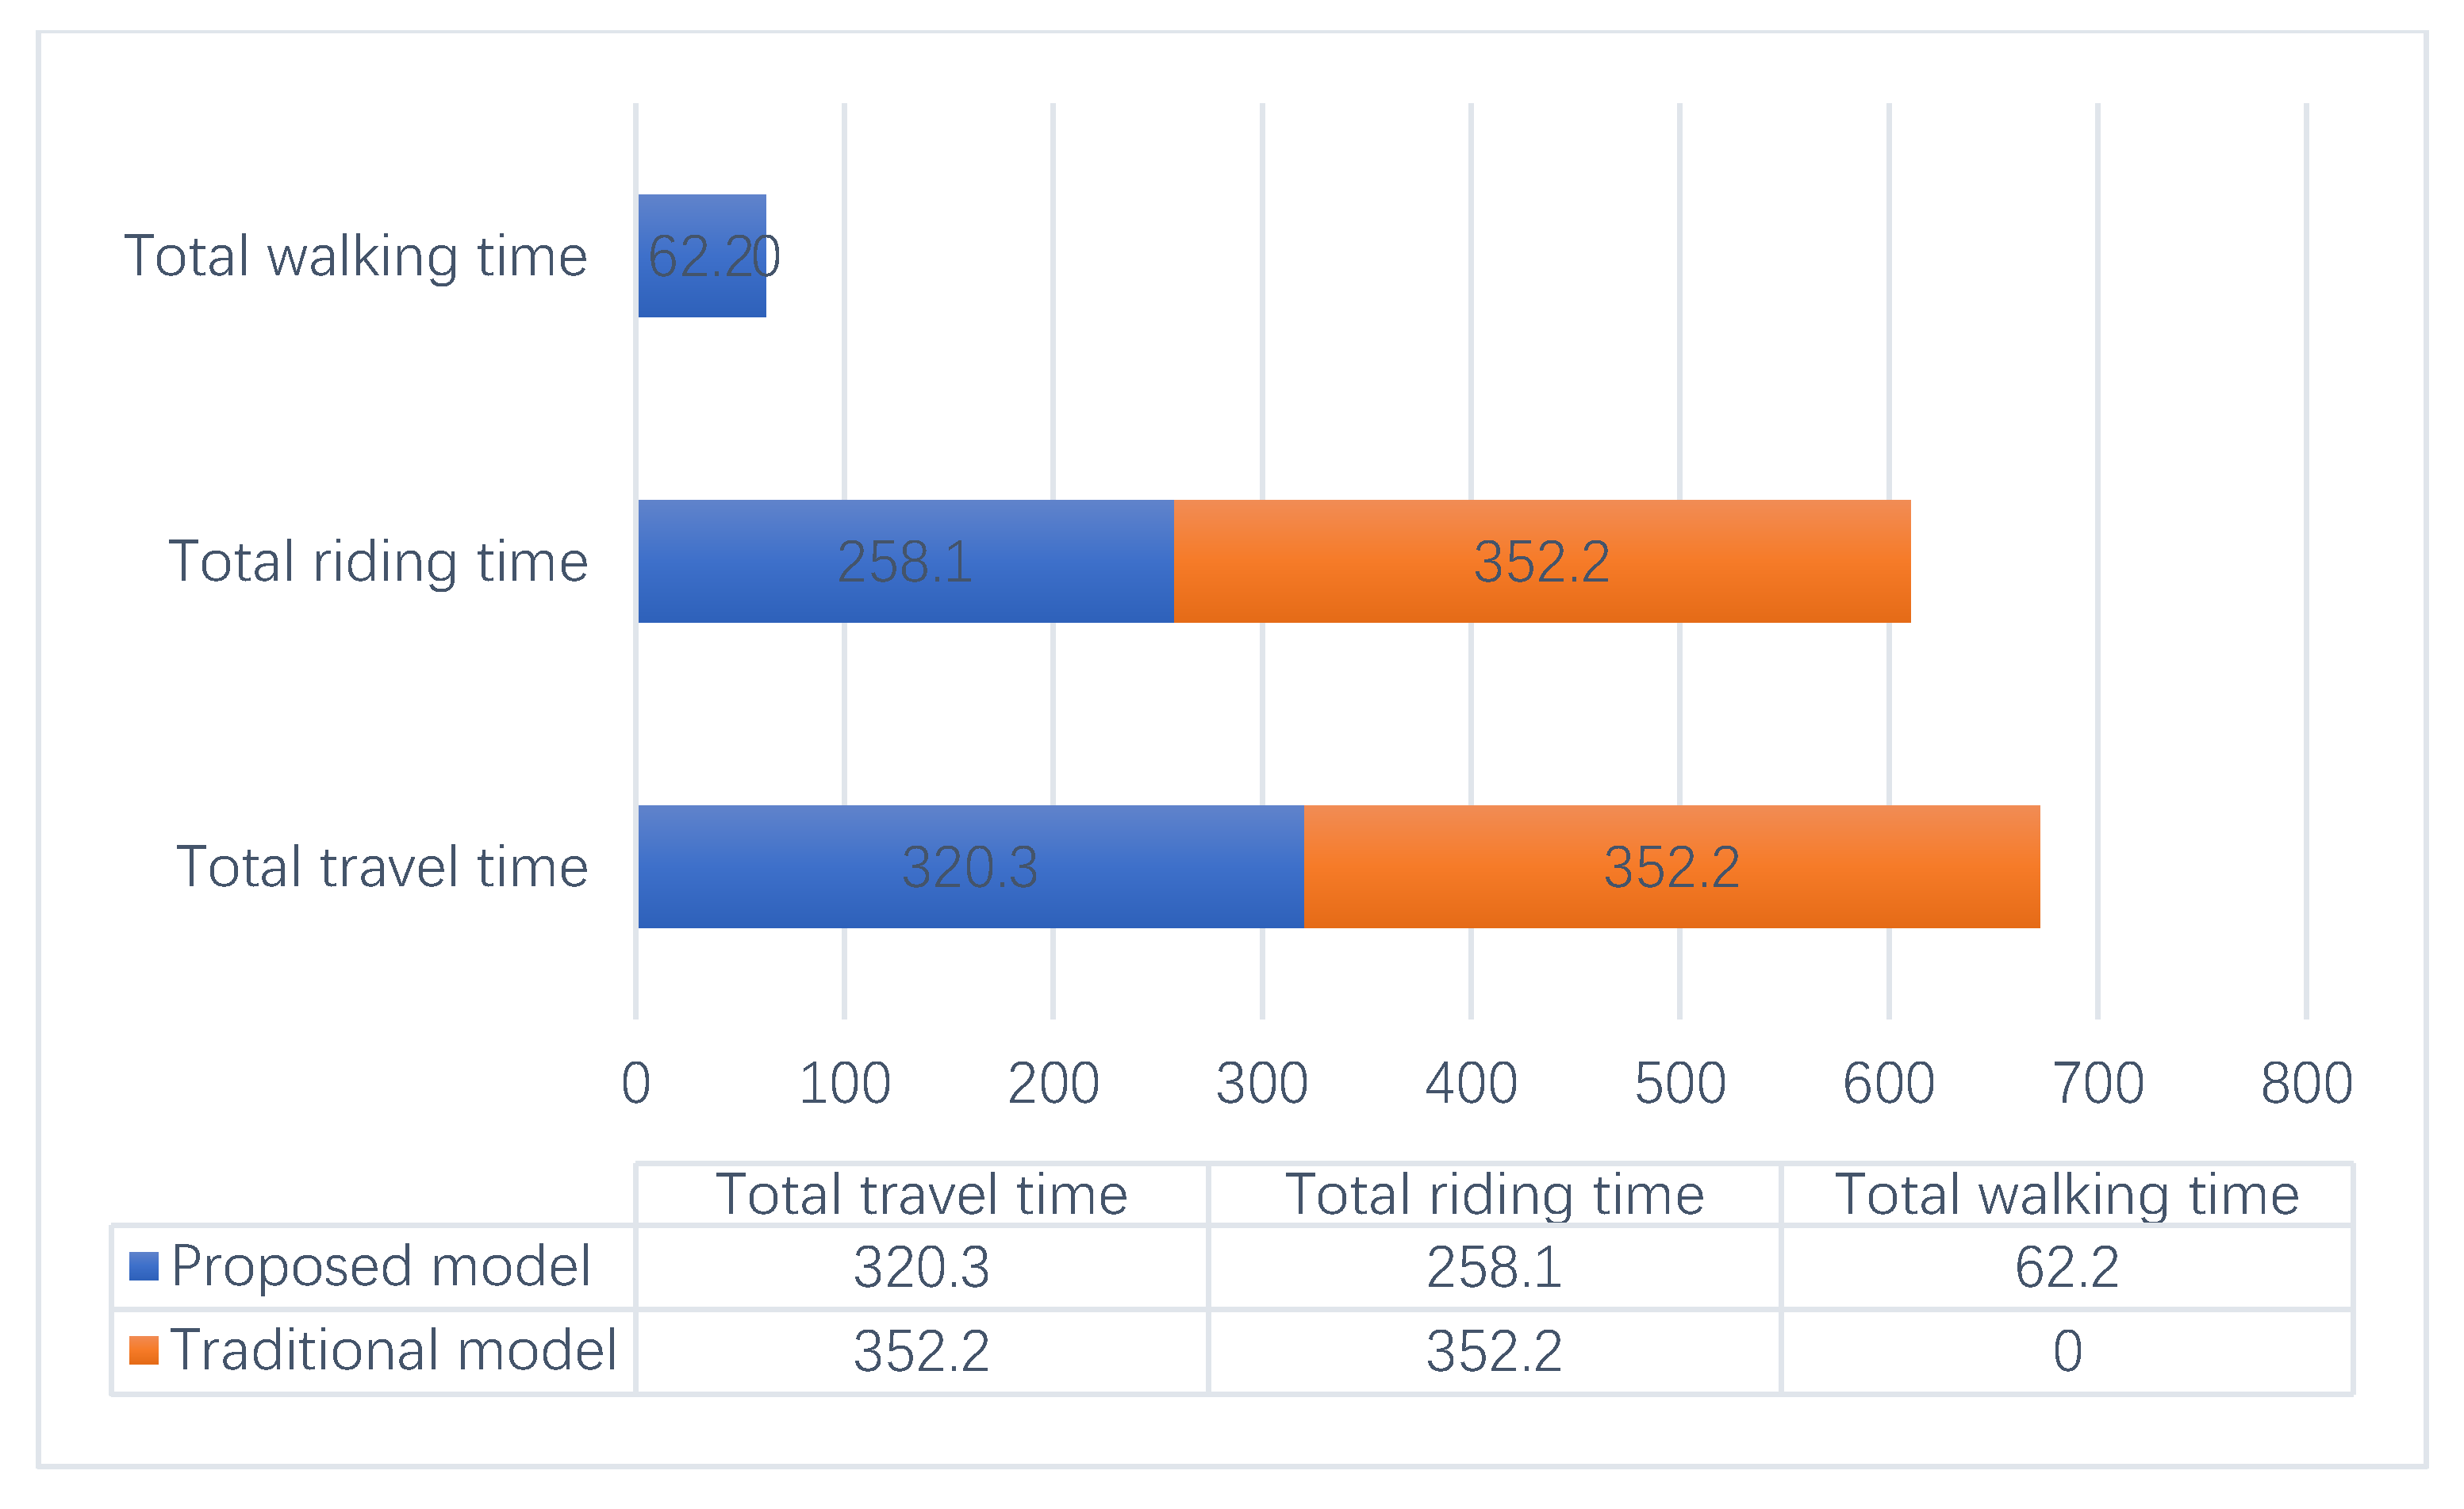
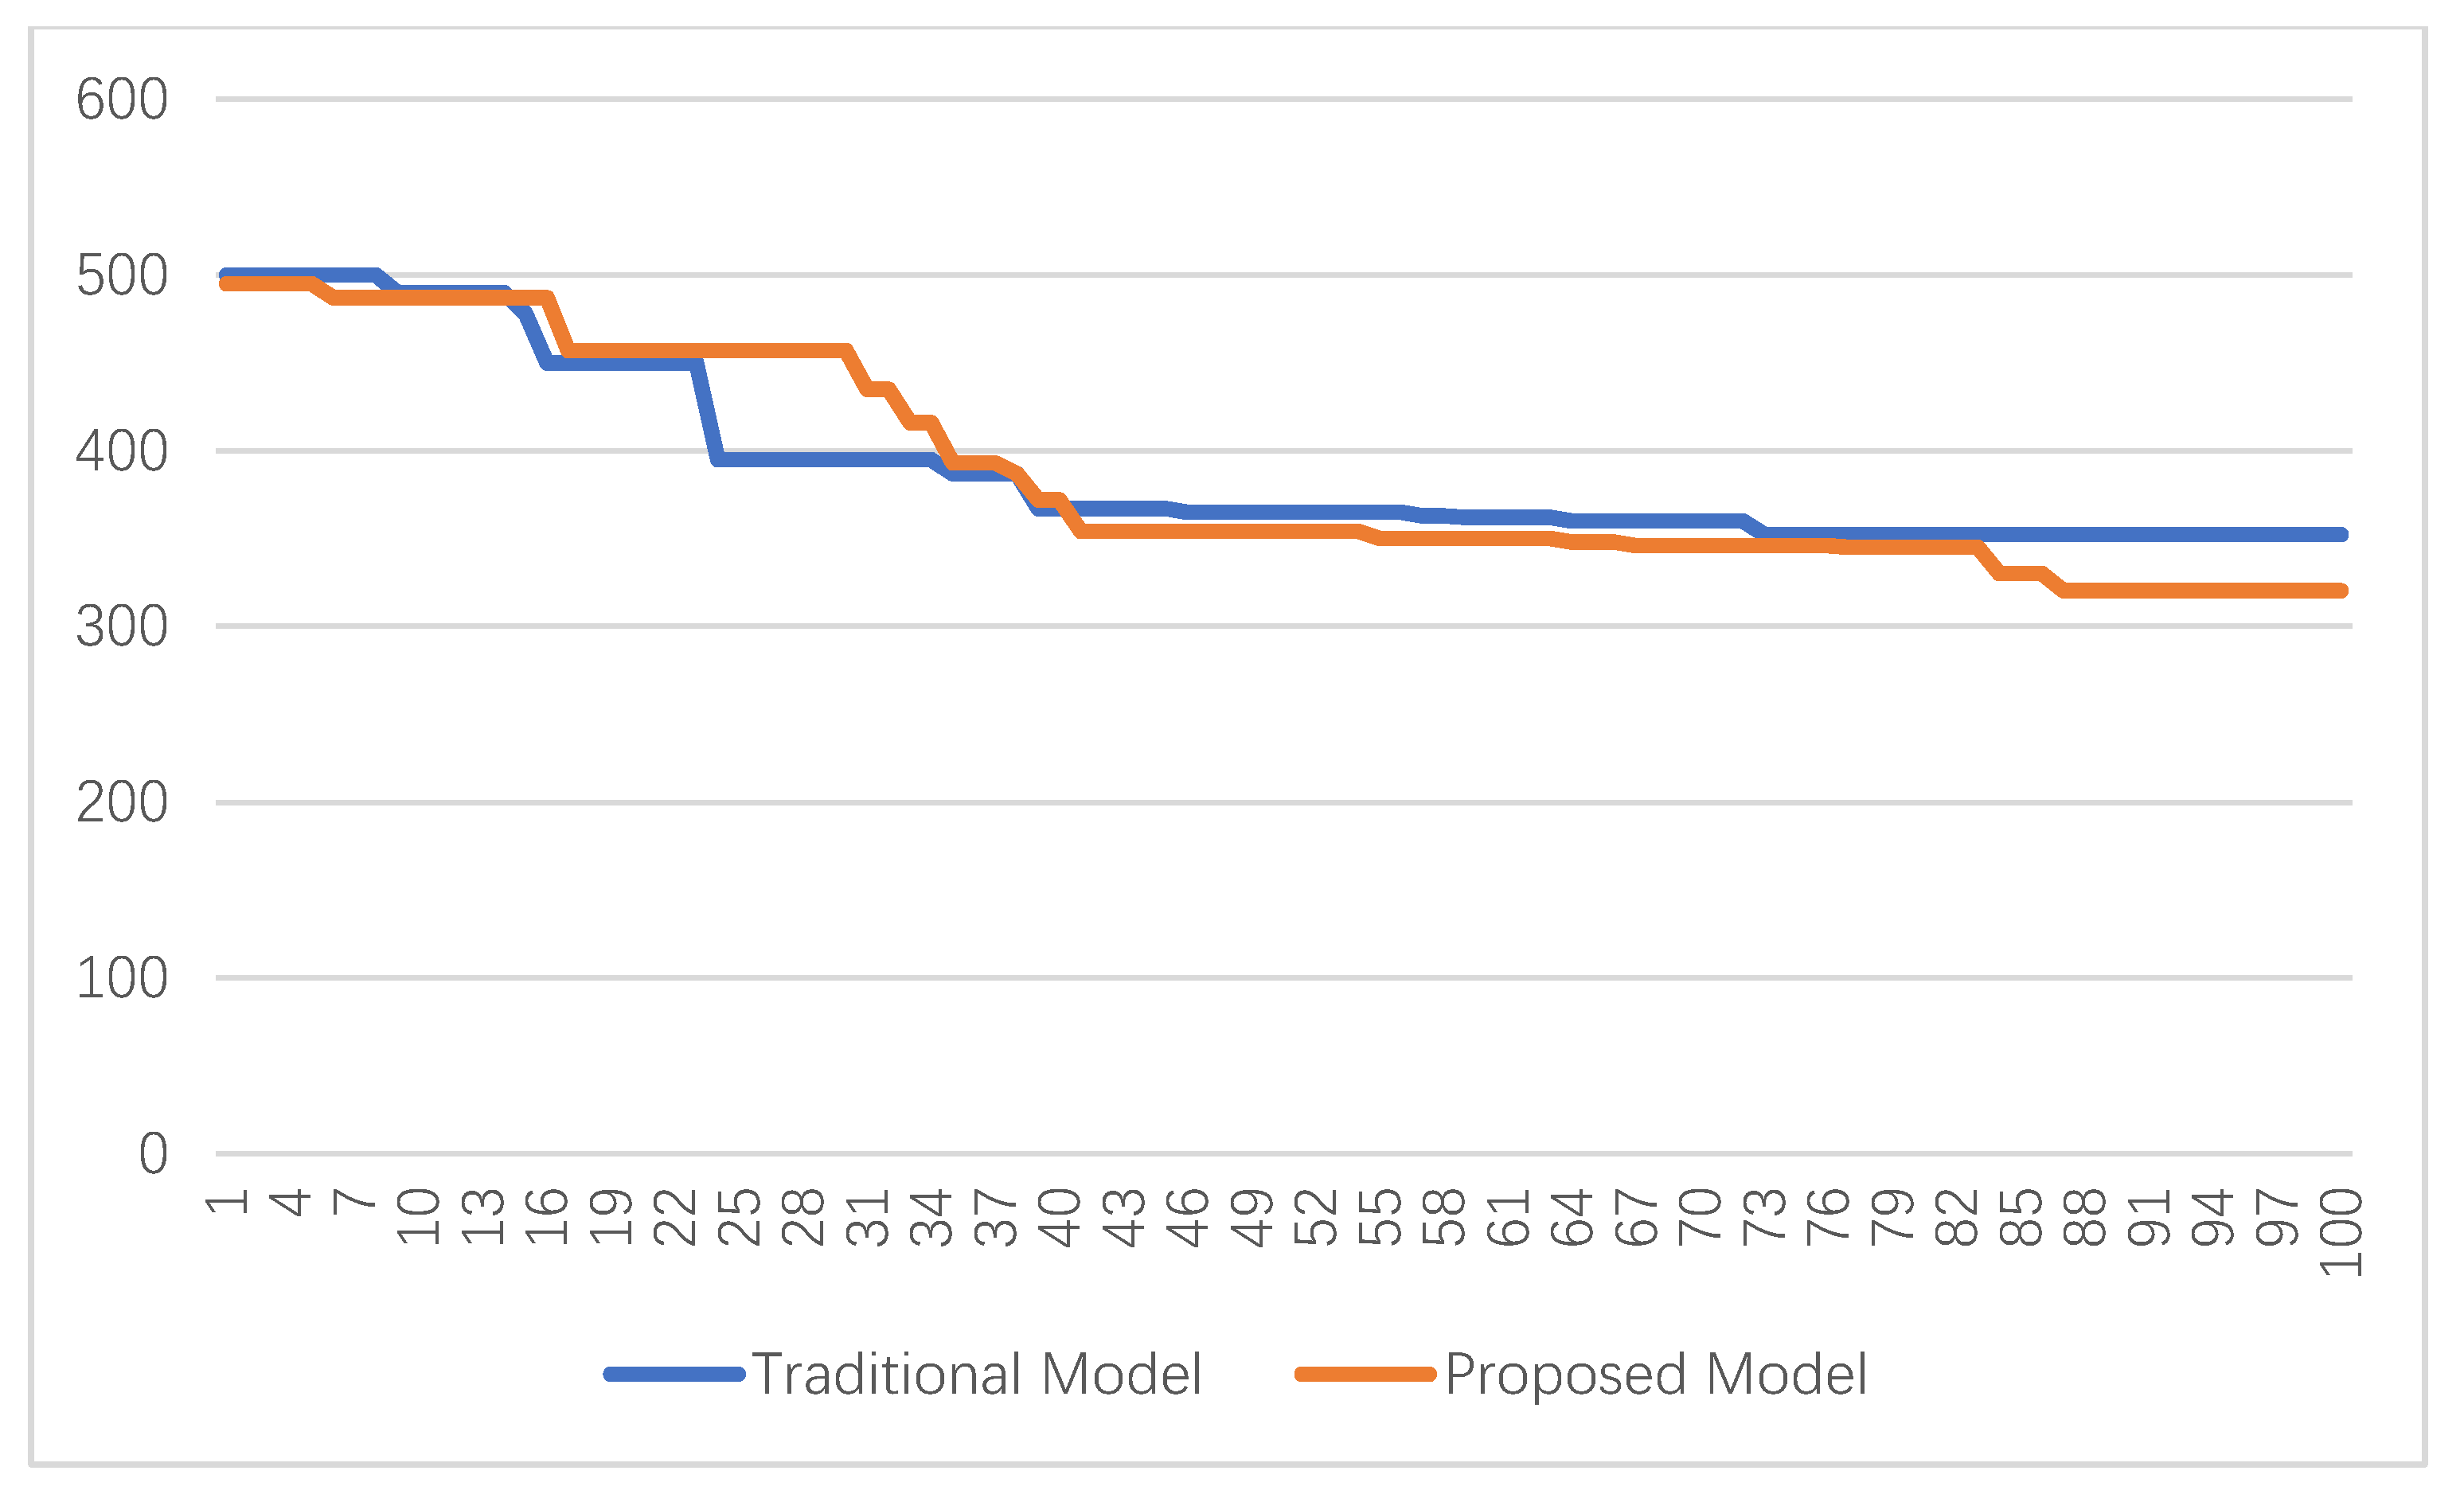
Furthermore, the proposed model had its unique features compared with the traditional DRTs without integration operation of pedestrian guidance. Figure 4 shows that total ride time for all passengers of the proposed model would be reduced by 94.1 min, while the total walking time for all passengers of the proposed model would be increased by 62.2 min, compared with the traditional DRTs. However, the total travel time of this model was less than 31.9 min of the traditional model, which proved that the proposed model was superior to the traditional model. Figure 5 also gives iterative convergence curve to compare solution solving speed of traditional and proposed model using GA. Since the traditional model with no integrated location selection problem is relatively simple than the proposed model, the convergence speed of the former was faster than that of the latter.
5.3. Sensitivity Analysis
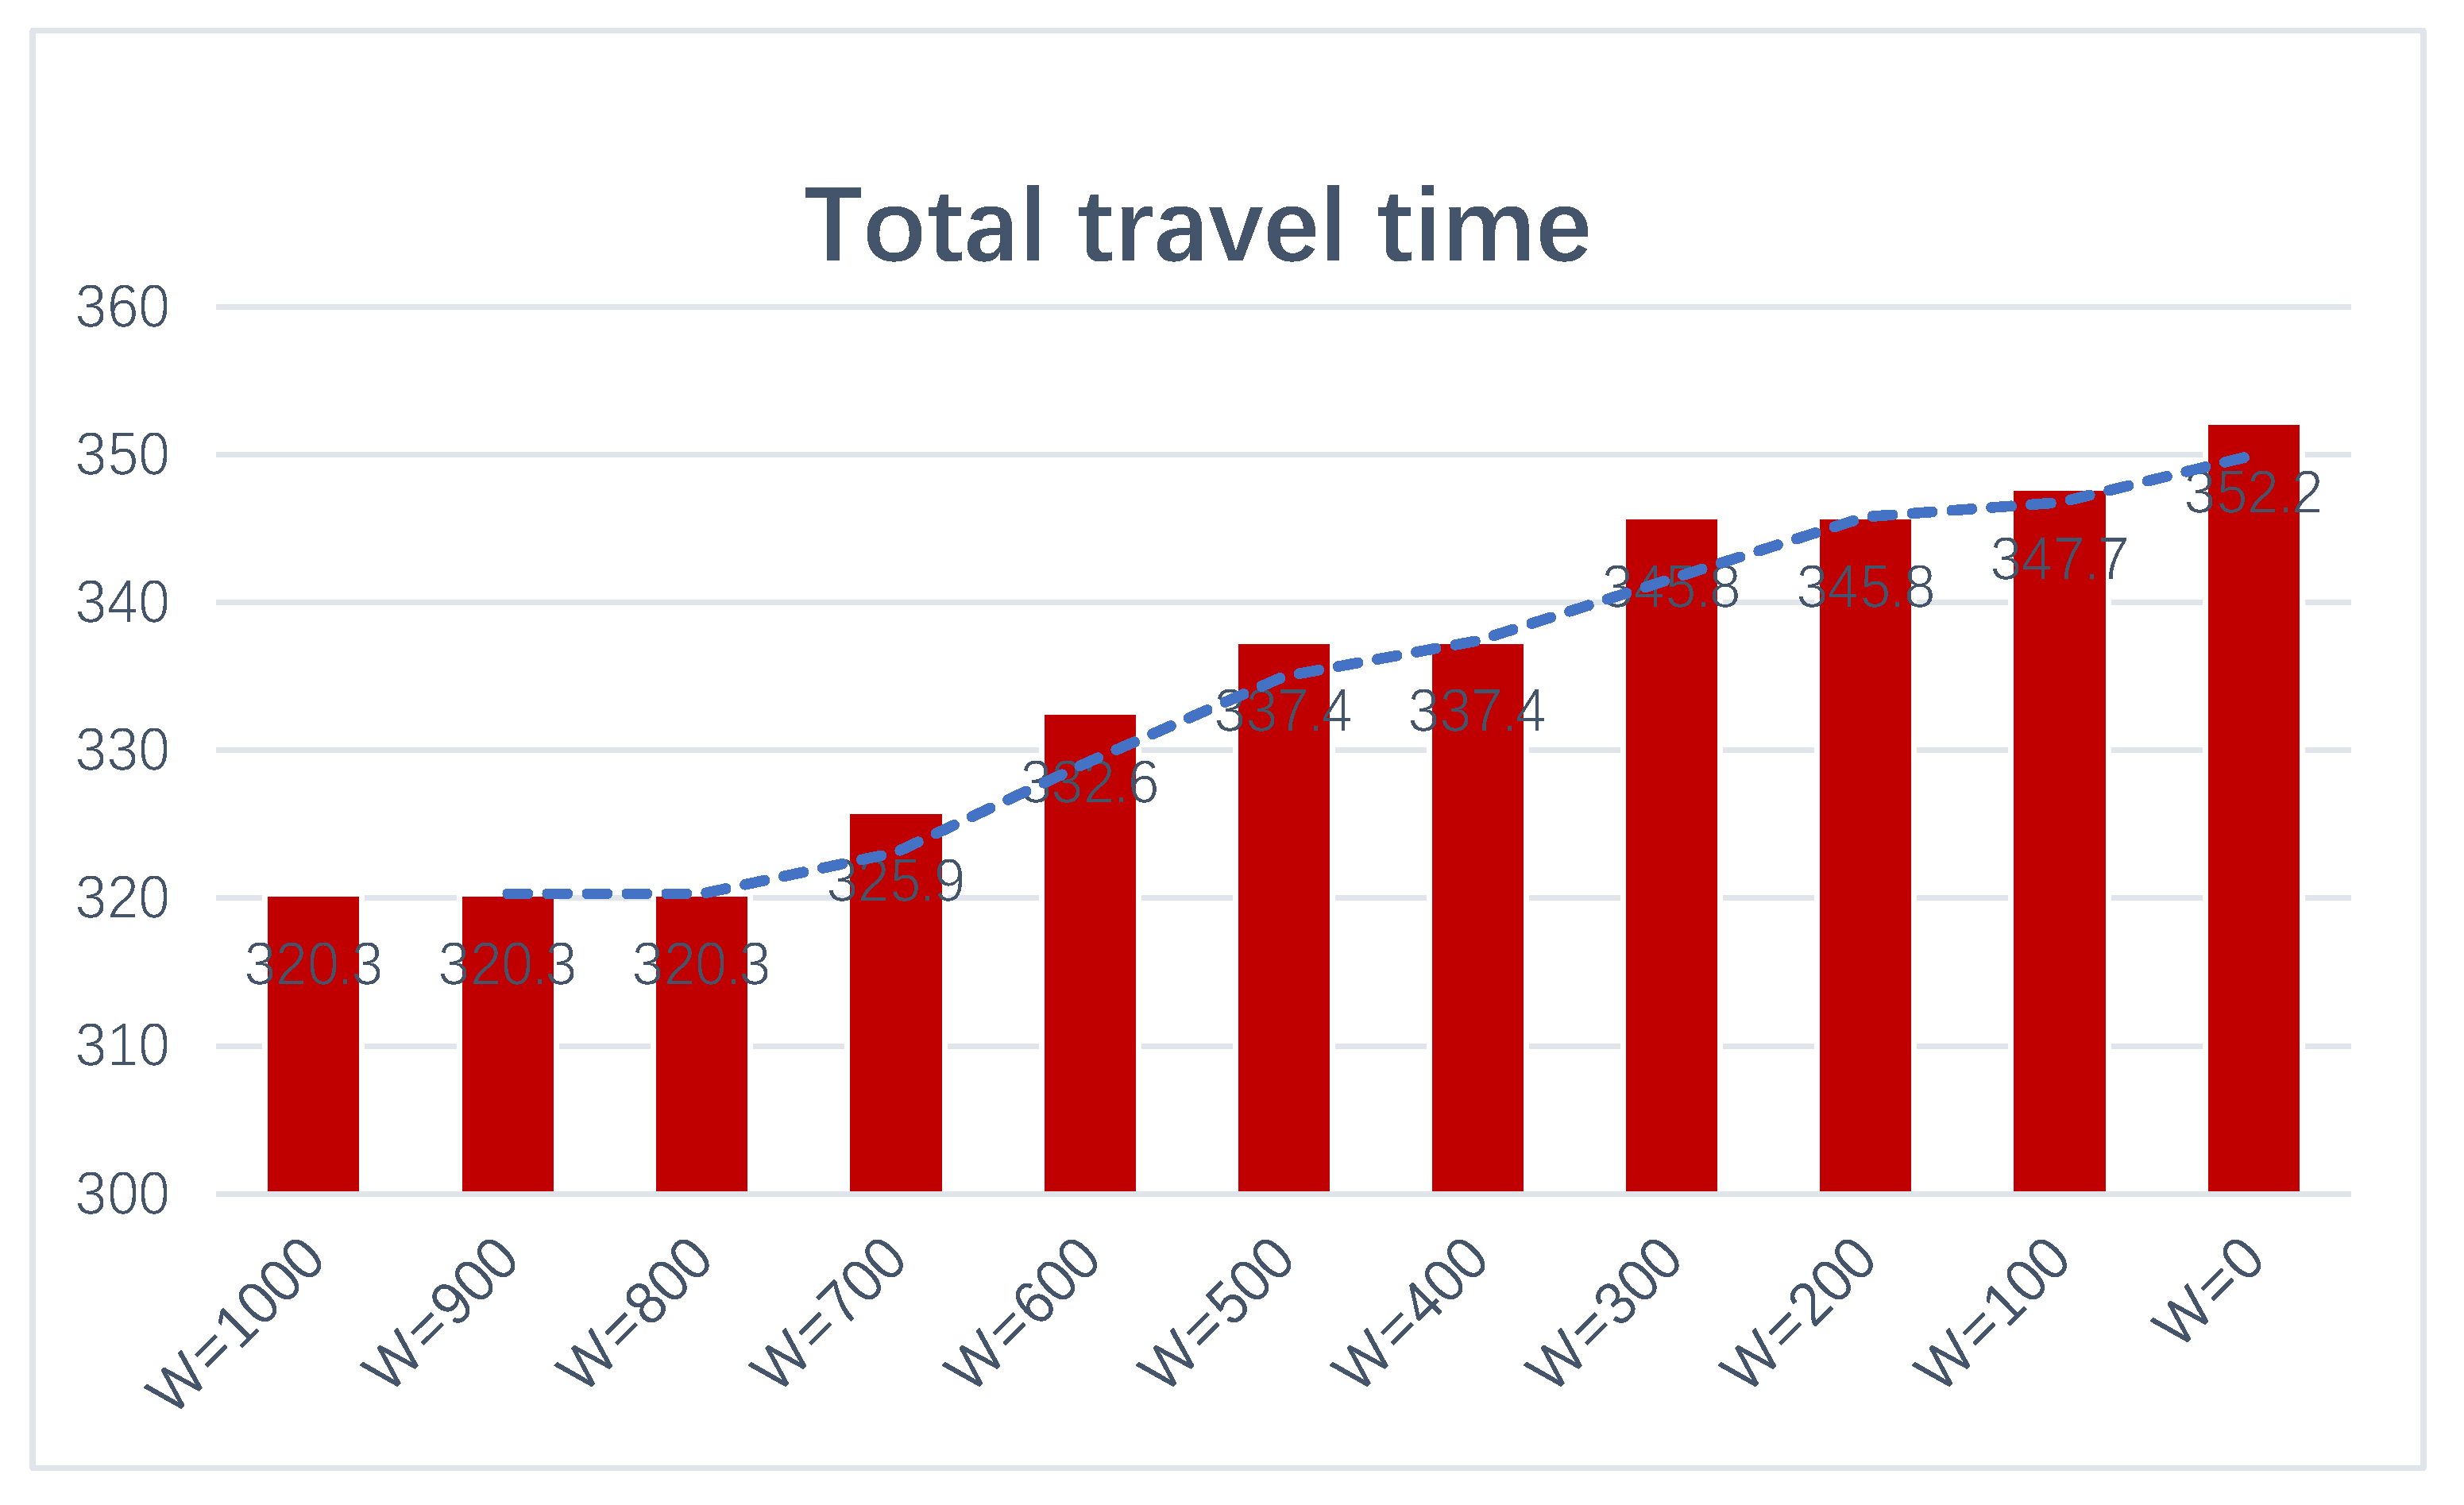
Figure 6 further analyzes how the changes in maximum walking distance affect a trade-off between total walking and riding time. When = 0, it becomes an equivalent traditional model. As gradually increases, total ride time would be reduced, and the total walking time would be increased. However, both of them remain the same, if the value of does not reach the changed point, except for = 100, 200, 400, 600, 700. Due to the increase in total walking time being less than the decrease in total ride time, total travel time tends to keep going down, as gets bigger.
Table 7 also compares the difference in model performance under a different number of shared cars. With the increase in the number of shared cars, the increase in the number of visited demand points leads to a decrease in the number of unvisited demand points, which leads to the gradual decrease of the total walking time. Further, a proper increase in the number of routes can provide direct services for passengers, which leads to a decrease in the total travel time of passengers. However, more routes lead to an increase in visited demand points, which leads to poor direct performance of passengers. As a result, the total passenger time of the routes will increase, and the calculation results are in line with the intuitive analysis. Besides, the deviation between the solution result of this algorithm and Cplex is within 7%, but the calculation time is greatly reduced, which also shows that this algorithm is effective and feasible in terms of solution time and solution quality.
Furthermore, the solutions of the proposed algorithm and Cplex were evaluated by many computational experiments on larger-scale, randomly generated instances at every test scenario. Comparison of the results are given in Table 8, from which we can see:
- (1)
- Although Cplex can always obtain the optimal solution, a greater the number of demand points, the more time to solve the problem, which is more than 1 h.
- (2)
- The improved algorithm can only find an approximate solution in a short time, which is less than 10 min. As the number of demand points gets bigger, the quality of the solution gets worse, in which the deviation between the best solution, the average solution, and the optimal solution will be larger and larger.
Remark
The two numbers on either side of the slash represent the best, average, and worst values and their increments relative to the optimal solution.
6. Conclusions
This study proposed a new optimization framework DRT based on shared cars. Being different from the previous literature, the main contribution of this paper lied in: (1) offered an integration of pedestrian guidance (from unvisited demand points to visited ones) and DRT routing (from visited demand points to the transportation hub) to significantly improve the performance of the feeder bus system and (2) developed a two-stage heuristic algorithm-based GA in which a heuristic algorithm of generating the initial population was further proposed and embedded. An example was also further used to explain the feasibility and applicability of the proposed framework. Results showed that the model could be used as an effective tool for transit authorities not only for selecting optimal visited demand points with the assignment of unvisited ones to them but also for determining the best DRT route plan on a real-world road network. Further, validation and analysis were also carried out to assess the effect of maximum walking distance and the number of shared cars on the solution performance, as well as a comparison in the quality of the heuristic and optimal solution to validate the performance of the developed algorithm.
Note that this study assumed that travel time stays the same, and neglected the time-varying speed at a different time of the day. In the real traffic environment, traffic congestion often occurs, resulting in an uncertainty in the travel time. In this sense, further research work in extending the model with uncertain travel time may be worthwhile.
Author Contributions
Conceptualization, B.S. and M.W.; Methodology, B.S.; Writing—original draft preparation, M.W.; Writing—review and editing, W.W.; Funding acquisition, M.W.
Funding
This paper is funded by opening project in CAAC Key laboratory of General Aviation Operation (Civil Aviation Management Institute of China), the Humanities and Social Sciences Foundation of the Ministry of Education in China (16YJCZH086); Nantong Science and Technology Innovation Program (MS22018012); the Six Talent Peaks Project of Jiangsu Province, China (SZCY-009); Key science and technology projects in the transportation industry in China (2018-MS3-083), the central college basic scientific research operating expenses fund in civil aviation university of China (3122013D023).
Conflicts of Interest
The authors declare no conflict of interest.
References
- Quadrifoglio, L.; Li, X. A methodology to derive the critical demand density for designing and operating feeder transit services. Transp. Res. Part B Methodol. 2009, 43, 922–935. [Google Scholar] [CrossRef]
- Parragh, S.N.; Doerner, K.F.; Hartl, R.F. A survey on pickup and delivery problems. J. Fürbetriebswirtsch. 2008, 58, 21–51. [Google Scholar] [CrossRef]
- Laporte, G. Fifty years of vehicle routing. Transp. Sci. 2009, 43, 408–416. [Google Scholar] [CrossRef]
- Li, X.; Wei, M. An Agent-Based Model for Dispatching Real-Time Demand-Responsive Feeder Bus. Math. Probl. Eng. 2018, 2018, 6925764. [Google Scholar] [CrossRef]
- Chien, S.; Yang, Z. Optimal feeder bus routes on irregular street networks. J. Adv. Transp. 2000, 34, 213–248. [Google Scholar] [CrossRef]
- Fu, L.P.; Liu, Q.; Calamai, P. Real-time optimization model for dynamic scheduling of transit operations. Transp. Res. Rec. 2003, 1857, 48–54. [Google Scholar] [CrossRef]
- Fagnant, D.J.; Kockelman, K.M. Dynamic ride-sharing and fleet sizing for a system of shared autonomous vehicles in Austin, Texas. Transportation 2018, 45, 143–158. [Google Scholar] [CrossRef]
- Agatz, N.; Erera, A.; Savelsbergh, M.; Wang, X. Optimization for dynamic ride-sharing: A review. Eur. J. Oper. Res. 2012, 223, 295–303. [Google Scholar] [CrossRef]
- Dong, Y.; Wang, S.; Li, L.; Zhang, Z. An empirical study on travel patterns of internet based ride-sharing. Transp. Res. Part C Emerg. Technol. 2018, 86, 1–22. [Google Scholar] [CrossRef]
- Jerby, S.; Ceder, A. Optimal routing design for shuttle bus service. Transp. Res. Rec. 2006, 1971, 14–22. [Google Scholar] [CrossRef]
- Sun, Y.; Sun, X.; Li, B.; Gao, D. Joint optimization of a rail transit route and bus routes in a transit corridor. Procedia Soc. Behav. Sci. 2013, 96, 1218–1226. [Google Scholar] [CrossRef]
- Cordeau, J.F.; Laporte, G. The dial-a-ride problem: Models and algorithms. Ann. Oper. Res. 2007, 153, 29–46. [Google Scholar] [CrossRef]
- Chevrier, R.; Liefooghe, A.; Jourdan, L.; Dhaenens, C. Solving a dial-a-ride problem with a hybrid evolutionary multi-objective approach: Application to demand responsive transport. Appl. Soft Comput. 2012, 12, 1247–1258. [Google Scholar] [CrossRef]
- Shen, J.X.; Yang, S.Q.; Gao, X.M.; Qiu, F. Vehicle routing and scheduling of demand-responsive connector with on-demand stations. Adv. Mech. Eng. 2017, 9. [Google Scholar] [CrossRef]
- Savelsbergh, A.L.M. An extended demand responsive connector. EURO J. Transp. Logist. 2017, 6, 25–50. [Google Scholar]
- El-Sherbeny, N.A. Vehicle routing with time windows: An overview of exact, heuristic and metaheuristic methods. J. King Saud Univ. Sci. 2010, 22, 123–131. [Google Scholar] [CrossRef]
- Kohl, N.; Madsen, O.B.G. An optimization algorithm for the vehicle routing problem with time windows based on lagrangian relaxation. Oper. Res. 1997, 45, 395–406. [Google Scholar] [CrossRef]
- Fisher, M.; Jornsteen, K.; Madsen, O. Vehicle routing with time windows: Two optimization algorithms. Oper. Res. 1997, 45, 488–492. [Google Scholar] [CrossRef]
- Desrochers, M.; Desrosiers, J.; Solomon, M. A new optimizationalgorithm for the vehicle routing problem with time windows. Oper. Res. 1992, 40, 342–354. [Google Scholar] [CrossRef]
- Christofides, N.; Beasley, J. Multiperiodrouting problems. Network 1997, 14, 237–256. [Google Scholar] [CrossRef]
- Kolen, A.W.J.; RinnooyKan, A.H.G.; Trienekens, H.W.J.M. Vehicle Routing with Time Windows. Oper. Res. 1987, 35, 266–273. [Google Scholar] [CrossRef]
- Calvetea Herminia, I.; Galé, C.; Oliverosc, M.J.; BelénSánchez-Valverdeb, B. A goal programming approach to vehicle routing problems with soft time windows. Eur. J. Oper. Res. 2007, 177, 1720–1733. [Google Scholar] [CrossRef]
- Chiang, W.C.; Russell, R.A. Simulated annealing metaheuristics for the vehicle routing problem with time windows. Ann. Oper. Res. 1996, 63, 3–27. [Google Scholar] [CrossRef]
- Repoussis, P.P.; Tarantilis, C.D.; Bräysy, O.; Ioannou, G. A hybrid evolution strategy for the open vehicle routing problem. Comput. Oper. Res. 2010, 37, 443–455. [Google Scholar] [CrossRef]
- Osman, I.H. Metastrategy Simulated annealing and tabu search algorithms for the vehicle routing problem. Ann. Oper. Res. 1993, 41, 421–451. [Google Scholar] [CrossRef]
- Chiang, W.-C.; Russell, R.A. A reactive tabu search metaheuristic for the vehicle routing problem with time windows. INFORMS J. Comput. 1997, 9, 417–430. [Google Scholar] [CrossRef]
- Sun, B.; Wei, M.; Zhu, S. Optimal Design of Demand-Responsive Feeder Transit Services with Passengers’ Multiple Time Windows and Satisfaction. Future Internet 2018, 10, 30. [Google Scholar] [CrossRef]
- Potvin, J.Y.; Bengio, S. The vehicle routing problem with time windows part II: Genetic search. Inf. J. Comput. 1996, 8, 165–172. [Google Scholar] [CrossRef]
- Thangiah, S.R.; Osman, I.H.; Sun, T. A hybrid genetic algorithms, simulated annealing and tabu search heuristic for vehicle routing problems with time windows. In Practical Handbook of Genetic Algorithms; Complex Structures; CRC Press: Boca Raton, FL, USA, 1999; Volume 3, pp. 347–381. [Google Scholar]
- Schulze, J.; Fahle, T. A parallel algorithm for the vehicle routing problem with time windows constraints. Ann. Oper. Res. 1999, 86, 585–607. [Google Scholar] [CrossRef]
- Sun, B.; Wei, M.; Yang, C.; Xu, Z.; Wang, H. Personalized and Coordinated Demand-Responsive Feeder Transit Service Design: A Genetic Algorithms Approach. Future Internet 2018, 10, 61. [Google Scholar] [CrossRef]
- Yan, Y.; Liu, Z.; Meng, Q.; Jiang, Y. Robust optimization model of bus transit network design with stochastic travel time. J. Transp. Eng. 2013, 139, 625–634. [Google Scholar] [CrossRef]
- Szeto, W.; Jiang, Y. Transit route and frequency design: Bi-level modeling and hybrid artificial bee colony algorithm approach. Transp. Res. Part B Methodol. 2014, 67, 235–263. [Google Scholar] [CrossRef] [Green Version]
- Sun, B.; Wei, M.; Yang, C.; Ceder, A. Solving demand-responsive feeder transit service design with fuzzy travel demand: A collaborative ant colony algorithm approach. J. Intell. Fuzzy Syst. 2019, 37, 3555–3563. [Google Scholar] [CrossRef]
Figure 1.
Graphical representation of DRT (demand-responsive feeder transit services) based on the shared car.
Figure 1.
Graphical representation of DRT (demand-responsive feeder transit services) based on the shared car.

Figure 2.
The flow chart of the genetic algorithm (GA)-based two-stage heuristic algorithm.

Figure 3.
Spatial distribution of these vehicular nodes.

Figure 4.
Comparison of the results of the proposed model and traditional DRTs.

Figure 5.
Comparison of the results of the proposed model and traditional DRTs.

Figure 6.
Different maximum walking distance on the scheduling result.


Table 1.
Definitions and notations of the DRT (demand-responsive feeder transit services) model.
| Indices | |
|---|---|
| i | Demand point index |
| j,m | Vehicular node (pick-up locations, the transportation hub, and origin/destination of shared car) index |
| k | Shared car index |
| Sets | |
| I | Set of demand points |
| M | Set of the transportation hubs, without loss of generality we are assuming a single station in this model |
| O | Set of origins of shared cars |
| D | Set of destinations of shared cars |
| K | Set of shared cars |
| Parameters | |
| Number of persons at the demand point i | |
| Time window of each demand point i | |
| Maximum capacity of the shared car k | |
| Maximum mileage of each shared car | |
| Minimum mileage of each shared car | |
| Maximum travel time of each shared car | |
| Travel distance between vehicular nodes (demand points, the transportation hubs, origins, and destinations of shared cars) | |
| Travel time between vehicular nodes (demand points, the transportation hubs, origins, and destinations of shared cars) | |
| Travel time of the shared car k | |
| / | Departure time window of the shared car k |
| / | Arrival window of the shared car k |
| Maximum walking distance | |
| Walking speed | |
| A large fixed number | |
| Decision Variables | |
| If a demand point is selected as a pick-up location visited by the shared car k, true; otherwise, false | |
| If the shared car k visit two adjacent vehicular nodes j and m, true; otherwise, false | |
| If an unvisited demand point is assigned to a pick-up location on the shared car k, true; otherwise, false | |
| Arrival time of the shared car k visiting the vehicular node j | |
| Number of passengers on the shared car k visiting the vehicular node j | |
| An auxiliary variable for eliminating sub-tour in the route of the shared car k | |
Table 2.
Shared car route building process based on the Dijkstra algorithm.
| Input | Traffic network G, consisting of pick-up locations visited by shared car and its origin and destination |
| Output | Shortest route and its weight distance for vertex, d[] and p[] |
| Algorithm Flow Chart | generate vertex set Q//initialization for each vertex g in G: d[g] ← ∞, p[g] ← -1 and add g to Q d[s] ← 0 while Q ≠ Ø://Path construction process u ← vertex in Q with min d[u] remove u from Q for each neighbor g of u: alt ← d[u] + length (u, g) if alt < d[g]: d[g] ← alt and p[g] ← u |
Table 3.
Information about the demand points.
| Demand Point | Number of Persons | Time Window | Demand Point | Number of Persons | Time Window |
|---|---|---|---|---|---|
| D1 | 1 | 6:30–7:00 | D14 | 1 | 6:40–7:00 |
| D2 | 2 | 6:30–7:00 | D15 | 2 | 6:20–6:40 |
| D3 | 1 | 6:20–6:40 | D16 | 2 | 6:30–6:50 |
| D4 | 1 | 6:20–6:40 | D17 | 1 | 6:30–7:00 |
| D5 | 2 | 6:20–6:50 | D18 | 1 | 6:20–6:40 |
| D6 | 1 | 6:30–7:00 | D19 | 1 | 6:20–6:50 |
| D7 | 2 | 6:20–6:50 | D20 | 2 | 6:40–7:00 |
| D8 | 2 | 6:30–7:00 | D21 | 1 | 6:20–6:40 |
| D9 | 1 | 6:20–6:40 | D22 | 1 | 6:20–6:50 |
| D10 | 2 | 6:20–6:50 | D23 | 1 | 6:30–7:00 |
| D11 | 1 | 6:30–7:00 | D24 | 1 | 6:20–6:50 |
| D12 | 2 | 6:20–6:40 | D25 | 1 | 6:30–7:00 |
| D13 | 1 | 6:20–6:50 | - | - | - |
Table 4.
Information about shared cars.
| Shared Car | Origin/Destination | Departure Time Window | Arrival Time Window |
|---|---|---|---|
| R1 | S1, S3 | 6:20–6:30 | 6:40–7:00 |
| R2 | S1, S3 | 6:20–6:30 | 6:40–7:00 |
| R3 | S2, S3 | 6:20–6:40 | 6:40–7:00 |
Table 5.
Result of selection and assignment for demand points picked up by the shared car.
| Visited Demand Point | Unvisited Demand Point | Number of Persons | Vehicle | Walking Distance (m) |
|---|---|---|---|---|
| D1 | D3 | 2 | R1 | 303.9 |
| D2 | 2 | 244.9 | ||
| D18 | D4 | 2 | 439.7 | |
| D5 | D6 | 3 | 106.9 | |
| D7 | 2 | R2 | 219.8 | |
| D9 | D8 | 3 | 54.8 | |
| D10 | D11 | 3 | 140.9 | |
| D12 | 2 | 192 | ||
| D13 | D14 | 2 | 116.6 | |
| D15 | D16 | 4 | R3 | 175.5 |
| D17 | 1 | 188.4 | ||
| D19 | 1 | 66.2 | ||
| D21 | D20 | 3 | 106.7 | |
| D22 | 1 | 36.7 | ||
| D24 | D23 | 2 | 13.3 | |
| D25 | 1 | 147.3 |
Table 6.
The scheduling plan for each shared car.
| Vehicle | Adjacent Pick-Up Locations Covered by the Vehicle | Travel Distance (km) | Travel Time (min) |
|---|---|---|---|
| R1 | S1-D1-D2-D18-D5-M- S3 | 13.4 | 26.5 |
| R2 | S1-D7-D9-D10-D12-D13-M- S3 | 9.4 | 19.7 |
| R3 | S2-D15-D17-D19-D21-D22-D24-D25-M- S3 | 9.9 | 24.5 |
Table 7.
Comparison of the results of a different number of shared cars.
| Scenario | Objective (min) | Solution Time (min) | Total Riding Time (min) | Total Walking Time (min) | Total Mileages (km) | Total Times (min) | ||
|---|---|---|---|---|---|---|---|---|
| Cplex | GA | Cplex | GA | |||||
| 3 vehicles | 320.3 | 342.7 | 20.2 | 2.2 | 258.1 | 62.2 | 31.2 | 50.2 |
| 4 vehicles | 304.5 | 322.7 | 136.5 | 2.5 | 248.3 | 56.2 | 32.4 | 61.2 |
| 5 vehicles | 372.4 | 397.4 | 214.4 | 2.6 | 324.2 | 48.2 | 35.3 | 65.6 |
Table 8.
Comparison of the results of different algorithms.
| Number of Demand Points | GA | Optimal Solution of Cplex | Computation Time | |||
|---|---|---|---|---|---|---|
| Best Solution | Average Solution | Worst Solution | Cplex | GA | ||
| 25 | 342.7/6.9% | 347.8/8.6% | 356.8/11.4% | 320.3 | <0.5 h | 2.2 min |
| 50 | 560.2/7.4% | 574.3/10.1% | 592.0/13.5% | 521.6 | >1 h | 2.9 min |
| 75 | 734.0/8.2% | 761.2/12.2% | 784.9/15.7% | 678.4 | >12 h | 3.6 min |
| 100 | 901.8/9.3% | 943.9/14.4% | 966.2/17.1% | 825.1 | >24 h | 4.5 min |
| 150 | 1040.7/10.4% | 1100.1/16.7% | 1134.1/20.3% | 942.7 | >48 h | 5.3 min |
| 200 | 1151.6/12.0% | 1218.4/18.5% | 1270.9/23.6% | 1028.2 | - | 6.5 min |
© 2019 by the authors. Licensee MDPI, Basel, Switzerland. This article is an open access article distributed under the terms and conditions of the Creative Commons Attribution (CC BY) license (http://creativecommons.org/licenses/by/4.0/).
Share and Cite
MDPI and ACS Style
Sun, B.; Wei, M.; Wu, W. An Optimization Model for Demand-Responsive Feeder Transit Services Based on Ride-Sharing Car. Information 2019, 10, 370. https://0-doi-org.brum.beds.ac.uk/10.3390/info10120370
AMA Style
Sun B, Wei M, Wu W. An Optimization Model for Demand-Responsive Feeder Transit Services Based on Ride-Sharing Car. Information. 2019; 10(12):370. https://0-doi-org.brum.beds.ac.uk/10.3390/info10120370
Chicago/Turabian StyleSun, Bo, Ming Wei, and Wei Wu. 2019. "An Optimization Model for Demand-Responsive Feeder Transit Services Based on Ride-Sharing Car" Information 10, no. 12: 370. https://0-doi-org.brum.beds.ac.uk/10.3390/info10120370
Note that from the first issue of 2016, this journal uses article numbers instead of page numbers. See further details here.