Text and Data Quality Mining in CRIS


German Center for Higher Education Research and Science Studies (DZHW), Schützenstraße 6a, 10117 Berlin, Germany
Information 2019, 10(12), 374; https://0-doi-org.brum.beds.ac.uk/10.3390/info10120374
Submission received: 23 September 2019
/
Revised: 7 November 2019
/
Accepted: 25 November 2019
/
Published: 28 November 2019
(This article belongs to the Special Issue Quality of Open Data)
Abstract
:To provide scientific institutions with comprehensive and well-maintained documentation of their research information in a current research information system (CRIS), they have the best prerequisites for the implementation of text and data mining (TDM) methods. Using TDM helps to better identify and eliminate errors, improve the process, develop the business, and make informed decisions. In addition, TDM increases understanding of the data and its context. This not only improves the quality of the data itself, but also the institution’s handling of the data and consequently the analyses. This present paper deploys TDM in CRIS to analyze, quantify, and correct the unstructured data and its quality issues. Bad data leads to increased costs or wrong decisions. Ensuring high data quality is an essential requirement when creating a CRIS project. User acceptance in a CRIS depends, among other things, on data quality. Not only is the objective data quality the decisive criterion, but also the subjective quality that the individual user assigns to the data.
1. Motivation
Different research institutions use research information for different purposes. Data analyses and reports based on current research information systems (CRIS) provide information about the research activities and their results. As a rule, management and controlling utilize the research information from the CRIS for reporting. For example, trend analysis helps with business strategy decisions or rapid ad-hoc analysis to respond effectively to short-term moves. Ultimately, the analysis results and the resulting interpretations and decisions depend directly on the quality of the data. Data quality is easiest to define as “suitable for use”. The many manifestations, causes, and effects of poor data quality (such as incorrect management decisions and cost increases) make it clear that, especially in our information age, it is essential to look at methods that increase and maintain data quality [1,2].
Decisions can only be successfully and profitably implemented if the information base, in other words, the research information in the CRIS, is of high quality and thus able to withstand stress. The CRIS is understood to be a database or a federated information system that collects, manages, and provides information about research activities and research results [3,4]. The information considered here represents metadata about research activities (such as persons, projects, third-party funds, patents, partners, awards, publications, doctorates, and habilitations, etc.). Further in-depth information on CRIS and data quality can be found in papers [1,2,3,4,5,6,7,8].
Recently, research activities and their results at universities and academic institutions have been collected, maintained, and published via CRIS in a variety of forms and heterogeneous data sources [5]. The introduction of CRIS into research institutions means that they must provide their required information about research activities and research results in an assured quality [6,8]. Poor data quality means that analyses and evaluations are faulty or difficult to interpret. The occurring quality problems in CRIS include on the one hand spelling mistakes, missing data, incorrect data, wrong formatting, duplicates, and contradictions data, etc., and on the other hand unstructured data formats. These can arise when capturing various independent information systems (such as external publication databases, identifiers (ORCID, DOIs, CrossRef), external project data, etc.), and different standardized exchange formats (e.g., from the CERIF or RCD data model). Low data quality can negatively impact business processes and lead to erroneous decision-making.
Much of the information in CRIS is in the form of text documents (e.g., unstructured data includes, for example, personal information, publication data, or project data in Word, PDF, or XML data). Unstructured data therefore presents a major challenge for CRIS administrators, especially for universities and academic institutions that manage their research information from heterogeneous data sources in CRIS [5]. The information age makes it easy to store huge amounts of data. The proliferation of documents on the internet, in institution intranets, in news wires, and blogs is overwhelming. Although the number of available research information is constantly growing, the possibilities to record and to process it remain limited. Search engines additionally aggravate this problem because they make a large number of documents accessible only by a few entries in the search mask.
The knowledge about research activities and their results is becoming an increasingly important factor for the success of an institution and should be extracted from this document base. However, reading and understanding texts for gaining knowledge is a domain of the human intellect, but it is capacitively limited. A software analysis through a largely automated process of obtaining new and potentially useful knowledge of text documents can overcome this shortcoming.
Due to the abundance and rapid growth of digital, unstructured data, TDM is becoming increasingly important. TDM is a technique for extracting new knowledge from texts that is still unknown to the user, and has an application everywhere instead of database-compressed, preselected input of data; these are captured in text form in [9]. TDM creates the opportunity to conduct an efficient and structured information/knowledge exploration and, moreover, provides good support in the management of most of the existing data [10,11].
The methods of TDM by means of statistical and linguistic analysis methods aim at the detection of hidden and interesting information or patterns in unstructured text documents, on the one hand to be able to process the huge amount of words and structures of the natural language, and on the other hand to allow the treatment of uncertain and fuzzy data. According to [12], as a new field of research, TDM is a promising attempt to solve this problem of information overload by using methods of TDM: Natural language processing (NLP), information extraction (IE), and clustering.
The hidden and stored unstructured data and sources in CRIS can play an important role in decision-making [5]. The application of TDM in CRIS is scarcely widespread, although the techniques of TDM and their potential have already been considered and discussed in two articles [5,7]. Only in terms of ensuring data quality are possible applications established. With scalable algorithms from TDM methods, universities and academic institutions can also efficiently analyze very large amounts of data in CRIS and detect inadequate data (e.g., detecting duplicates, erroneous and incomplete data sets, and identifying outliers and logical errors). Thus, the data quality of existing data can be significantly and systematically improved.
For this reason, this paper will highlight the data quality in the context of TDM in CRIS. The purpose of the paper is to present the state of development of the TDM technology in CRIS, to discuss application possibilities, and to show already existing practice applications. The focus is on TDM methods such as NLP, IE, and clustering. To ensure this, Section 2 gives an overview of the data quality in CRIS and the meaning of the TDM. After that, the problems of unstructured data in CRIS will be addressed. In Section 3, the methods of the TDM are described by the context CRIS and then a practical example is shown in each method, how the CRIS managers can analyze and improve their unstructured data and derive important insights for their own organization. Finally, the results are summarized in Section 4.
2. Fundamentals
2.1. Data Quality in CRIS
There are many definitions of the term data quality in the literature. Here, the data quality is understood as follows:
All the definitions mentioned have in common that the data must be “fit for purpose” from the point of view of the person processing the data, which supports the intended use to be described as qualitative.
Data will then be of high quality in CRIS if they meet the needs of the user. However, this also means that data quality can only be assessed individually. Quality is a relative and not an absolute property. The quality of the data can, therefore, only be assessed relative to their respective use. However, assessing and determining the quality of data within such a CRIS is a challenging task. In order to evaluate the data quality, metrics are used which can be derived on the basis of different approaches (theoretical, empirical, or intuitive) and which differ accordingly with regard to the dimensions found. A selection of derived metrics and dimensions can be found, for example, in [15] or [13]. For example, in the context of CRIS, the following criteria may apply [3,4,8]:
- Completeness
- Correctness
- Consistency
- Timeliness
Data quality can be measured by the four dimensions and their metrics. Measurements help to express observations by numbers. This makes comparisons possible. Thus, objects can be compared with each other, or the development of an object over time. The measured values can serve as the basis for decisions. For this the measurements, must be understandable, reproducible, and expedient.
- Measurements must be understandable to serve their purpose. The results cannot help in decision-making when no one understands what has been measured and what the results mean exactly. This underlines the importance of metadata that documents the measurements and the results. This helps the data consumer understand the context and interpret the results.
- Measurements must be reproducible. Inconsistent measurements mean that the results have little or no significance. To show if the quality in a record improves or deteriorates, the same data must be measured using the same methods. As a result, comparisons between different objects are possible.
- Measurements must be expedient. It should measure what helps to reduce the uncertainty of a decision. Measurements serve a purpose and help with concrete problems.
A comprehensive overview of the topic and the description of various data quality metrics can be found in [3]. The relationship between the quality of the data and the quality of the analyses based on it plays an important role. A framework for measuring data quality in CRIS is presented in [3].
Ensuring a sustainable and effective data quality increase in CRIS requires continuous data quality management. Punctual data cleansing has only a short-term effect. The resulting improvements are quickly lost, especially with frequently changing data. Therefore, data quality should not be considered a one-time action. To effectively improve data quality, holistic methods (such as data cleansing) are needed to look at data throughout its lifecycle to guarantee a defined level of quality [2]. The goal of data cleansing is to find and correct incorrect, duplicate, inconsistent, incorrectly formatted or inaccurate, and irrelevant data in CRIS. As part of the cleanup, for example, data is supplemented, deleted, reformatted, or adjusted. After cleanup, the data is of higher quality and allows organizations to work with greater reliability. The process of data cleansing consists of five steps or phases (parsing, standardization, matching, merging, and enrichment). Depending on the information system and the required target quality, these individual steps must be repeated several times. In many cases, data cleansing is a continuous, periodic process. The application of the data cleansing process in CRIS can be found in papers [2,4].
2.2. Definition of the Term TDM
The defined approaches to TDM are manifold. The authors of [16] compare the differences in the handling of structured and textual data and notes: Structured data is managed by means of database systems, text data, however, due to the lack of structure, caused by search engines. Unlike database queries, keywords are queried when using search engines. In order to increase the effectiveness and efficiency of search engines, great progress has been achieved within information retrieval in the areas of text clustering, text categorization, text summarization, and recommendation services. Information retrieval is traditionally focused on easy access to information, not analysis—that is the primary goal of TDM. While the goal of accessing information is to connect the right information to the right user at the right time, TDM tools continue to be able to help the user analyze and understand that information in order to make appropriate decisions. Other TDM tools have the task of analyzing text data to detect interesting patterns, trends, or outliers without the need for a query [16].
This brief description of the tasks of TDM tools already demonstrates the wide range of TDM tasks that lead to different definitions of TDM in the literature. The authors of [9] note that “this unified problem description [...] is opposed by competing text mining specifications”. This is also reflected in the variety of names in the history of TDM, such as textual data mining, text knowledge engineering, or knowledge discovery in the text. The authors of [9,17] introduced the term knowledge discovery into textual databases (derived from Knowledge Discovery in Databases—KDD) in 1995. In 1999, the term text data mining (TDM) was coined, from which the term used today derives. Corresponding to this multiplicity of designations conflicting task assignments and definition approaches exist [9]. The authors of [9] differentiate four perspectives on TDM. The first view is the approximation of information retrieval as described by [16] and includes an improvement through text summaries and information extraction [9].
TDM is interdisciplinary and uses findings from the fields of computer science, mathematics, and statistics for the computer-aided analysis of databases [5]. TDM is the systematic application of computer-aided methods to find patterns, trends, or relationships in existing databases [18]. “TDM, also known as text mining or knowledge discovery from textual databases, refers generally to the process of extracting interesting and non-trivial patterns or knowledge from unstructured text documents. It can be viewed as an extension of data mining or knowledge discovery from (structured) databases. […] Text mining is a multidisciplinary field, involving information retrieval, text analysis, information extraction, clustering, categorization, visualization, database technology, machine learning, and data mining” [17]. TDM also helps to improve the search for literature in databases, as well as the analysis, storage, and availability of information on various websites and search engines are made more efficient and accurate by this technique [5].
2.3. Problems of Unstructured Data in CRIS
The basis of all reporting for decision support in universities and research institutions are the CRIS, which draw their data from various operational and external data and are available in a structured form. Due to the huge advances in hardware and software, the use of mobile devices, and the inclusion of the Internet, the emergence of semi-structured (such as XML or HTML files) and unstructured data such as text documents, memos, e-mails, RSS feeds, blog entries, short messages such as Twitter, forum posts, comments in social networks, and free text input in forms but also pictures, video, and audio data. The developments of communication technologies allow a fast, easy, and also mobile input of this data, which form a huge repository. Specifically, the internet is driving the potential of multiple users to easily create and store a large amount of text data [16].
Academic institutions are faced with the challenge of finding relevant information in ever-larger databases. About 80% of the research information of a university is not available in machine-processable and thus structured data, but in unstructured, not directly machine-processable data and thus in documents.
Unstructured data is data that does not have a formal structure and therefore cannot easily be stored in a database such as CRIS similar to structured data. Therefore, unstructured data must first be prepared or structured before being evaluated. The exact content of unstructured data is not known before a data analysis. The best solution to the problem of unstructured data can be the implementation of the TDM methodology at universities and research institutes and help to efficiently and effectively search their unstructured data.
The effort required to collect, store, and evaluate research information must therefore be justified. For research information to become a value-adding component of an academic institution, there are several aspects to consider:
- The availability of the data must be guaranteed.
- The quality of the data must be good.
- Responsibilities in universities and academic institutions must be regulated.
- Data know-how must be available.
3. Employing TDM Methods in CRIS
To investigate large amounts of text, a manual approach is not enough. However, this is necessary to manage and analyze the vast amounts of textual documents that organizations have. For this purpose, the method of TDM was developed, which can be understood as a special form of data mining. TDM methods can be applied to unstructured data in CRIS. Basically, it is about information search and information retrieval from heterogeneous data sources, by finding interesting patterns [19]. The special features of the TDM are the structure of the data, as well as the origin of the data. The data type to be examined is unstructured or semi-structured text from internal or external sources. In the area of research management TDM helps to improve the search for literature in CRIS. Moreover, the analysis, storage, and availability of research information on various websites and search engines are made more efficient and accurate by this technique. The following steps are required to obtain information from unstructured data in the context of CRIS [12,20]:
- Application of pre-processing routines on heterogeneous data sources.
- Application of algorithms for the discovery of patterns.
- Present and visualize the results.
For the TDM, it is necessary to recognize and filter representative features from the natural language heterogeneous data sources and thus to create a structured intermediate from the texts. There are a variety of different tasks or methods of TDM in science. TDM is a seemingly everyday activity that is a demanding task in machine processing by combining different methods of text preprocessing and analysis. The present paper is limited to the three most frequently mentioned methods and has already been dealt with in paper [5] in the context of CRIS. The following methods: Natural language processing (NLP), information extraction (IE), and clustering, are discussed in detail in the context of CRIS.
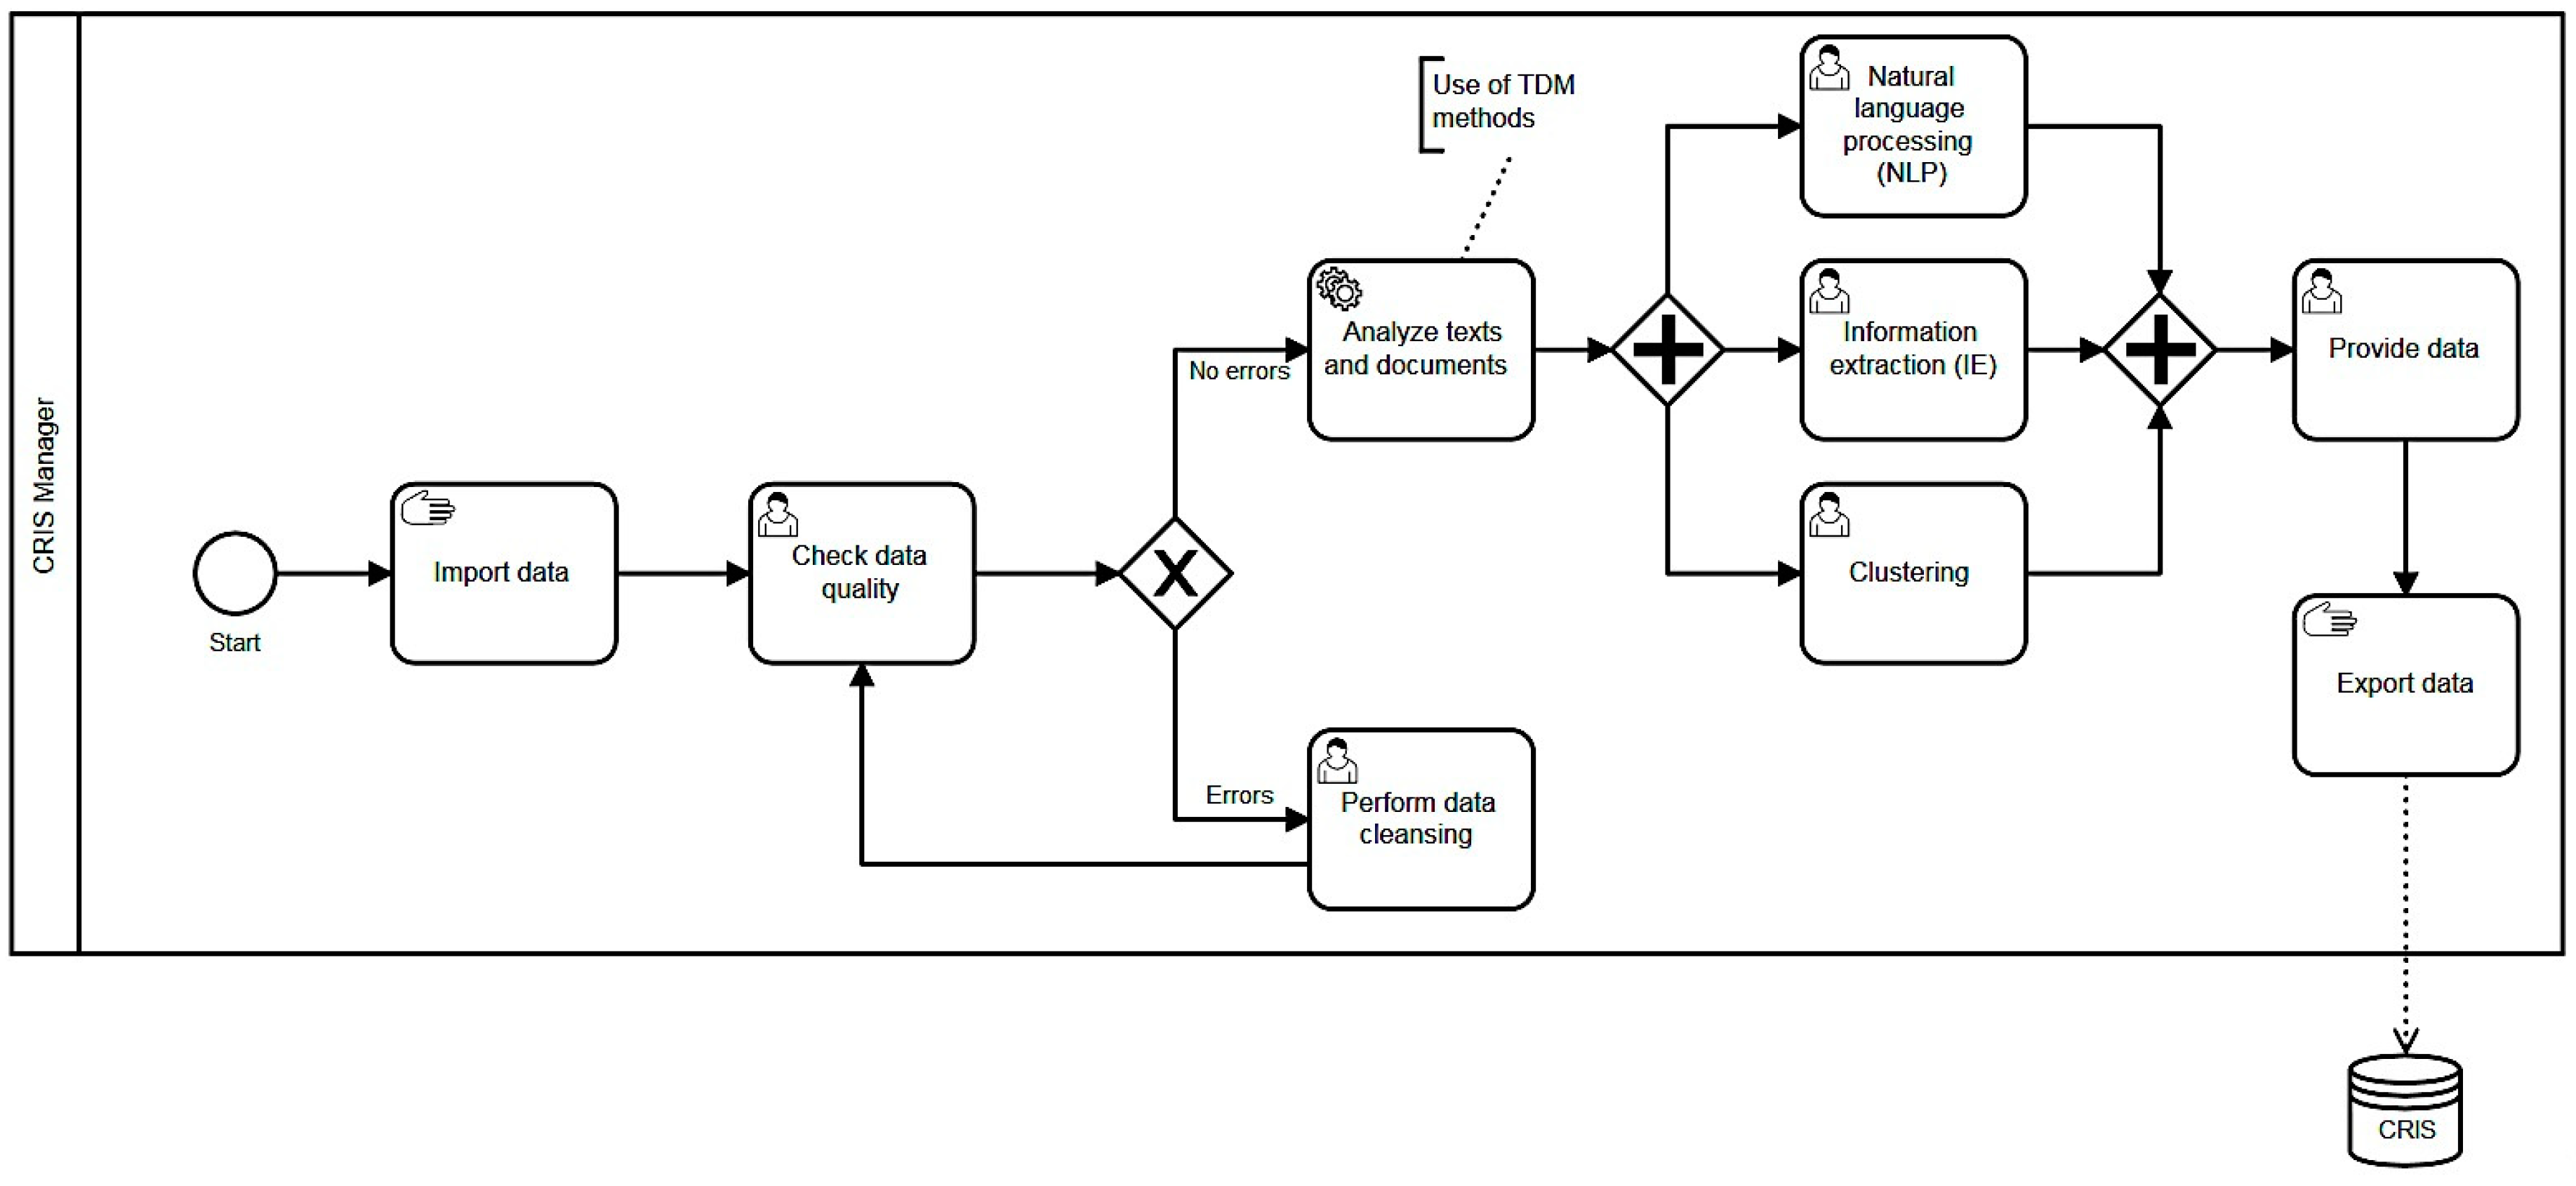
Figure 1 below uses the workflow as a guideline for analyzing research information at CRIS institutions using TDM methods and provides a permanent backup, as unstructured and erroneous data in a collection presents a fundamental challenge to CRIS managers.
3.1. Natural Language Processing (NLP)
Methods of NLP are an important part of the data preprocessing phase and could be used to structure the text documents to be analyzed in order to understand the meaning of the text to be examined. A simple definition for NLP “is the attempt to extract a fuller meaning representation from free text. This can be put roughly as figuring out who did what to whom, when, where, how and why.” [21].
- Spell checking and correction: By spelling the word and identifying the meaning of a word in context, a correct spelling checker is possible.
- Information gathering: By recognizing syntactic and semantic dependencies, it is possible to extract specific information from a text.
- Question answering: Through syntactic and semantic analysis of a question, a computer can automatically find appropriate answers.
- Machine translation: By clarifying the meaning of words as a single or in context, a correct translation is feasible.
The three main analysis processes of NLP are morphological, syntactic, and semantic analysis. In the first step, the text is divided into individual words (tokenization) and these are traced back to their root word and to lemma of the word (stemming). Subsequently, the words are marked, they are annotated. These annotations take Part-of-Speech (POS) taggers, where parts of speech are assigned and parsers that determine the word order in a given sentence. POS tags use dictionaries that capture words and words that they can accept. In the final step, a semantic analysis of the meaning-dependent decomposition and categorization of text is performed. This can be assigned using Named Entity Recognition (NER). NER is the most important part of information extraction for recognizing and categorizing entities, which will be explained in the next subsection.
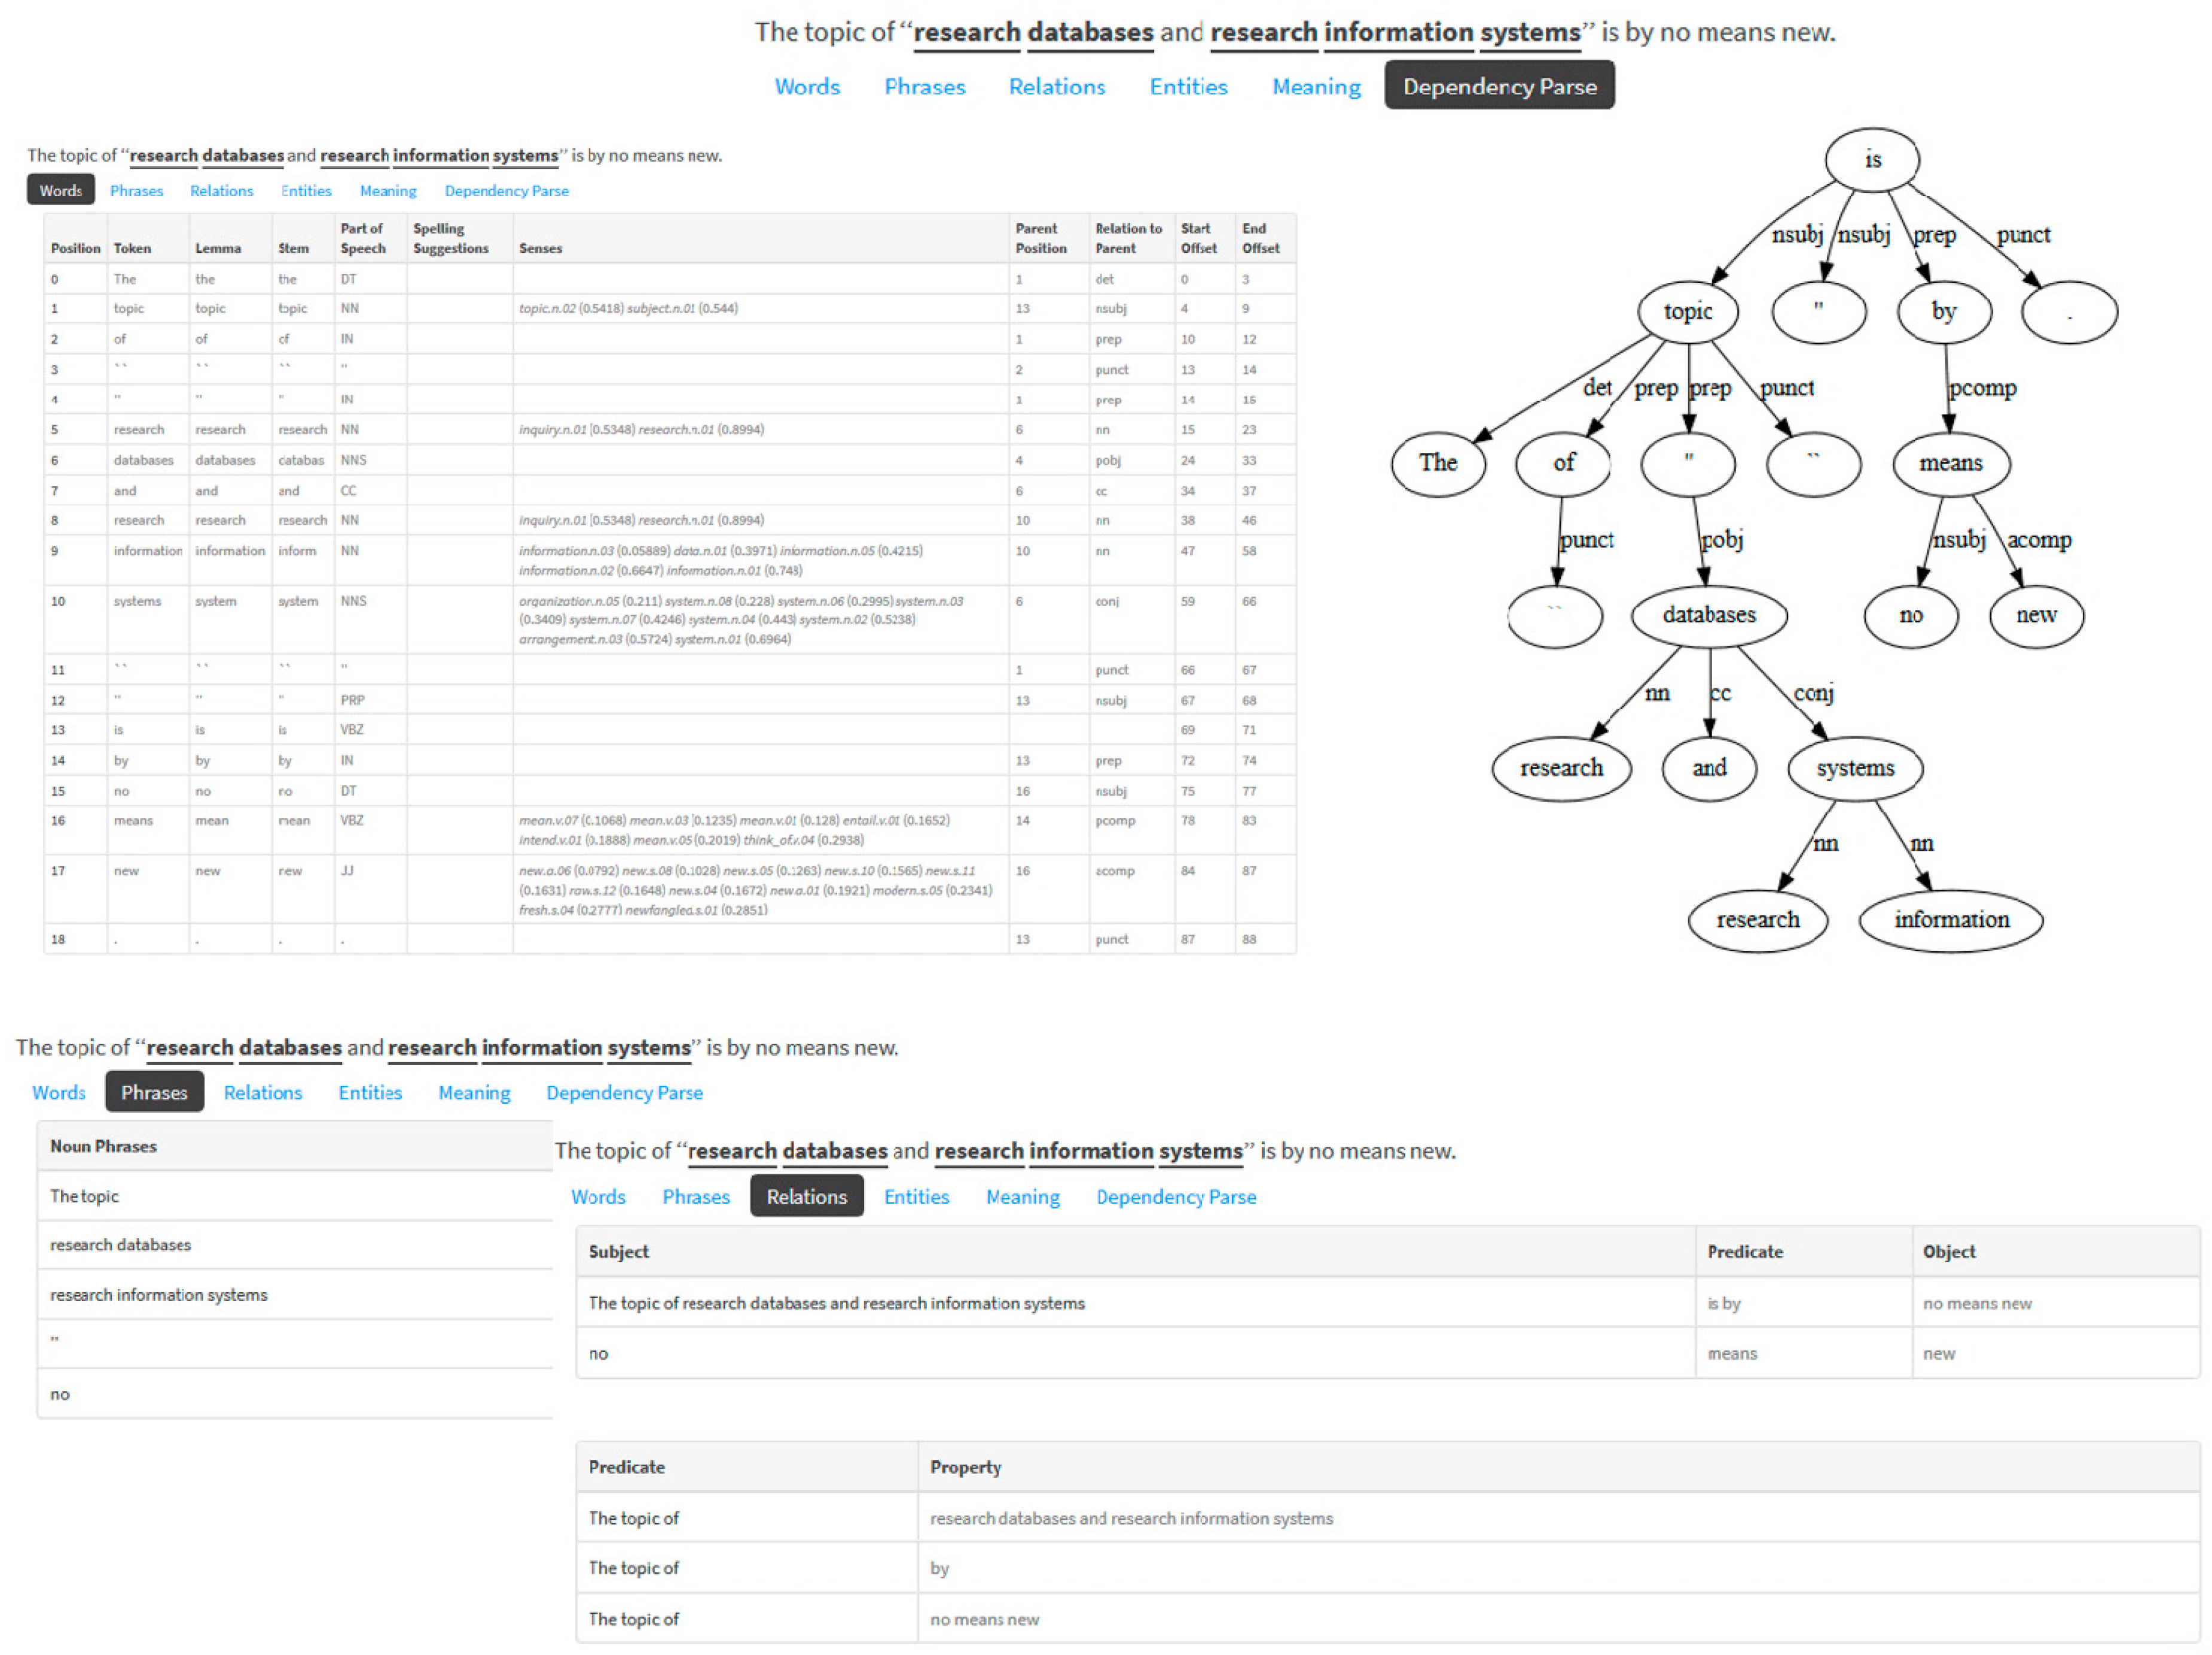
Figure 2 gives a practical example of the NLP functions used to analyze a publication text before it is integrated into the CRIS. Using the TextRazor tool, CRIS managers can use the NLP functions (such as words, phrases, relationships, entities, meaning, and dependency analysis) to analyze their unstructured data and text.
3.2. Information Extraction (IE)
IE is a very important task in TDM. The main goal of IE is to extract structured information from unstructured or semi-structured text. Important information, such as names of authors, locations, or institutions contained in the publication text, is extracted from it. This information can be passed directly to a user or other applications such as search engines or databases [23]. The fields of application of information extraction are diverse, the specific types and structures of the information to be filtered depend on the requirements of further processing.
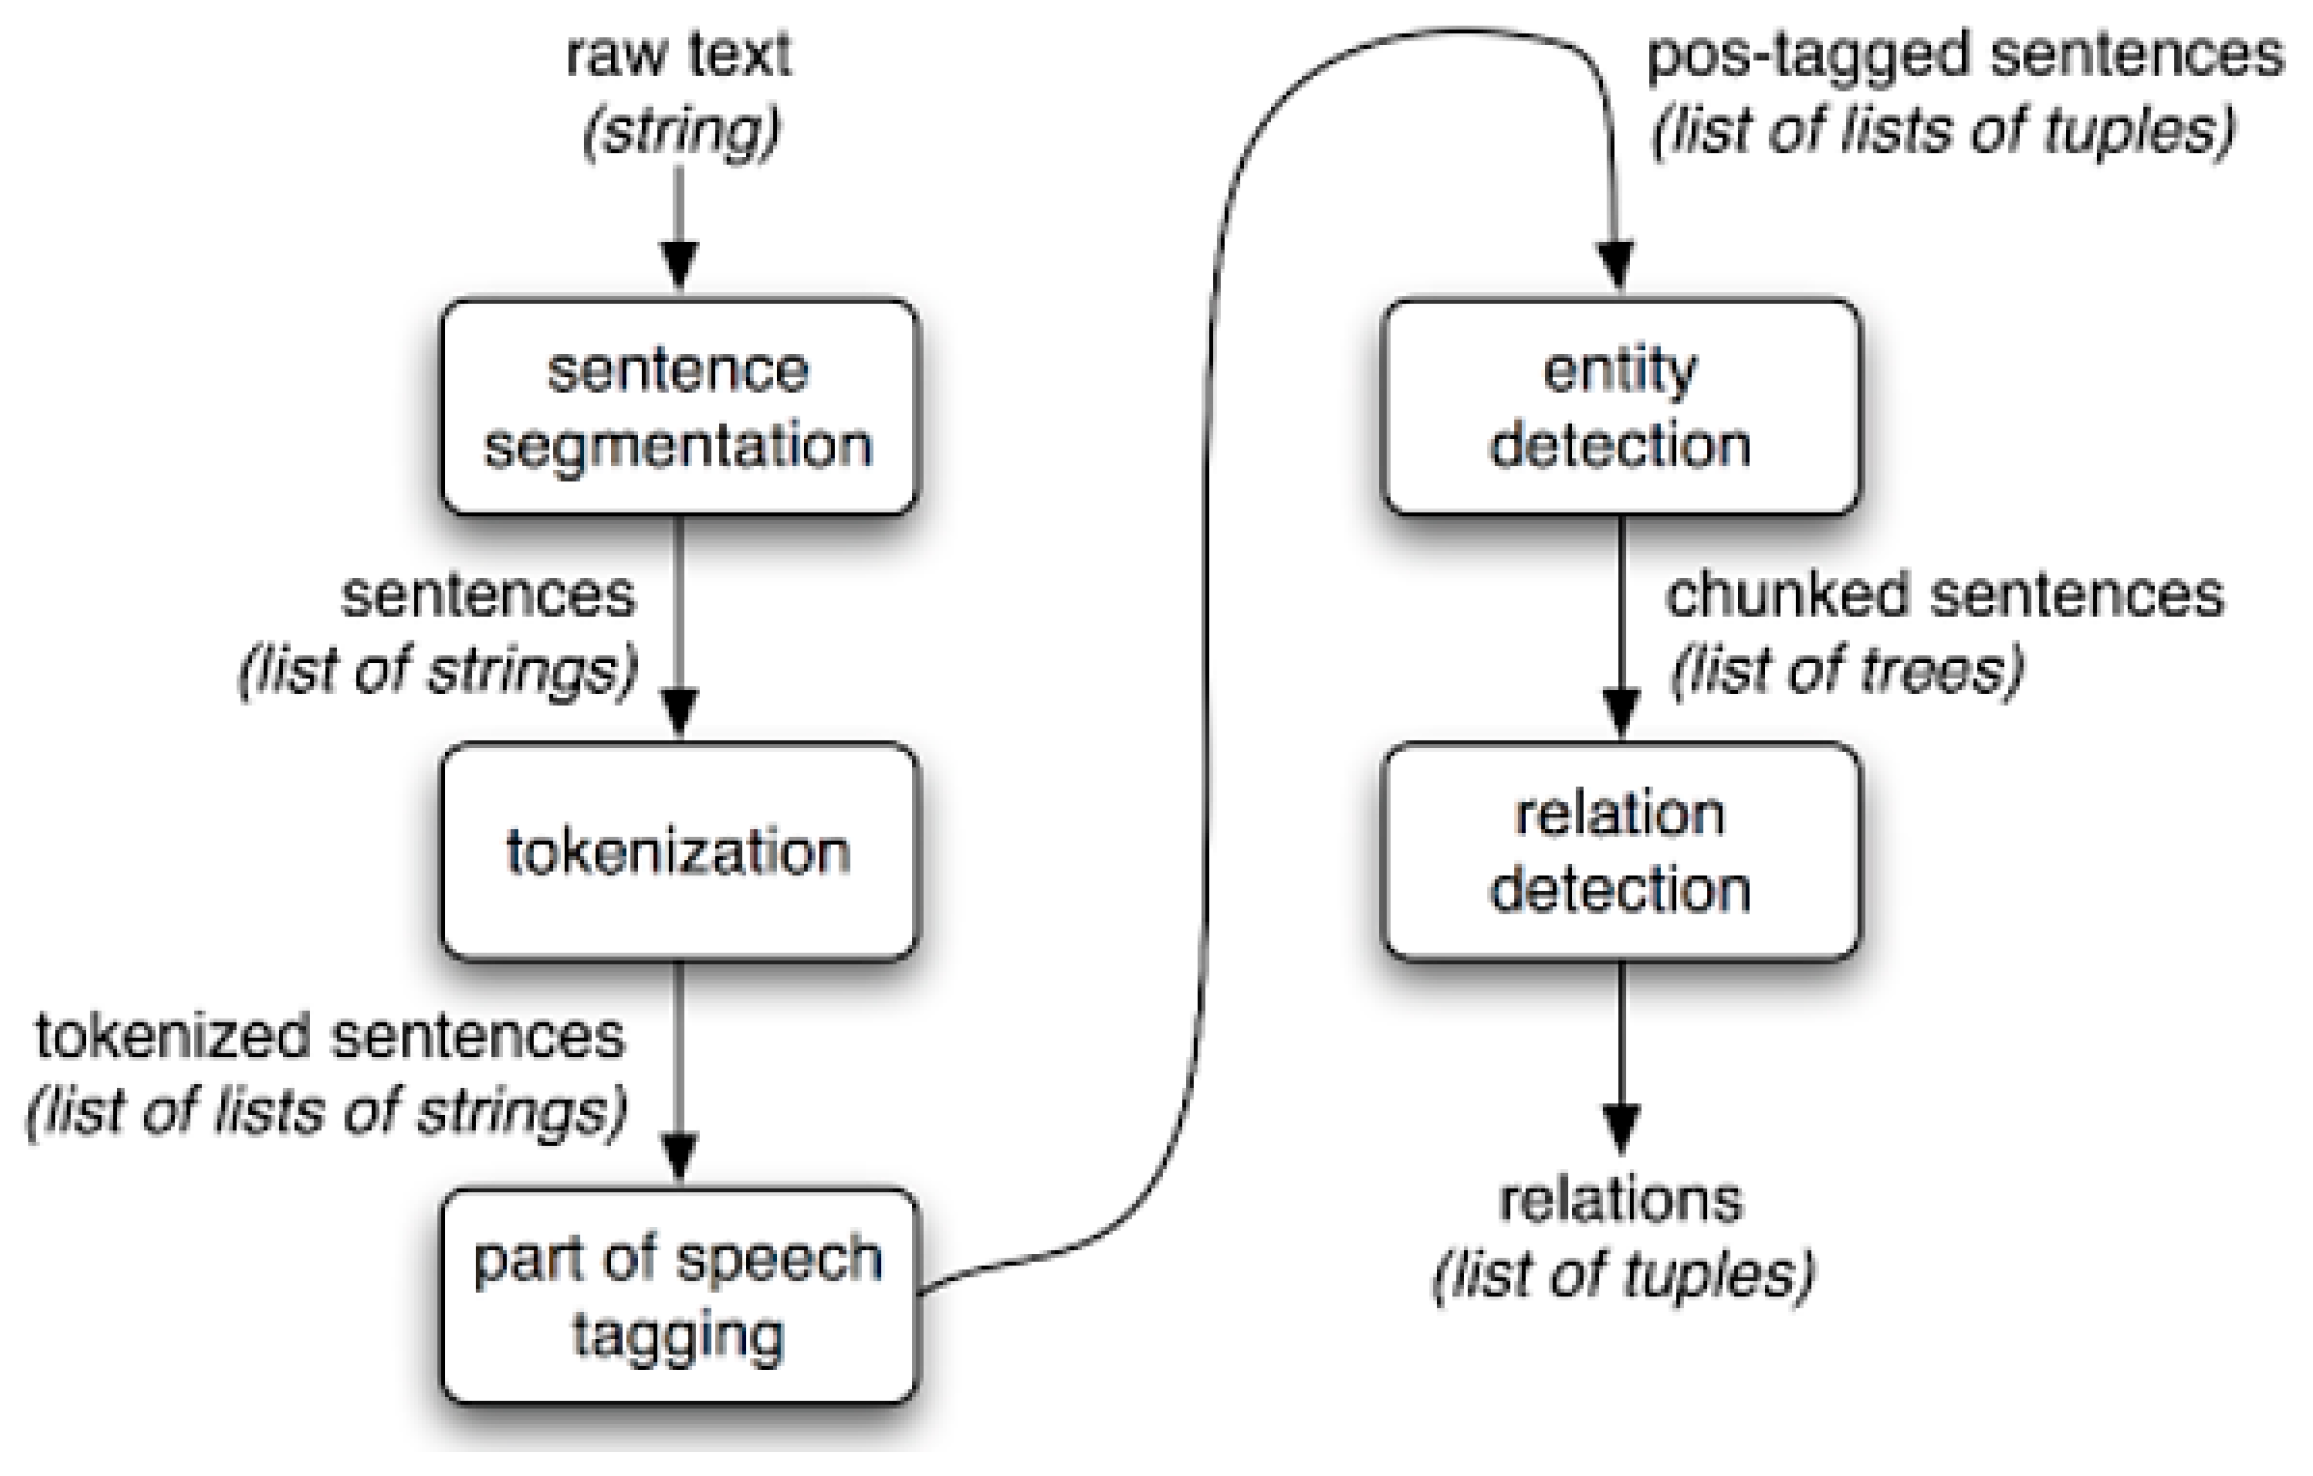
The task of IE is the extraction of text parts and the assignment of specific attributes. In this context, this means finding entities and relations between entities. Usually, methods of NLP are used. This is different in five steps in the IE process (see Figure 3). In the first step, sentence segmentation, the unprocessed text is split into sentences using sentence end characters such as “.”, “!”, “?”. Using a so-called Tokenizers (lexical scanner) is subdivided into words (tokens) in the following process step tokenization each sentence of the document. All punctuation and other non-textual components within a sentence are replaced by spaces. The result is lists of words in unaltered order, which are used for further processing. In the case of part-of-speech tagging, every word in the sentence is given a part of speech tag. These may include verbs, adjectives, nouns, or prepositions. Decisive is the context, because one and the same word can be assigned different parts of speech in different sentences. The next step entity detection or NER looks for potentially relevant entities in a sentence. These are, for example, personal names, place names, or organizations. NER can be the most important task of information extraction in CRIS. A named entity is a word or series of words that designates an object of reality. NER has the task of recognizing these names from a text and assigning them to predefined types. For more details about the functionality of the NER, see the related papers [24,25,26,27,28,29]. By assigning parts of speech and thus the pattern definition in the previous step, clauses can be determined in this process step which are to be extracted. In the last step relation detection, the relationships between the different entities are discovered in one text. The relations are extracted by asking “Who?”, “What?”, “When?”, “Where?”, and “Why?”. In the program, therefore, an unprocessed text is inserted (input), which the program dissects into a list of tuples (entity, relationship, entity) (output).
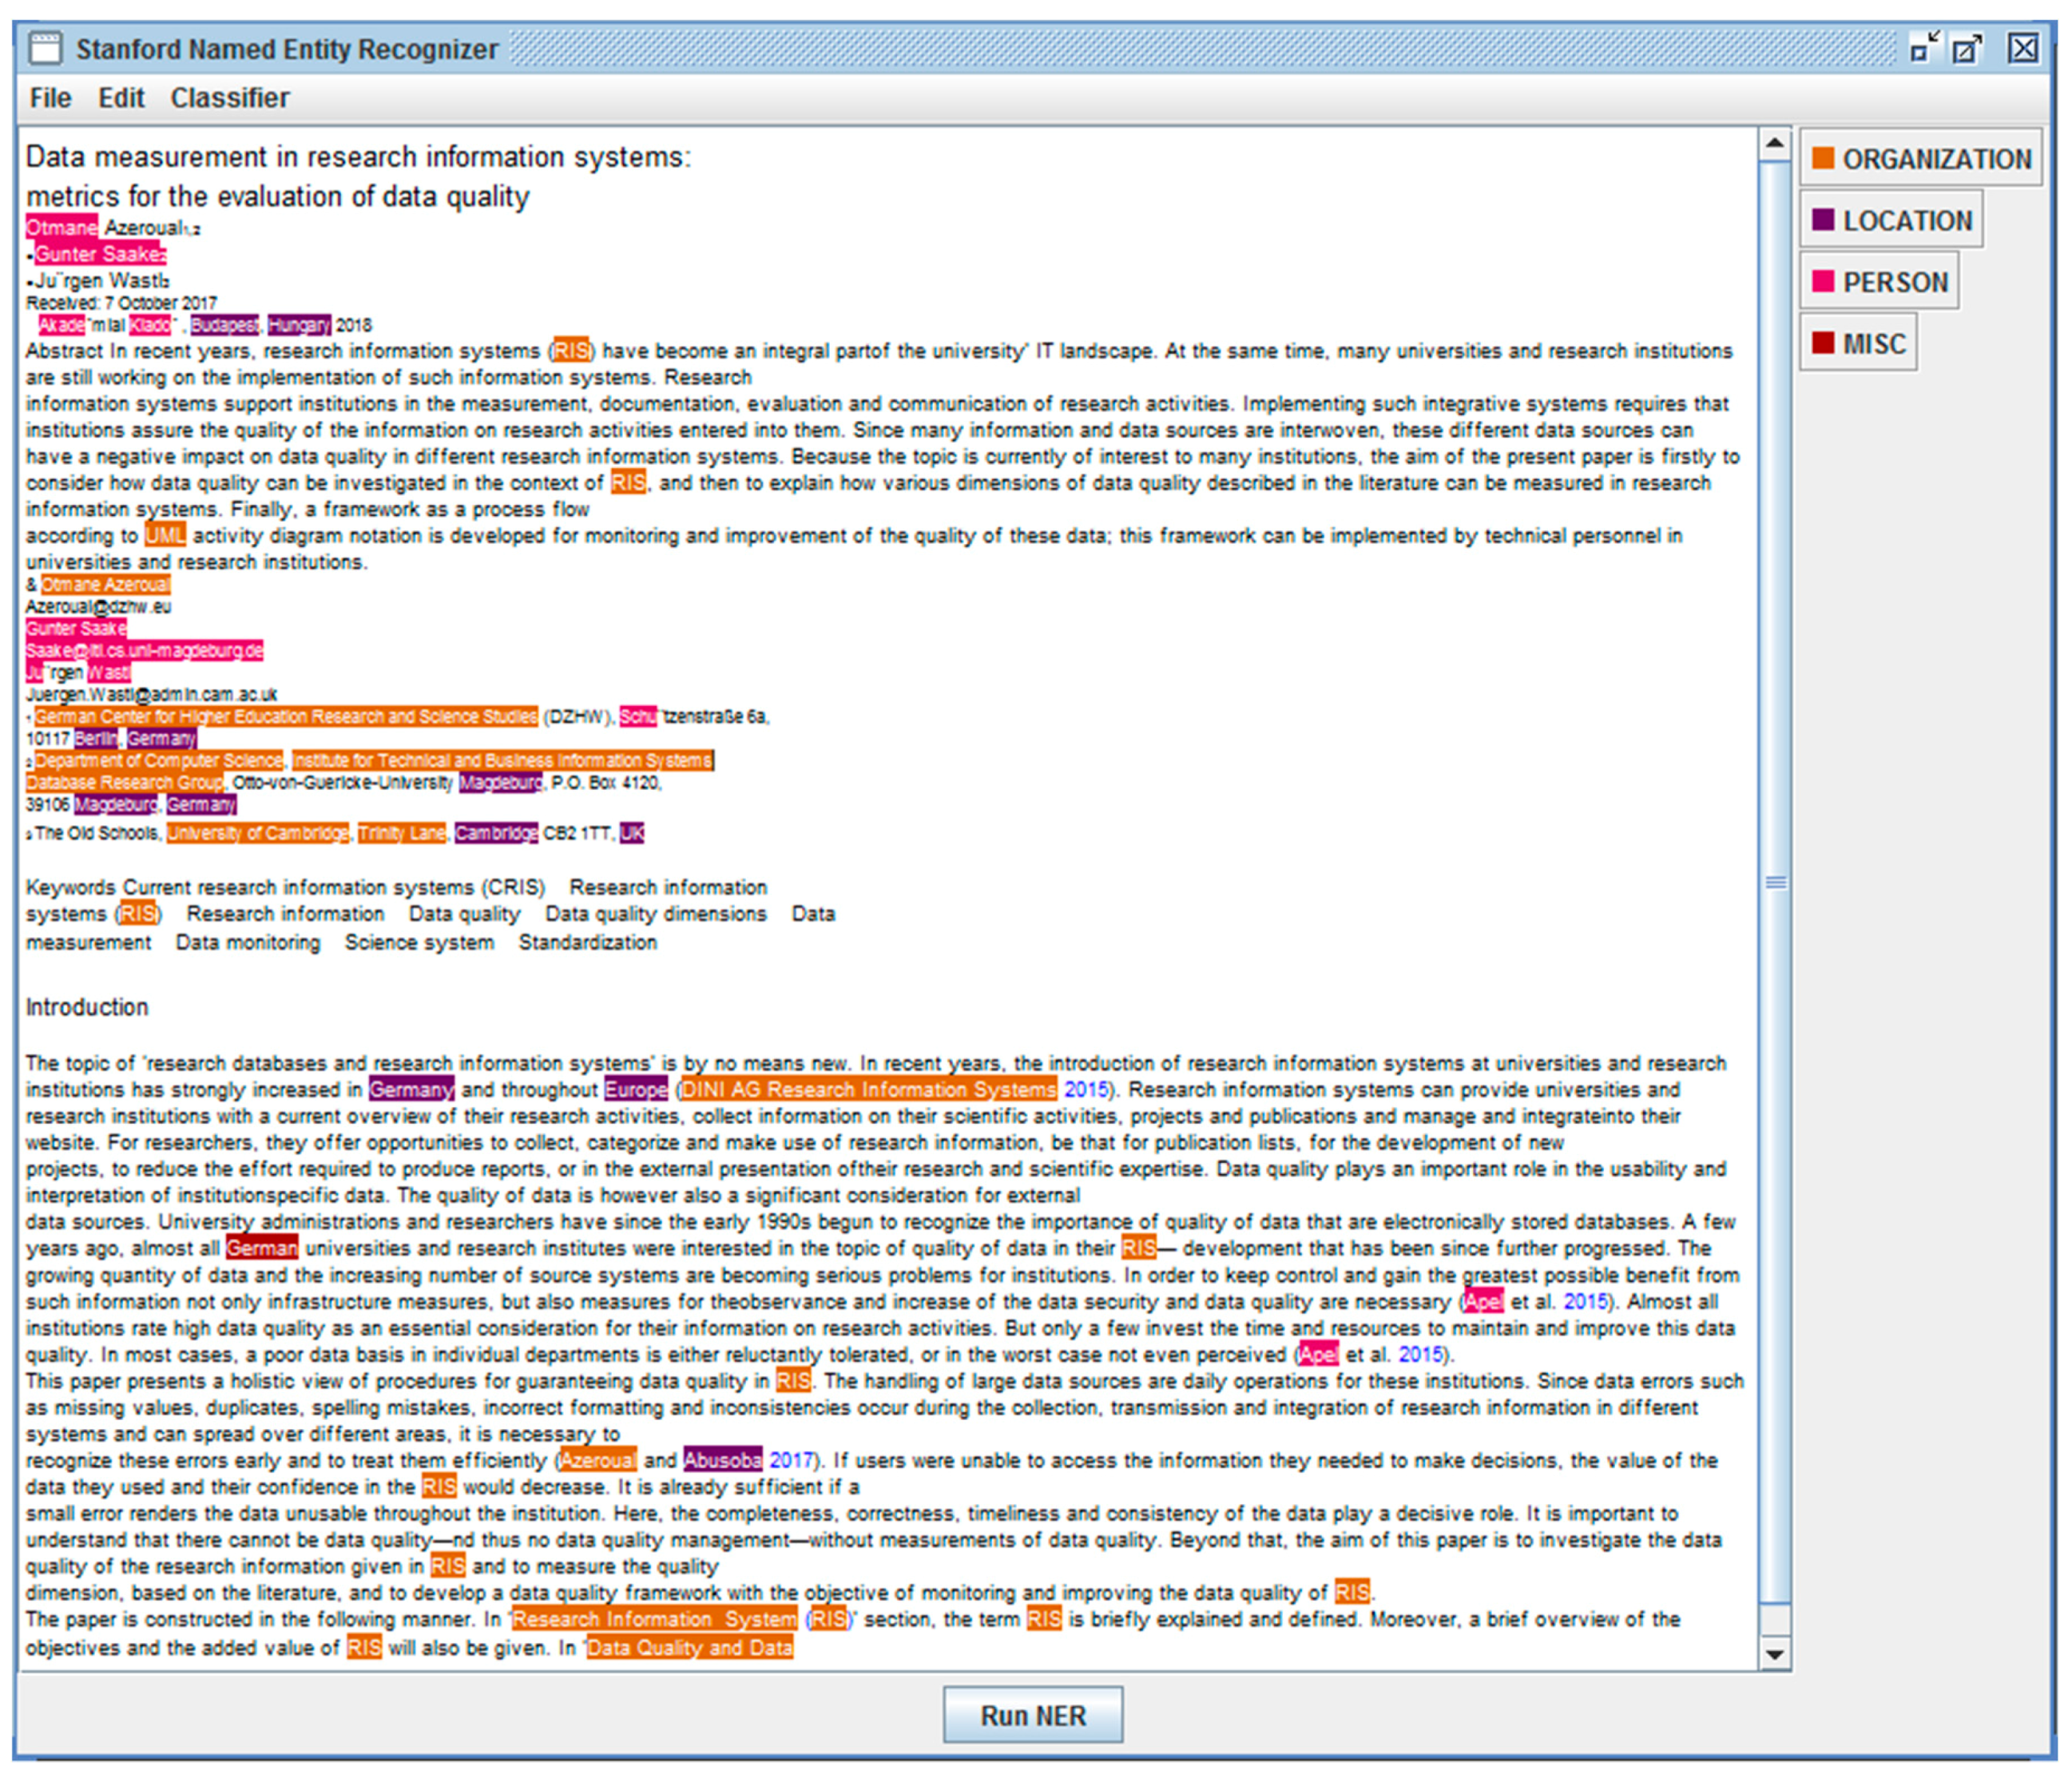
To answer the question of how named entities can be identified in research information, Figure 4 shows a practice example of entity extraction in a publication text that extracted people, organizations, and locations. For this, the tool of Stanford-NER was used in the implementation for NER. CRIS manager can perform NER using Stanford-NER through a graphical user interface that can be operated with little technical knowledge. With Stanford-NER, questions about the quantitative aspects of persons, locations, and organizations can be dealt with. These include questions such as: How many personal names are named in a text? What is the distribution of place names in the text? Which locations are mentioned? In what context are organizations called?
The first step of the NER is to teach the computer how to recognize the words that should be marked as the named entity. For this purpose, a number of features are defined, which are statistically evaluated by the tool (features) and thus should make the most accurate possible detection possible. With the help of these features predefined in the tool, a process called machine learning can be carried out. The learning process of the NER tool is to match these features to a manually annotated text; the so-called training corpus. The result of this comparison is the NER model. The number of features that a tool takes into account can vary. Only the combination of different features leads to good results in automatic recognition, as named entities can have different meanings in different contexts. However, entities can also be found in a list of annotations that notes and returns the start and end points, or the start point and length of the entity in the text and entity type. In NER, entities are localized in the text (by displacement and length or endpoint) and assigned to an entity type. In addition, entity annotations can be supplemented by confidence values, which should provide a measure of the precision of the extracted entity.
For the combination of different entity extraction services, the classification schemes used for the entity types play a major role. The most common schemes in the context of CRIS are as follows:
- Named Entities (ENAMEX) with PERSON, LOCATION, and ORGANIZATION;
- Time expressions (TIMEX) with DATE and TIME;
- Number expressions (NUMEX) with MONEY (financial terms) and PERCENT (percentages).
3.3. Clustering
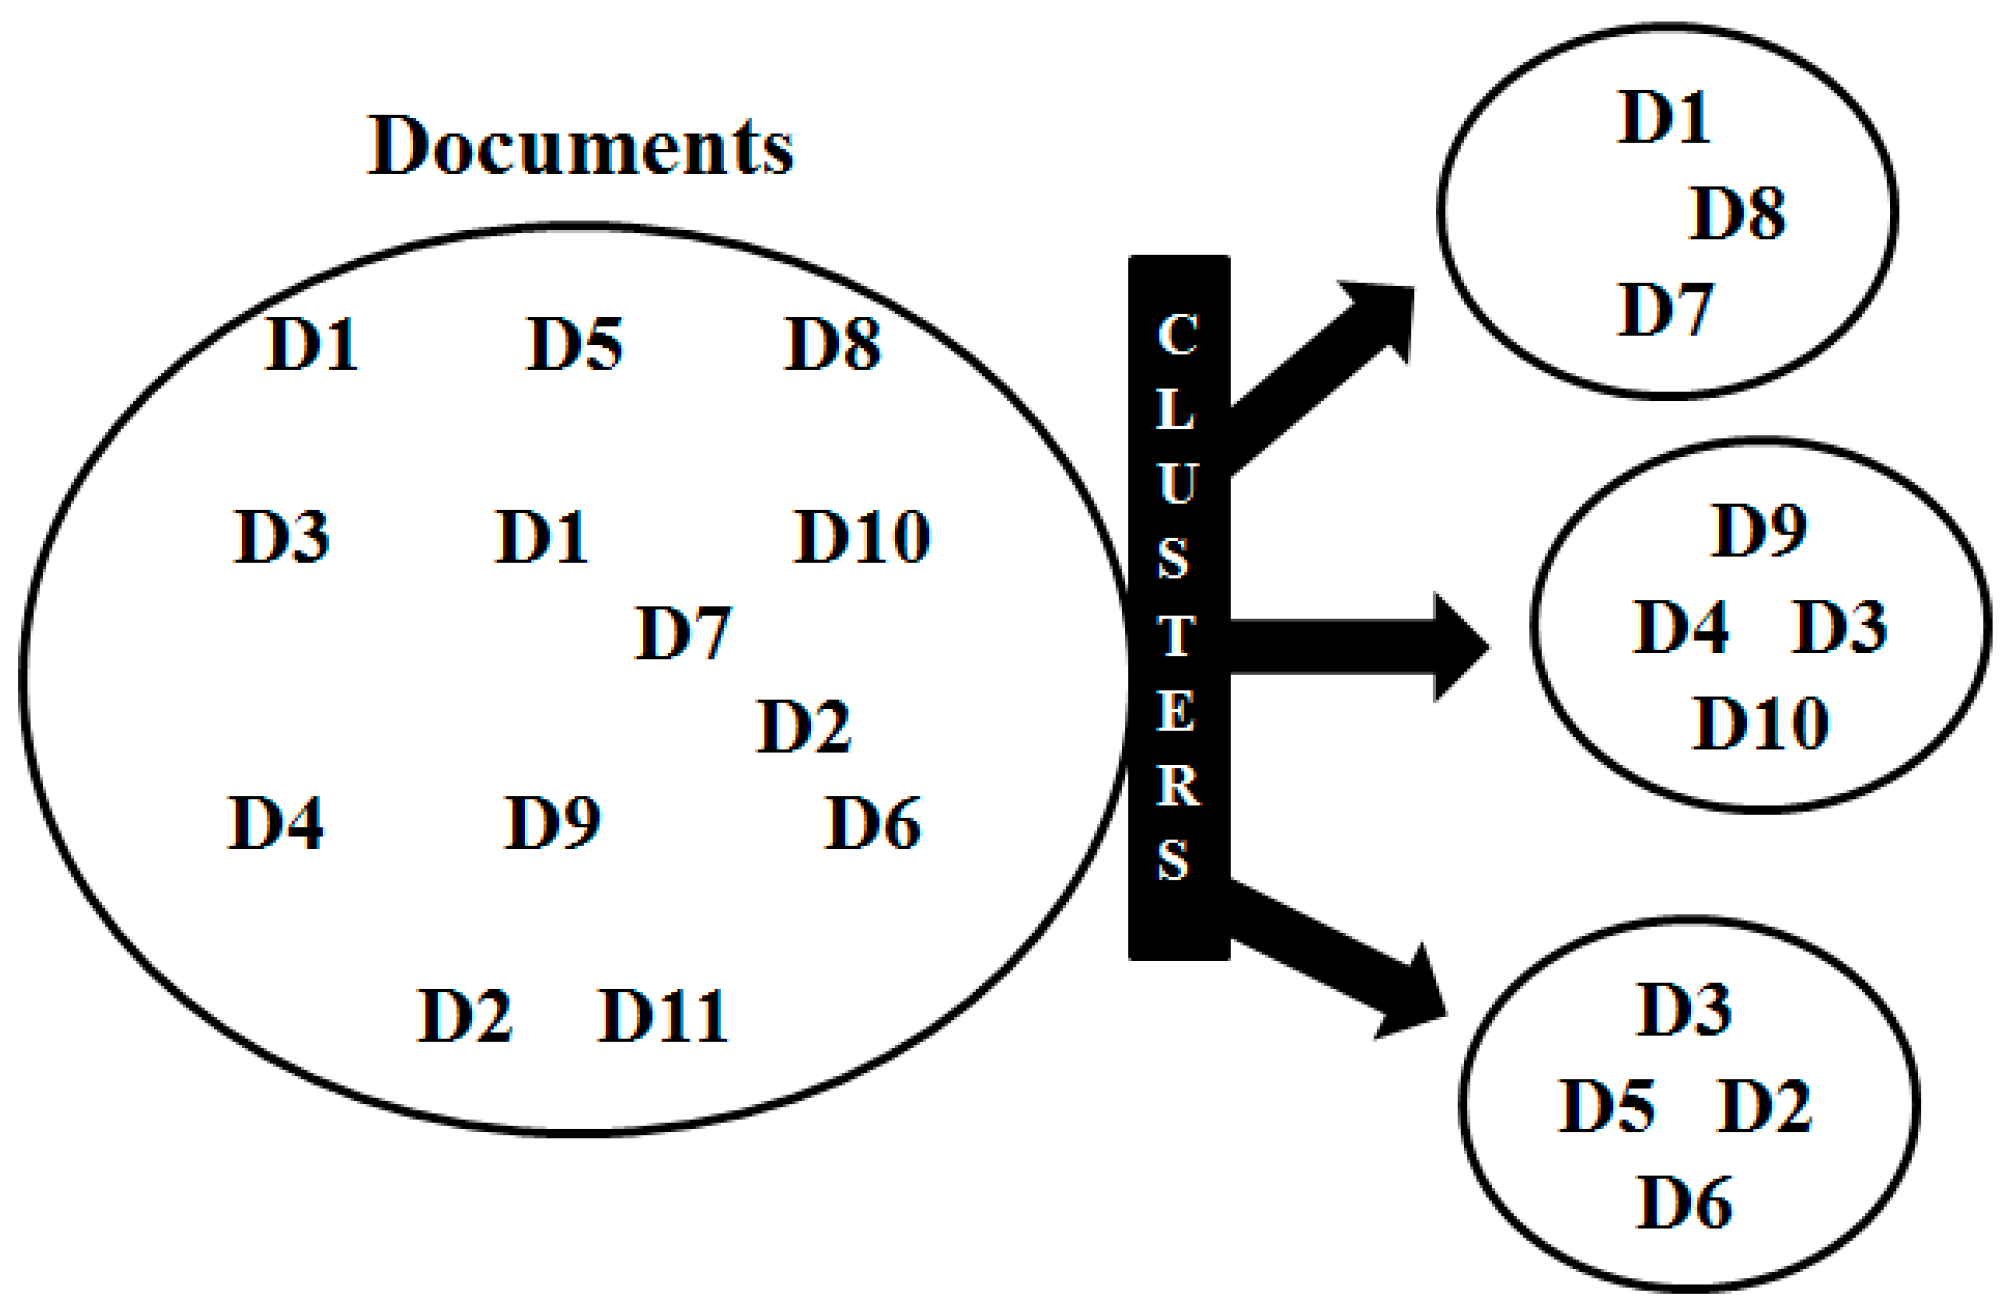
Clustering algorithms can be used in CRIS to quickly find and group similar content of documents or words, as well as to detect duplicates (see Figure 5).
The cluster analysis allows building a structure for the objects. Unlike classification, clustering does not use a predefined set of terms or taxonomies that are used to group the documents. Instead, cluster analysis allows to build a structure for the objects. The goal of cluster analysis is to maximize differences between groups and to minimize differences within each group as much as possible.
The process of cluster analysis or document clustering in the context of CRIS can be traversed in three phases:
- Preparation of data.
- Determination of similarities between data objects or document representations.
- Grouping of data objects or document representations.
To determine the similarity between documents, different similarity measures are defined. “A similarity measure is a relation between a pair of objects and a scalar number. Common intervals used to mapping the similarity are [−1,1] or [0,1], where 1 indicates the maximum of similarity” [31].
In order to consider the similarity between two numbers x and y, the following is assumed [31]:
Let two time series X = , Y = , some similarity measures are [12]:
Mean similarity defined as:
Root mean square similarity:
Additionally, peak similarity:
There are several algorithms that form classes of documents because of these similarity measures. In the context of CRIS, only k-means and hierarchical clustering are considered, to which many have referred in the literature and used by the author in practice.
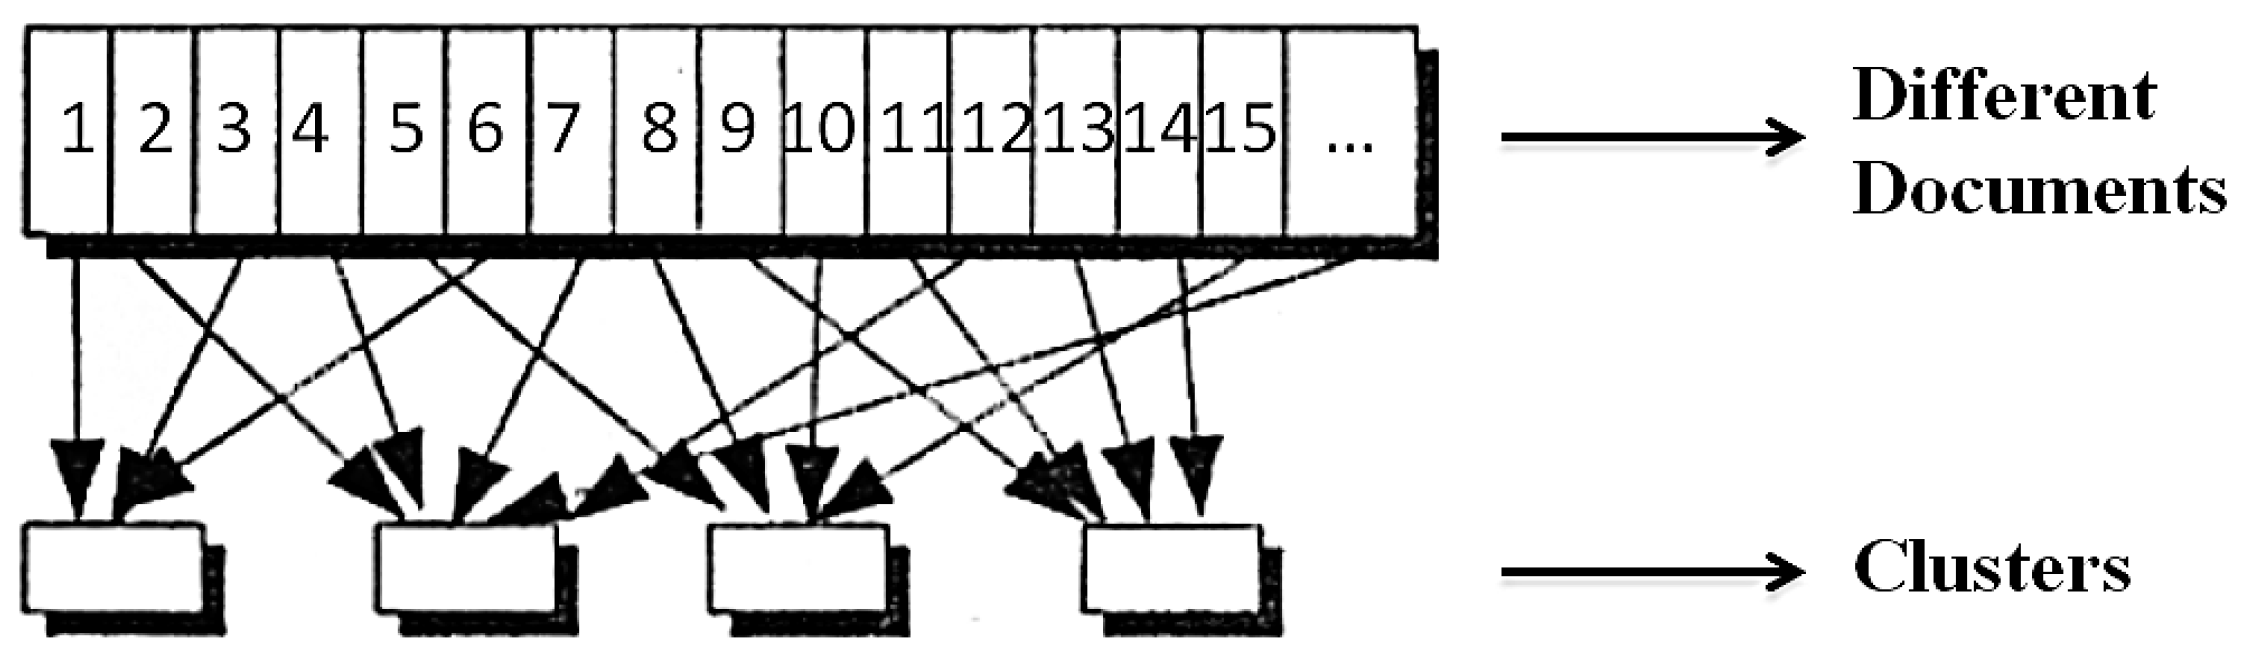
K-means is a classic and widely used method of clustering. The basic idea is simply to distribute the amount of documents on k clusters of similar documents (see Figure 6).
There are six steps that describe the k-means algorithm:
- Distribute all documents on k clusters.
- Compute the mean vector for each cluster using the following formula.
- Compare all documents with the average vectors of all clusters and note the most similar for each document.
- Move all documents into the most similar clusters.
- If no documents have been moved to another cluster, hold; otherwise go to point (2).
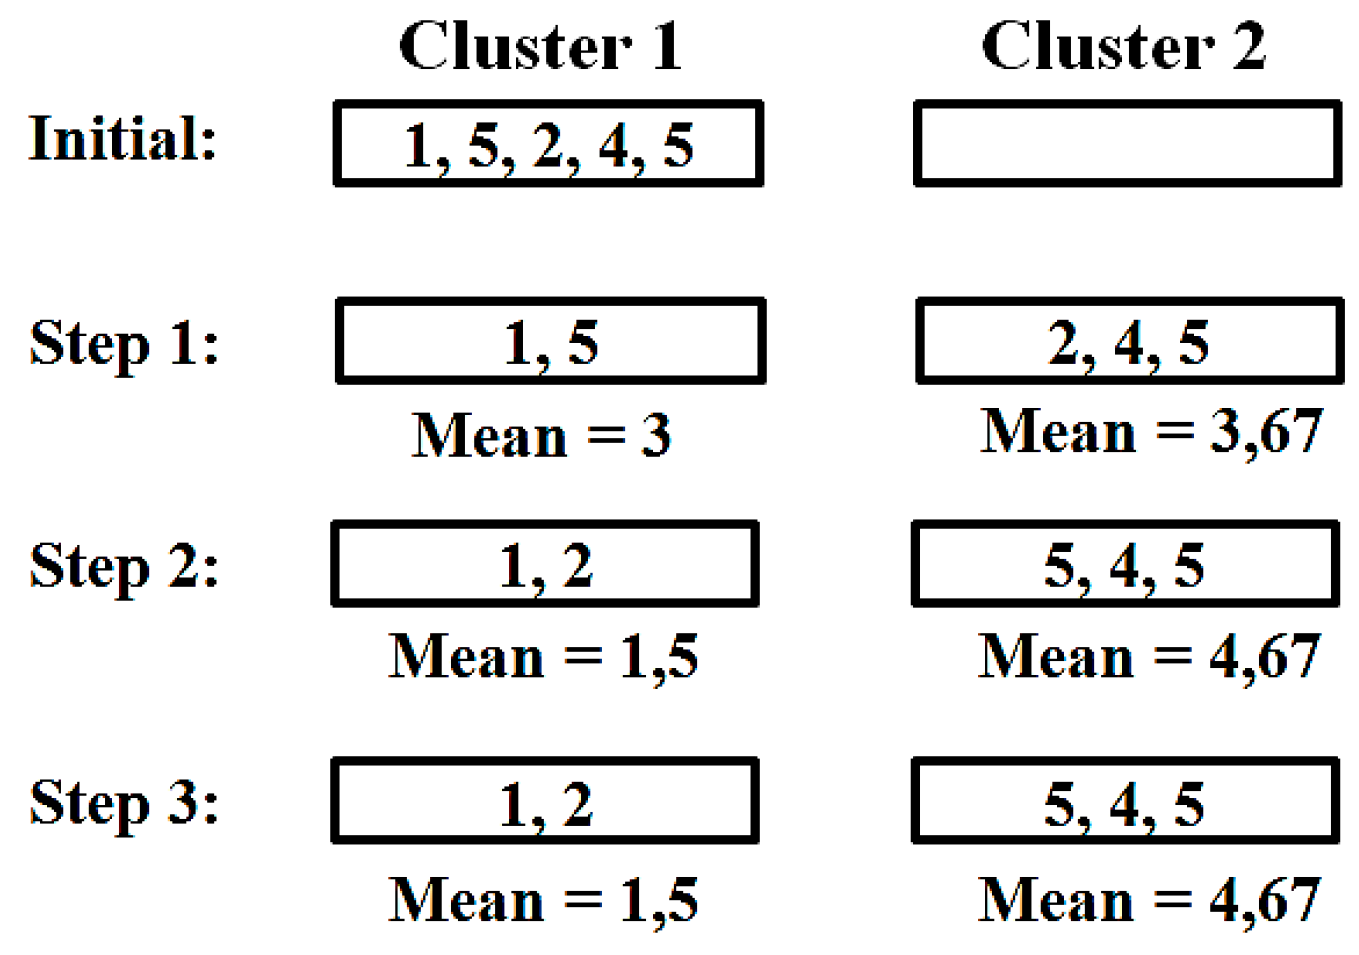
Figure 7 is a calculation example for k-means clustering. The simplified example shows the algorithm for two clusters. A single number (one-dimensional vector) represents one document each. After three steps, the procedure stops. In each step, their average vectors are calculated for the clusters.
Hierarchical (agglomerative) clustering (HAC) is a popular alternative to k-means. Clusters are also created here, but arranged in a hierarchical tree structure. Many different similarity measures can be used, including the average, single/complete link, but also the minimum and maximum spacing of documents within a cluster [32]. HAC has made significant studies in the theoretical community and in the application by practitioners. See the related papers [33,34,35,36].
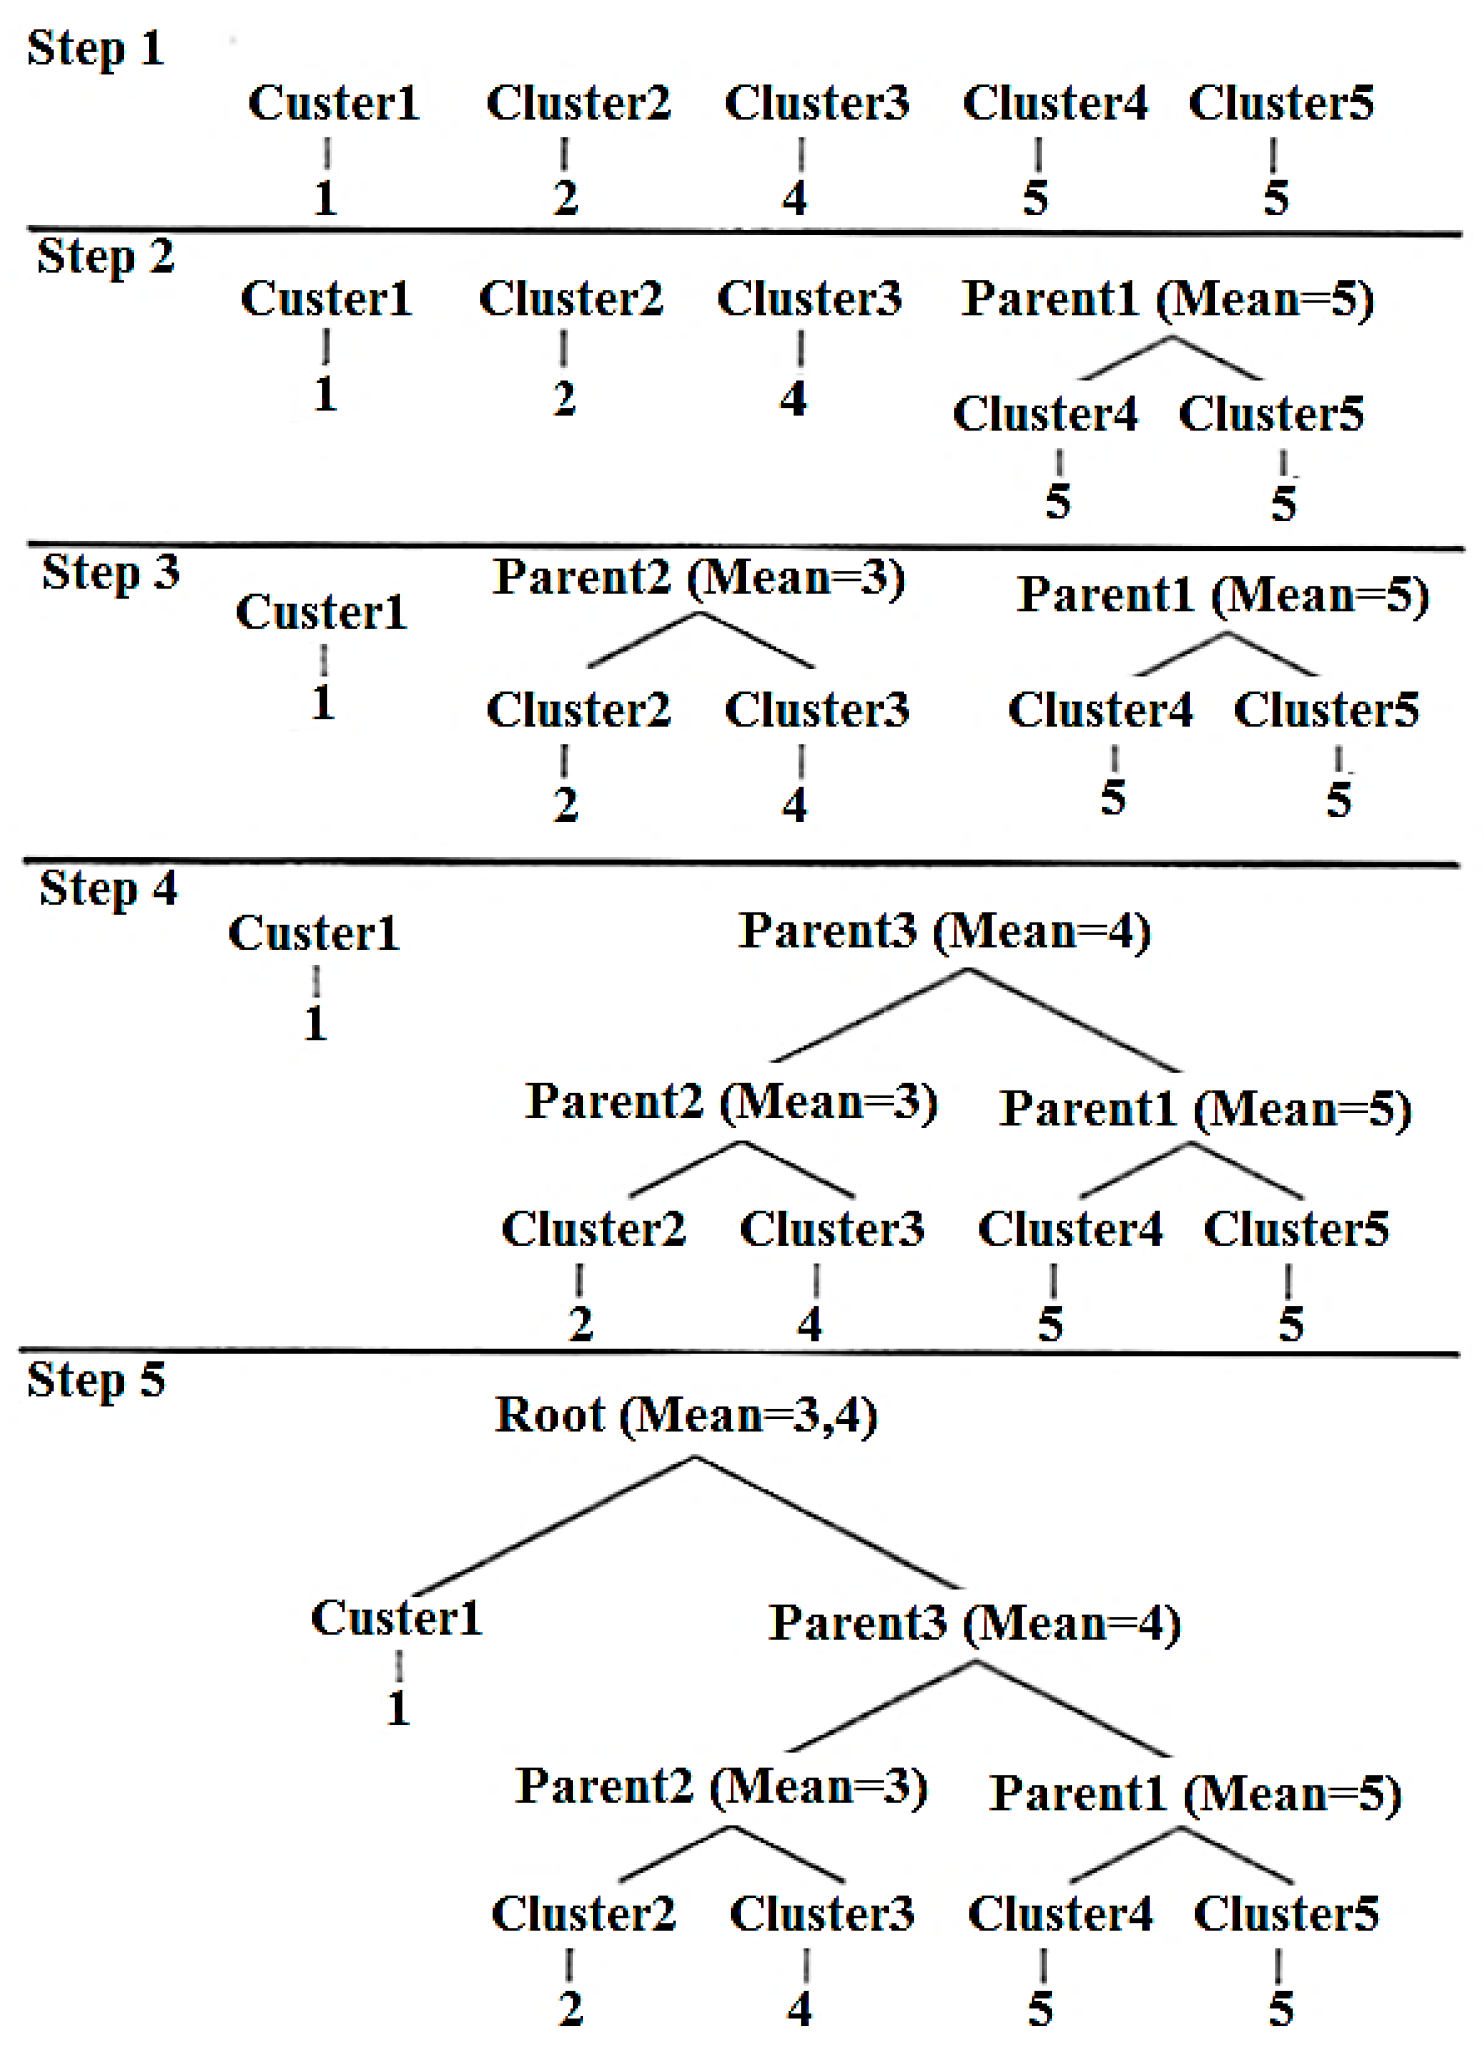
HAC algorithm works in four steps:
- Start with many clusters, each containing exactly one document.
- Find the most similar pair B and C of clusters that do not have a parent node.
- Combine B and C into a parent cluster A.
- If more than one cluster is left without parents, go to (2).
The end result is a binary tree in which the root represents a cluster of all documents. The children each represent a division of the parent cluster into two smaller ones. Finally, the leaves contain the smallest clusters, usually with only one document at a time.
There are many different ways to group the clusters in such a binary tree (see Figure 8). That is, it can additionally process the tree to get a more subfigure number of clusters. One way to do this would be to cut off the tree from a certain depth, the result being a fixed number of clusters plus a balanced tree. Another approach is to tailor the tree so that the variance becomes as small as possible.
The advantage of the HAC is the ability to tailor the resulting binary tree more or less arbitrarily, so a useful and expedient number of clusters can be derived directly from the tree instead of calculating the variance over several runs of different k, as in k-means is the case.
In summary, HAC is worthwhile, especially if a hierarchy of documents is required.
If such a hierarchy is not necessary, k-means is better suited in many cases. In addition, both algorithms are not only suitable for clustering documents, but also of any data that can be represented as a vector and also used for this purpose.
The benefit of clustering documents (or texts) in CRIS is the combination of the properties of a document collection. Since individual documents are analyzed, they can also be examined for redundancies and frequencies. Very similar documents such as bug reports with the same problems can be detected. In this way, the same objects can count or prevent redundancies by deleting duplicates. It also reduces the size of the clusters. Figure 9 shows a practice example of clustering using the Graphileon tool and MeaningCloud. This allows to find the structures in the data and to divide the data. By means of algorithms text documents with similar content are automatically divided into groups (clusters). However, even within a text document clusters can be formed to group words. In this case, objects with similar properties are grouped together, whereas the objects of different clusters differ from each other.
4. Conclusions
The steady growth of data and especially of textual data in the constantly expanding organizational environment leads to the necessity to integrate TDM into CRIS. TDM is versatile and plays a major role in the research management area, which is mainly confronted with research information in text form. Finding such research information is inefficient and time consuming over traditional search engines. Therefore, the paper introduces a TDM application in CRIS, so that the institutions provide their decision-makers (ministry, authorities, etc.) with an information service that quickly and promptly provides the relevant information of interest. TDM makes an important and valuable contribution to channel the existing flood of data, generate knowledge, and ultimately prevent or at least manage the information overload.
The existing part of this paper was to position the TDM as a method for the identification, exploration, and presentation of knowledge, and to transform unstructured data into structured data in CRIS. The unstructured data should also be used to gain knowledge and for this, the need for the development and use of TDM methods emerged. After examining the three important TDM methods with the practical examples, it has been found that the TDM analysis can be performed on every CRIS and that it offers a good performance with significant success factor for CRIS managers. In CRIS, TDM has already successfully arrived as a collection of data analysis methods and helps generate information to improve the quality of research information. The paper can be used as a basis for the CRIS-using institutions presented here, offering an appropriate approach and a rough understanding of the methods and tools of the TDM so that the employees in the field of research management can see the potential of TDM in CRIS and benefit from its concept. To support organizations in the implementation of the TDM, there is a range of tools to generate valuable insight from the available data.
Funding
This research received no external funding.
Conflicts of Interest
The authors declare no conflict of interest.
References
- Azeroual, O.; Saake, G.; Abuosba, M. Data quality measures and data cleansing for research information systems. J. Digit. Inf. Manag. 2018, 16, 12–21. [Google Scholar]
- Azeroual, O.; Saake, G.; Schallehn, E. Analyzing data quality issues in research information systems via data profiling. Int. J. Inf. Manag. 2018, 41, 50–56. [Google Scholar] [CrossRef]
- Azeroual, O.; Saake, G.; Wastl, J. Data measurement in research information systems: Metrics for the evaluation of data quality. Scientometrics 2018, 115, 1271–1290. [Google Scholar] [CrossRef]
- Azeroual, O.; Schöpfel, J. Quality issues of CRIS data: An exploratory investigation with universities from twelve countries. Publications 2019, 7, 14. [Google Scholar] [CrossRef]
- Azeroual, O. A text and data analytics approach to enrich the quality of unstructured research information. Comput. Inf. Sci. 2019, 12, 84–95. [Google Scholar] [CrossRef]
- Azeroual, O.; Abuosba, M. Improving the data quality in the research information systems. Int. J. Comput. Sci. Inf. Secur. 2017, 15, 82–86. [Google Scholar]
- Azeroual, O.; Saake, G.; Abuosba, M.; Schöpfel, J. Text data mining and data quality management for research information systems in the context of open data and open science. In Proceedings of the 3rd International Colloquium on Open Access—Open Access to Science Foundations, Issues and Dynamics, Rabat, Morocco, 28–30 November 2018; pp. 29–46. [Google Scholar]
- Azeroual, O.; Saake, G.; Abuosba, M.; Schöpfel, J. Quality of research information in RIS databases: A multidimensional approach. In Proceedings of the 22nd International on Business Information Systems, BIS 2019, Seville, Spain, 26–28 June 2019; Volume 353, pp. 337–349. [Google Scholar]
- Mehler, A.; Wolff, C. Perspektiven und Positionen des Text Mining. LDV Forum 2005, 20, 1–18. [Google Scholar]
- Nahm, U.Y.; Mooney, R.J. Text mining with information extraction. In Proceedings of the AAAI-2002 Spring Symposium on Mining Answers from Texts and Knowledge Bases, Stanford, CA, USA, 25–27 March 2002. [Google Scholar]
- Rajman, M.; Besançon, R. Text mining: Natural language techniques and text mining applications. In Proceedings of the Data Mining and Reverse Engineering. IFIP—The International Federation for Information Processing, Leysin, Switzerland, 7–10 October 1998; Springer: Boston, MA, USA, 1998; pp. 50–64. [Google Scholar]
- Feldman, R.; Sanger, J. The Text Mining Handbook: Advanced Approaches in Analyzing Unstructured Data; Cambridge University Press: Cambridge, UK, 2007. [Google Scholar]
- Wang, R.Y.; Strong, D.M. Beyond accuracy: What data quality means to data consumers. J. Manag. Inf. Syst. 1996, 12, 5–33. [Google Scholar] [CrossRef]
- Redman, T.C. Data Driven: Profiting from your Most Important Business Asset; Harvard Business Publishing: Brighton, MA, USA, 2013. [Google Scholar]
- Redman, T.C. Data quality management past, present, and future: Towards a management system for data. In Handbook of Data Quality; Springer: Berlin/Heidelberg, Germany, 2012. [Google Scholar]
- Aggarwal, C.C.; Zhai, C.X. Mining Text Data; Springer: Berlin, Germany, 2012. [Google Scholar]
- Feldman, R.; Dagan, I. Knowledge discovery in textual databases (KDT). In Proceedings of the First International Conference on Knowledge Discovery and Data Mining (KDD-95), Montreal, QC, Canada, 20–21 August 1995; AAAI Press: Palo Alto, CA, USA, 1995; pp. 112–117. [Google Scholar]
- Van der Aalst, W. Process Mining: Discovery, Conformance and Enhancement of Business Processes; Springer: Berlin, Germany, 2011. [Google Scholar]
- He, W. Improving user experience with case-based reasoning systems using text mining and Web 2.0. Expert Syst. Appl. 2013, 40, 500–507. [Google Scholar] [CrossRef]
- Natarajan, M. Role of text mining in information extraction and information management. DESIDOC Bull. Inf. Technol. 2005, 25, 31–38. [Google Scholar] [CrossRef]
- Kao, A.; Poteet, S. (Hrsg.): Natural Language Processing and Text Mining; 1. Auflage; Springer: London, UK, 2007; pp. 1–7. [Google Scholar]
- Miller, T.W. Data and Text Mining; Internat. ed.; Pearson Prentice Hall: Upper Saddle River, NJ, USA, 2005. [Google Scholar]
- Weiss, S.; Indurkhya, N.; Zhang, T. Fundamentals of PreZdictive Text Mining; Springer: London, UK; New York, NY, USA, 2010. [Google Scholar]
- Asahara, M.; Matsumoto, Y. Japanese named entity extraction with redundant morphological analysis. In Proceedings of the 2003 Conference of the North American Chapter of the Association for Computational Linguistics on Human Language Technology, NAACL’03, Edmonton, AB, Canada, 27 May–1 June 2003; Volume 1, pp. 8–15. [Google Scholar]
- Collins, M.; Singer, Y. Unsupervised models for named entity classification. In Proceedings of the Joint SIGDAT Conference on Empirical Methods in Natural Language Processing and Very Large Corpora, College Park, MD, USA, 21–22 June 1999; pp. 100–110. [Google Scholar]
- Cucerzan, S.; Yarowsky, D. Language independent NER using a unified model of internal and contextual evidence. In Proceedings of the 6th Conference on Natural Language Learning, COLING’02, Stroudsburg, PA, USA, 31 August 2002; Volume 20, pp. 1–4. [Google Scholar]
- McCallum, A.; Li, W. Early results for named entity recognition with conditional random fields, feature induction and web-enhanced lexicons. In Proceedings of the Seventh Conference on Natural Language Learning at HLT-NAACL 2003, CONLL’03, Edmonton, AB, Canada, 27 May–1 June 2003; Volume 4, pp. 188–191. [Google Scholar]
- Nadeau, D.; Sekine, S. A survey of named entity recognition and classification. Linguist. Investig. 2007, 30, 3–26. [Google Scholar]
- Rao, D.; McNamee, P.; Dredze, M. Entity linking: Finding extracted Entities in a knowledge base. In Multi-Source, Multilingual Information Extraction and Summarization. Theory and Applications of Natural Language Processing; Springer: Berlin/Heidelberg, Germany, 2012; Volume 18, pp. 93–115. [Google Scholar]
- Bird, S.; Klein, E.; Loper, E. Natural Language Processing with Python: Analyzing Text with the Natural Language Toolkit; O’Reilly Media: Newton, MA, USA, 2009. [Google Scholar]
- Cassisi, C.; Montalto, P.; Aliotta, M.; Cannata, A.; Pulvirenti, A. Similarity measures and dimensionality reduction techniques for time series data mining. In Advances in Data Mining Knowledge Discovery and Application; Karahoca, A., Ed.; IntechOpen: London, UK, 2012. [Google Scholar]
- Yadav, N.; Kobren, A.; Monath, N.; McCallum, A. Supervised hierarchical clustering with exponential linkage. In Proceedings of the 36th International Conference on Machine Learning, Long Beach, CA, USA, 10–15 June 2019; Volume 97, pp. 6973–6983. [Google Scholar]
- Gan, Q.; Wei, W.C.; Johnstone, D. A faster estimation method for the probability of informed trading using hierarchical agglomerative clustering. Quant. Financ. 2015, 15, 1805–1821. [Google Scholar] [CrossRef]
- Ieva, C.; Gotlieb, A.; Kaci, S.; Lazaar, N. Discovering program topoi via hierarchical agglomerative clustering. IEEE Trans. Reliab. 2019, 67, 73–80. [Google Scholar] [CrossRef]
- Tie, J.; Chen, W.; Sun, C.; Mao, T.; Xing, G. The application of agglomerative hierarchical spatial clustering algorithm in tea blending. Clust. Comput. 2018, 22, 6059–6068. [Google Scholar] [CrossRef]
- Xu, Z.; Xuan, J.; Lui, J.; Cui, X. MICHAC: Defect prediction via feature selection based on maximal information coefficient with hierarchical agglomerative clustering. In Proceedings of the IEEE 23rd International Conference on Software Analysis, Evaluation and Reengineering (SANER), Suita, Japan, 14–18 March 2016. [Google Scholar]
Figure 1.
Workflow for text and document analysis in current research information systems (CRIS).

Figure 2.
Application of natural language processing functions.

Figure 3.
Information extraction process [30].
Figure 3.
Information extraction process [30].

Figure 4.
Extracting entities from the example of publication text in CRIS.

Figure 5.
Formation of clusters [5].
Figure 5.
Formation of clusters [5].

Figure 6.
Function of the k-means algorithmus [5].
Figure 6.
Function of the k-means algorithmus [5].

Figure 7.
Example calculation with k-means clustering [5].
Figure 7.
Example calculation with k-means clustering [5].

Figure 8.
Example calculation of a hierarchical agglomerative clustering [5].
Figure 8.
Example calculation of a hierarchical agglomerative clustering [5].

Figure 9.
Example for clustering of documents.

© 2019 by the author. Licensee MDPI, Basel, Switzerland. This article is an open access article distributed under the terms and conditions of the Creative Commons Attribution (CC BY) license (http://creativecommons.org/licenses/by/4.0/).
Share and Cite
MDPI and ACS Style
Azeroual, O. Text and Data Quality Mining in CRIS. Information 2019, 10, 374. https://0-doi-org.brum.beds.ac.uk/10.3390/info10120374
AMA Style
Azeroual O. Text and Data Quality Mining in CRIS. Information. 2019; 10(12):374. https://0-doi-org.brum.beds.ac.uk/10.3390/info10120374
Chicago/Turabian StyleAzeroual, Otmane. 2019. "Text and Data Quality Mining in CRIS" Information 10, no. 12: 374. https://0-doi-org.brum.beds.ac.uk/10.3390/info10120374
Note that from the first issue of 2016, this journal uses article numbers instead of page numbers. See further details here.