Container Terminal Logistics Generalized Computing Architecture and Green Initiative Computational Pattern Performance Evaluation


1
Waterway Transportation Planning and Design Branch, Shandong Provincial Communications Planning and Design Institute, Jinan 250031, China
2
School of Transportation, Fujian University of Technology, Fuzhou 350118, China
*
Author to whom correspondence should be addressed.
Information 2019, 10(12), 383; https://0-doi-org.brum.beds.ac.uk/10.3390/info10120383
Submission received: 21 October 2019
/
Revised: 1 December 2019
/
Accepted: 2 December 2019
/
Published: 5 December 2019
Abstract
:Container terminals are the typical representatives of complex supply chain logistics hubs with multiple compound attributes and multiple coupling constraints, and their operations are provided with the strong characteristics of dynamicity, nonlinearity, coupling, and complexity (DNCC). From the perspective of computational logistics, we propose the container terminal logistics generalized computing architecture (CTL-GCA) by the migration, integration, and fusion of the abstract hierarchy, design philosophy, execution mechanism, and automatic principles of computer organization, computing architecture, and operating system. The CTL-GCA is supposed to provide the problem-oriented exploration and exploitation elementary frameworks for the abstraction, automation, and analysis of green production at container terminals. The CTL-GCA is intended to construct, evaluate, and improve the solution to planning, scheduling, and decision at container terminals, which all are nondeterministic polynomial hard problems. Subsequently, the logistics generalized computational pattern recognition and performance evaluation of a practical container terminal service case study is launched by the qualitative and quantitative approach from the sustainable perspective of green production. The case study demonstrates the application, utilization, exploitation, and exploration of CTL-GCA preliminarily, and finds the unsustainable patterns of production at the container terminal. From the above, we can draw the following conclusions. For one thing, the CTL-GCA makes a definition of the abstract and automatic running architecture of logistics generalized computation for container terminals (LGC-CT), which provides an original framework for the design and implementation of control and decision mechanism and algorithm. For another, the CTL-GCA can help us to investigate the roots of DNCC thoroughly, and then the CTL-GCA makes for conducting the efficient and sustainable running pattern recognition of LGC-CT. It is supposed to provide a favorable guidance and supplement to define, design, and implement the agile, efficient, sustainable, and robust task scheduling and resource allocation for container terminals by computational logistics whether in the strategy level or the tactical one.
1. Introduction
Container terminals are the multimodal transportation hubs of the global supply chain and the buffer pool group for converting transportation modes, which plays an important role in containerization. Container terminal logistics systems (CTLS) are the discrete event dynamic systems, distributed heterogeneous control systems, parallel reconfigurable processing systems, and very large-scale complex service systems under dynamic and uncertain environments. Thereupon, the job planning, task scheduling, resource allocation, decision making, and performance evaluation for CTLS, which is known simply as PSAME, all are the typical representative of a nondeterministic polynomial hard problem (NP-Hard), and the PSAME have become more computationally expensive as terminals and carriers both are continuously upgrading. Moreover, the PSAME usually possess the strong characteristics of dynamicity, nonlinearity, coupling, and complexity (DNCC) whether for local scheduling or synergic decision making. Therefore, the PSAME for CTLS have been the difficult points and hot spots of complex logistics systems, especially under the industry background that container ships and terminals are increasingly large-scale and green and the new logistics alliances are emerging constantly [1,2,3,4,5,6,7].
Thereupon, a lot of literature review and discuss the issue of PSAME at container terminals from the perspectives of various logistics service facilities and equipment allocation and synergy, such as berth, quay crane (QC), yard crane (YC), and so on [8,9,10,11,12]. The research methodology of most contributions is the fractional or whole combination of mathematical programming, system simulation, intelligent optimization, and simulation based optimization. Those are the classical solutions to the operational research and PSAME in the logistics industry. Nevertheless, the existing research usually aims at discussing the specially appointed problem on PSAME with the given optimization objectives and constraint conditions. The programming model and intelligent algorithms usually lack generality, extendibility, and portability with the considerable degree of computational complexity. Furthermore, the PSAME in CTLS have been absent a systematic methodology and engineering solution to be applicable to diverse terminal layouts, handling technologies, device configurations, task loads, and the conditions of collection and distribution. Aiming at this case, the computational logistics were proposed preliminarily by us at the 54th IEEE Conference on Decision and Control (CDC 2015) to provide a new methodology and solution to PSAME of CTLS [13]. Some original and initiatory works have been launched and developed over the past few years [14,15]. The definition of logistics generalized computation for container terminals (LGC-CT) and the proposal of container terminal oriented logistics generalized computational complexity (CTO-LGCC) are the important milestones in our previous work [16,17]. Now, the conceptual framework and fundamental principles of computational logistics was further explored and exploited in CTLS to present the container terminal logistics generalized computing architecture (CTL-GCA) in this paper, and then a practical case was studied to demonstrate the application of CTL-GCA preliminarily. It was supposed that the CTL-GCA provides an initial abstraction, automation, and analysis problem-oriented explorations frameworks of PSAME to probe into and improve the operation of container terminals.
2. Literature Review
Many scholars have launched abundant discussions about PSAME in CTLS, whether for the single resource allocation or the integrated scheduling [1,2,3]. With the continuous development of terminal handling technology and logistics service objects, the key issues are discussed constantly. Some typical studies can be sketched as follows.
On the one hand, several researches concentrate on the seaside operations of container terminals. Mauri et al. [18] proposed an adaptive large neighborhood search heuristic to solve discrete and continuous berth allocation problem. Not coincidentally, Hsu et al. [19] dealt with the dynamic and continuous berth allocation problem (DCBAP) in which both arrived and incoming ships are considered and a quay is used as a continuous line to accommodate as many ships as possible at one time. Kramer et al. [20] presented two novel formulations, a time-indexed formulation and an arc-flow one, to efficiently tackle the dynamic berth allocation problem.
Chen [21] reviewed and summarized the flexible methodology for quay crane allocation and scheduling. Azevedo et al. [22] raised a framework for solving the 3D stowage planning problem for container ships integrated with the scheduling of quay cranes problem. Msakni [23] put forward two exact methods to solve the quay crane scheduling problem where a task is defined as handling a single container and subject to different technical constraints. Meanwhile, it is an obvious tendency that the berth and quay crane both are taken into account simultaneously. Correcher et al. [24] focused on the berth allocation problem and the quay crane assignment problem in an integrated way, and proposed a new mixed integer linear model to solve. Agra et al. [25] investigated an integrated berth allocation, quay crane assignment, and scheduling problem in which a heterogeneous set of cranes was considered, and a rolling horizon metaheuristic was introduced to solve hard instances. Moreover, the uncertainty in vessel arrival times and quay crane handling rates was considered, and the recoverable robustness was introduced for the weekly berth and quay crane planning problem by Iris et al. [26].
On the other hand, there are also lots of works focused on a series of operations on the storage yard. Tan et al. [27] studied storage yard management in container terminals, and a flexible yard template strategy was proposed instead of the fixed yard template strategy. Jin et al. [28] discussed the possibility of sharing container storage space among different container handling companies in a port. Boysen et al. [29] formalized the parallel stack loading problem to intermediately store items without blocking, and the basic complexity proofs were provided. Container retrieval is also directly related to the operational efficiency of terminals, and Lin et al. [30] developed a heuristic that can generate feasible working plans for rail-mounted gantry cranes in container yards. It is similar to the operational organization on the quayside that the multiple scheduling problems on storage yard were discussed cooperatively. Tanaka et al. [31] addressed an exact algorithm for the block relocation problem with a stowage plan, and constructed a branch-and-bound algorithm with iterative deepening for unrestricted and restricted variants of this problem. Gharehgozli et al. [32] integrated yard crane scheduling and container allocation problems, and extended the generalized travelling salesman problem by introducing new constraints to solve the problem. Jiang et al. [33] combined these two closely related problems of yard crane deployment and container allocation, and formulated a mixed integer programming (MIP) model which was solved by a novel branch-and-price method to find near-optimal solutions. Galle et al. [34] introduced a novel optimization problem resulting from the combination of two major existing problems arising at storage yards in container terminals that were the yard crane scheduling problem and container relocation problem. Jaehn et al. [35] considered the problem of scheduling two identical rail mounted gantry cranes working within a single block at a seaport for the minimization of dwell times of vessels at the berth. A method of simultaneously optimizing the pickup sequence and the container rehandling strategy was proposed to reduce the rehandling of inbound containers given partial truck arrival information by Zeng et al. [36].
Furthermore, the core resources on both the quayside and storage yard were considered synchronously. Hendriks et al. [37] presented a simultaneous berth allocation and yard planning problem at a tactical level since the berth allocation had a great impact on the yard planning and vice versa, which is solved by means of an alternating berth and yard planning heuristic approach. Jin et al. [38] tackled the berthing congestion problem simultaneously with another two tactical level decision problems of berth template design and yard template design by introducing a proactive management strategy from the terminal’s perspective that adjusted the calling schedule of feeder vessels. Liu et al. [39] investigated the joint optimization of the tactical berth allocation and the tactical yard assignment at seaports, and proposed a comprehensive bi-objective mathematical model. Ma et al. [40] studied an integrated berth allocation and yard planning problem with discontinuities berth layout, a mixed integer linear programming was proposed to deal with this new problem.
In addition, some scholars launched the operational optimization research from the other perspectives. Legato et al. [41] presented a model-driven decision support system for integrated container handling with a queuing network model for resource blocking, locking, and vehicle interactions. Yu et al. [42] applied data mining approaches to predict ship arrivals, and evaluated the value of ship arrival prediction on daily operation planning. Santos et al. [43] presented a methodology for delimiting the potential hinterland of container terminals by using one of a set of possible intermodal or unimodal transportation solutions. Edirisinghe et al. [44] appraised the potential of the container exchange and its practical aspects using real container data. Further, they focused on several factors that may influence container exchange among carriers. Ha et al. [45] suggested a measurement instrument for port performance in the context of container transport logistics by taking perspectives from different port stakeholders.
It is worth mentioning that the discussion of green production and sustainable development of container terminals has attracted more and more attention. A study was conducted from a business perspective that the global container shipping sector can create value to its customers and stakeholders and go tandem with environmental aspects in the global maritime supply chains. The green operation of the calling container terminals is one of the main aspects of their competitive edge over rivals [46]. Dulebenets [47] presented a novel mixed integer nonlinear mathematical model for the green vessel scheduling problem, which directly accounts for the carbon dioxide (CO2) emission costs in sea and at ports of call. Yang [48] investigated CO2 emissions produced by two different container terminal operating models, and sought to determine energy savings and CO2 reduction strategies for shipping companies and terminal operators in order to comply with green port requirements. Tsai et al. [49] established a self-management approach of quantity of greenhouse gas and pollutant emissions from a port, and undertook nine actions to ensure the full implementation of the green port policy. Yun et al. [50] solved how to quantify the impact of mitigation strategies on the carbon emissions from port operations and shipping inside container terminals without real energy consumption data by establishing a carbon emission quantification simulation model. A convex closed-form mathematical programming model was proposed based on queueing theory to minimize CO2 emission by optimizing the number of quay cranes (QCs) by Liu et al. [51]. Yu et al. [52] suggested to consider simultaneously the CO2 emissions and workload delays to develop carbon-efficient deployment strategies. The problem of integrated berth allocation and quay crane assignment was addressed for the trade-off between time saving and energy saving in order to minimize the total departure delay of all vessels and the total handling energy consumption of all vessels by QCs [53]. Li et al. [54] addressed the ordinary level of land-side disruption where typically some truck arrivals deviate from their schedule in the appointment system, and they aim to find a response strategy that can maintain high resilience ability of the system in neutralizing the impact of disruptions. Venturini et al. [55] introduced a novel mathematical formulation that extended the classical berth allocation problem to cover multiple ports in a shipping network under the assumption of strong cooperation between shipping lines and terminals.
In order to obtain a general theoretical methodology and an engineering practice solution that both are appropriate for the PSAME in CTLS, we put forward the conception of computational logistics [13]. The computational logistics is the synthesis application of computational thinking, great principles of computing, and computational lens in the field and industry of logistics service, which was referred as 3CTGPL in our previous work [17]. Within the conceptual framework of computational logistics, some meaningful work has been initially completed. Above all, the logistics generalized computation for container terminals (LGC-CT) is defined explicitly based on the nature of the computation by computational thinking [16]. Next, we generalized, migrated, and localized the classical computational complexity theory into CTLS, and propose the container terminal oriented logistics generalized computational complexity [17]. Thirdly, another milestone is that a hierarchical, parallel, heterogeneous, and reconfigurable computation model of container terminal handling is presented based on the programming model and infrastructure of parallel computation, heterogeneous computation, and reconfigurable computation [15]. Fourthly, the underlying control mechanism in the control science and engineering, such as proportional, integral, and derivative (PID) control, is migrated into the tactical level of PSAME and obtained a good performance [56]. Fifth, the planning and scheduling mechanism and algorithm embedded in operating system and virtual machine was transferred and customized into the operation of CTLS [57,58]. Lastly, we applied the computational logistics into the performance evaluation of CTLS for the typical scenario and acquired a new perspective and insight into CTLS based on the LGC-CT [59,60]. Now, we continue our previous work, and put forward the CTL-GCA to model, optimize, evaluate, and guide the running of container terminals, especially for the sustainable development and green production of CTLS.
3. Container Terminal Logistics Generalized Computing Architecture
3.1. Container Terminal Logistics Computational Framework
The central service objects of CTLS are container ships and the accompanying collection and distribution containers. The container terminals are the storage infrastructure essentially, therefore the shipping space, the quayside berth, marshalling yard, and storage yard all are the core resources of CTLS in the true sense. Thereupon, the PSAME at container terminals should revolve around the above working space closely under conditions prescribed by shipping liners.
The process and thread are the cornerstone of task scheduling, resource allocation, concurrency control, synchronous and asynchronous execution, and collaborative operation in computer operating systems. Based on computational logistics, every calling ship and concomitant collecting and distributing container can be abstracted as a job, and may be made a further abstraction of a series of processes as soon as CTLS begin to collect export containers for the specific liner. Usually, a job involves several kinds of processes, and they can be listed as follows: The process of collecting export containers, the one of distributing import containers, the one of handling containers for ships on quayside, the one of stacking containers for liners, and the one of transferring containers in terminal. The processes define and realize the synchronous and/or asynchronous collaborative work, and are rotated to execute at the different logistics service stage. Each process also includes several asynchronous or synchronous parallel threads that are designed to be the specific implementations of loading, unloading, transferring, stacking, relocation, collection, and distribution, etc. Moreover, the threads in the different processes constitute the dynamic, flexible, and reconfigurable operating lines as required.
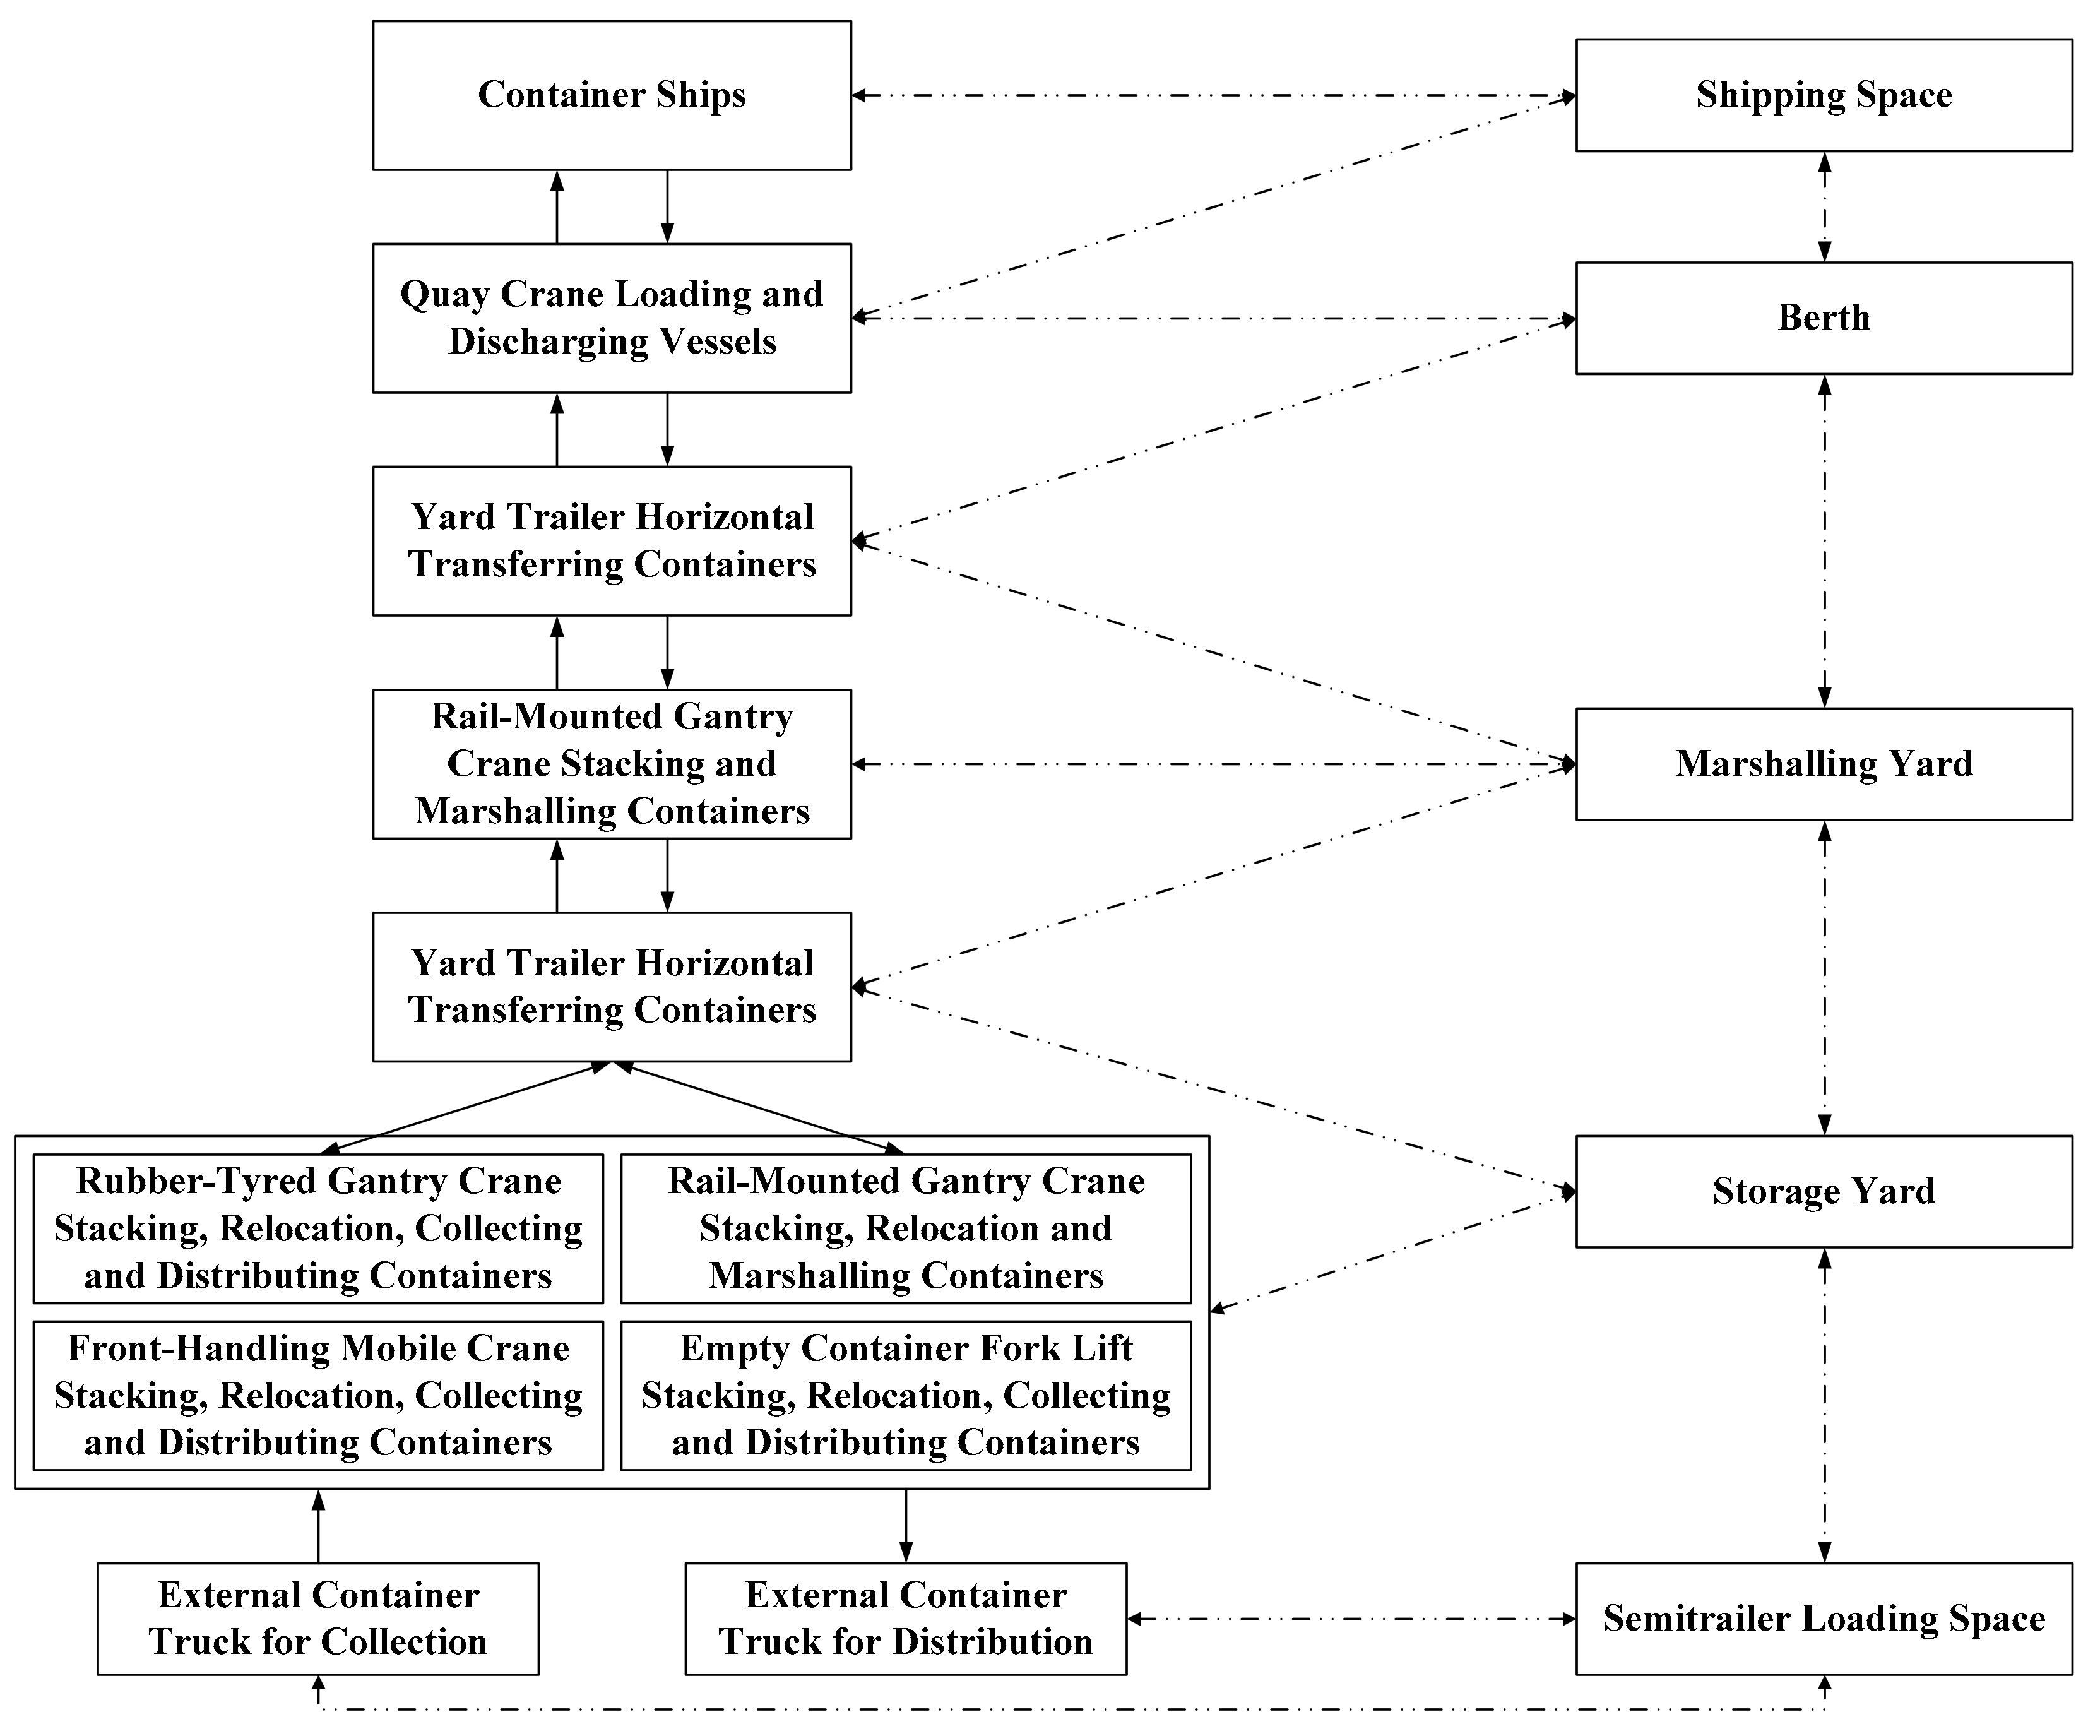
Through focusing on the above abstraction of job and process, the shipping space, quayside (including berth), marshalling yard, and storage yard all work together to construct container terminal logistics computing storage hierarchy (CTL-CSH), which is shown in Figure 1. That demonstrates that CTLS can construct the warehousing operational hierarchy which is similar to the counterpart in computer systems that is just about four-tier architecture of processor register and cache-main memory-auxiliary memory. CTLS implement, execute, and achieve the container collection and distribution of calling ships because of CTL-CSH. It is worth mentioning that CTL-CSH is the abstraction, automation, and analysis perspective from the working granularity of container logistics unit, which is called 3AP-CLU for short. Meanwhile, CTL-CSH clearly points out the differences between CTLS and computer systems. The dissimilarities are also among the root causes of DNCC, and indicate the potential optimization paradigms and improvement directions by computational logistics as well. The hierarchy and dynamic content exchange between layers are one of the eternal themes.
The CTL-CSH focuses on container terminal logistics computing master processor (CTL-CMP) that is just about quay crane equipped by the quayside. Once a calling vessel is allocated a planned berth, the handling process in the job is activated and launched immediately. As a result, the quay crane is attached by spreaders that are registers as the case stands. At the same time, the berth is just about the main memory cache, and then the marshalling yard is the main memory. Together, they constitute the scratch pad area (SPA) of CTLS. On the other side, since there are abundant calling vessels and appointment trucks for every terminal, as a matter of course, the accompanied massive collecting and distributing containers are stacked in the storage yard. So the storage yard is exactly the auxiliary memory cache, and the shipping spaces in vessels and the loading space on semitrailer are no other than the auxiliary memory. Analogously, the three construct the shared memory area (SMA) of CTLS. Based on the CTL-CSH with four tier operational architecture that is a team working analogous to register-SPA-SMA, CTLS fulfills the positioning, mapping, transferring, routing, accessing, and switching (PMTRAS) between shipping space and storage yard ultimately.
Certainly, there are some differences in memory hierarchy between CTLS and computer systems. The bottom line is that the quantity of storage types in the two is distinct. Essentially, the memory cells in computer systems only store 0 or 1, namely, a kind of content. However, the memory unit in CTLS must deal with three kinds of objects that are vessels, trucks, and containers, at least, and the former two can be regarded as the moving and temporary repository of the latter as well. The diversity leads directly to that the memory units must be classified according to service objects. As it should be, CTL-CSH mainly caters to containers. Nevertheless, it’s hard to ignore that the berth is specifically used for vessels that are the dynamic set of container delivery units.
In addition, container liner shipping follows the particular route during certain periods that contain fixed intervals and specific ports. Hence, the storage yard is nothing but the auxiliary memory cache of CTLS, for it is a temporary buffer area of collection and distribution which is merely in charge of stacking containers in a short term to accept logistics services. Under those premises, we integrate all the shipping space attached in vessels affiliated to shipping lines and the semitrailer loading space hooked on to appointment trucks into a heterogeneous unified virtual memory array (UVMA) with expandable capacity, and that is just auxiliary memory of CTLS as well. It is explicit that the UVMA is dynamic change according to the customer requirements and market circumstances, and the existence and variation of UVMA further increases the complexity of PSAME at container terminals.
Consequently, the cell positioning, address translation, unit mapping, transferring, routing, and switching among the CTL-CSH are the central tasks of CTLS. Meanwhile, the container terminal is the storage infrastructure essentially, and then CTL-CSH gives an abstract sketch map of CTLS and the fundamental execution framework of LGC-CT. In fact, the CTL-CSH is just a core component of CTL-GCA that illuminates the nature of LGC-CT in the context of container terminals.
3.2. Container Terminal Logistics Computing Recourses Synergy
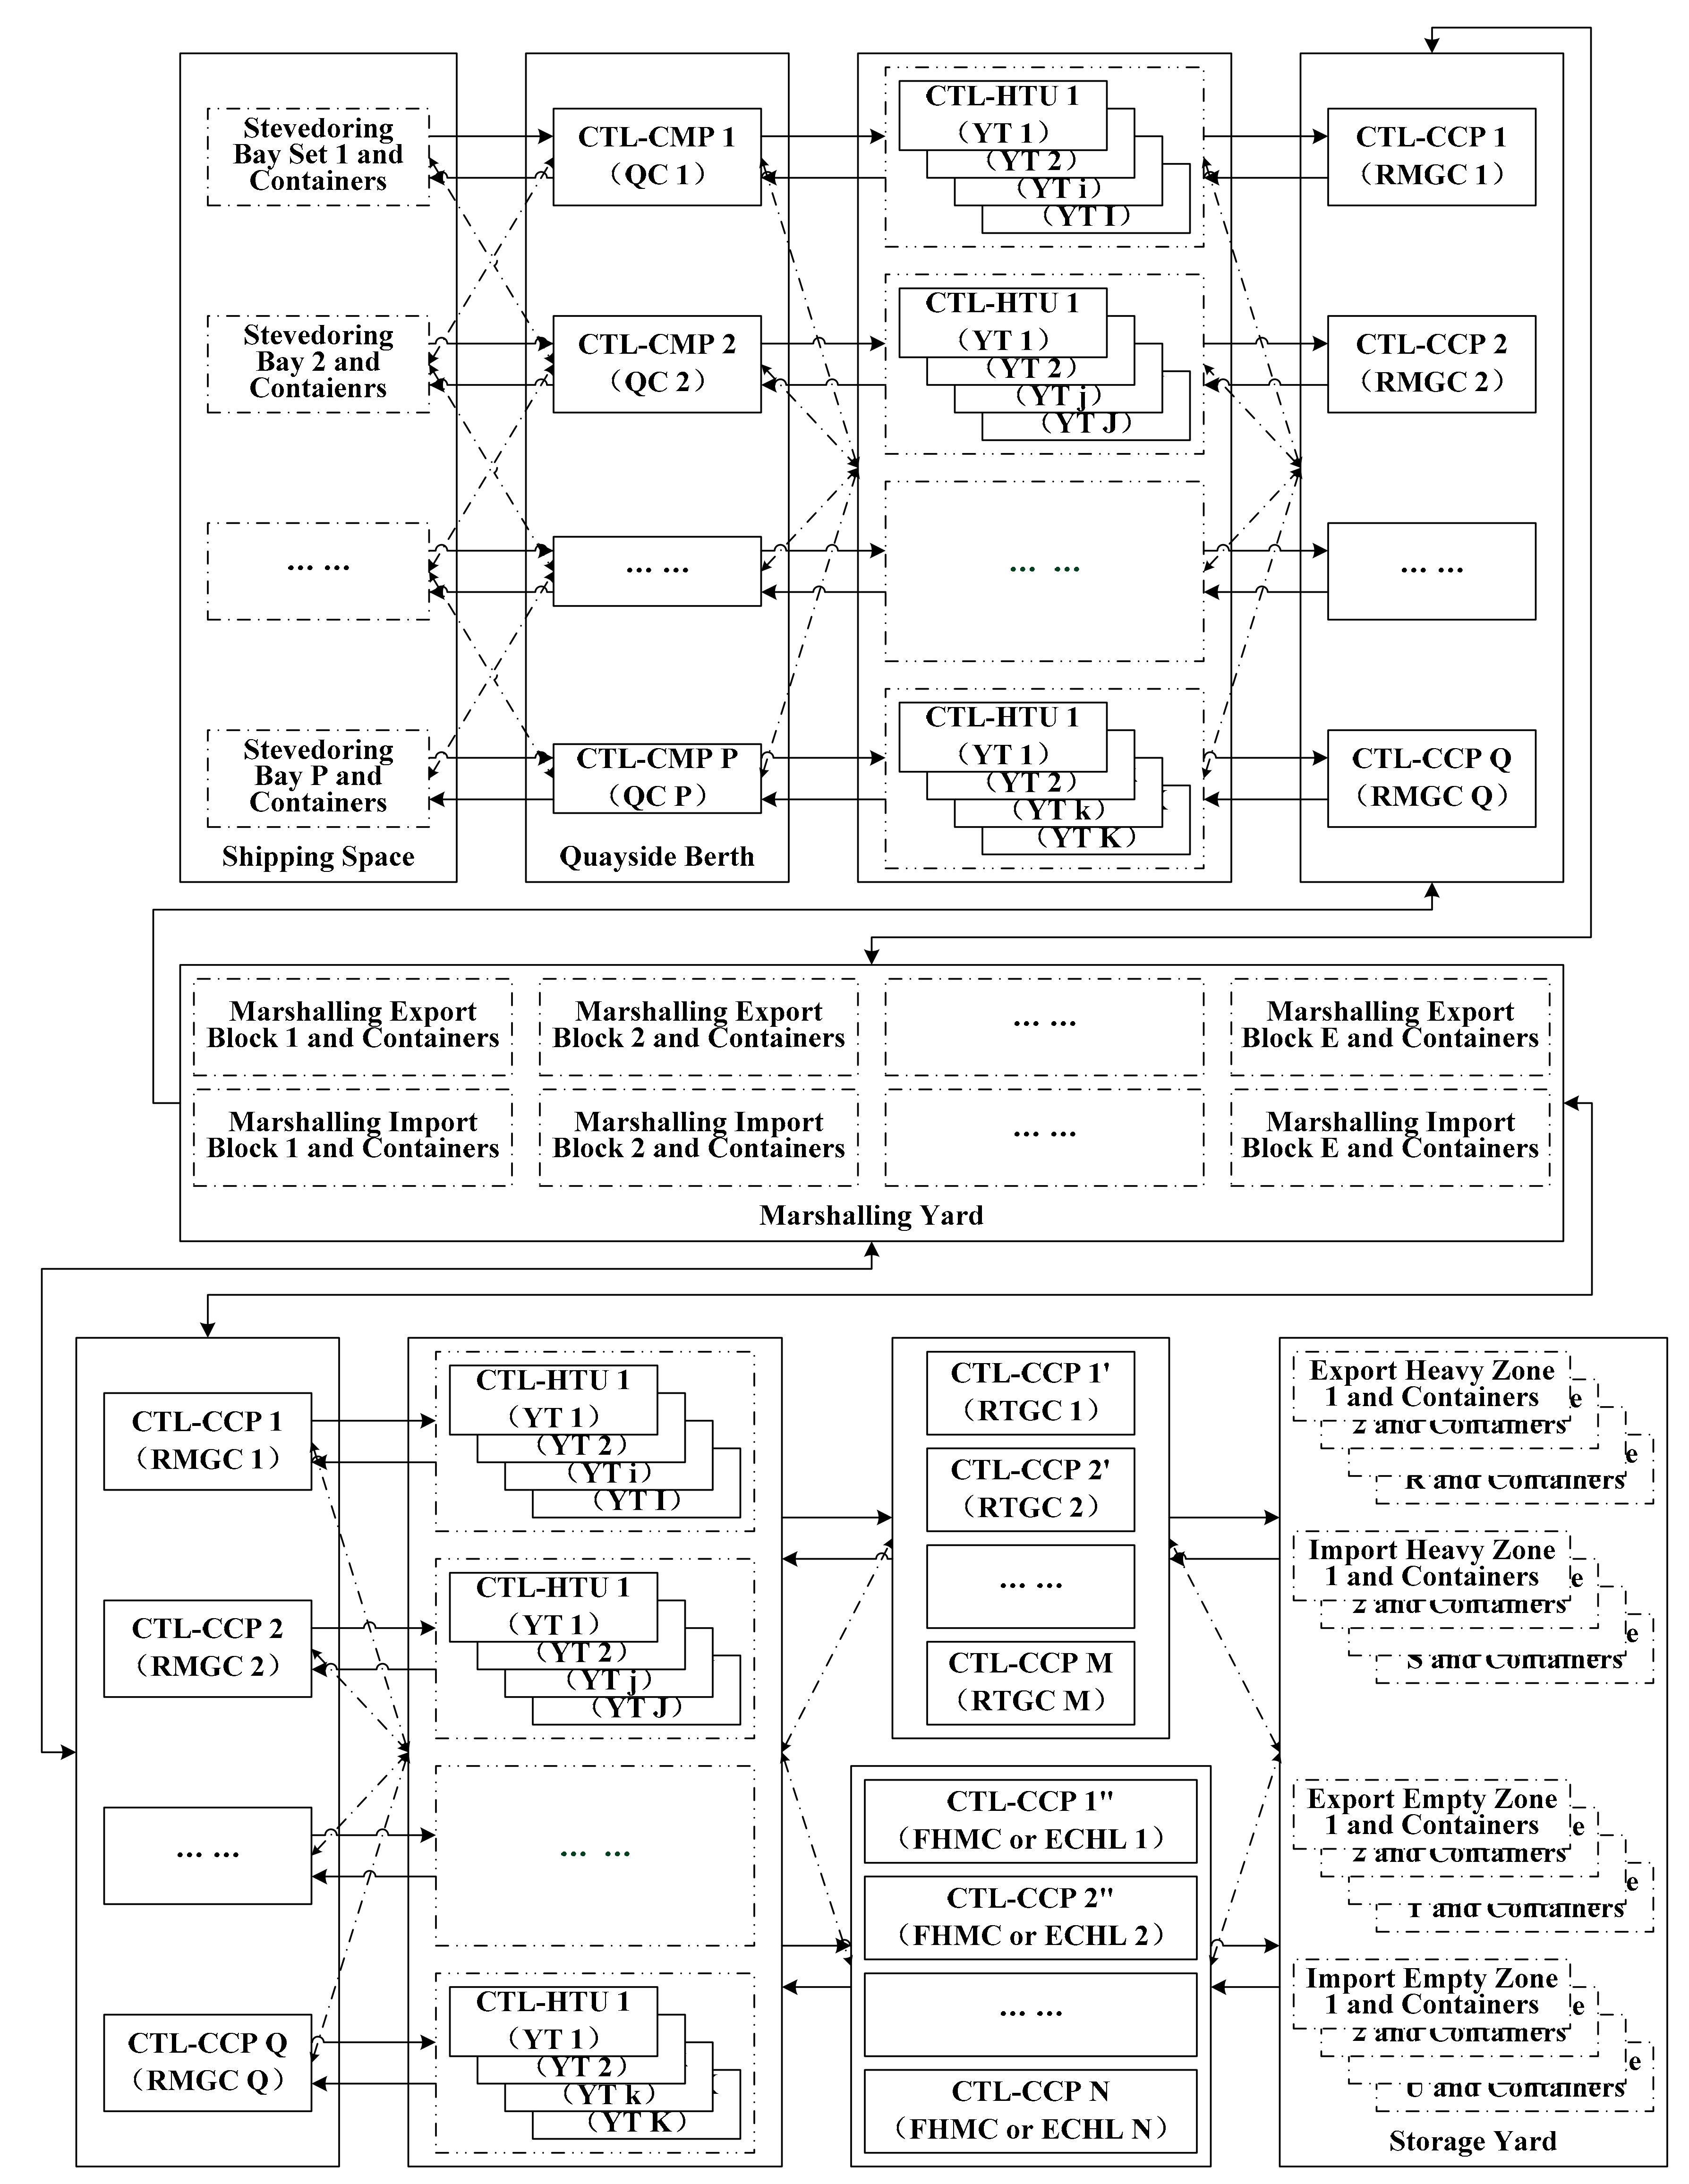
Based on the typical terminal layout, handling technology, and equipment configuration, we launch discussion on operation with the perspective of CTL-CSH. The computational elements of CTLS embraces quay crane (QC), yard trailer (YT), rail-mounted gantry crane (RMGC), rubber-tired gantry crane (RTGC), front-handling mobile crane (FHMC), and empty container fork lift (ECFL) mostly. The heterogeneous and asymmetric processing unit constructs a parallel, heterogeneous, and reconfigurable logistics generalized computing full-duplex pipeline shop (PHR-LGC-FPS) that together with CTL-CSH is supposed to achieve the above working targets of CTLS. For the universality and typicality, we adopt the handling technology of QC-YT-RMGC-YT-RTGC/FHMC/ECFL that is widely applied in large and medium container terminals all over the world. The QC, YT, RMGC, RTGC, FHMC, and ECFL all are the heterogeneous computational elements that are deployed and attached to the diverse memory level in CTL-CSH. So the container terminal logistics computing recourses synergy (CTL-CRS) is presented by Figure 2.
The CTL-CRS goes further and describes the interaction and switching effect among the different kinds of heterogeneous computing and storage resources, and it reveals part of the reasons of DNCC, especially for coupling and complexity. Beyond all question, the CTL-CRS is also a core component of CTL-GCA, and it is a key transformations and mappings for the working of CTLS derived from CTL-CSH.
3.3. Logistics Generalized Computing Pipeline Shop
In light of CTL-CRS, above all, the quay crane is CTL-CMP of CTLS that is deployed by berth, which is responsible for loading and discharging of calling vessels. Secondly, the yard trailer (YT) is the container terminal logistics horizontal transferring unit (CTL-HTU) that is in charge of achieving the position transferring between quayside and marshalling yard or between marshalling yard and storage yard. Finally, RMGC, RTGC, FHMC, and ECFL are the principal container terminal logistics computing co-processors (CTL-CCP) of CTL-CMP that accomplish the function of stacking, relocation, marshalling, collecting, and distributing. Hence, the CTL-CMP, CTL-CCP, and CTL-HTU all construct a PHR-LGC-FPS, which is shown in Figure 3. The PHR-LGC-FPS is an operating principle diagram of LGC-CT, and it establishes the physical processing units and the related switching network abstraction perspective for handling process planning, scheduling design, executable realization, and performance evaluation. Naturally, the PHR-LGC-FPS provides an LGC-CT synchronous and asynchronous hybrid parallel executive framework, and then the flexible, efficient, and reconfigurable combination of the heterogeneous LGC-CT elements, and the hierarchical storage array is established. In addition, the LGC-CT elements or the storage array is asymmetric and task-oriented.
From the above, the three of CTL-CSH, CTL-CRS, and PHR-LGC-FPS are just about the nut graph of CTL-GCA that presents the conceptual LGC-CT architecture with the features of multi-level, multi-queue, multi-stage, multi-buffer, multi-resources, multi-task, and multi-specification, which is abbreviated to 7M, under the compound and complicated operating constraints. The CTL-GCA is abstraction, automation, and analysis problem-oriented explorations decision support framework for LGC-CT, and it is supposed to define the planning mode, design the scheduling algorithm, conduct pattern recognition, implement the decision paradigm, and perform assessment reference for the single resource allocation, synergetic working control, or global integrated scheduling.
3.4. Logistics Generalized Computational Patterns with Green Initiatives
One of the main purposes of CTL-GCA is help the CTLS to acquire the green production and sustainable development, especially for achieving equilibrium among efficiency, low-carbon, throughput, agility, flexibility, and resilience. In order to win the initiative of green production, the recognition, transfer, customizing, designing, implementation, execution, evaluation, and tuning of logistics generalized computational patterns with the conceptual framework of computational logistics, which is referred as RTCD-IEET hereinafter, is one of core tasks and central work for the further exploration and exploitation of CTL-GCA.
As previously mentioned, the CTL-GCA is a typical example of parallel computing architecture by the generalization, extension, and unification of computation. In the domain of computer science and engineering, the power density of chips has been a Gordian knot and a great challenge for the designing, management, and implementation of power consumption. It is also a critical component of system performance. The adoption of a parallel and heterogeneous multi-core is the current solution to the power density of chips. If the whole physical container terminal is abstracted as an LGC-CT chip, both CTL-CMP and CTL-CCP are just the processor core of CTLS. Thereupon, we take a closer look at the working of CTLS. All kinds of arrival containers are just the generalized data of CTLS, and it is the fundamental premise of RTCD-IEET discussion. For one thing, the quantity and time span of processor cores involved are the master key to strike a balance between handling capacity and power consumption, and the latter is strongly associated with carbon emission. For another, the waking, sleep, shifting, and task context switching of CTL-CMP and CTL-CCP all have a huge impact on the LGC-CT efficiency, carbon efficiency, response time, and quality of service, and it is directly related to the carbon emission as well. In addition, the PSAME level of CTL-CMP and CTL-CCP directly determines the running efficiency and turnaround time of the internal yard trailer and external container truck, and both are actuated by petroleum fuels. So the running conditions of trailers and trucks have a direct correlation with the carbon emission, too.
Overall, the combination of CTL-CMP, CTL-CCP, and CTL-HTU is remarkably similar to that of system on a chip (SoC), especially from the perspective of parallel computing architecture and data exchange mechanism. The PHR-LGC-FPS is nothing else than the container flow superscalar hybrid flow shop (CFS-HFS) because that CTL-CMP can load and discharge four 20-foot equivalent units (TEU) simultaneously in one cycle, even six TEUs at one time, which is identical to the definition of a superscalar processor. The overall performance and power consumption of multi-core and multi-processor SoC have always been highly correlated with data parallelism and code regularity, especially for the linear speed-up by injecting more LGC-CT resources.
Given the PMTRAS conditions at container terminals, the data parallelism and code regularity are extremely limited whether in theory or in practice. The former refers to the possibility of LGC-CT for multiple containers on a container ship simultaneously. Due to the liner stowage and the period of collection and distribution, the data parallelism of LGC-CT must be low. Because of the high uncertainty, dynamics, randomization, and low data parallelism, the code regularity in CFS-HFS is very scarce, which is just about allocation and scheduling instructions of CTL-CMP, CTL-CCP, and CTL-HTU. All indicate that the RTCD-IEET based CTL-GCA is very necessary and promising with the green initiative. Now, we launch the case study to demonstrate the application and exploration of CTL-GCA and related logistics generalized computational patterns.
4. Case Study
4.1. Container Terminal Logistics Service Scenario
A typical large-scale container terminal on the east coast of China is selected to demonstrate the application of CTL-GCA and the exploration of logistics generalized patterns with green initiatives. This section probes into the CTL-GCA by the operation of a storage yard, because the LGC-CT occurred in a storage yard and takes center stage whether in theory or in practice. The annual throughput of a container terminal is between 1.25 million and 1.50 million 20-foot equivalent units (TEU). There are 26 rubber tyred gantry cranes (RTGCs) on the storage yard, and the working efficiency of yard crane (YC) is about 30–35 handling times per hour if it does not shift the working blocks among the different zones. In addition, there are a small number of other mobile handling equipment as supplementary. The storage yard is divided into several districts according to the purpose, and every district is further divided into some blocks. The whole storage yard consists of more than 80 blocks. There is no division between the marshalling yard and storage yard at this container terminal. However, it doesn’t prevent us from demonstrating the CTL-GCA. In fact, it exactly indicates that the CTL-GCA has good flexibility, compatibility, and adaptability, which demonstrates the CTL-GCA is adequate for the basis for discussions on green production.
4.2. Overview of Total Handling Activities
The CTL-GCA is designed and evaluated for random batch service systems substantially, and the LGC-CT at the storage yard has strong nonlinearity, dynamics, and randomicity. The given task set is just about a random accessing and switching test suite for the LGC-CT at the storage yard, and then the task set is an important foundation to discuss CTL-GCA. The task set must possess good typicality and representativeness for the operation of CTLS. In this case, the consecutive 25 weeks operational data of storage yard are intercepted to apply CTL-GCA and execute the qualitative and quantitative performance evaluation. The general situations of the task set is showed in Table 1 roughly. The key points are sketched now as follows. First of all, the liners are usually calling the terminal on a weekly basis. We evaluate the LGC-CT behaviors in weeks accordingly. This determines the clock ticks of LGC-CT, in effect, and it is significantly different from the counterparts in computer systems. It creates a baseline foundation for continuing discussion. In the next place, because of the routine maintenance of RTGCs, not all RTGCs are in operation all the time. Similarly, not all the yard blocks are involved in the logistics service all through. Hence, both need to be specified in this instance. Thirdly, one task means that one RTGC must carry out some handling operation at a certain yard block for the specific containers in one week. The task list number reflects the randomicity, diversity, and dispersity of the tasks directly, and illustrates the shifting frequency of the RTGC to some degree as well. Finally, the measurement of each task is based on the container box unit (CBU) rather than TEU.
In allusion to the production status showed in Table 1, the key statistical characteristics of the LGC-CT tasks at storage yard can be described by Table 2. By the combination of Table 1 and Table 2, the critical task attributes can be obtained preliminarily. The LGC-CT at the storage yard takes the operation on quayside and that on landside asynchronously and simultaneously into account, and it leads to the LGC-CT executed by CTL-CCP is highly volatile, scattered, and stochastic even from the cycles of weeks, let alone based on days or hours. It is due, in large part, to the calling randomness and unpredictability of liners and external yard trailers, especially for the latter. The task set possesses the typical characteristics of terminals operation.
Moreover, the tasks with the minimum 15% handling volumes and the maximum 15% handling ones both are truncated for statistics on the task set, which is showed in Table 3. It is found that the mode of tasks all over the 25 weeks is just one and the task with the minimum 15% handling volumes is more than half in all the weeks. At the same time, the typical value for the maximum 15% has a large span, and it accounted for very small proportion of task set. From the foregoing, it is concluded that the dispatching and allocation of RTGCs is very difficult because of the fragmented and real-time task with the low fault tolerant requirements. The above task attributes are one of the decisive factors for the tricky problem.
4.3. LGC-CT of RTGC Performance Analysis
With the perspective of computational logistics, the operation of CTLS can be abstracted as the synthesis of computation, storage, accessing, switching, and communication. Let’s discuss the practical case with CTL-GCA from the aspects of computation switching and storage accessing. Both are the core views for the operation of CTLS, especially for the YC that is the main CTL-CCP. RTGC is a kind of YC, and it is just the core equipment of LGC-CT at the storage yard in this case. Then we launch the correlation analysis between accessing block and handling tasks according to the LGC-CT load accomplished by the single RTGC for one week. The Pearson correlation coefficient is one of the direct and practicable methods for the relationship between characteristics and responses. So we selected the Pearson correlation coefficients to analyze the LGC-CT performance by RTGC. The LGC-CT key performance indicators of RTGC are listed below, and they are illustrated by Table 4.
First of all, the Pearson correlation coefficient between the number of task lists and the total handling volume is abbreviated to PC-TLHV, and the corresponding 2-tailed significance is TS-TLHV for short. Secondly, the Pearson correlation coefficient between the quantity of working yard blocks and the total handling volume is called after PC-YBHV, and the corresponding 2-tailed significance is TS-YBHV. Lastly, the Pearson correlation coefficient between the quantity of working yard blocks and the number of task lists is PC-YBTL in abbreviation, and the corresponding 2-tailed significance is TS-YBTL for short. Those are the logistics generalized computational pictorial illustrations of the RTGC group. It is a random load test for the CTL-CCP community on the SMA to demonstrate the working granularity and collaborative performance of CTL-CCP cluster.
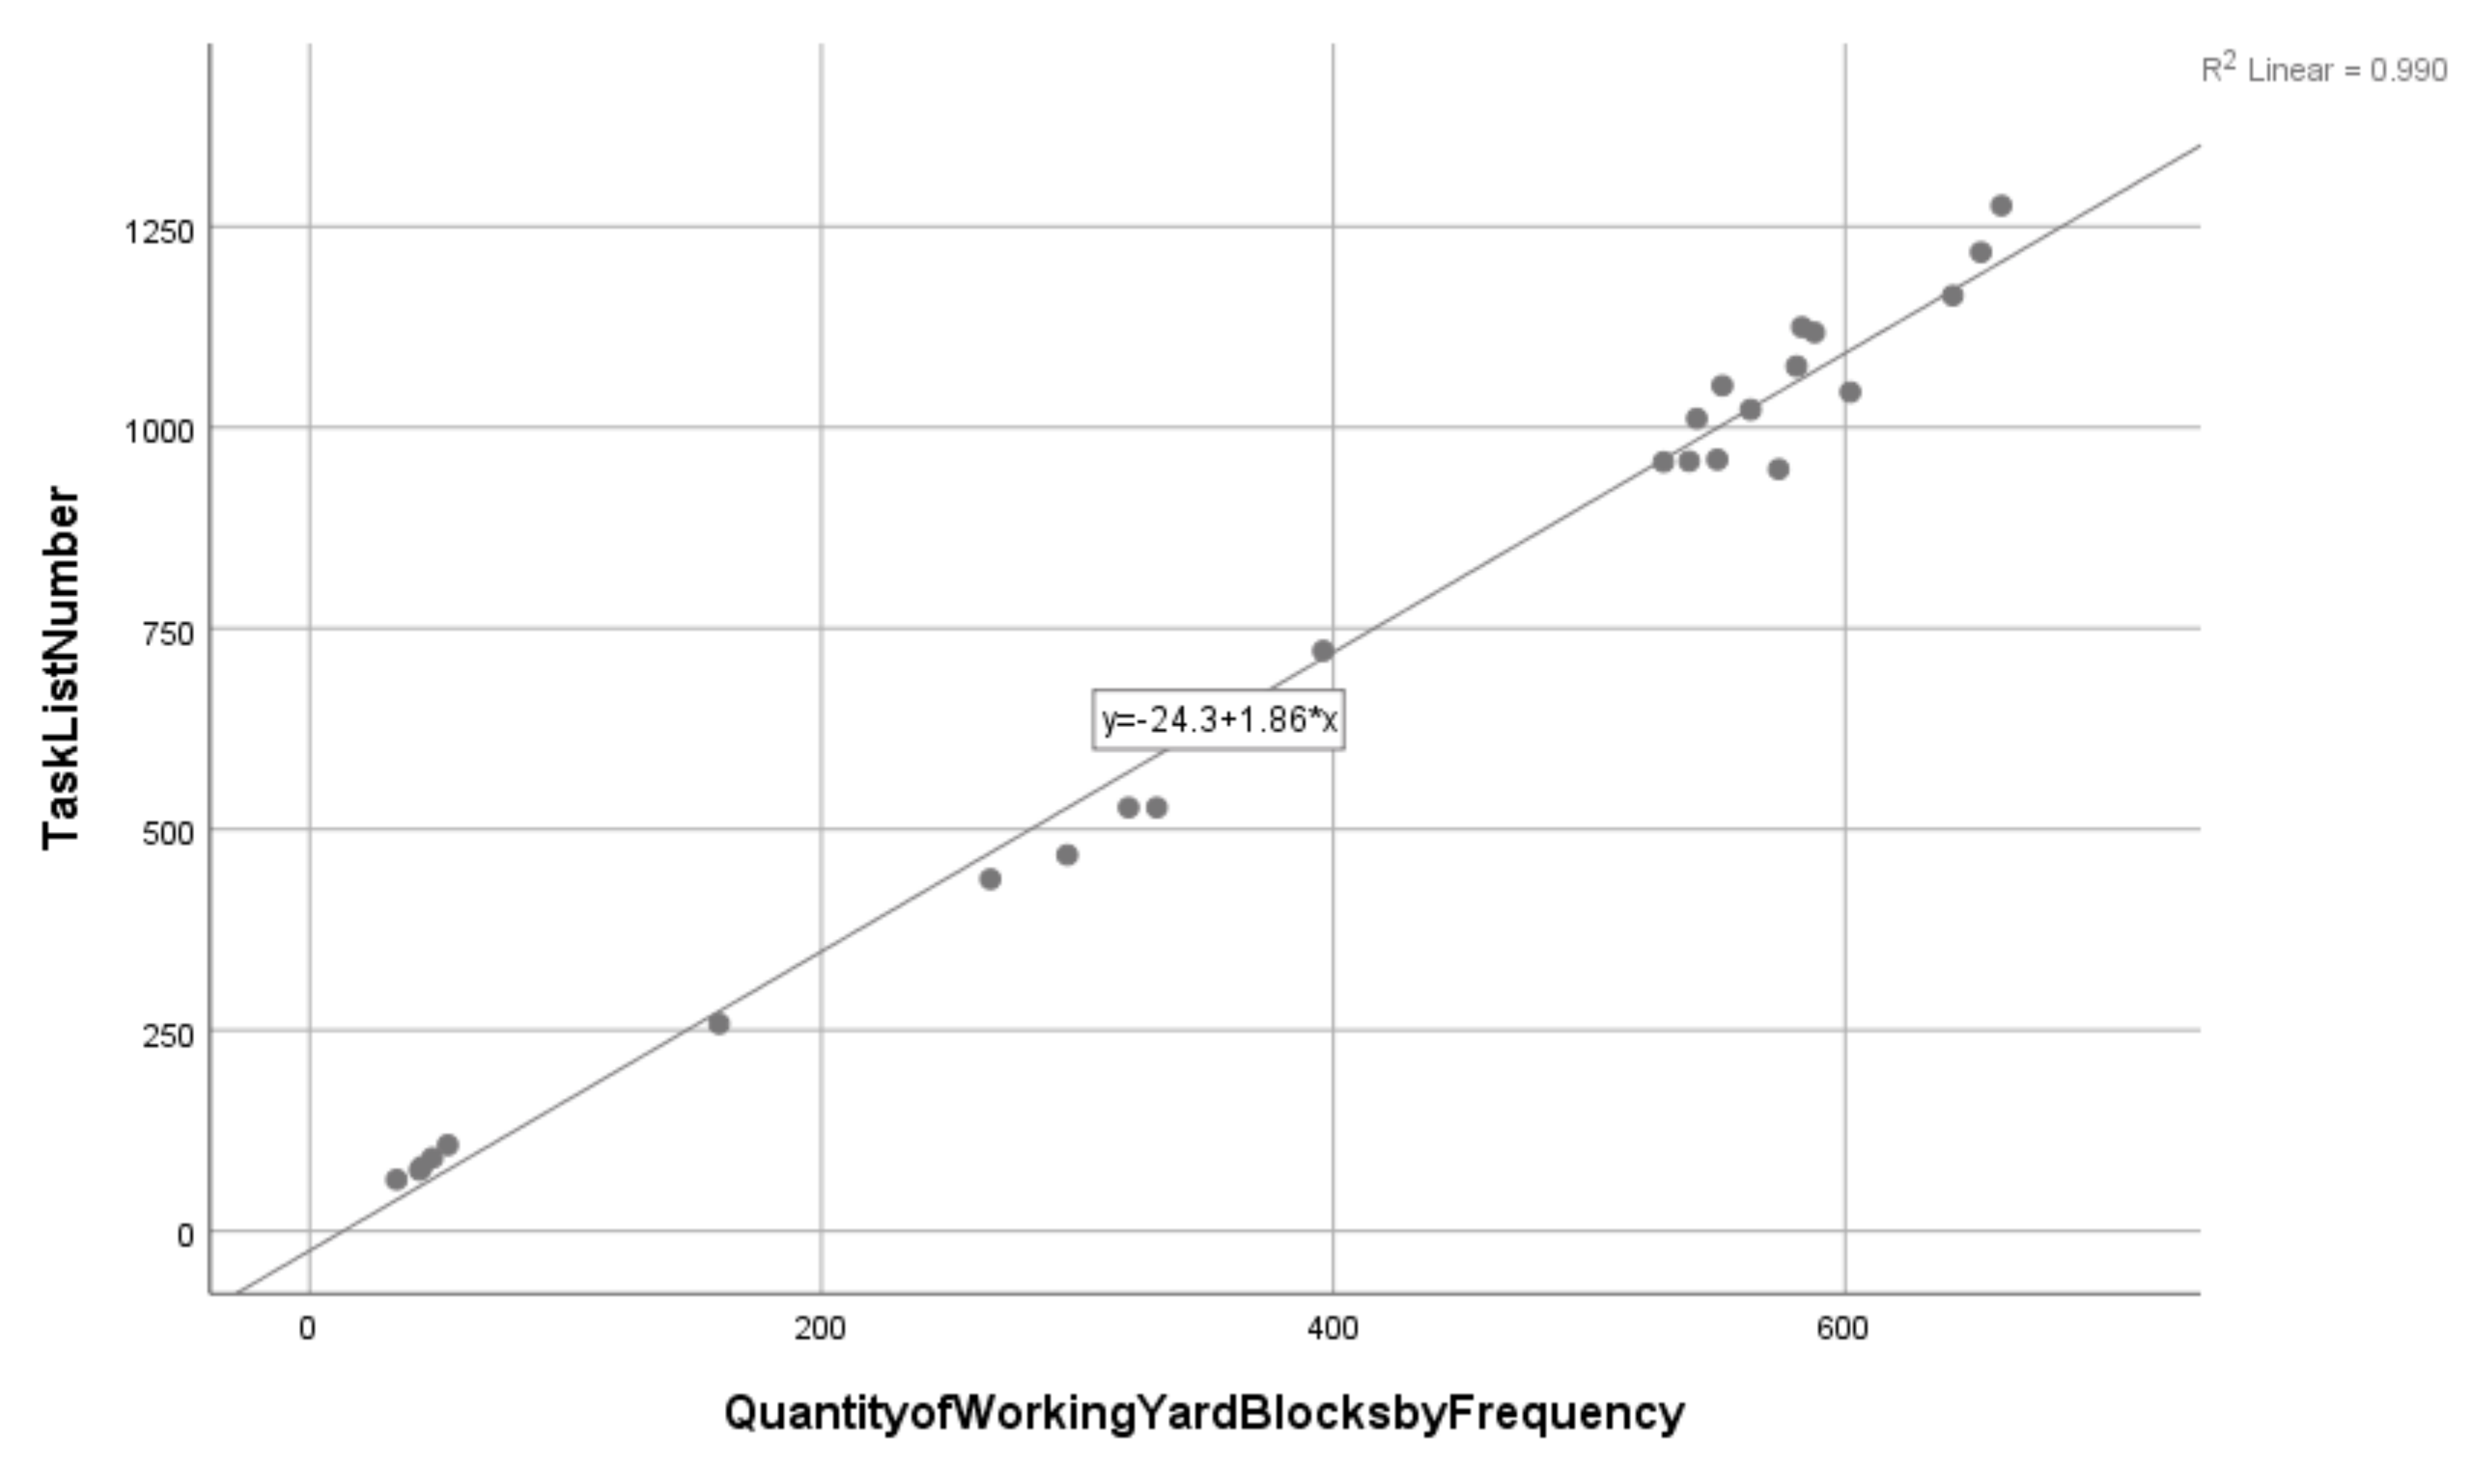
The four of PC-TLHV, TS-TLHV, PC-YBHV, and TS-YBHV reflect the randomicity and dispersibility from the dimensions of handling a task list and working yard blocks. Even from the rhythm of weeks, there is only a moderate correlation between a task list and handling volume. A similar phenomenon also happens between working blocks and handling volume. However, the PC-YBTL is very close to 1.0, which indicates that the working yard blocks and the handling task list are highly correlated for the whole RTGC community. It is demonstrated by Figure 4 clearly.
In accordance with Table 4 and Figure 4, it seems that the planning and scheduling of the RTGC group was reasonable, efficient, economical, and green in the production cycle of weeks, at least. Moreover, the RTGCs collaboration with blocks followed a similar pattern. It seems that the device allocation achieved the near linear acceleration for LGC-CT at the storage yard, and it was green and sustainable as well. Let us explore further to judge the plausible conclusions.
4.4. RTGC Accessing Yard Block Performance
Taken together, there were 25 RTGCs and 71 blocks involved in the LGC-CT for the 25 weeks, which includes 18,727 task records, and then the ultimate result was that the accessing, handling, stacking, and switching of 526,480 CBUs were realized and completed during the LGC-CT procedure. To evaluate the manifestation of CTL-CCP, we made a correlation analysis between the given RTGC and the special block to observe the parallelism, locality, and affinity of RTGCs and the asymmetry, dispersity, and distribution of tasks in blocks. Accordingly, we evaluated the carbon efficiency of LGC-CT in a roundabout way.
On the whole, the two-tailed significance was 0.000, but the Pearson correlation coefficient between RTGCs and blocks was a mere 0.369. It was only moderate correlation between RTGCs and blocks. That means that the CTL-CCP was not explored and exploited adequately under the current scheduling policy especially for locality, parallelism, and affinity. It also indicated that the carbon efficiency of CTL-CCP remained at a low level. Obviously, there was plenty of room to improve the handling efficiency, especially for reducing the shifts of RTGCs. It can reduce traffic congestion of the storage yard and improve both LGC-CT service efficiency on quayside and storage yard. In fact, it was just about the shifts of RTGCs and the queuing for handling of internal yard trailers that caused a lot of unnecessary carbon emissions for LGC-CT. Furthermore, the specific operating conditions of the given set of RTGC is shown in Table 5. Moreover, we made the further correlation analysis for the key performance indicators in Table 5, which is illustrated by Table 6.
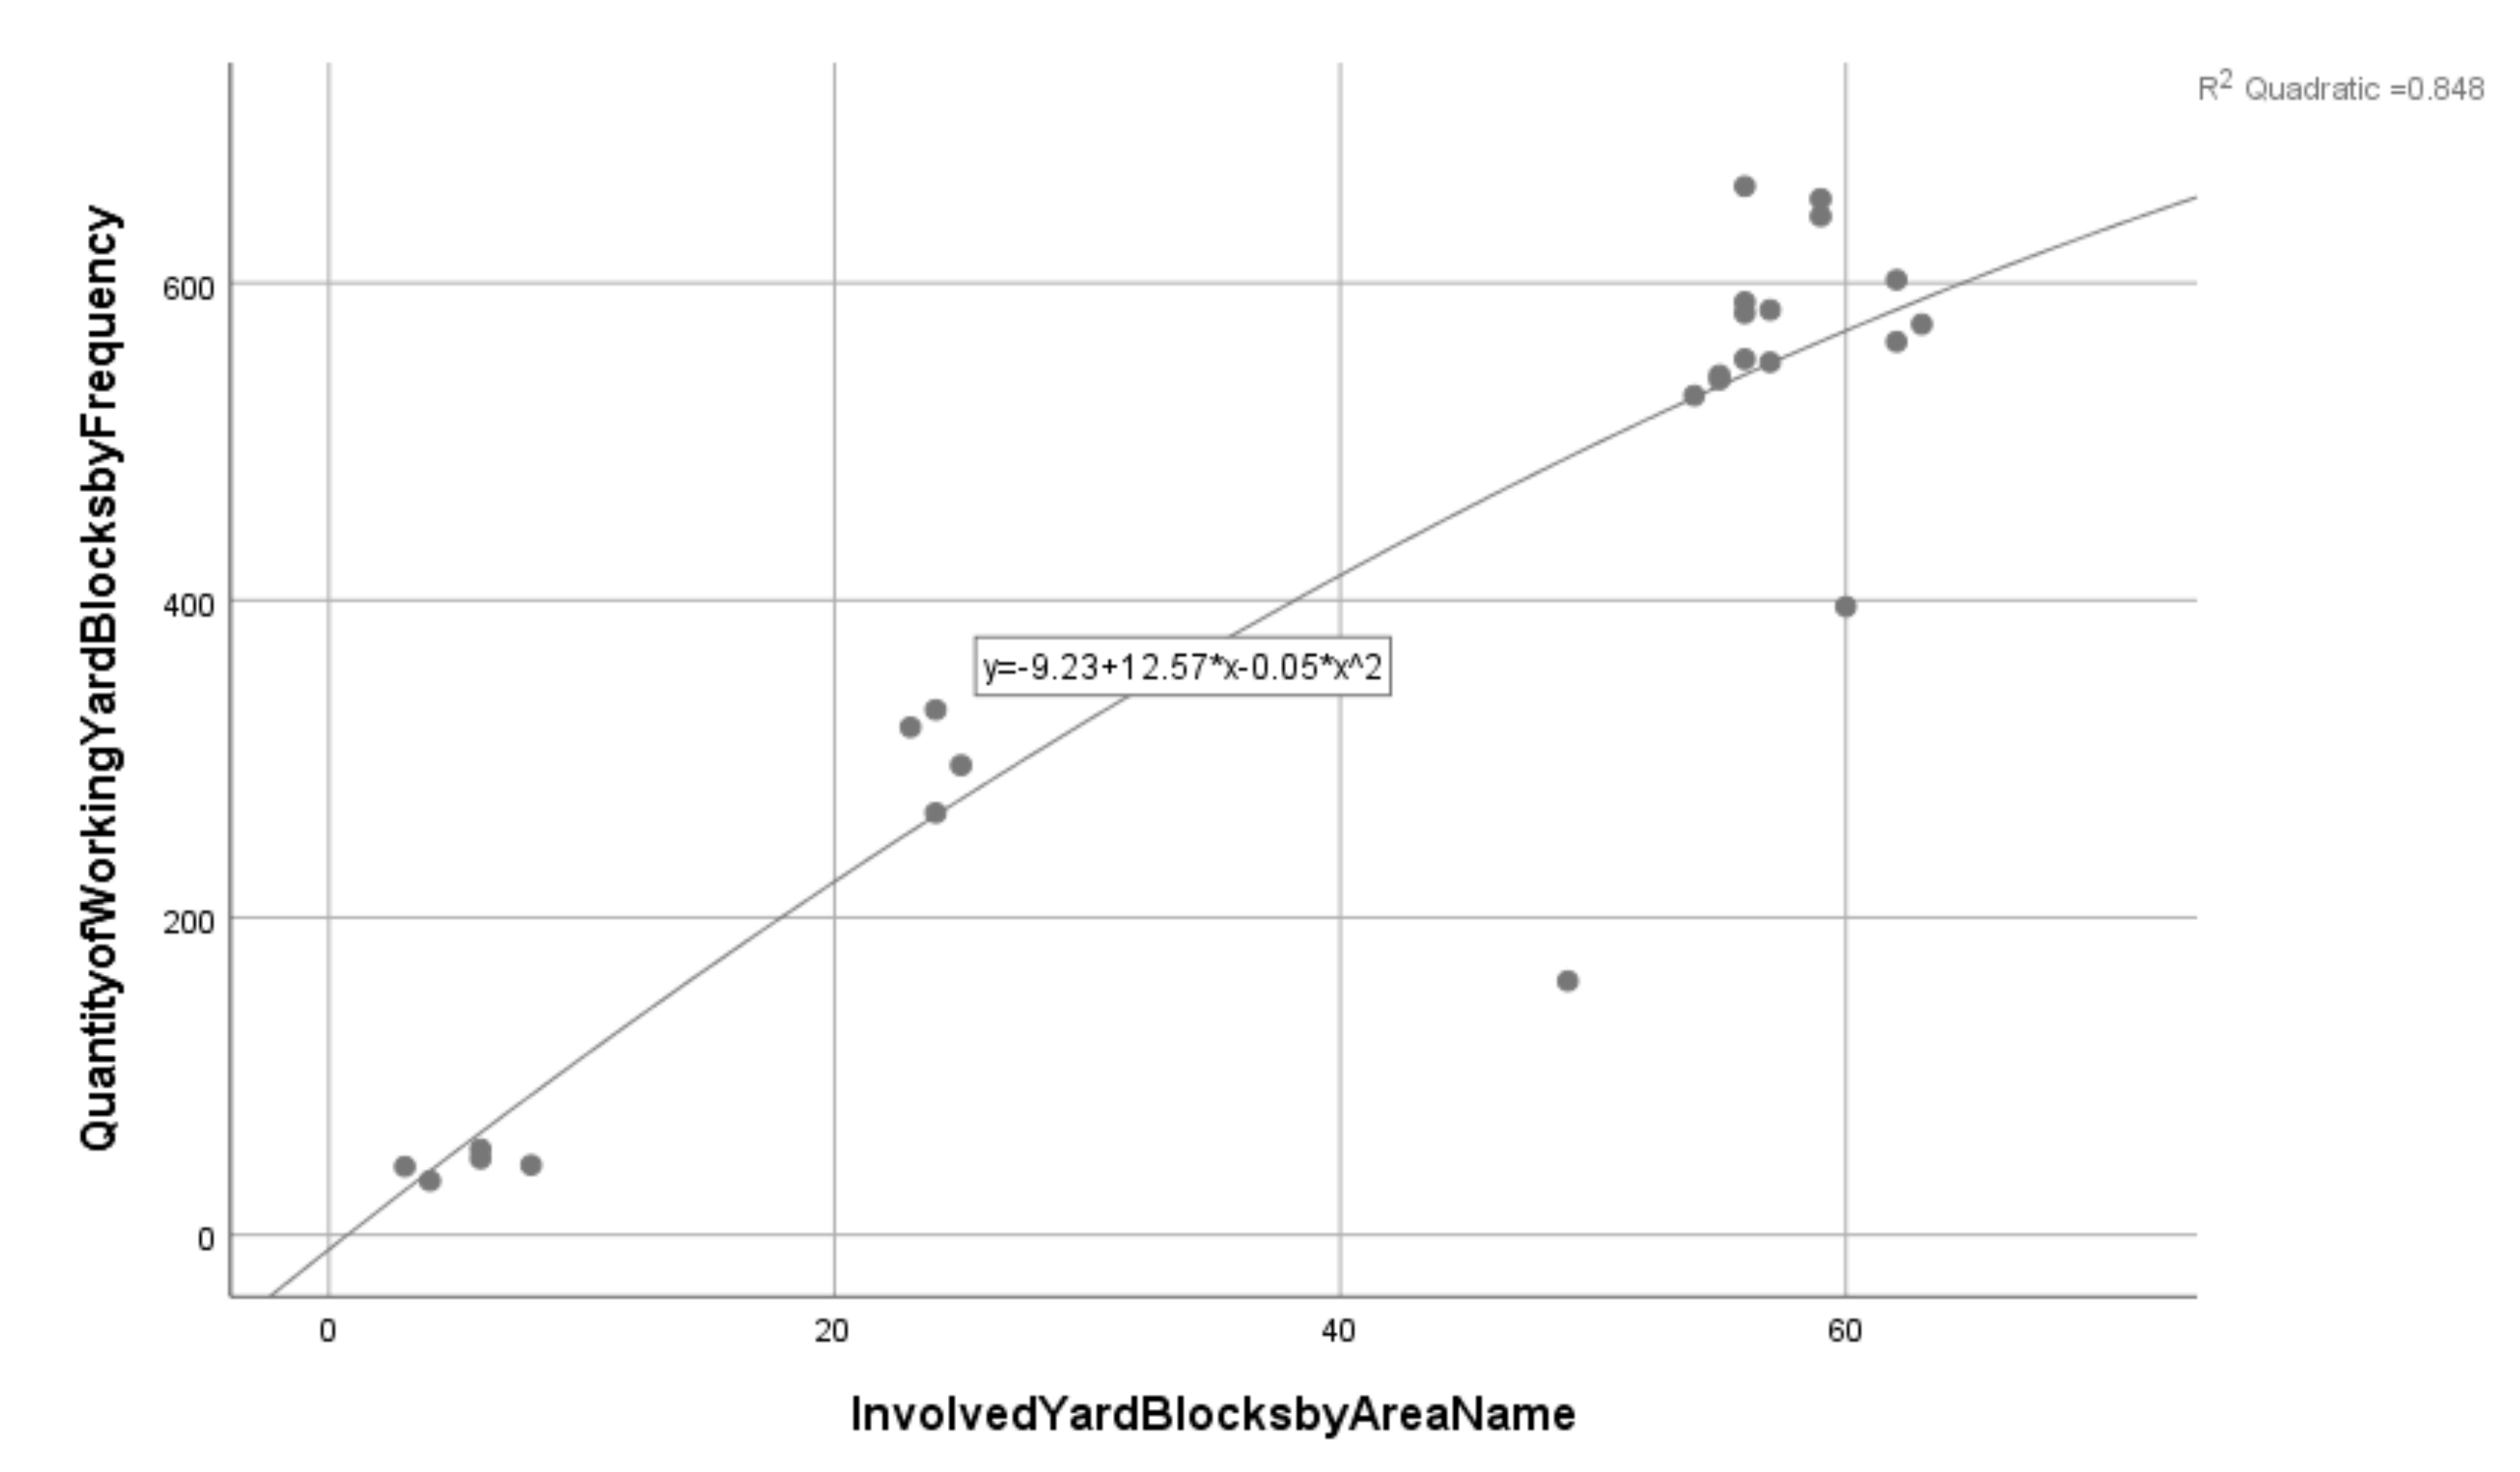
It is crucial to stress that the quantity of working yard blocks by frequency and the involved yard blocks by area name had significant differences. The former means that the totality of accessing and switching times for the whole block set, and the latter implies the number of the involved different blocks at the storage yard. There is a significant difference between the two in quantity. Nevertheless, the Pearson correlation coefficient of two came up to 0.919, and the two-tailed significance was 0.000. It means that the two are highly interrelated, and the relevant quadratic fit line is shown in Figure 5. Nevertheless, there were numerous shiftings of RTGCs as seen by the combination of Table 5, Table 6, and Figure 5. Moreover, the task loads of RTGCs were very uneven no matter which dimension. Both mean that the planning and scheduling of RTGCs was inefficient and the LGC-CT was of high energy consumption. Naturally, the carbon efficiency of LGC-CT was far from satisfactory.
4.5. Yard Block Container Switching Performance By RTGC
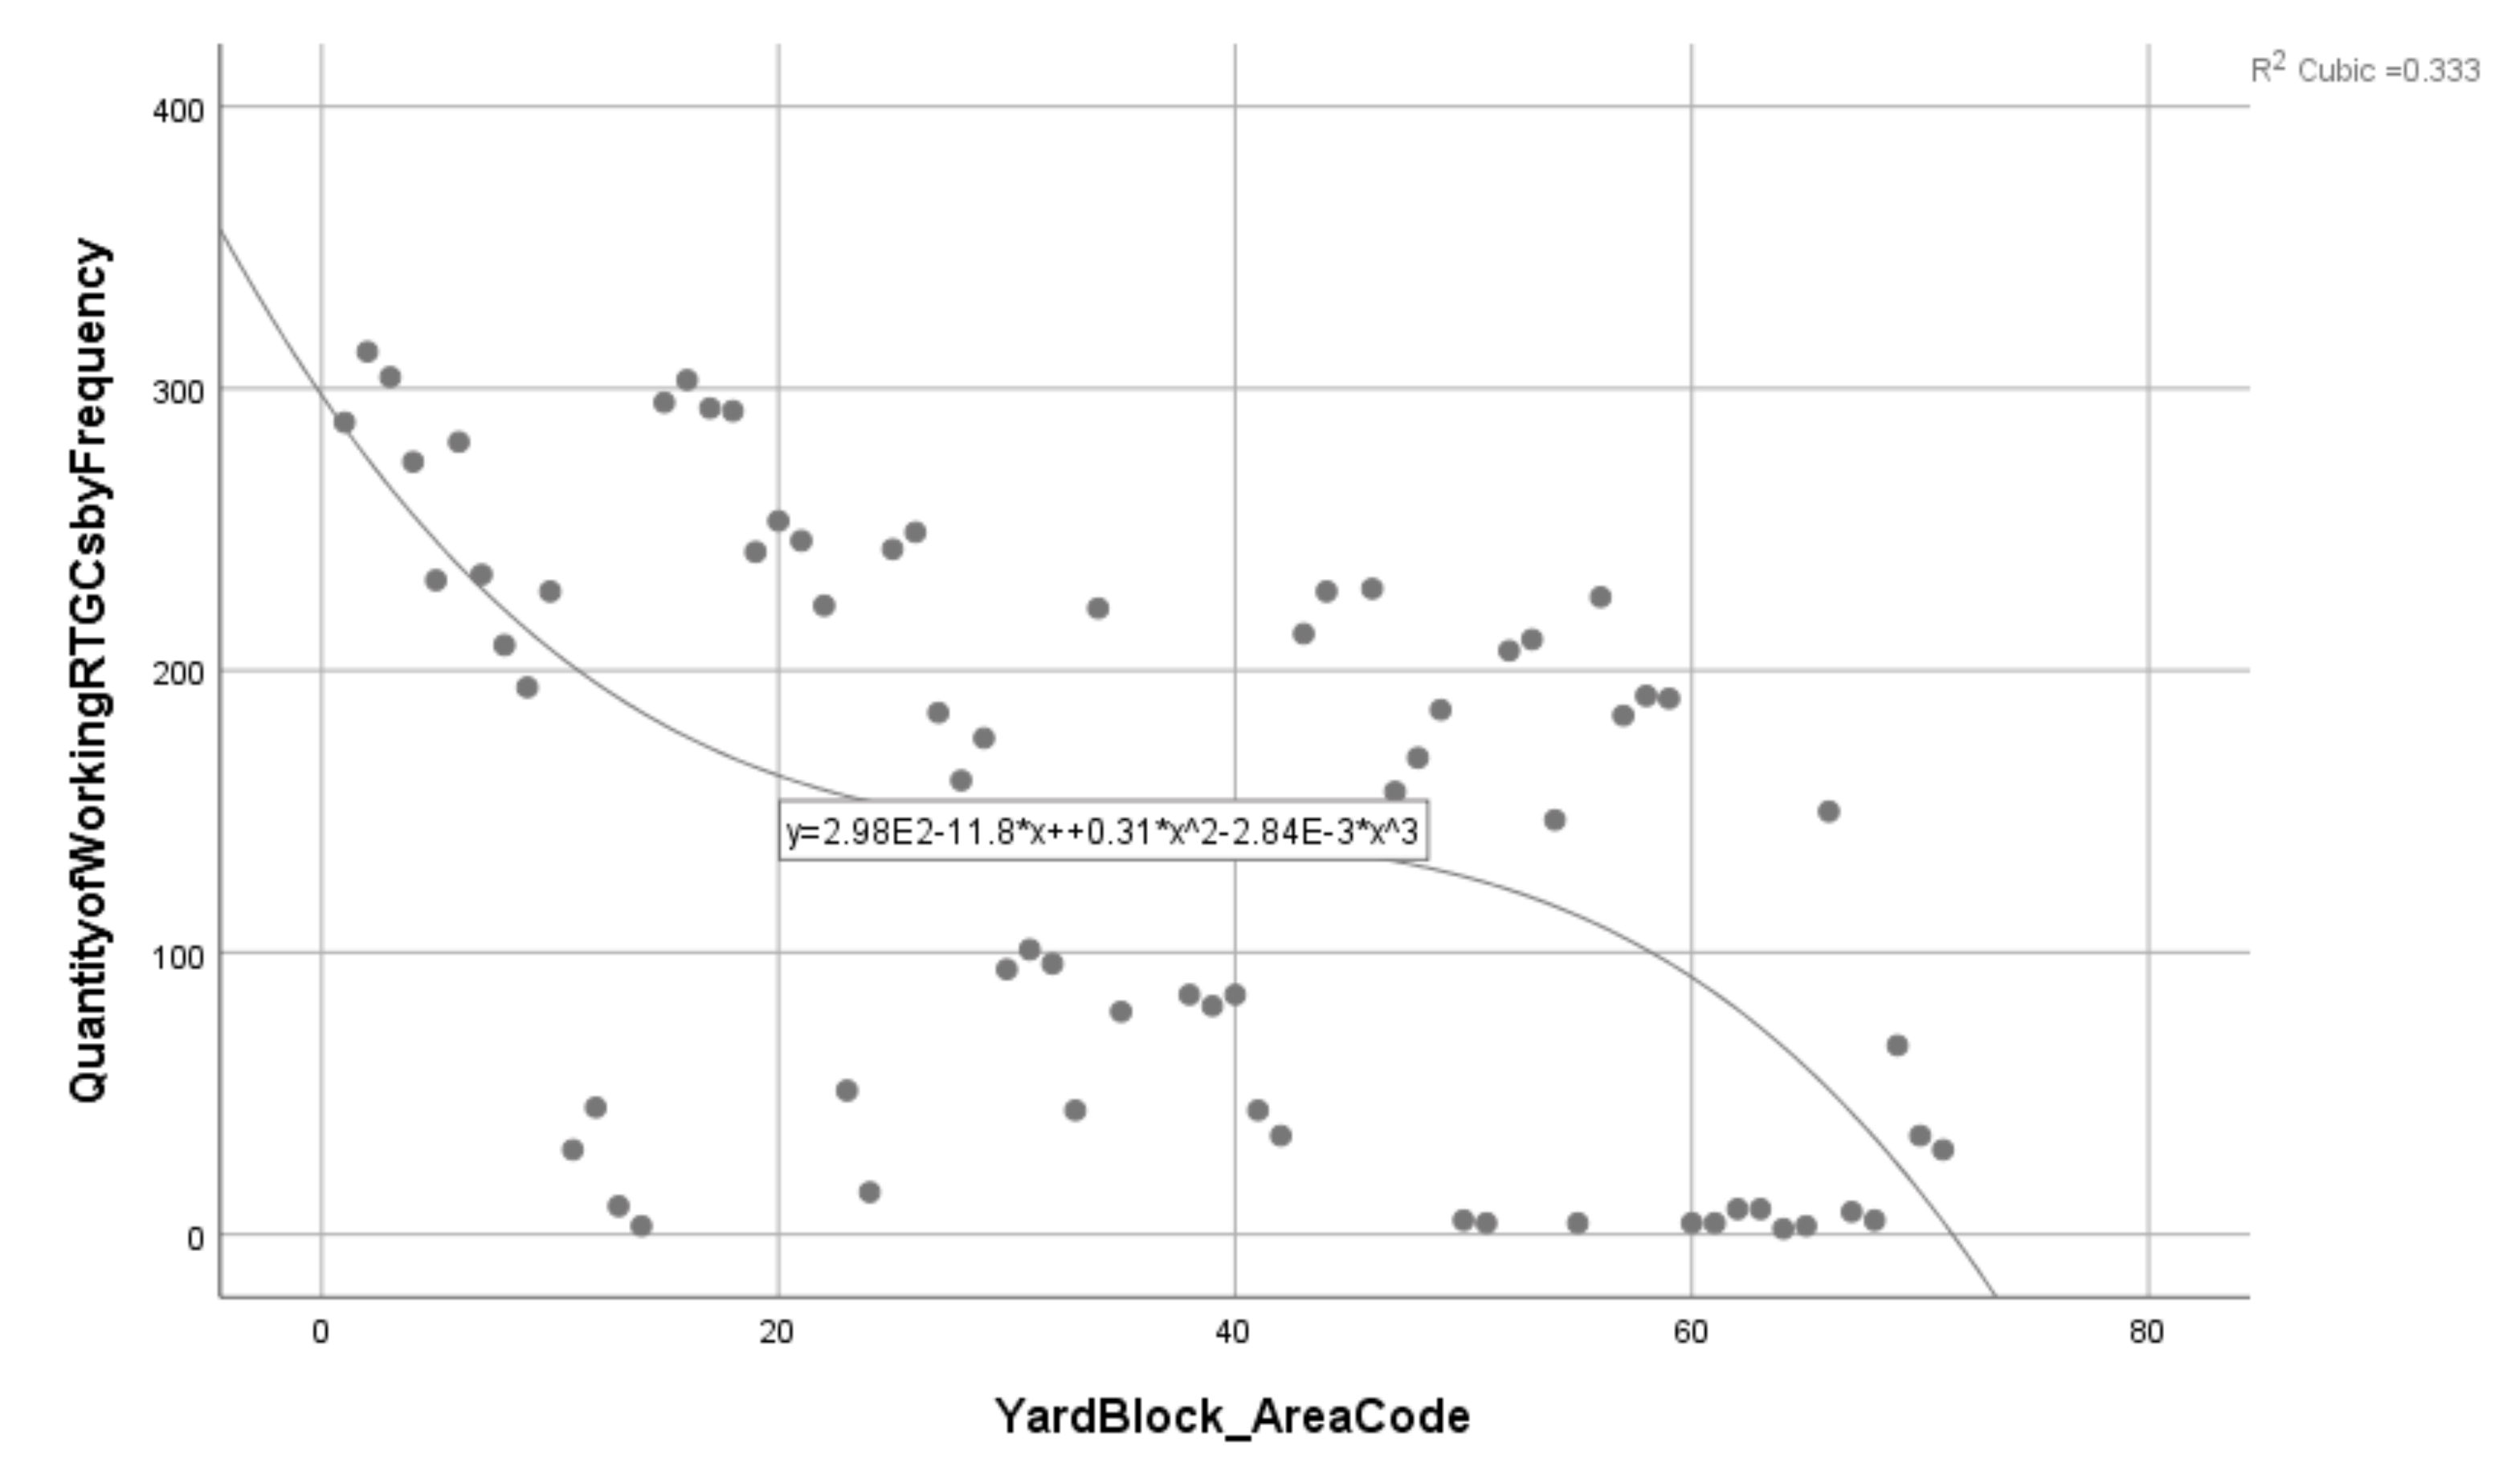
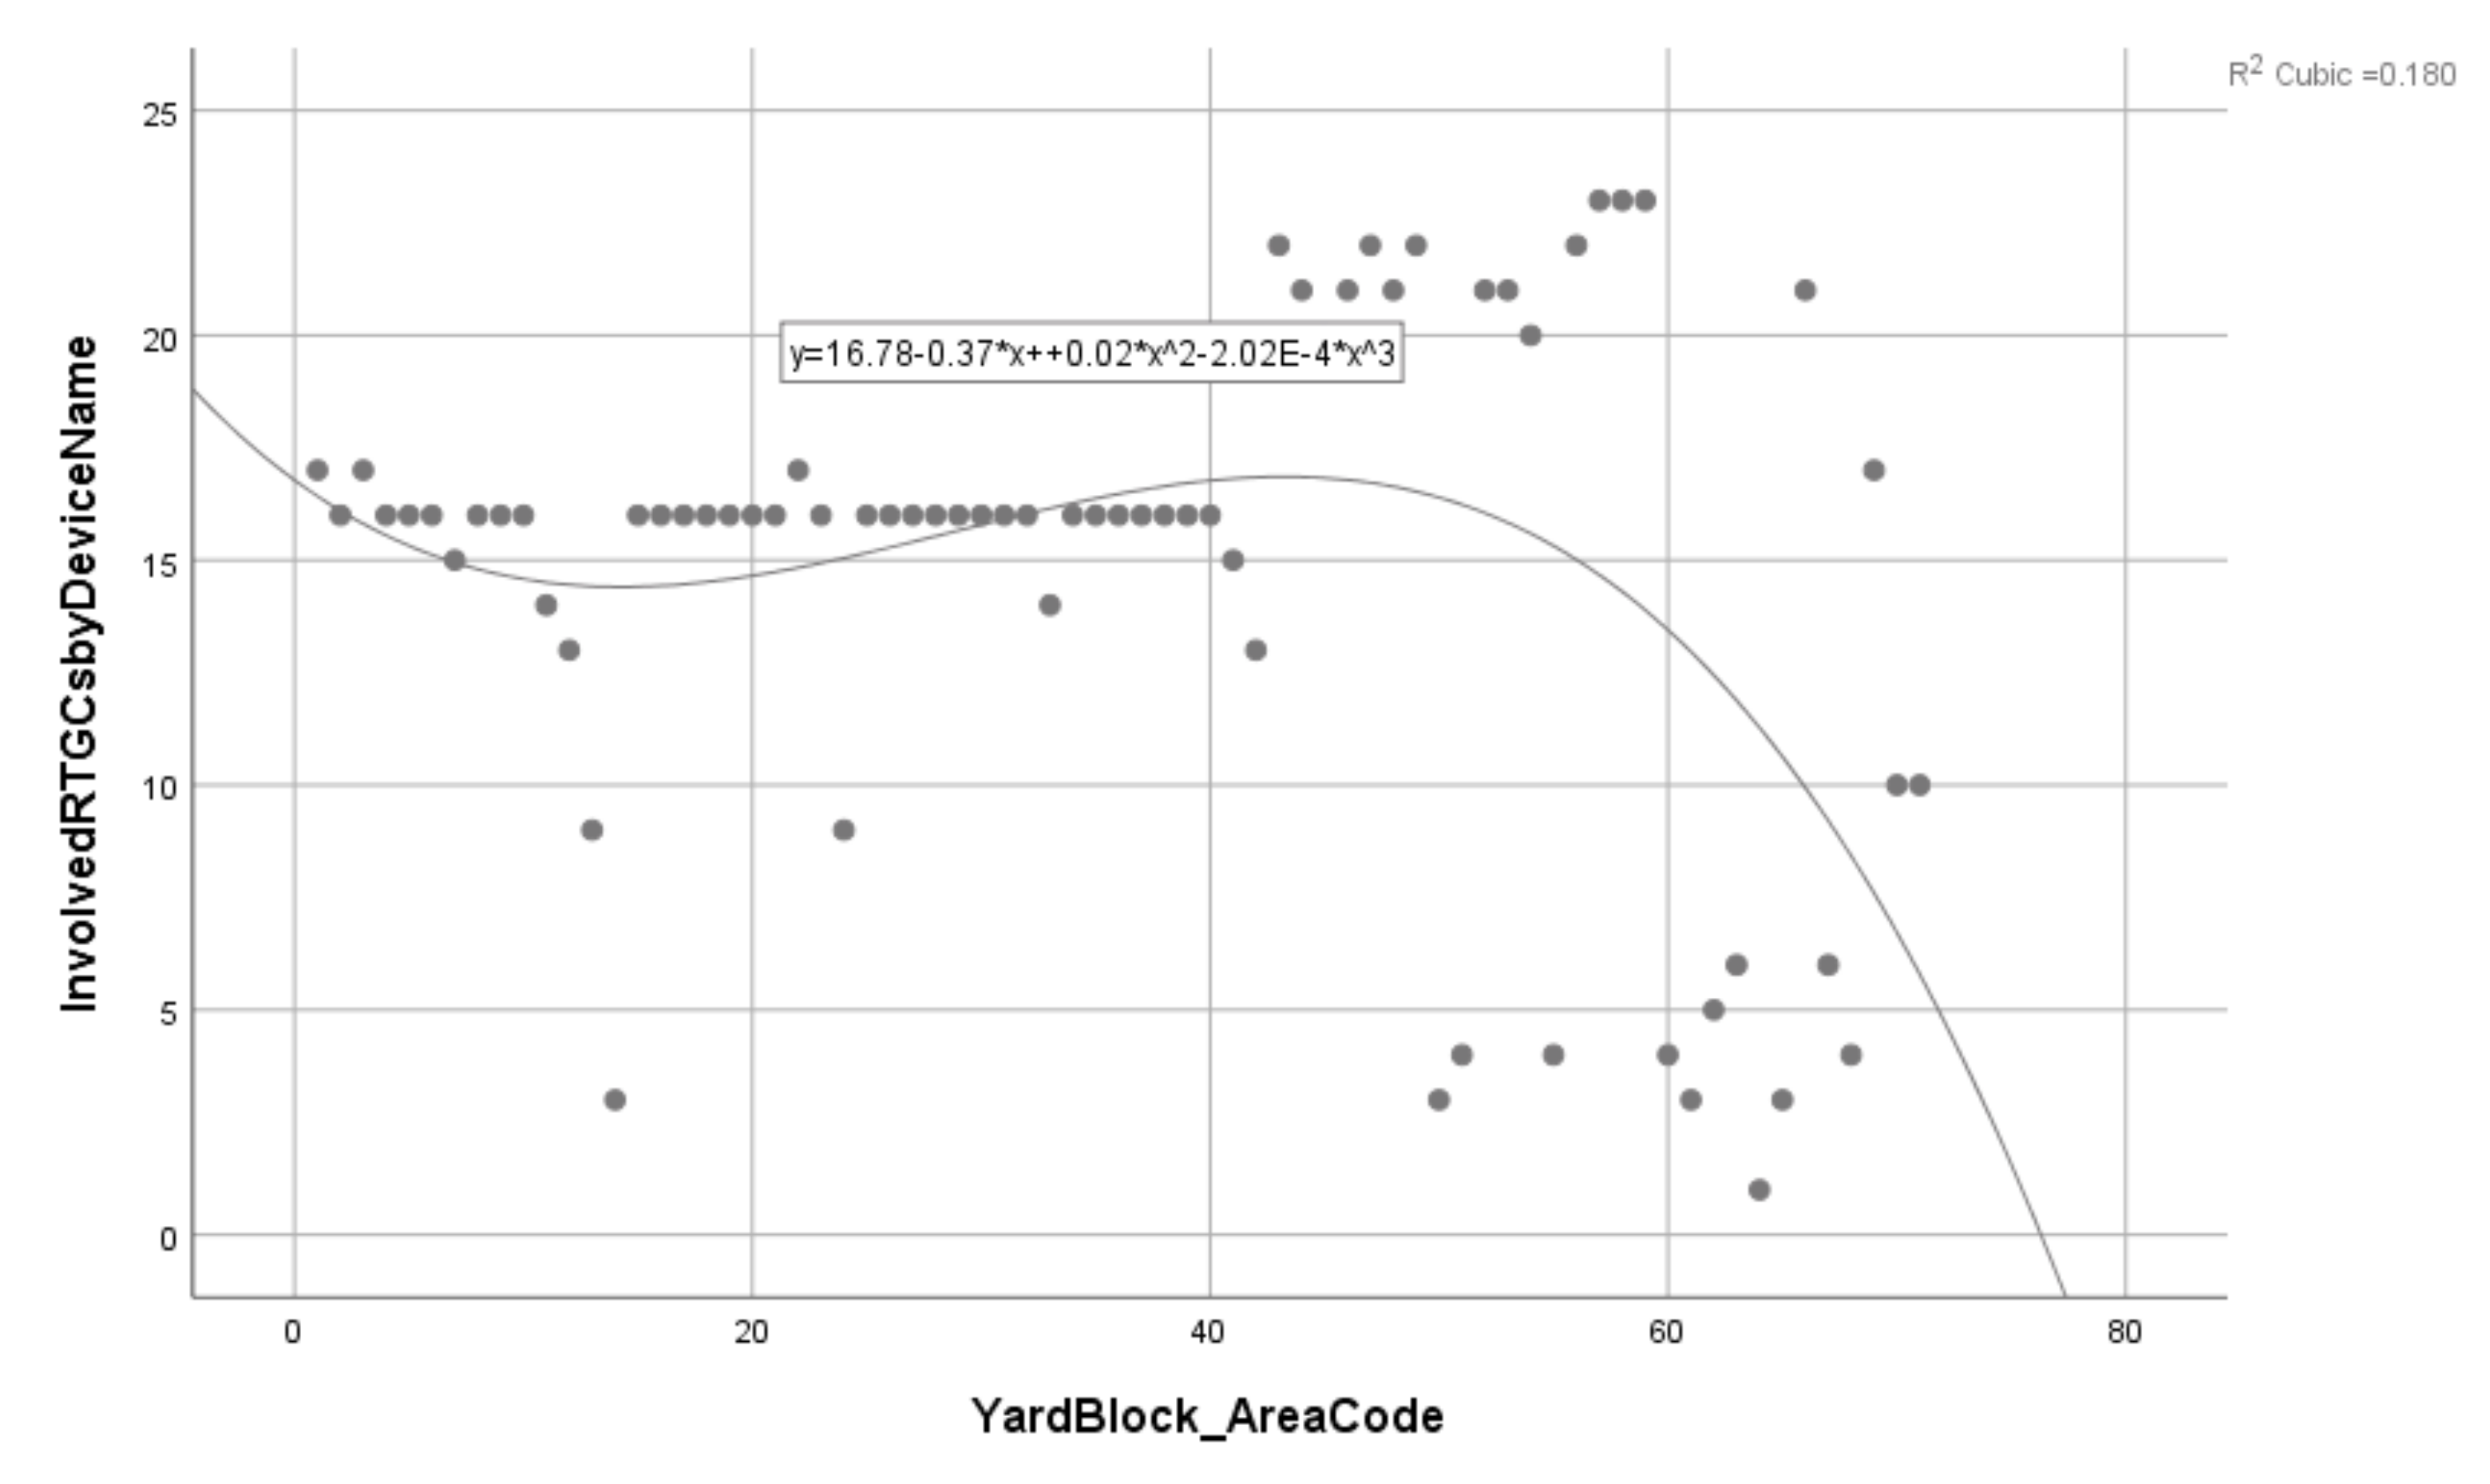
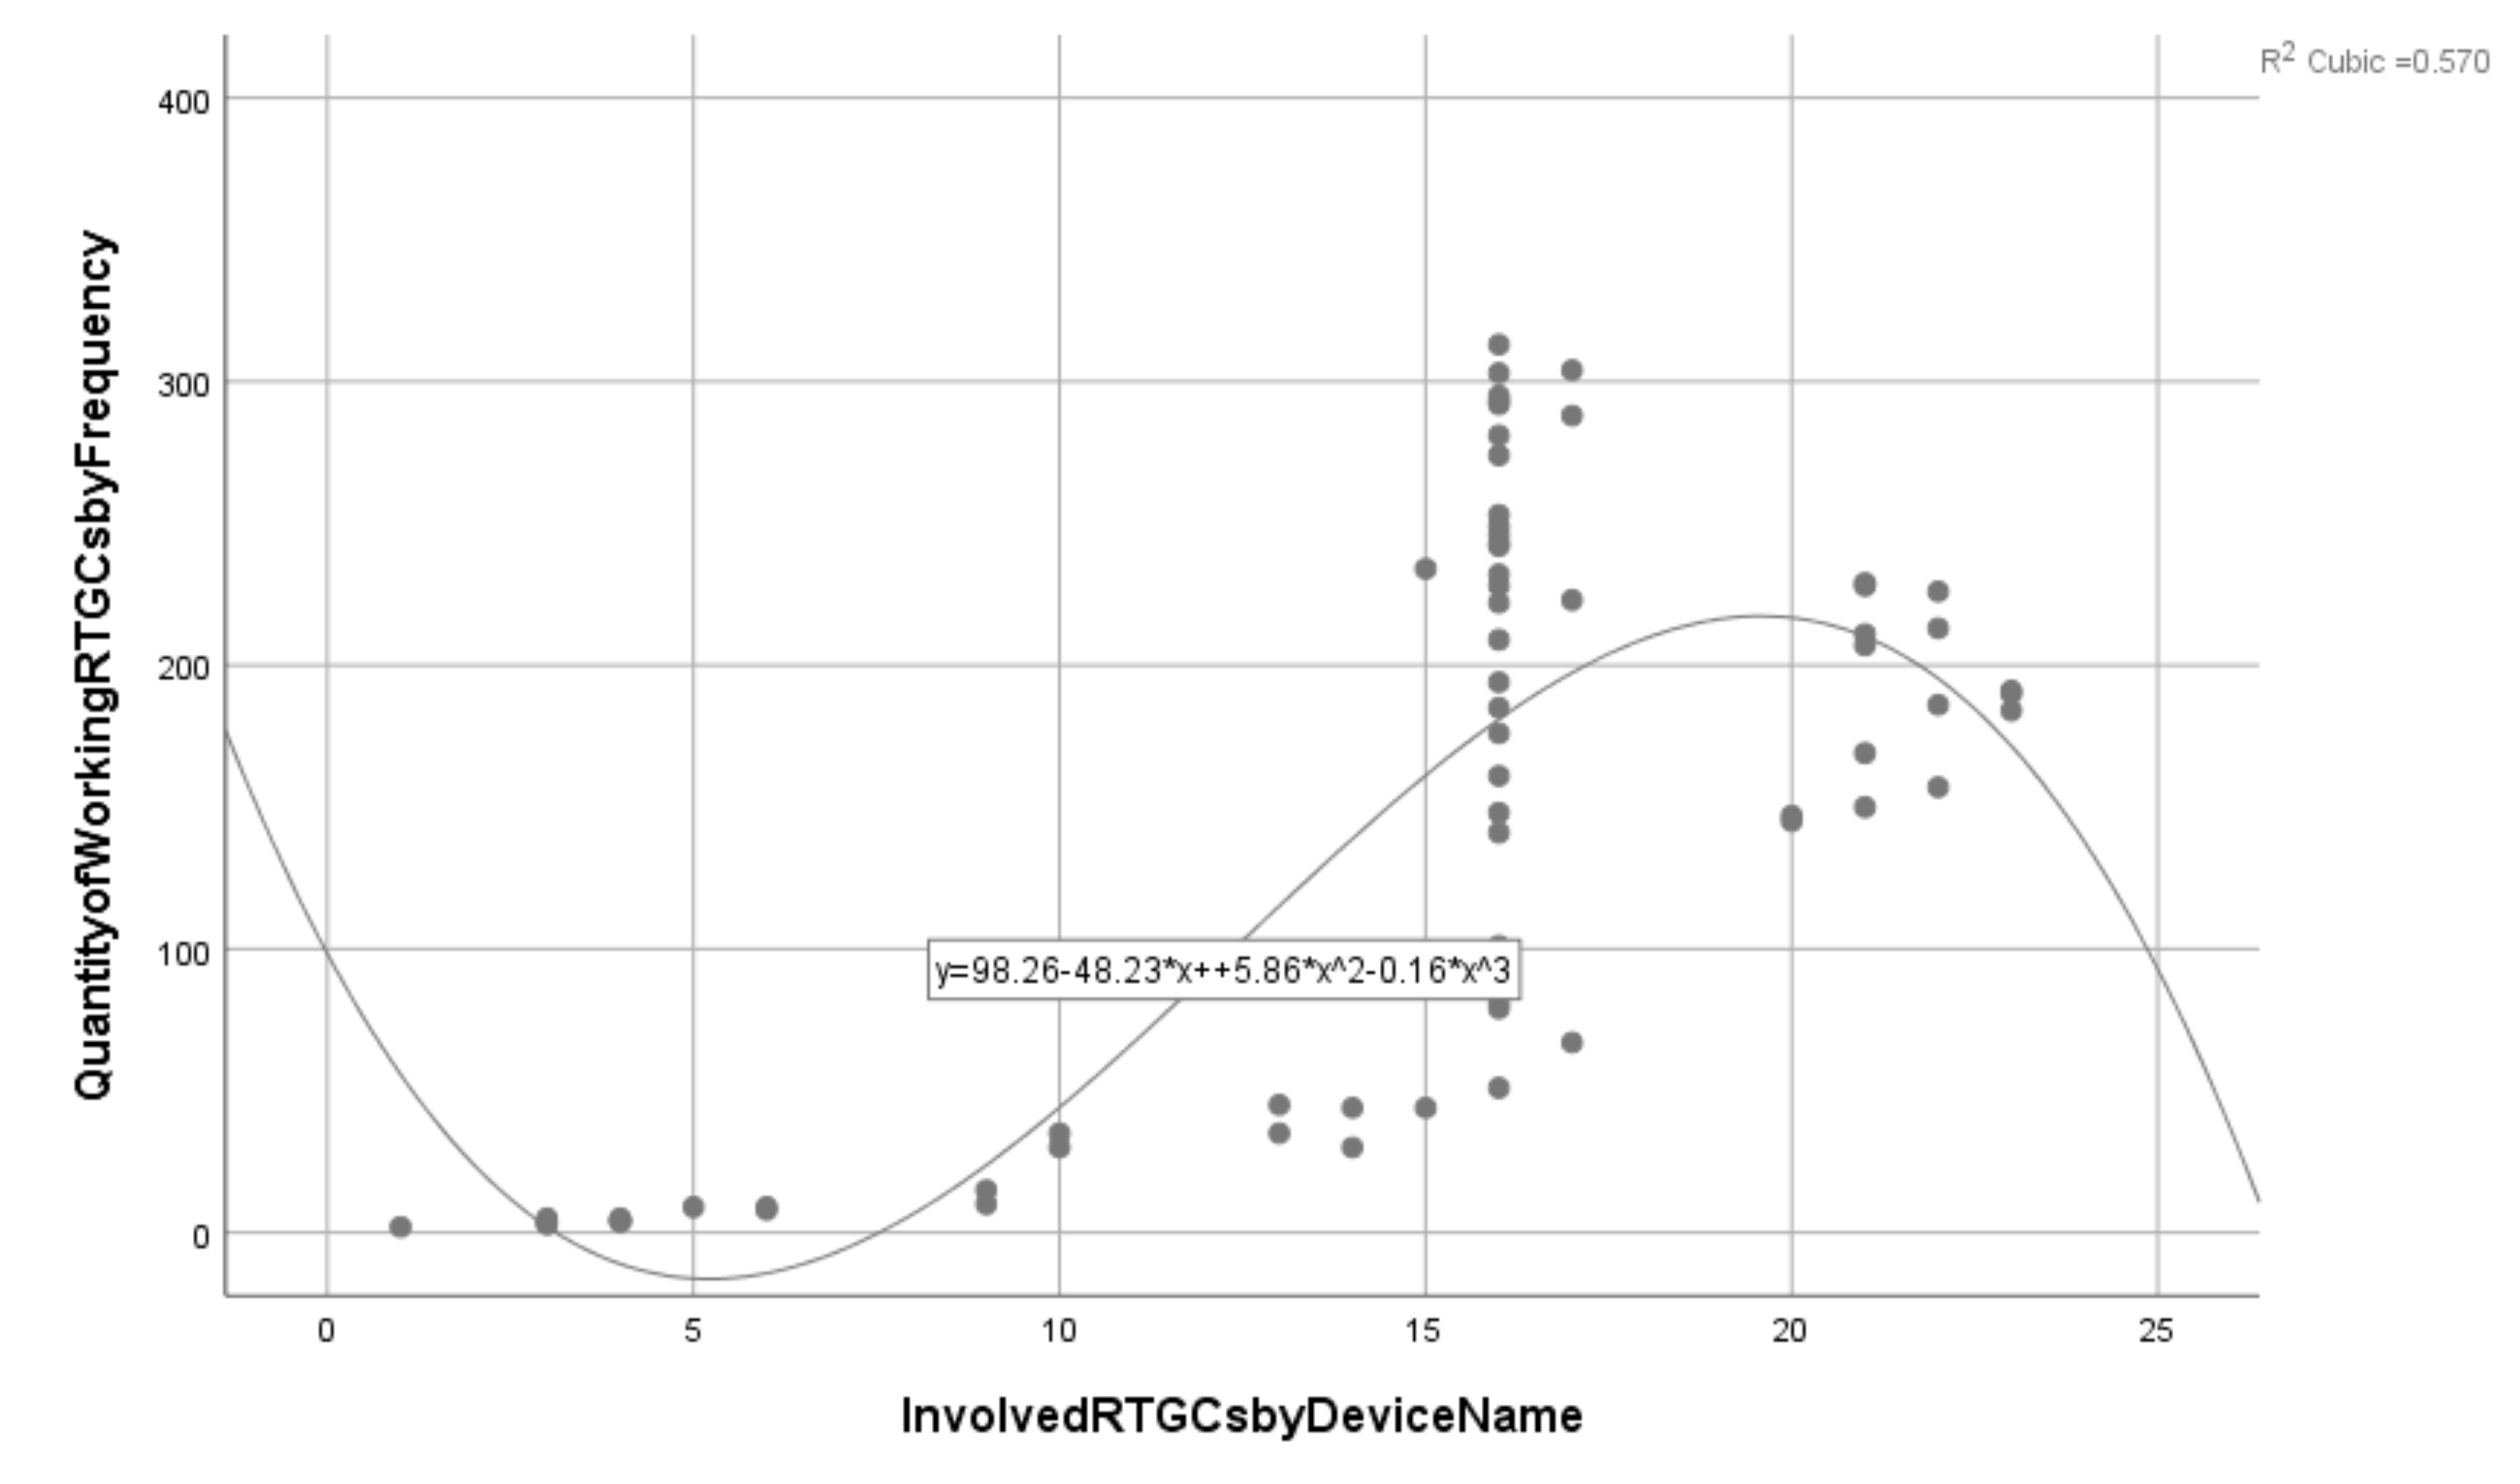
In the previous section, we discussed the LGC-CT performance from the perspective of the RTGC cluster. Now, we launch the discussion of LGC-CT with the view of the yard block container switching. In the same manner, we conducted the correlation analysis for the key performance indicators of container switching, and the result is shown in Table 7. Meanwhile, the three of yard block, quantity of working RTGCs by frequency and work performance, and involved RTGCs by device name are the core components of container switching behaviors, and the interrelated relationships between each other are illustrated by Figure 6, Figure 7, and Figure 8, respectively.
From Table 7, it is discovered that the accessed yard block had only moderate correlation with the task list number or the quantity of working RTGCs by frequency from the Pearson correlation coefficients. What is more, there was even a low correlation between the accessed yard block and the involved RTGCs by device name. A similar case also occurred between the accessed yard block and the handling total volume. It indicated that the LGC-CT tasks were highly dynamic, random, and dispersed for the whole storage yard even with the cycle of weeks. However, the LGC-CT was running around the liners, and the above conditions testify that both of the yard allocation and the collaboration between RTGCs and blocks were inefficient and had poor scheduling performance and switching behaviors. Figure 6 shows this point clearly.
With regard to Figure 7, we can get a clue that there were significant differences on the involved RTGC entities to implement the container switching for the given accessed blocks. Nevertheless, there was almost no distinct processor affinity between the involved RTGC and the accessed block. As a matter of fact, we went one step further to explore the relation of the involved RTGCs and their accessing frequency that only appeared as moderate correlation, which is illustrated by Figure 8. That can easily lead to numerous shiftings of RTGCs, which are avoidable, and it can improve the carbon efficiency of LGC-CT in turn. Namely, whether from the CTL-CCP processor affinity or with the CTL-CCP accessing frequency, there were lots of opportunities for improvement of the LGC-CT at storage yard.
By the combination of Table 7, Figure 6, Figure 7, and Figure 8, it was concluded that the dynamic allocation, binding, and execution of the RTGC and the block was highly arbitrary and the lack of a systematic and short- and medium-term plan, much less long-term direction, not to mention the LGC-CT resource injection, can obtain the linear acceleration effect.
All indicate that the PSAME of LGC-CT at the storage yard were designed, implemented, and executed by the extensive development approach. It was obviously not conducive to the long-term sustainable development of CTLS. The general verdict contrasts markedly with the initial judgment that was described in Section 4.3 previously.
4.6. Further Discussion
The above sections make a detailed scheduling performance evaluation for the execution of LGC-CT at a storage yard with CTL-GCA. Then, we can make some suggestions for the operation of CTLS based on the foregoing executive evaluation. Although there was no obvious processor affinity between the single RTGC and the one-fold block, the embedded PSAME mechanism is supposed to migrate and customize for the running of LGC-CT.
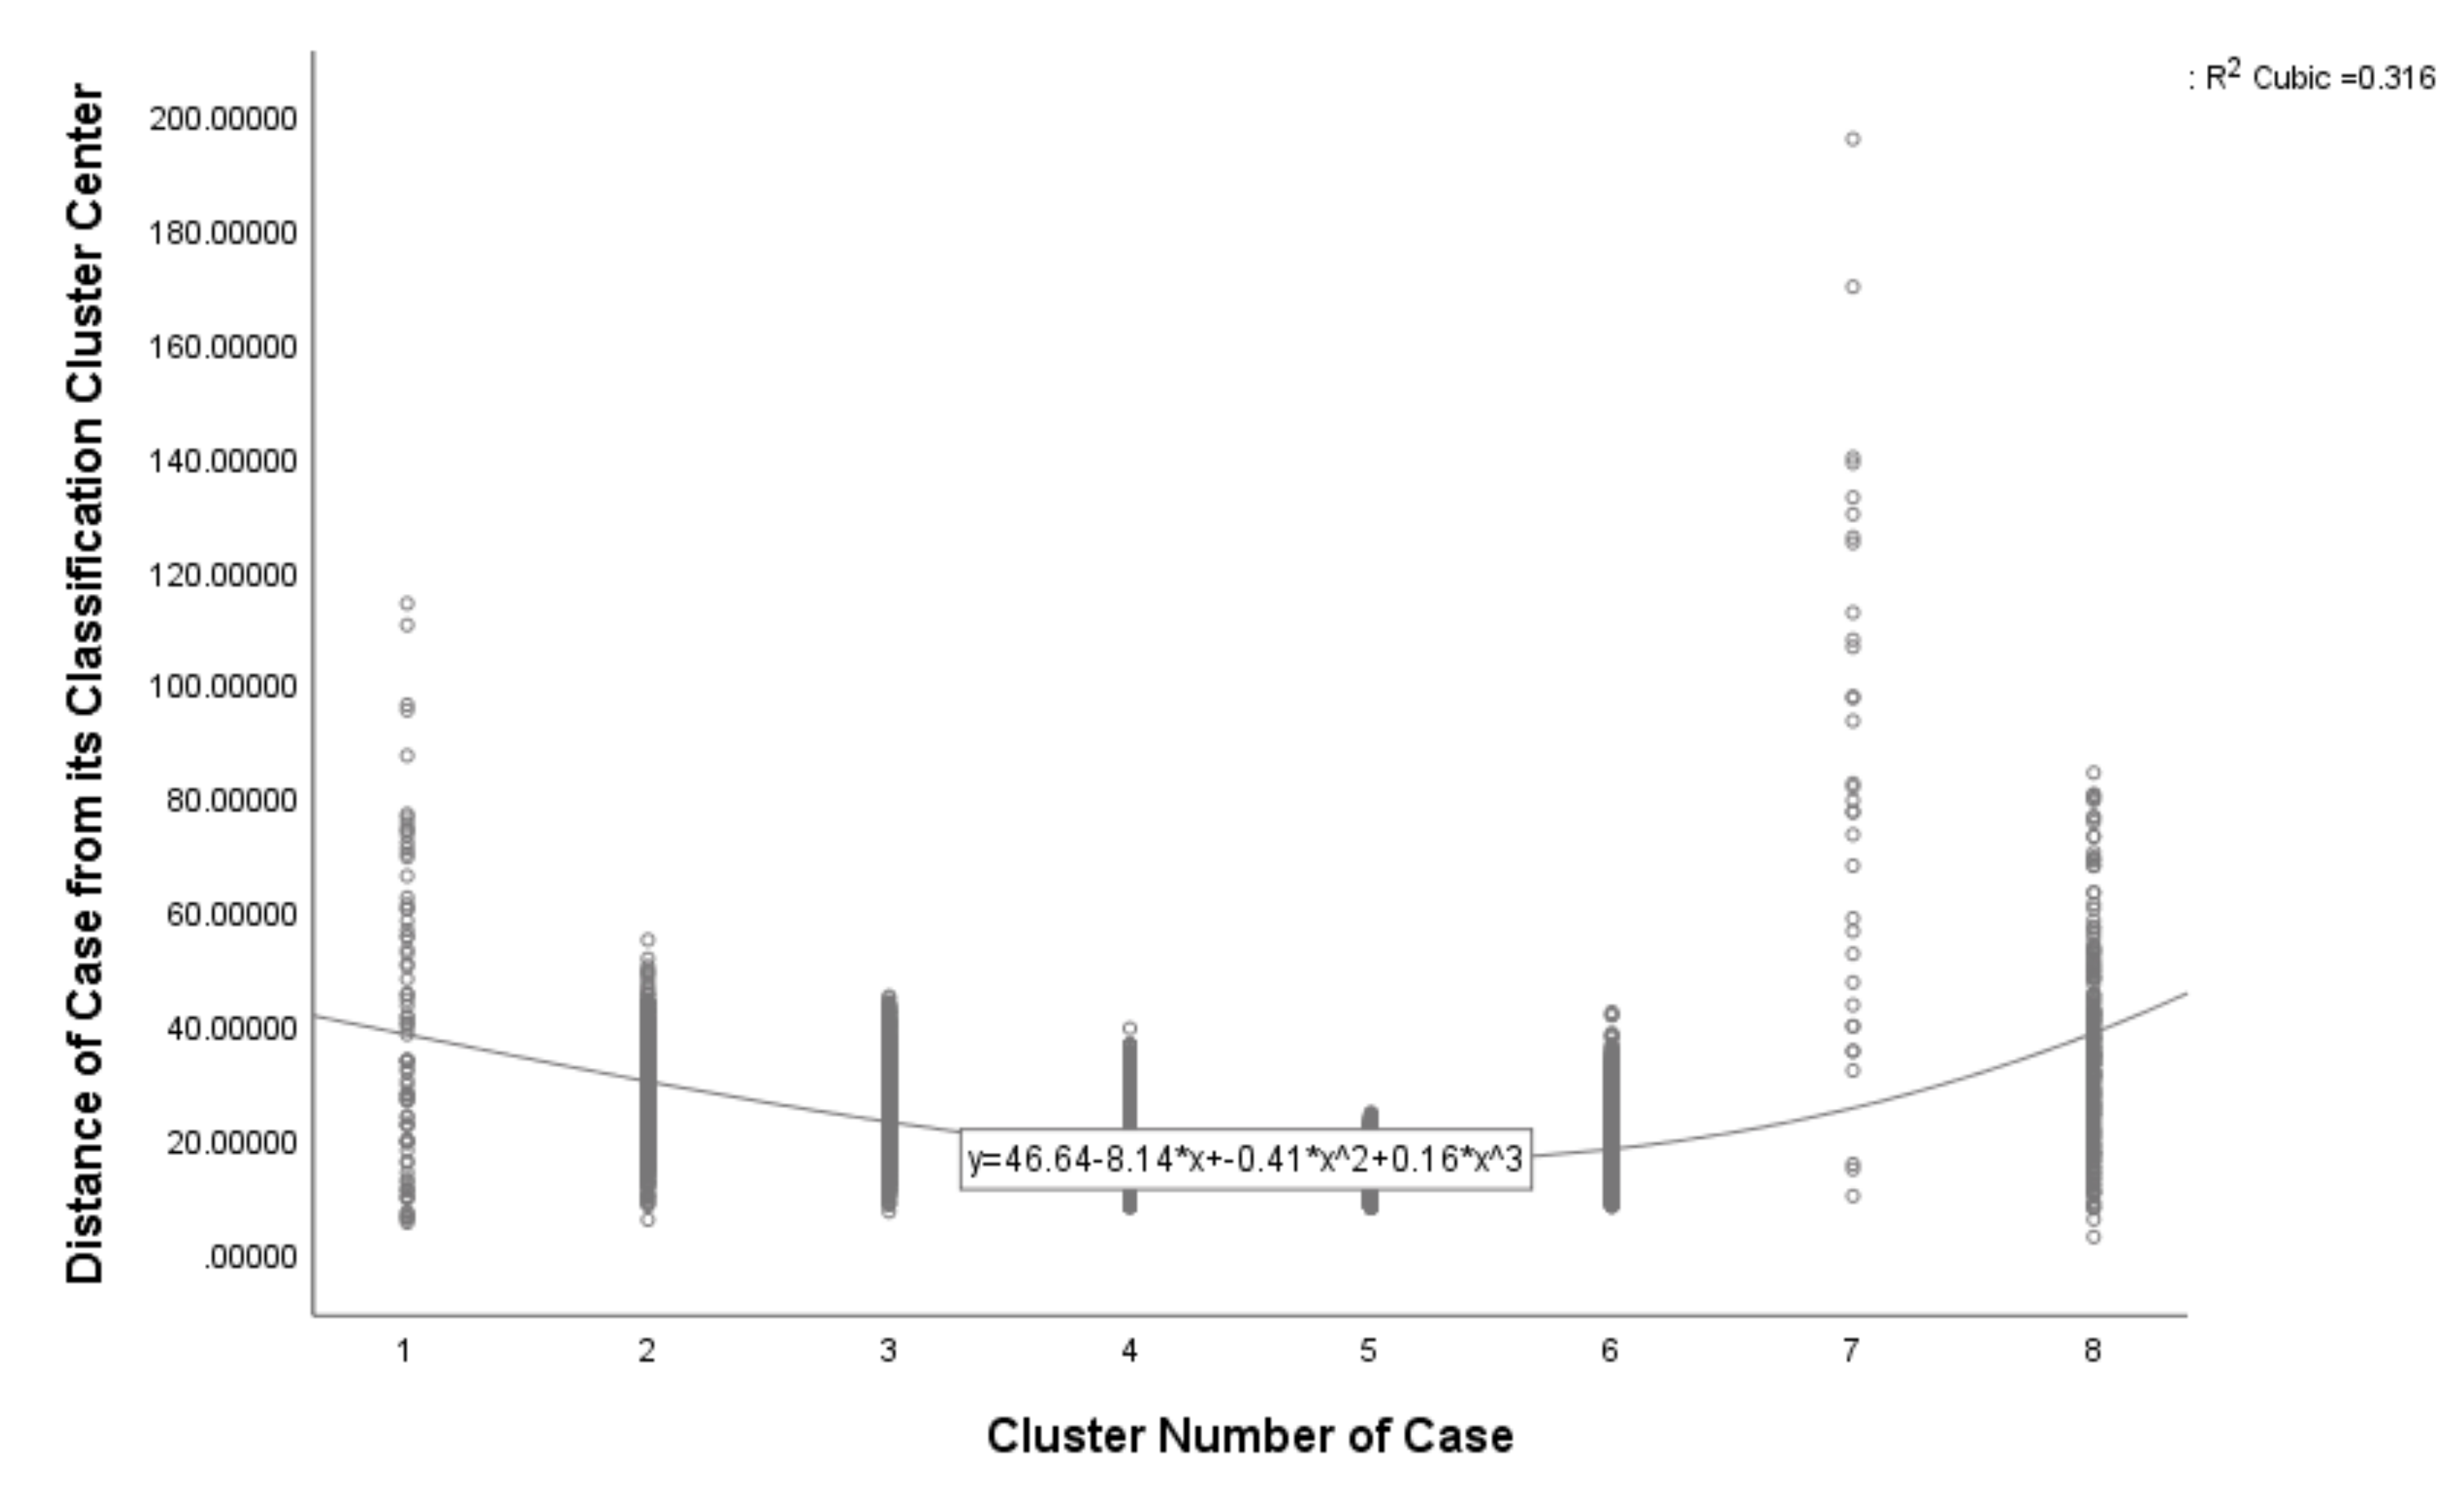
Now, we can combine gang scheduling with processor affinity to explore the potential of LGC-CT at the storage yard to reduce carbon emissions for the sustainable development of CTLS. The gang scheduling and processor affinity of LGC-CT both can be tracked and evaluated in the log. The clustering situations of RTGC and block are the most intuitive, succinct, and concentrated manifestation of parallelism and affinity. Meanwhile, the K-Means algorithm provides a simple, direct, and efficient unsupervised learning way. Then, we designed and implemented a K-Means cluster analysis for the RTGC and block community. Based on the findings of the task set, all the LGC-CT log that covers 18,287 records is executed as a K-Means cluster analysis. The cluster analysis variables mainly include RTGC number, block number, handling container specification, stevedoring full or empty category, and handling volume for a task, and the number of clusters was set as eight. The final cluster centers are shown in Table 8.
The number of cases in each cluster are 80, 844, 1679, 2769, 8098, 4539, 34, and 244, respectively, and all the task cases distance distribution relative to the cluster center are demonstrated by Figure 9. Together with Table 1, Table 2, and Table 3, we can find that the current case cluster is sound, logical, and fully reflecting the actual situations of the LGC-CT. In the cycle of weeks, for one thing, the vast majority of single task for LGC-CT was around 120 CBU or much less according to the number of cases and the distance of cases from the classification cluster center. Meanwhile, the displacement distance of shifting blocks was short. The cluster 2, 3, 4, 5m and 6 all showed the same characteristics. The case number of the five clusters reached up to 17,929 records, and it was 98.04% of the total, approximately. Furthermore, the cases in cluster 5 and cluster 6 were up to 12,637, and both account for 67.48% in the whole. Namely, two-thirds of tasks were about 7 or 11 CBU. For another, there were enormous differences in the distance range of a case from its classification cluster center that are demonstrated in Figure 9. The point densities in the cluster of 2, 3, 4, 5, and 6 were high; at the same time, the point densities in the clusters 1, 7, and 8 were low, especially for the former two. The number of cases in cluster 1 and cluster 7 was only 114, and it merely made up 0.61%.
5. Implications
The above production instance is a very typical example of LGC-CT for the large and medium-sized container terminal. The evaluation analysis and pattern recognition of this case with CTL-GCA is both therapeutic and instructive. Moreover, it is of great reference value for other container terminals, whether in theory or in practice. Some implications can be obtained from the conceptual framework and operating mechanisms, which can be sketched now as follows.
According to the above production practice case, we can suggest some scheduling decision recommendations based on the LGC-CT attached to CTL-GCA. Above all, both of the RTGCs and the blocks can be divided into groups, and then we can establish the flexible and sliding processor affinity relation between the special RTGC teams and the given block sets. The grouping and affinity both are the dynamic adjustment by the dynamic evaluation and instant response feedback mechanism based on the historical, current, and predictable task loads. Secondly, the special RTGC group is reserved for the loading and unloading liners, according to the sailing schedule in every loop time window. The portfolio of gang scheduling and processor affinity is transferred and modified for the planning, control, implementation, and execution of LGC-CT. Thirdly, the above evaluation also exercised positive influences on the block allocation for the liners. It was intended to make a better connection among liners, RTGCs, and blocks. The main optimization objectives contain two aspects. On the one side, the shifting frequency and distance of the RTGC group can be cut down and become more efficient. On the other side, the liner, especially for the ocean routes, can possess the relatively stationary block set. It is also beneficial to the improvement on the allocation of the RTGC group because the intensive LGC-CT time of each block area is better to predict by the combination of sailing schedule, advance arrival notice of ship, and definite time of arrival. That can help us to acquire the better LGC-CT cluster result to ameliorate the operation of the storage yard. Last but not least, the above case analysis and discussion for the LGC-CT at the storage yard was provided with good representations, and has some referential meaning to tap the potential of LGC-CT for the other CTLS. It is supposed to cut down carbon emission dramatically, and then promote the sustainable development of container terminals.
From the perspective of theoretical research, the CTL-GCA further established, explored, and exploited the theoretical framework and practical scheme of computational logistics for CTLS. The CTL-GCA came up with an LGC-CT abstraction, automation, and analysis preliminary sketch substantially, and then solved the PSAME at container terminals by the design and construction problem-oriented explorations modes. It was obviously different from the previous method, and the computational logistics deserve us to further explore, both theoretically and experimentally.
6. Conclusions
Container terminals are the hub nodes in the hierarchical logistics network, and play a pivotal role in the practices of global supply chain. There are some disadvantages for the existing approach to the operation of CTLS. Computational logistics presents a new way to solve the PSAME at container terminals from the nature of computation. In this paper, we established the CTL-GCA, and CTL-CMP and CTL-CCP were abstracted and discussed from the CTL-GCA as well, especially for the latter. It was one of the main original intentions and ultimate purposes to RTCD-IEET of logistics generalized computational patterns based on CTL-GCA for reducing carbon emission. A case study made a detailed analysis to demonstrate the feasibility and credibility of the above theme. In the future, we are going to apply the theory and method of computational logistics to open out the complicated connection of actual production data in CTLS that is the accessing, switching, and carbon-efficient log of LGC-CT in practice, and explore the excellent LGC-CT model, internal running mode, and improvement approaches, especially from the perspective of green production and sustainable development.
Author Contributions
Three authors collaborated to complete this paper, and each author’s contribution is listed below. Conceptualization, G.S. and B.L.; Methodology, B.L.; Software, B.L. and Y.H.; Validation, B.L.; Formal analysis, B.L.; Investigation, G.S., B.L., and Y.H.; Resources, G.S. and B.L.; Data curation, B.L.; Writing—original draft preparation, G.S. and B.L.; Writing—review and editing, B.L.; Visualization, B.L. and Y.H.; Supervision, B.L.; Project administration, G.S. and B.L.; Funding acquisition, B.L. and G.S.
Funding
This research was funded by the Humanities and Social Science Programming Foundation of Ministry of Education in China, grant number 19YJA630031; the Natural Science Foundation of Fujian Province in China, grant number 2017J01496; the Program for New Century Excellent Talents in University of Fujian Province in China, grant number 2015-54; the Scientific Research Foundation of Fujian University of Technology in China, grant number GY-Z160125; and the Traffic Science and Technology Project of Shandong Province in China, grant number 2016B35.
Conflicts of Interest
The authors declare no conflict of interest.
References
- Nuzzolo, A.; Coppola, P.; Comi, A. Freight transport modeling: Review and future challenges. Int. J. Transp. Econ. 2013, 40, 151–181. [Google Scholar]
- Crainic, T.G.; Perboli, G.; Rosano, M. Simulation of intermodal freight transportation systems: A taxonomy. Eur. J. Oper. Res. 2018, 270, 401–418. [Google Scholar] [CrossRef]
- Luna, J.H.; Mar-Ortiz, J.; Gracia, M.D.; Morales-Ramírez, D. An efficiency analysis of cargo-handling operations at container terminals. Marit. Econ. Logist. 2018, 20, 190–210. [Google Scholar] [CrossRef]
- Wang, P.; Mileski, J.; Zeng, Q. Toward a taxonomy of container terminals’ practices and performance: A contingency and configuration study. Transp. Res. Part A Policy Pract. 2019, 121, 92–107. [Google Scholar] [CrossRef]
- Park, N.K.; Suh, S.C. Tendency toward mega containerships and the constraints of container terminals. J. Mar. Sci. Eng. 2019, 7, 131. [Google Scholar] [CrossRef] [Green Version]
- Hervás-Peralta, M.; Poveda-Reyes, S.; Molero, G.D.; Santarremigia, F.E.; Pastor-Ferrando, J.P. Improving the performance of dry and maritime ports by increasing knowledge about the most relevant functionalities of the Terminal Operating System (TOS). Sustainability 2019, 11, 1648. [Google Scholar] [CrossRef] [Green Version]
- Bingbing, L.; Libo, S.; Yugang, Y. Recent advances on researches of warehousing, logistics and supply chain management. J. Univ. Sci. Technol. China 2017, 47, 176–187. [Google Scholar]
- Bierwirth, C.; Meisel, F. A follow-up survey of berth allocation and quay crane scheduling problems in container terminals. Eur. J. Oper. Res. 2015, 244, 675–689. [Google Scholar] [CrossRef]
- Carlo, H.J.; Vis, I.F.; Roodbergen, K.J. Transport operations in container terminals: Literature overview, trends, research directions and classification scheme. Eur. J. Oper. Res. 2014, 236, 1–13. [Google Scholar] [CrossRef]
- Lehnfeld, J.; Knust, S. Loading, unloading and premarshalling of stacks in storage areas: Survey and classification. Eur. J. Oper. Res. 2014, 239, 297–312. [Google Scholar] [CrossRef]
- Rashidi, H.; Tsang, E.P. Novel constraints satisfaction models for optimization problems in container terminals. Appl. Math. Model. 2013, 37, 3601–3634. [Google Scholar] [CrossRef]
- Iris, Ç.; Lam, J.S.L. A review of energy efficiency in ports: Operational strategies, technologies and energy management systems. Renew. Sustain. Energy Rev. 2019, 112, 170–182. [Google Scholar] [CrossRef]
- Li, B. Container terminal logistics scheduling and decision-making within the conceptual framework of computational thinking. In Proceedings of the 54th Annual Conference on Decision and Control (CDC 2015), Osaka, Japan, 15–18 December 2015; pp. 330–337. [Google Scholar]
- Li, B. Container terminal loading and unloading task scheduling based on computational thinking. J. Transp. Syst. Eng. Inf. Technol. 2016, 16, 161–167. [Google Scholar]
- Li, B. Hierarchical, parallel, heterogeneous and reconfigurable computation model of container terminal handling system. J. Traffic Transp. Eng. 2019, 19, 136–155. [Google Scholar]
- Li, B. Collection and distribution virtual machines architecture of container terminal based on computational logistics and its simulation analysis. Comput. Integr. Manuf. Syst. 2018, 24, 245–263. [Google Scholar]
- Li, B.; Sun, B.; Yao, W.; He, Y.; Song, G. Container terminal oriented logistics generalized computational complexity. IEEE Access 2019, 7, 94737–94756. [Google Scholar] [CrossRef]
- Mauri, G.R.; Ribeiro, G.M.; Lorena, L.A.N.; Laporte, G. An adaptive large neighborhood search for the discrete and continuous berth allocation problem. Comput. Oper. Res. 2016, 70, 140–154. [Google Scholar] [CrossRef]
- Hsu, H.P.; Chiang, T.L. An improved shuffled frog-leaping algorithm for solving the dynamic and continuous berth allocation problem (DCBAP). Appl. Sci. 2019, 9, 4682. [Google Scholar] [CrossRef] [Green Version]
- Kramer, A.; Lalla-Ruiz, E.; Iori, M.; Voß, S. Novel formulations and modeling enhancements for the dynamic berth allocation problem. Eur. J. Oper. Res. 2019, 278, 170–185. [Google Scholar] [CrossRef]
- Chen, J.H. A note on: A flexible crane scheduling methodology for container terminals. Flex. Serv. Manuf. J. 2019, 31, 34–40. [Google Scholar] [CrossRef]
- Azevedo, A.T.; de Salles Neto, L.L.; Chaves, A.A.; Moretti, A.C. Solving the 3D stowage planning problem integrated with the quay crane scheduling problem by representation by rules and genetic algorithm. Appl. Soft Comput. 2018, 65, 495–516. [Google Scholar] [CrossRef]
- Msakni, M.K.; Diabat, A.; Rabadi, G.; Al-Salem, M.; Kotachi, M. Exact methods for the quay crane scheduling problem when tasks are modeled at the single container level. Comput. Oper. Res. 2018, 99, 218–233. [Google Scholar] [CrossRef]
- Correcher, J.F.; Alvarez-Valdes, R.; Tamarit, J.M. New exact methods for the time-invariant berth allocation and quay crane assignment problem. Eur. J. Oper. Res. 2019, 275, 80–92. [Google Scholar] [CrossRef]
- Agra, A.; Oliveira, M. MIP approaches for the integrated berth allocation and quay crane assignment and scheduling problem. Eur. J. Oper. Res. 2018, 264, 138–148. [Google Scholar] [CrossRef] [Green Version]
- Iris, Ç.; Lam, J.S.L. Recoverable robustness in weekly berth and quay crane planning. Transp. Res. Part B Methodol. 2019, 122, 365–389. [Google Scholar] [CrossRef]
- Tan, C.; He, J.; Wang, Y. Storage yard management based on flexible yard template in container terminal. Adv. Eng. Inform. 2017, 34, 101–113. [Google Scholar] [CrossRef]
- Jin, X.; Park, K.T.; Kim, K.H. Storage space sharing among container handling companies. Transp. Res. Part E Logist. Transp. Rev. 2019, 127, 111–131. [Google Scholar] [CrossRef]
- Boysen, N.; Emde, S. The parallel stack loading problem to minimize blockages. Eur. J. Oper. Res. 2016, 249, 618–627. [Google Scholar] [CrossRef]
- Lin, D.Y.; Lee, Y.J.; Lee, Y. The container retrieval problem with respect to relocation. Transp. Res. Part C Emerg. Technol. 2015, 52, 132–143. [Google Scholar] [CrossRef]
- Tanaka, S.; Voß, S. An exact algorithm for the block relocation problem with a stowage plan. Eur. J. Oper. Res. 2019, 279, 767–781. [Google Scholar] [CrossRef]
- Gharehgozli, A.; Yu, Y.; de Koster, R.; Du, S. Sequencing storage and retrieval requests in a container block with multiple open locations. Transp. Res. Part E Logist. Transp. Rev. 2019, 125, 261–284. [Google Scholar] [CrossRef]
- Jiang, X.J.; Jin, J.G. A branch-and-price method for integrated yard crane deployment and container allocation in transshipment yards. Trans. Res. Part B Methodol. 2017, 98, 62–75. [Google Scholar] [CrossRef]
- Galle, V.; Barnhart, C.; Jaillet, P. Yard crane scheduling for container storage, retrieval, and relocation. Eur. J. Oper. Res. 2018, 271, 288–316. [Google Scholar] [CrossRef]
- Jaehn, F.; Kress, D. Scheduling cooperative gantry cranes with seaside and landside jobs. Discret. Appl. Math. 2018, 242, 53–68. [Google Scholar] [CrossRef]
- Zeng, G.; Feng, Y.; Yang, Z. Integrated optimization of pickup sequence and container rehandling based on partial truck arrival information. Comput. Ind. Eng. 2019, 127, 366–382. [Google Scholar] [CrossRef]
- Hendriks, M.P.M.; Lefeber, E.; Udding, J.T. Simultaneous berth allocation and yard planning at tactical level. OR Spectr. 2013, 35, 441–456. [Google Scholar] [CrossRef]
- Jin, J.G.; Lee, D.H.; Hu, H. Tactical berth and yard template design at container transshipment terminals: A column generation based approach. Transp. Res. Part E Logist. Transp. Rev. 2015, 73, 168–184. [Google Scholar] [CrossRef]
- Liu, M.; Lee, C.Y.; Zhang, Z.; Chu, C. Bi-objective optimization for the container terminal integrated planning. Transp. Res. Part B Methodol. 2016, 93, 720–749. [Google Scholar] [CrossRef]
- Ma, H.L.; Chung, S.H.; Chan, H.K.; Cui, L. An integrated model for berth and yard planning in container terminals with multi-continuous berth layout. Ann. Oper. Res. 2019, 273, 409–431. [Google Scholar] [CrossRef]
- Legato, P.; Mazza, R.M. A decision support system for integrated container handling in a transshipment hub. Decis. Support Syst. 2018, 108, 45–56. [Google Scholar] [CrossRef]
- Yu, J.; Tang, G.; Song, X.; Yu, X.; Qi, Y.; Li, D.; Zhang, Y. Ship arrival prediction and its value on daily container terminal operation. Ocean Eng. 2018, 157, 73–86. [Google Scholar] [CrossRef]
- Santos, T.A.; Soares, C.G. Container terminal potential hinterland delimitation in a multi-port system subject to a regionalization process. J. Transp. Geogr. 2019, 75, 132–146. [Google Scholar] [CrossRef]
- Edirisinghe, L.; Jin, Z.; Wijeratne, A.W. The reality of container exchange between shipping lines: Clearing the pathway to virtual container yard. Transp. Policy 2018, 72, 55–66. [Google Scholar] [CrossRef]
- Ha, M.H.; Yang, Z.; Lam, J.S.L. Port performance in container transport logistics: A multi-stakeholder perspective. Transp. Policy 2019, 73, 25–40. [Google Scholar] [CrossRef]
- Garg, C.P.; Kashav, V. Evaluating value creating factors in greening the transportation of Global Maritime Supply Chains (GMSCs) of containerized freight. Transp. Res. Part D Transp. Environ. 2019, 73, 162–186. [Google Scholar] [CrossRef]
- Dulebenets, M.A. Green vessel scheduling in liner shipping: Modeling carbon dioxide emission costs in sea and at ports of call. Int. J. Transp. Sci. Technol. 2018, 7, 26–44. [Google Scholar] [CrossRef]
- Yang, Y.C. Operating strategies of CO2 reduction for a container terminal based on carbon footprint perspective. J. Clean. Prod. 2017, 141, 472–480. [Google Scholar] [CrossRef]
- Tsai, Y.T.; Liang, C.J.; Huang, K.H.; Hung, K.H.; Jheng, C.W.; Liang, J.J. Self-management of greenhouse gas and air pollutant emissions in Taichung Port, Taiwan. Transp. Res. Part D Transp. Environ. 2018, 63, 576–587. [Google Scholar] [CrossRef]
- Yun, P.E.N.G.; Xiangda, L.I.; Wenyuan, W.A.N.G.; Ke, L.I.U.; Chuan, L.I. A simulation-based research on carbon emission mitigation strategies for green container terminals. Ocean Eng. 2018, 163, 288–298. [Google Scholar] [CrossRef]
- Liu, D.; Ge, Y.E. Modeling assignment of quay cranes using queueing theory for minimizing CO2 emission at a container terminal. Transp. Res. Part D Transp. Environ. 2018, 61, 140–151. [Google Scholar] [CrossRef]
- Yu, D.; Li, D.; Sha, M.; Zhang, D. Carbon-efficient deployment of electric rubber-tyred gantry cranes in container terminals with workload uncertainty. Eur. J. Oper. Res. 2019, 275, 552–569. [Google Scholar] [CrossRef]
- He, J. Berth allocation and quay crane assignment in a container terminal for the trade-off between time-saving and energy-saving. Adv. Eng. Inform. 2016, 30, 390–405. [Google Scholar] [CrossRef]
- Li, N.; Chen, G.; Govindan, K.; Jin, Z. Disruption management for truck appointment system at a container terminal: A green initiative. Transp. Res. Part D Transp. Environ. 2018, 61, 261–273. [Google Scholar] [CrossRef]
- Venturini, G.; Iris, Ç.; Kontovas, C.A.; Larsen, A. The multi-port berth allocation problem with speed optimization and emission considerations. Transp. Res. Part D Transp. Environ. 2017, 54, 142–159. [Google Scholar] [CrossRef] [Green Version]
- Li, B. Container terminal task scheduling oriented to PID control and simulation optimization. Comput. Integr. Manuf. Syst. 2016, 22, 833–845. [Google Scholar]
- Li, B.; Yang, J.Q. Computational model and simulation analysis for container terminal operation systems under Harvard architecture. Comput. Integr. Manuf. Syst. 2013, 19, 2300–2314. [Google Scholar]
- Li, B.; Shen, W. A gang scheduling computational paradigm for container terminal logistics with processor affinity. In Proceedings of the 2015 IEEE International Conference on Systems, Man, and Cybernetics, Hongkong, China, 9–12 October 2015; pp. 1357–1362. [Google Scholar]
- Li, B.; Wan, Y.F.; Sun, B.; Song, G.G. Container terminal logistics computation performance evaluation with great principles of computing and case study. In Proceedings of the 2018 Chinese Automation Congress, Xi’an, China, 30 November–2 December 2018; pp. 934–939. [Google Scholar]
- Li, B.; Liu, R.H.; Yuan, Y. Container terminal overland collection and distribution logistics generalized computing model with computational logistics and case study. In Proceedings of the 2019 Chinese Control and Decision Conference, Nanchang, China, 3–5 June 2019; pp. 300–305. [Google Scholar]
Figure 1.
Container terminal logistics generalized computing storage hierarchy.

Figure 2.
Container terminal logistics heterogeneous computing elements and memory array.

Figure 3.
Container terminal logistics generalized computing pipeline shop.

Figure 4.
Correlation analysis of RTGC task number and accessing blocks frequency.

Figure 5.
Correlation analysis of accessing blocks frequency and involved yard blocks.

Figure 6.
Correlation analysis of accessed yard blocks and RTGCs working frequency.

Figure 7.
Correlation analysis of accessed yard blocks and involved RTGCs by device name.

Figure 8.
Correlation analysis of the involved RTGCs and RTGCs accessing frequency.

Figure 9.
Task cases distance distribution relative to the cluster center.


Table 1.
Overview of total LGC-CT tasks at storage yard.
| Week ID | Participant RTGCs | Involved Blocks | Task List Number | Total Cases of Box Unit |
|---|---|---|---|---|
| 1 | 23 | 46 | 628 | 21,407 |
| 2 | 24 | 46 | 670 | 20,527 |
| 3 | 24 | 43 | 678 | 21,071 |
| 4 | 23 | 50 | 718 | 21,762 |
| 5 | 23 | 55 | 720 | 20,357 |
| 6 | 23 | 55 | 734 | 20,620 |
| 7 | 24 | 49 | 724 | 22,387 |
| 8 | 23 | 45 | 694 | 21,321 |
| 9 | 25 | 42 | 717 | 22,385 |
| 10 | 24 | 47 | 695 | 20,528 |
| 11 | 23 | 40 | 681 | 19,629 |
| 12 | 23 | 40 | 647 | 20,327 |
| 13 | 23 | 43 | 671 | 19,693 |
| 14 | 25 | 42 | 671 | 19,304 |
| 15 | 25 | 46 | 681 | 15,884 |
| 16 | 25 | 57 | 844 | 21,460 |
| 17 | 24 | 46 | 796 | 22,715 |
| 18 | 21 | 47 | 728 | 20,199 |
| 19 | 24 | 44 | 603 | 11,295 |
| 20 | 23 | 53 | 930 | 28,648 |
| 21 | 23 | 56 | 899 | 22,949 |
| 22 | 22 | 54 | 866 | 25,737 |
| 23 | 21 | 45 | 712 | 20,968 |
| 24 | 22 | 50 | 761 | 21,561 |
| 25 | 22 | 48 | 819 | 23,746 |
Table 2.
Key statistical characteristics of overall LGC-CT tasks at storage yard.
| Week ID | Task Number | Minimum of a Task | Maximum of a Task | Mean of Tasks | Median of Tasks | Mode of Tasks | Standard Deviation |
|---|---|---|---|---|---|---|---|
| 1 | 628 | 1 | 794 | 34.09 | 13.50 | 1 | 68.547 |
| 2 | 670 | 1 | 738 | 30.64 | 11.50 | 1 | 62.051 |
| 3 | 678 | 1 | 728 | 31.08 | 13.00 | 1 | 56.774 |
| 4 | 718 | 1 | 737 | 30.31 | 12.00 | 1 | 53.559 |
| 5 | 720 | 1 | 398 | 28.27 | 10.00 | 1 | 48.430 |
| 6 | 734 | 1 | 516 | 28.09 | 11.00 | 1 | 47.319 |
| 7 | 724 | 1 | 768 | 30.92 | 12.00 | 1 | 59.205 |
| 8 | 694 | 1 | 608 | 30.72 | 12.00 | 1 | 53.061 |
| 9 | 717 | 1 | 723 | 31.22 | 13.00 | 1 | 55.588 |
| 10 | 695 | 1 | 563 | 29.54 | 12.00 | 1 | 45.799 |
| 11 | 681 | 1 | 521 | 28.82 | 12.00 | 1 | 44.685 |
| 12 | 647 | 1 | 551 | 31.42 | 15.00 | 1 | 46.578 |
| 13 | 671 | 1 | 501 | 29.35 | 13.00 | 1 | 46.931 |
| 14 | 671 | 1 | 398 | 28.77 | 14.00 | 1 | 44.042 |
| 15 | 681 | 1 | 417 | 23.32 | 9.00 | 1 | 40.470 |
| 16 | 844 | 1 | 696 | 25.43 | 10.00 | 1 | 46.009 |
| 17 | 796 | 1 | 521 | 28.54 | 12.00 | 1 | 50.606 |
| 18 | 728 | 1 | 423 | 27.75 | 12.00 | 1 | 46.558 |
| 19 | 603 | 1 | 235 | 18.73 | 8.00 | 1 | 28.253 |
| 20 | 930 | 1 | 657 | 30.80 | 14.00 | 1 | 50.379 |
| 21 | 899 | 1 | 563 | 25.53 | 10.00 | 1 | 43.870 |
| 22 | 866 | 1 | 555 | 29.72 | 13.50 | 1 | 47.669 |
| 23 | 712 | 1 | 559 | 29.45 | 13.00 | 1 | 49.669 |
| 24 | 761 | 1 | 486 | 28.33 | 12.00 | 1 | 43.161 |
| 25 | 819 | 1 | 542 | 28.99 | 13.00 | 1 | 44.660 |
Table 3.
Characteristic values of task set.
| Week ID | Minimum of a Task | Frequency | Typical Value | Cumulative Percent | Maximum of a Task | Frequency | Typical Value | Cumulative Percent |
|---|---|---|---|---|---|---|---|---|
| 1 | 1 | 60 | 1-15 | 53.5% | 794 | 1 | 183-794 | 2.4% |
| 2 | 1 | 73 | 1-15 | 57.3% | 738 | 1 | 170-738 | 2.2% |
| 3 | 1 | 89 | 1-15 | 55.2% | 728 | 1 | 168-728 | 2.2% |
| 4 | 1 | 83 | 1-15 | 58.2% | 737 | 1 | 173-737 | 2.2% |
| 5 | 1 | 93 | 1-15 | 59.6% | 398 | 1 | 171-398 | 2.1% |
| 6 | 1 | 105 | 1-15 | 57.6% | 516 | 1 | 155-516 | 2.2% |
| 7 | 1 | 84 | 1-15 | 56.5% | 768 | 1 | 179-768 | 2.1% |
| 8 | 1 | 86 | 1-15 | 55.6% | 608 | 1 | 157-608 | 2.3% |
| 9 | 1 | 95 | 1-15 | 55.0% | 723 | 1 | 163-723 | 2.1% |
| 10 | 1 | 86 | 1-15 | 54.2% | 563 | 1 | 142-563 | 2.3% |
| 11 | 1 | 81 | 1-15 | 55.7% | 521 | 1 | 139-521 | 2.3% |
| 12 | 1 | 60 | 1-15 | 51.6% | 551 | 1 | 158-193 | 2.3% |
| 13 | 1 | 86 | 1-15 | 54.1% | 501 | 1 | 136-501 | 2.5% |
| 14 | 1 | 55 | 1-15 | 54.1% | 398 | 1 | 145-398 | 2.2% |
| 15 | 1 | 85 | 1-15 | 62.4% | 417 | 1 | 141-417 | 2.5% |
| 16 | 1 | 104 | 1-15 | 60.1% | 696 | 1 | 178-696 | 1.8% |
| 17 | 1 | 85 | 1-15 | 55.4% | 521 | 1 | 163-521 | 1.9% |
| 18 | 1 | 81 | 1-15 | 56.5% | 423 | 1 | 164-423 | 2.1% |
| 19 | 1 | 95 | 1-15 | 66.3% | 235 | 1 | 108-235 | 2.8% |
| 20 | 1 | 99 | 1-15 | 52.7% | 657 | 1 | 172-657 | 1.7% |
| 21 | 1 | 118 | 1-15 | 60.7% | 563 | 1 | 165-563 | 1.7% |
| 22 | 1 | 98 | 1-15 | 52.8% | 555 | 1 | 185-555 | 1.7% |
| 23 | 1 | 82 | 1-15 | 53.4% | 559 | 1 | 165-559 | 2.1% |
| 24 | 1 | 87 | 1-15 | 54.1% | 486 | 1 | 139-486 | 2.2% |
| 25 | 1 | 84 | 1-15 | 53.6% | 542 | 1 | 160-542 | 1.8% |
Table 4.
LGC-CT key performance indicators of single RTGC.
| Week ID | Participant RTGCs | PC-TLHV | TS-TLHV | PC-YBHV | TS-YBHV | PC-YBTL | TS-YBTL |
|---|---|---|---|---|---|---|---|
| 1 | 23 | 0.454 | 0.029 | 0.437 | 0.037 | 0.988 | 0.000 |
| 2 | 24 | 0.493 | 0.014 | 0.480 | 0.018 | 0.978 | 0.000 |
| 3 | 24 | 0.548 | 0.006 | 0.525 | 0.008 | 0.983 | 0.000 |
| 4 | 23 | 0.675 | 0.000 | 0.654 | 0.001 | 0.972 | 0.000 |
| 5 | 23 | 0.646 | 0.001 | 0.616 | 0.002 | 0.990 | 0.000 |
| 6 | 23 | 0.671 | 0.000 | 0.661 | 0.001 | 0.987 | 0.000 |
| 7 | 24 | 0.491 | 0.015 | 0.451 | 0.027 | 0.987 | 0.000 |
| 8 | 23 | 0.546 | 0.007 | 0.480 | 0.020 | 0.977 | 0.000 |
| 9 | 25 | 0.646 | 0.000 | 0.654 | 0.000 | 0.976 | 0.000 |
| 10 | 24 | 0.671 | 0.000 | 0.678 | 0.000 | 0.976 | 0.000 |
| 11 | 23 | 0.639 | 0.001 | 0.633 | 0.001 | 0.988 | 0.000 |
| 12 | 23 | 0.730 | 0.000 | 0.796 | 0.001 | 0.969 | 0.000 |
| 13 | 23 | 0.642 | 0.001 | 0.670 | 0.000 | 0.966 | 0.000 |
| 14 | 25 | 0.665 | 0.000 | 0.653 | 0.000 | 0.974 | 0.000 |
| 15 | 25 | 0.669 | 0.000 | 0.702 | 0.000 | 0.981 | 0.000 |
| 16 | 25 | 0.596 | 0.002 | 0.580 | 0.002 | 0.980 | 0.000 |
| 17 | 24 | 0.613 | 0.001 | 0.604 | 0.002 | 0.988 | 0.000 |
| 18 | 21 | 0.570 | 0.007 | 0.617 | 0.003 | 0.982 | 0.000 |
| 19 | 24 | 0.754 | 0.000 | 0.786 | 0.000 | 0.979 | 0.000 |
| 20 | 23 | 0.770 | 0.000 | 0.777 | 0.000 | 0.977 | 0.000 |
| 21 | 23 | 0.751 | 0.000 | 0.737 | 0.000 | 0.987 | 0.000 |
| 22 | 22 | 0.663 | 0.001 | 0.607 | 0.003 | 0.980 | 0.000 |
| 23 | 21 | 0.487 | 0.025 | 0.506 | 0.019 | 0.985 | 0.000 |
| 24 | 22 | 0.711 | 0.000 | 0.752 | 0.000 | 0.982 | 0.000 |
| 25 | 22 | 0.668 | 0.001 | 0.602 | 0.003 | 0.980 | 0.000 |
| 1-25 | 25 | 0.766 | 0.000 | 0.782 | 0.000 | 0.995 | 0.000 |
Table 5.
Single CTL-CCP accessing and switching sketch.
| Facility ID | Yard Crane | Task List Number | Quantity of Working Yard Blocks by Frequency | Involved Yard Blocks by Area Name | Total of Handling Volumes |
|---|---|---|---|---|---|
| 1 | RTGC 01 | 258 | 160 | 49 | 5777 |
| 2 | RTGC 02 | 1044 | 602 | 62 | 25,393 |
| 3 | RTGC 03 | 722 | 396 | 60 | 18,280 |
| 4 | RTGC 04 | 948 | 574 | 63 | 21,571 |
| 5 | RTGC 05 | 958 | 539 | 55 | 23,118 |
| 6 | RTGC 06 | 960 | 550 | 57 | 24,720 |
| 7 | RTGC 07 | 957 | 529 | 54 | 23,386 |
| 8 | RTGC 08 | 1022 | 563 | 62 | 22,907 |
| 9 | RTGC 09 | 1276 | 661 | 56 | 28,231 |
| 10 | RTGC 11 | 1218 | 653 | 59 | 30,634 |
| 11 | RTGC 12 | 1125 | 583 | 57 | 26,226 |
| 12 | RTGC 13 | 1164 | 642 | 59 | 31,478 |
| 13 | RTGC 14 | 1118 | 588 | 56 | 22,927 |
| 14 | RTGC 15 | 1076 | 581 | 56 | 24,715 |
| 15 | RTGC 16 | 1011 | 542 | 55 | 23,824 |
| 16 | RTGC 17 | 1052 | 552 | 56 | 23,704 |
| 17 | RTGC 18 | 91 | 48 | 6 | 19,184 |
| 18 | RTGC 19 | 80 | 44 | 8 | 11,506 |
| 19 | RTGC 20 | 76 | 43 | 3 | 4419 |
| 20 | RTGC 21 | 107 | 54 | 6 | 22,906 |
| 21 | RTGC 22 | 64 | 34 | 4 | 3785 |
| 22 | RTGC 23 | 438 | 266 | 24 | 17,578 |
| 23 | RTGC 24 | 468 | 296 | 25 | 20,244 |
| 24 | RTGC 25 | 527 | 331 | 24 | 25,229 |
| 25 | RTGC 26 | 527 | 320 | 23 | 24,738 |
Table 6.
Correlation analysis of single CTL-CCP and accessing blocks.
| Yard Crane | Task List Number | Quantity of Working Yard Blocks by Frequency | Involved Yard Blocks by Area Name | Total of Handling Volumes | |
|---|---|---|---|---|---|
| Yard Crane | 1 (0.000) | 0.514 (0.009) | 0.521 (0.008) | 0.759 (0.000) | 0.151 (0.471) |
| Task List Number | 0.151 (0.471) | 1 (0.000) | 0.995 (0.000) | 0.912 (0.000) | 0.776 (0.000) |
| Quantity of Working Yard Blocks by Frequency | 0.521 (0.008) | 0.995 (0.000) | 1 (0.000) | 0.919 (0.000) | 0.782 (0.000) |
| Involved Yard Blocks by Area Name | 0.759 (0.000) | 0.912 (0.000) | 0.919 (0.000) | 1 (0.000) | 0.586 (0.002) |
| Total of Handling Volumes | 0.151 (0.471) | 0.776 (0.000) | 0.782 (0.000) | 0.586 (0.002) | 1 (0.000) |
Table 7.
Yard block container switching performance analysis.
| Yard Block | Task List Number | Quantity of Working RTGCs by Frequency | Involved RTGCs by Device Name | Total of Handling Volumes | |
|---|---|---|---|---|---|
| Yard Block | 1 (0.000) | 0.599 (0.000) | 0.545 (0.000) | 0.204 (0.087) | 0.209 (0.080) |
| Task List Number | 0.599 (0.000) | 1 (0.000) | 0.967 (0.000) | 0.581 (0.000) | 0.757 (0.000) |
| Quantity of Working RTGCs by Frequency | 0.545 (0.000) | 0.967 (0.000) | 1 (0.000) | 0.694 (0.000) | 0.777 (0.000) |
| Involved RTGCs by Device Name | 0.204 (0.087) | 0.581 (0.000) | 0.694 (0.000) | 1 (0.000) | 0.708 (0.000) |
| Total of Handling Volumes | 0.209 (0.080) | 0.757 (0.000) | 0.777 (0.000) | 0.708 (0.000) | 1 (0.000) |
Table 8.
Final cluster centers for LGC-CT resource community.
| Cluster 1 | Cluster 2 | Cluster 3 | Cluster 4 | Cluster 5 | Cluster 6 | Cluster 7 | Cluster 8 | |
|---|---|---|---|---|---|---|---|---|
| RTGC Facility ID | 19 | 12 | 12 | 10 | 9 | 13 | 19 | 17 |
| Yard Block District ID | 53 | 34 | 36 | 14 | 14 | 48 | 49 | 43 |
| Handling Container Specifications | 20 | 25 | 26 | 32 | 32 | 32 | 20 | 22 |
| Full or Empty Category | Full | Full | Full | Full | Full | Full | Full | Full |
| Handling Volume for a Task | 365 | 120 | 68 | 38 | 7 | 11 | 598 | 201 |
© 2019 by the authors. Licensee MDPI, Basel, Switzerland. This article is an open access article distributed under the terms and conditions of the Creative Commons Attribution (CC BY) license (http://creativecommons.org/licenses/by/4.0/).
Share and Cite
MDPI and ACS Style
Song, G.; Li, B.; He, Y. Container Terminal Logistics Generalized Computing Architecture and Green Initiative Computational Pattern Performance Evaluation. Information 2019, 10, 383. https://0-doi-org.brum.beds.ac.uk/10.3390/info10120383
AMA Style
Song G, Li B, He Y. Container Terminal Logistics Generalized Computing Architecture and Green Initiative Computational Pattern Performance Evaluation. Information. 2019; 10(12):383. https://0-doi-org.brum.beds.ac.uk/10.3390/info10120383
Chicago/Turabian StyleSong, Guanggang, Bin Li, and Yuqing He. 2019. "Container Terminal Logistics Generalized Computing Architecture and Green Initiative Computational Pattern Performance Evaluation" Information 10, no. 12: 383. https://0-doi-org.brum.beds.ac.uk/10.3390/info10120383
Note that from the first issue of 2016, this journal uses article numbers instead of page numbers. See further details here.