Article

How Do eHMIs Affect Pedestrians’ Crossing Behavior? A Study Using a Head-Mounted Display Combined with a Motion Suit

by
Lars Kooijman
1,
Riender Happee
2,3 and
Joost C. F. de Winter
2,*
1
Department of BioMechanical Engineering, Delft University of Technology, Mekelweg 2, CD 2628 Delft, The Netherlands
2
Department of Cognitive Robotics, Delft University of Technology, Mekelweg 2, CD 2628 Delft, The Netherlands
3
Department of Transport & Planning, Delft University of Technology, Mekelweg 2, CD 2628 Delft, The Netherlands
*
Author to whom correspondence should be addressed.
Submission received: 23 October 2019 / Revised: 25 November 2019 / Accepted: 26 November 2019 / Published: 6 December 2019

Abstract

:
In future traffic, automated vehicles may be equipped with external human-machine interfaces (eHMIs) that can communicate with pedestrians. Previous research suggests that, during first encounters, pedestrians regard text-based eHMIs as clearer than light-based eHMIs. However, in much of the previous research, pedestrians were asked to imagine crossing the road, and unable or not allowed to do so. We investigated the effects of eHMIs on participants’ crossing behavior. Twenty-four participants were immersed in a virtual urban environment using a head-mounted display coupled to a motion-tracking suit. We manipulated the approaching vehicles’ behavior (yielding, nonyielding) and eHMI type (None, Text, Front Brake Lights). Participants could cross the road whenever they felt safe enough to do so. The results showed that forward walking velocities, as recorded at the pelvis, were, on average, higher when an eHMI was present compared to no eHMI if the vehicle yielded. In nonyielding conditions, participants showed a slight forward motion and refrained from crossing. An analysis of participants’ thorax angle indicated rotation towards the approaching vehicles and subsequent rotation towards the crossing path. It is concluded that results obtained via a setup in which participants can cross the road are similar to results from survey studies, with eHMIs yielding a higher crossing intention compared to no eHMI. The motion suit allows investigating pedestrian behaviors related to bodily attention and hesitation.

1. Introduction

Worldwide, 22% of traffic fatalities concern pedestrians [1], and over 90% of car accidents are attributable to driver error [2]. Automated vehicles (AVs) could reduce the number of accidents substantially. However, the implementation of AVs will happen gradually over several decades (e.g., [3]), which means that AVs and conventional vehicles will likely share the same roads.
In this type of mixed traffic, it may be unclear to pedestrians and other road users whether an approaching vehicle is driven manually or driving automatically. Pedestrians sometimes rely on cues from the driver, such as hand gestures and eye contact [4,5], and the absence thereof could debilitate pedestrian safety. External communication devices (i.e., external human-machine interfaces, eHMIs) on AVs might be a suitable replacement for the communication signals of drivers to pedestrians and aid pedestrians in perceiving the intention of the vehicle.
The literature on AV communication and the efficacy of eHMIs is rapidly expanding. Researchers have investigated the efficacy of eHMIs as communicative replacements for humans by means of computer surveys, lab experiments, and field tests.
Fridman et al. [6] conducted an online survey in which they presented 30 eHMI concepts and asked respondents whether they thought it was safe to cross the road based on the information provided by the eHMI. They found that text displays stating “Walk” or “Don’t Walk” were considered clear, whereas green or red headlights were regarded as relatively ambiguous. Chang et al. [7] conducted a survey in which they tested five types of eHMIs, including a text display, lights, and a projection. In this study as well, participants found a text display to be the easiest to interpret. In Ackermann et al. [8], participants rated an LED light strip as highly unambiguous compared to eHMIs in the form of a display or projection that provided textual or symbolic advice. An online survey conducted by Bazilinskyy et al. [9] showed that participants tended to apply an egocentric perspective, in the sense that an eHMI with the text “Walk” or “Don’t walk” was regarded as clearer and more persuasive than “Will Stop” or “Won’t stop”. Other online or lab-based surveys about the effectiveness of eHMIs have been conducted by Deb et al. [10], Hagenzieker et al. [11], Dey et al. [12], and Zhang et al. [13]. Typically, in surveys, the participant is shown a picture, an animation, or a recorded video from an on-road setting after which questions are asked, such as whether the participant would feel safe to cross in front of the car. An advantage of surveys is that they allow for a high number of repetitions with variations of eHMIs. A disadvantage, however, is that they require participants to imagine how they would act or feel, an approach that may have limited validity.
Others have used lab setups that immerse the participant in a traffic scenario [14,15,16,17]. De Clercq et al. [18] investigated the effect of eHMIs on the crossing intentions of pedestrians in a virtual reality environment presented via a head-mounted display (HMD). The participants stood on a curb and watched a platoon of oncoming AVs, which were devoid of or equipped with one of four eHMIs. The presence of an eHMI, indicating whether the AV would stop or not, significantly increased participants’ perceived safety compared to a situation in which an eHMI was absent. A text-based eHMI was found to be the clearest overall. Using a similar setup, Ackermans [19] found that an eHMI consisting of a light animation made participants feel safer to cross compared to no eHMI. Weber et al. [20], also using an HMD, found benefits of eHMIs in terms of correct recognition rate of the vehicle’s intention as well as response times. Due to their high visual field of view, HMDs offer a higher level of perceptual fidelity than survey studies. In De Clercq et al. [18] and Ackermans [19], participants were tasked to press a button when they would intend to cross or recognize the approaching vehicle’s intention. In the on-road study by Walker et al. [17], participants used a physical box with a slider to indicate their willingness to cross, whereas in a simulator study by Mahadevan et al. [14], a virtual slider was used. The button and slider approach both allow performing analyses on how the crossing intention varies as a function of the distance between the pedestrian and the approaching vehicle. Although this method yields insights that questionnaires are unable to offer, the participants’ behavior is measured in a subjective binary (i.e., button press/not pressed) or continuous manner (e.g., across the range of the slider), rather than an objective manner (e.g., forward gait).
Yet another method of evaluating eHMIs is to perform a field test on an actual road that is closed off from traffic. Clamann et al. [21] let participants stand on a curb while a van with eHMI was approaching. The authors extracted measures such as the moment participants turned their face to the vehicle, and the moment participants began to cross the road. The results showed no significant effect of the type and presence of the eHMI. Similar results were obtained by Palmeiro et al. [22]. They found that the presence of a sign “self-driving” did not significantly affect participants’ critical gap times, that is, the last moment participants felt safe to cross. A limitation of both Clamann et al. [21] and Palmeiro et al. [22] is that participants were not permitted to step onto the road because of ethical and safety reasons; in the former study participants were physically constrained by a rope around their waist, whereas in the latter participants were asked to step back when they did not feel safe to cross anymore. Furthermore, field studies like these face a challenge of repeatability, as there tend to be fluctuations in the speed of the oncoming car, as well as in weather conditions [22]. Additionally, there are coding/timing challenges because pedestrian behavior is extracted from video recordings and needs to be synchronized with the AV’s GPS signal.
In an overview paper, Cefkin et al. [23] described multiple research methods to examine eHMIs for highly automated vehicles used in the Renault–Nissan–Mitsubishi Alliance Innovation Lab. Among the methods were observations of stop intersections and on-road tests using a Wizard-of-Oz AV in public environments with naïve pedestrians (see also [24]). Although these approaches arguably have the highest possible level of fidelity, as pedestrians are exposed to AVs in a naturalistic manner, they too are affected by several limitations. One disadvantage is that the state of the pedestrian and AV (e.g., speed, distance) are unknown, and data need to be obtained from annotations of video recordings or interviews after the encounter. Furthermore, results vary depending on traffic conditions. Cefkin et al. [23] pointed out that in one of their studies, pedestrian traffic was limited and, therefore, only a small number of AV-pedestrian encounters could be recorded.
Summarizing, previous research on the efficacy of eHMIs has various strengths and weaknesses. One weakness is that researchers had to rely on imagined rather than actual crossing behavior. In this respect, the works of Deb et al. [10], Feldstein et al. [25], Lee et al. [26], and Schmidt et al. [16] provide promising leads. In Deb et al. [10], participants walked with a head-mounted display while encountering different types of eHMIs (e.g., an upraised hand, a colored beacon, an image of a pedestrian). Based on analyses of video recordings of the participants’ walking behavior, Deb et al. [10] classified the participants’ behaviors as hesitation, confusion, and stopping. A similar approach was used by Lee et al. [26] and by Schmidt et al. [16]. In Lee et al. [26], participants wore an HMD, and the dependent variable was whether participants crossed before the AV started to decelerate, during deceleration of the AV, or when the AV had stopped. However, Deb et al. [10], Lee et al. [26] and Schmidt et al. [16] did not measure the pedestrians’ motion in a quantitative manner, for example, in terms of walking speed as a function of elapsed time.
We investigated whether results from survey-based and HMD-based methods replicate when using a more realistic experimental setup in which participants could cross the road. We used two eHMI concepts from De Clercq et al. [18] which corresponded to the extremities of ambiguity. That is, we selected a textual eHMI as research shows that text (i.e., “walk”/“don’t walk”) is generally regarded as clear and unambiguous (see, e.g., [6]). Furthermore, we selected front brake lights, a concept which is regarded as ambiguous because it may be unclear to the pedestrian whether he or she should apply an egocentric perspective (i.e., a green light on the AV means that the pedestrian can cross) or an exocentric perspective (i.e., a green light on the AV means that the vehicle will continue driving) (e.g., [9,13]).
We conducted the experiments in a virtual environment where the participants were immersed using an HMD and where a schematic representation of the participants’ body (i.e., an ‘avatar’) was present, generated via a motion suit. This type of simulation resembles the setup of Feldstein et al. [25,27] who developed a pedestrian simulator where participants could move around freely and motions were recorded through a marker-based system. Furthermore, in Feldstein et al. [25,27], a schematic representation of the body was present in the virtual environment. We sought to examine how the eHMIs affect participants’ crossing behavior as measured using the motion suit signals. We expected that the text-based eHMI would be regarded as more persuasive than the front-brake light eHMI, which, in turn, was expected to evoke higher pedestrian responsiveness than no eHMI at all. In addition to this replicative aim, we extracted information about body posture while crossing. Finally, we examined whether our setup, in which participants were able to step onto the road, would yield a higher level for self-reported realism compared to a similar setup in which participants remain static in the environment.

2. Methods

2.1. Participants

Twenty-four participants (six females, 18 males) with a mean age of 25.4 years (SD = 2.5, min = 21, max = 30) partook in the study. Participants were recruited among students, PhD candidates, and postdocs at the faculty of Mechanical, Maritime and Materials Engineering of the TU Delft. In response to the question how often the participant commuted to work or school by foot in the last 12 months, five respondents reported “never”, six reported “less than once a month”, four reported “once a month to once a week”, four reported “1 to 3 days a week”, one reported “4 to 6 days a week”, and four reported “daily”. Participants’ nationalities were as follows: 15 Dutch, two German, two Chinese, one British and Turkish, one American, one Spanish, one Indian, and one Ukrainian. No incentive was offered and people were allowed to participate regardless of the driving side in their country of origin. All participants were living in the Netherlands. The study was approved by the Human Research Ethics Committee of the TU Delft, and each participant provided written informed consent before the start of the experiment.

2.2. Experimental Design

Participants were immersed in a virtual environment, similar to the one used in De Clercq et al. [18], via a head-mounted display. The participant was standing on a curb in front of a zebra crossing at a two-way urban road, as shown in Figure 1. In each trial, a platoon containing five cars would come driving around a corner to the far left of the participant, pass the participant, and then turn left around a corner to the right of the participant. The third car in the platoon was the stimulus vehicle. Two types of vehicles were used, namely a Smart Fortwo (small vehicle) and a Ford F150 (large vehicle). The occurrence of these types was randomized. The design of the research was within-subject, consisting of three independent variables.
The first independent variable was the type of eHMI placed on the front of the stimulus vehicle, consisting of three levels: (1) No eHMI, (2) Front Brake Lights (FBL), and (3) Text eHMI, as depicted in Table 1. The eHMIs were the same as the experiment of De Clercq et al. [18]. In our experiment, the presence of eHMIs on all other cars (i.e., the non-stimulus cars) was randomized.
The distance between the front of the stimulus vehicle and the back of the second vehicle was the second independent variable, which was varied between 20, 30, and 40 meters. The distances between the other cars (i.e., first and second, third and fourth, fourth and fifth) were approximately 13 meters.
The yielding behavior of the cars was the third independent variable. The cars had a speed of 50 km/h while approaching the participant. In the yielding conditions, the stimulus car would start braking with a deceleration of 3.5 m/s2 at approximately 30 meters from the zebra crossing and halt 4 meters before the zebra crossing, as can be seen in Figure 2. If an eHMI was present on the stimulus vehicle, it would change state upon braking. The fourth and the fifth car would start yielding at 40 and 50 meters from the zebra crossing, respectively, and come to a stop a few meters from one another behind the third car. After standing still for 5 seconds, the cars would pick up speed again, drive past the participant, and turn left around the corner.
Each participant completed a total of 18 trials. Each trial consisted of a unique combination of the independent variables (3 eHMI conditions × 3 gap distances × 2 yielding conditions). The order in which the combinations were presented to the participants was randomized and unique for each participant. A video of trials where cars did and did not yield is available through the link in the Supplementary Materials. The experiment lasted about 20 minutes per participant.

2.3. Participant’s Task

Participants were instructed to cross the road once they felt it was safe enough to do so. They were informed that the first two cars in each of the platoons would never yield and were told not to cross in front of these two cars. Hence, the only crossing opportunity for participants was between the second car in the platoon and the stimulus vehicle or after all cars had passed. Participants were not instructed or trained about the meaning of the eHMIs. Due to space limitations of the physical environment, participants were instructed to walk to the third zebra stripe in the virtual environment. If standing on the third zebra stripe in the virtual environment, participants had one meter of unobstructed space as a safety margin around them in the physical environment.

2.4. Materials and Equipment

The experiment was run on a desktop computer with an Intel Core i7-6700 CPU (@3.4 GHz) processor, 16 GB RAM, MSI H110M Pro-D (MS-7996) motherboard, NVIDIA GeForce GTX 1070 4 GB graphics card, and a Windows 10 Pro 64-bit operating system. The participants’ motion was recorded using a wireless set-up of the Xsens Link Motion Tracking Device (Enschede, The Netherlands) in combination with version 0.3b of MVN Analyze [28]. The recorded accelerations, of head, thorax, pelvis, and extremities were integrated to estimate full-body motion. The motion data were transferred from the MVN software to an avatar in the virtual environment that was built using Unity version 5.5.0f3 64-bit. The scripts and avatar used in Unity were developed by Xsens and obtained via the Unity Asset Store. The wireless transmitting device of the Xsens sent its data via an Asus RT-AC68U router to the desktop. An Oculus Rift CV1 was used to visually and audibly immerse the participant in the virtual environment. A 1-meter extension of the HDMI and USB cables of the Oculus Rift was made using a DeLOCK 1.4 HDMI and a DeLOCK USB 3.0 extension cable.

2.5. Procedure

Participants provided written informed consent before the start of the experiment. After being briefed about the goal of the experiment, namely “to investigate whether crossing intentions of human pedestrians can be detected from body motion”, the participants completed a questionnaire containing demographic questions and statements about pedestrians and motorists from Papadimitriou et al. [29]. Following the questionnaire, participants were familiarized with the Oculus Rift and Xsens. After putting the Xsens onto the participant and when a successful calibration was obtained, participants put on the Oculus Rift and were allowed to familiarize themselves within the virtual environment for a few minutes.
After the familiarization, the experiment was initiated. After each trial, participants verbally indicated their discomfort using the single-item misery scale (MISC). They also indicated their feeling of fear and their ability to predict the behavior of the oncoming cars on a scale from 1 (i.e., strongly disagree) to 10 (i.e., strongly agree). If participants indicated a MISC rating of 4 or higher, the experiment would be paused or aborted. Once all trials were completed, a final questionnaire was administered to measure the fidelity of the experimental environment through the use of the Virtual Reality Presence Questionnaire (VRPQ) of Witmer et al. [30].

2.6. Dependent Variables

A total of six objective and subjective measures were analyzed. The first objective dependent variable was the participants’ forward (i.e., towards the zebra crossing) gait velocity as a function of elapsed time. The forward gait velocity was extracted from the pelvic sensor of the Xsens. Studies on affective body language show that stimuli of negative valence reduce gait velocity compared to when participants were confronted with stimuli of positive valence [31,32]. We used gait velocity as an index of safety perception, where we assumed that situations that were perceived by participants as ambiguous or unsafe would result in lower average gait velocity compared to situations that were perceived as unambiguous or safe.
Furthermore, using the position data from the same pelvic sensor, we computed the second dependent variable, namely the time at which the participants left the curb (Moment of Leaving Curb; MLC). In line with the above, we expected participants to leave the curb earlier when they perceived a situation that was unambiguous/safe compared to situations that were perceived to be ambiguous/unsafe.
We derived the participants’ thorax angles from the T8 sensor of the Xsens as the third dependent variable. The thorax angle is expressed relative to the axis towards the zebra crossing. We expected participants to rotate their upper body earlier (i.e., to initiate forward motion) when confronted with a situation that was safer.
After each trial, the experimenter inquired the participant’s wellbeing through a Misery Scale (MISC) rating. Participants reported their MISC ratings by naming an integer value between 1 and 12. The value 1 reflected that participants experienced no problems, 2 slight discomfort, 3 and 4 slight and mild nausea, and 5 and higher indicated more severe symptoms of sickness.
Furthermore, participants responded to the inquiry about whether they experienced a feeling of fear when considering crossing the road by stating an integer value between 1 and 10. The value 1 represented “strongly disagree” and 10 “strongly agree”.
Lastly, participants responded to the inquiry whether it was difficult to predict the behavior of the oncoming vehicles by reporting an integer between 1 and 10. The value 1 represented “strongly disagree” and 10 “strongly agree”.

2.7. Data Reduction

The motion data of the participants were recorded both in MVN Analyze and Unity. The MVN motion data were recorded at a frequency of 240 Hz, while the Unity recordings varied based on the rendering speed during the trial, and was, on average, above 40 Hz for each participant. The MVN data were filtered before they were exported to .mvnx format using the HD processor of MVN Analyze. In order to synchronize the position of the participants in the virtual environment recorded in Unity to their position recorded using MVN Analyze, the Unity motion data were interpolated to a frequency of 240 Hz. Next, the two datasets were cross-correlated to compensate for any time delay. After the cross-correlation, the MVN data were low-pass filtered with a zero-phase 10th order Butterworth filter using a cut-off frequency of 8 Hz. According to Schreven et al. [33], the optimal cut-off frequency for filtering human motion data is about 8 Hz. By means of the two filters (i.e., the one during exporting and the one in Matlab), we ensured that the signal was not contaminated with high-frequency sensor noise, while still capturing rapid limb motions of the participant.
We tested the effect of the presence of eHMIs on the participants’ forward gait velocity, MLC, and their thorax angle. We performed paired-sample t-tests to compare the forward gait velocities between the eHMIs conditions at every time sample, as well as the thorax angles at every time sample. This approach has been inspired by Manhattan plots in molecular genetics research [34]. In a Manhattan plot, the x-axis shows the location on a chromosome and the y-axis depicts the common logarithm of the p-value. For the statistical tests depicted in the Manhattan plot, we used a significance level of 0.005 [35].
Despite the stringent alpha value used in the Manhattan plots, the results from t-tests per time sample should be interpreted with some caution due to a risk of false positives. Therefore, we also performed paired t-tests for a single key performance indicator: the moment participants’ left the curb (MLC). Here, we applied a Bonferonni corrected significance level of 0.05/3 = 0.017.
Additionally, we tested the effect of the eHMIs on the subjective responses of the participants per condition through paired-sample t-tests and investigated whether learning behavior occurred through linear tests of within-subject contrast. Lastly, we compared the subjective responses of our participants to the VRPQ to the responses of the participants in De Clercq et al. [18] through two-sample t-tests to investigate potential differences in subjective presence between their experimental methodology and ours.
Because the results of t-tests may be affected by outliers, we repeated the analysis using non-parametric signed-rank tests. The results for these tests, which did not alter our conclusions compared to the t-tests, can be found in the Supplementary Materials.

3. Results

3.1. Data Quality Assessment

The condition “40 meters, yielding, No eHMI” was presented to each participant as the condition “30 meters, yielding No eHMI” due to an error in our script. Subsequently, no comparison could be made for conditions “40 meters, yielding, Text eHMI” and “40 meters, yielding, FBL”. The data of condition “40 meters, yielding, No eHMI” were, therefore, removed from the analysis. Furthermore, in 23 of the total of 216 trials in which the cars did not yield it was not possible to correlate the data recorded in MVN Analyze to the data recorded in Unity because the participants hardly moved during those trials.
Per yielding condition, and for each inter-vehicle distance and eHMI type, we examined whether participants left the curb too early (i.e., before the second car had passed). All participants left the curb during yielding conditions. However, if participants left the curb too early for a particular combination of inter-vehicle distance and eHMI type, their data were excluded for every eHMI of that yielding condition and inter-vehicle distance. For example, when participants crossed too early during the “20 meters, yielding, No eHMI condition”, their data for “20 meters, yielding, Text” and “20 meters, yielding, and FBL” were also excluded.

3.2. Forward Gait Velocities

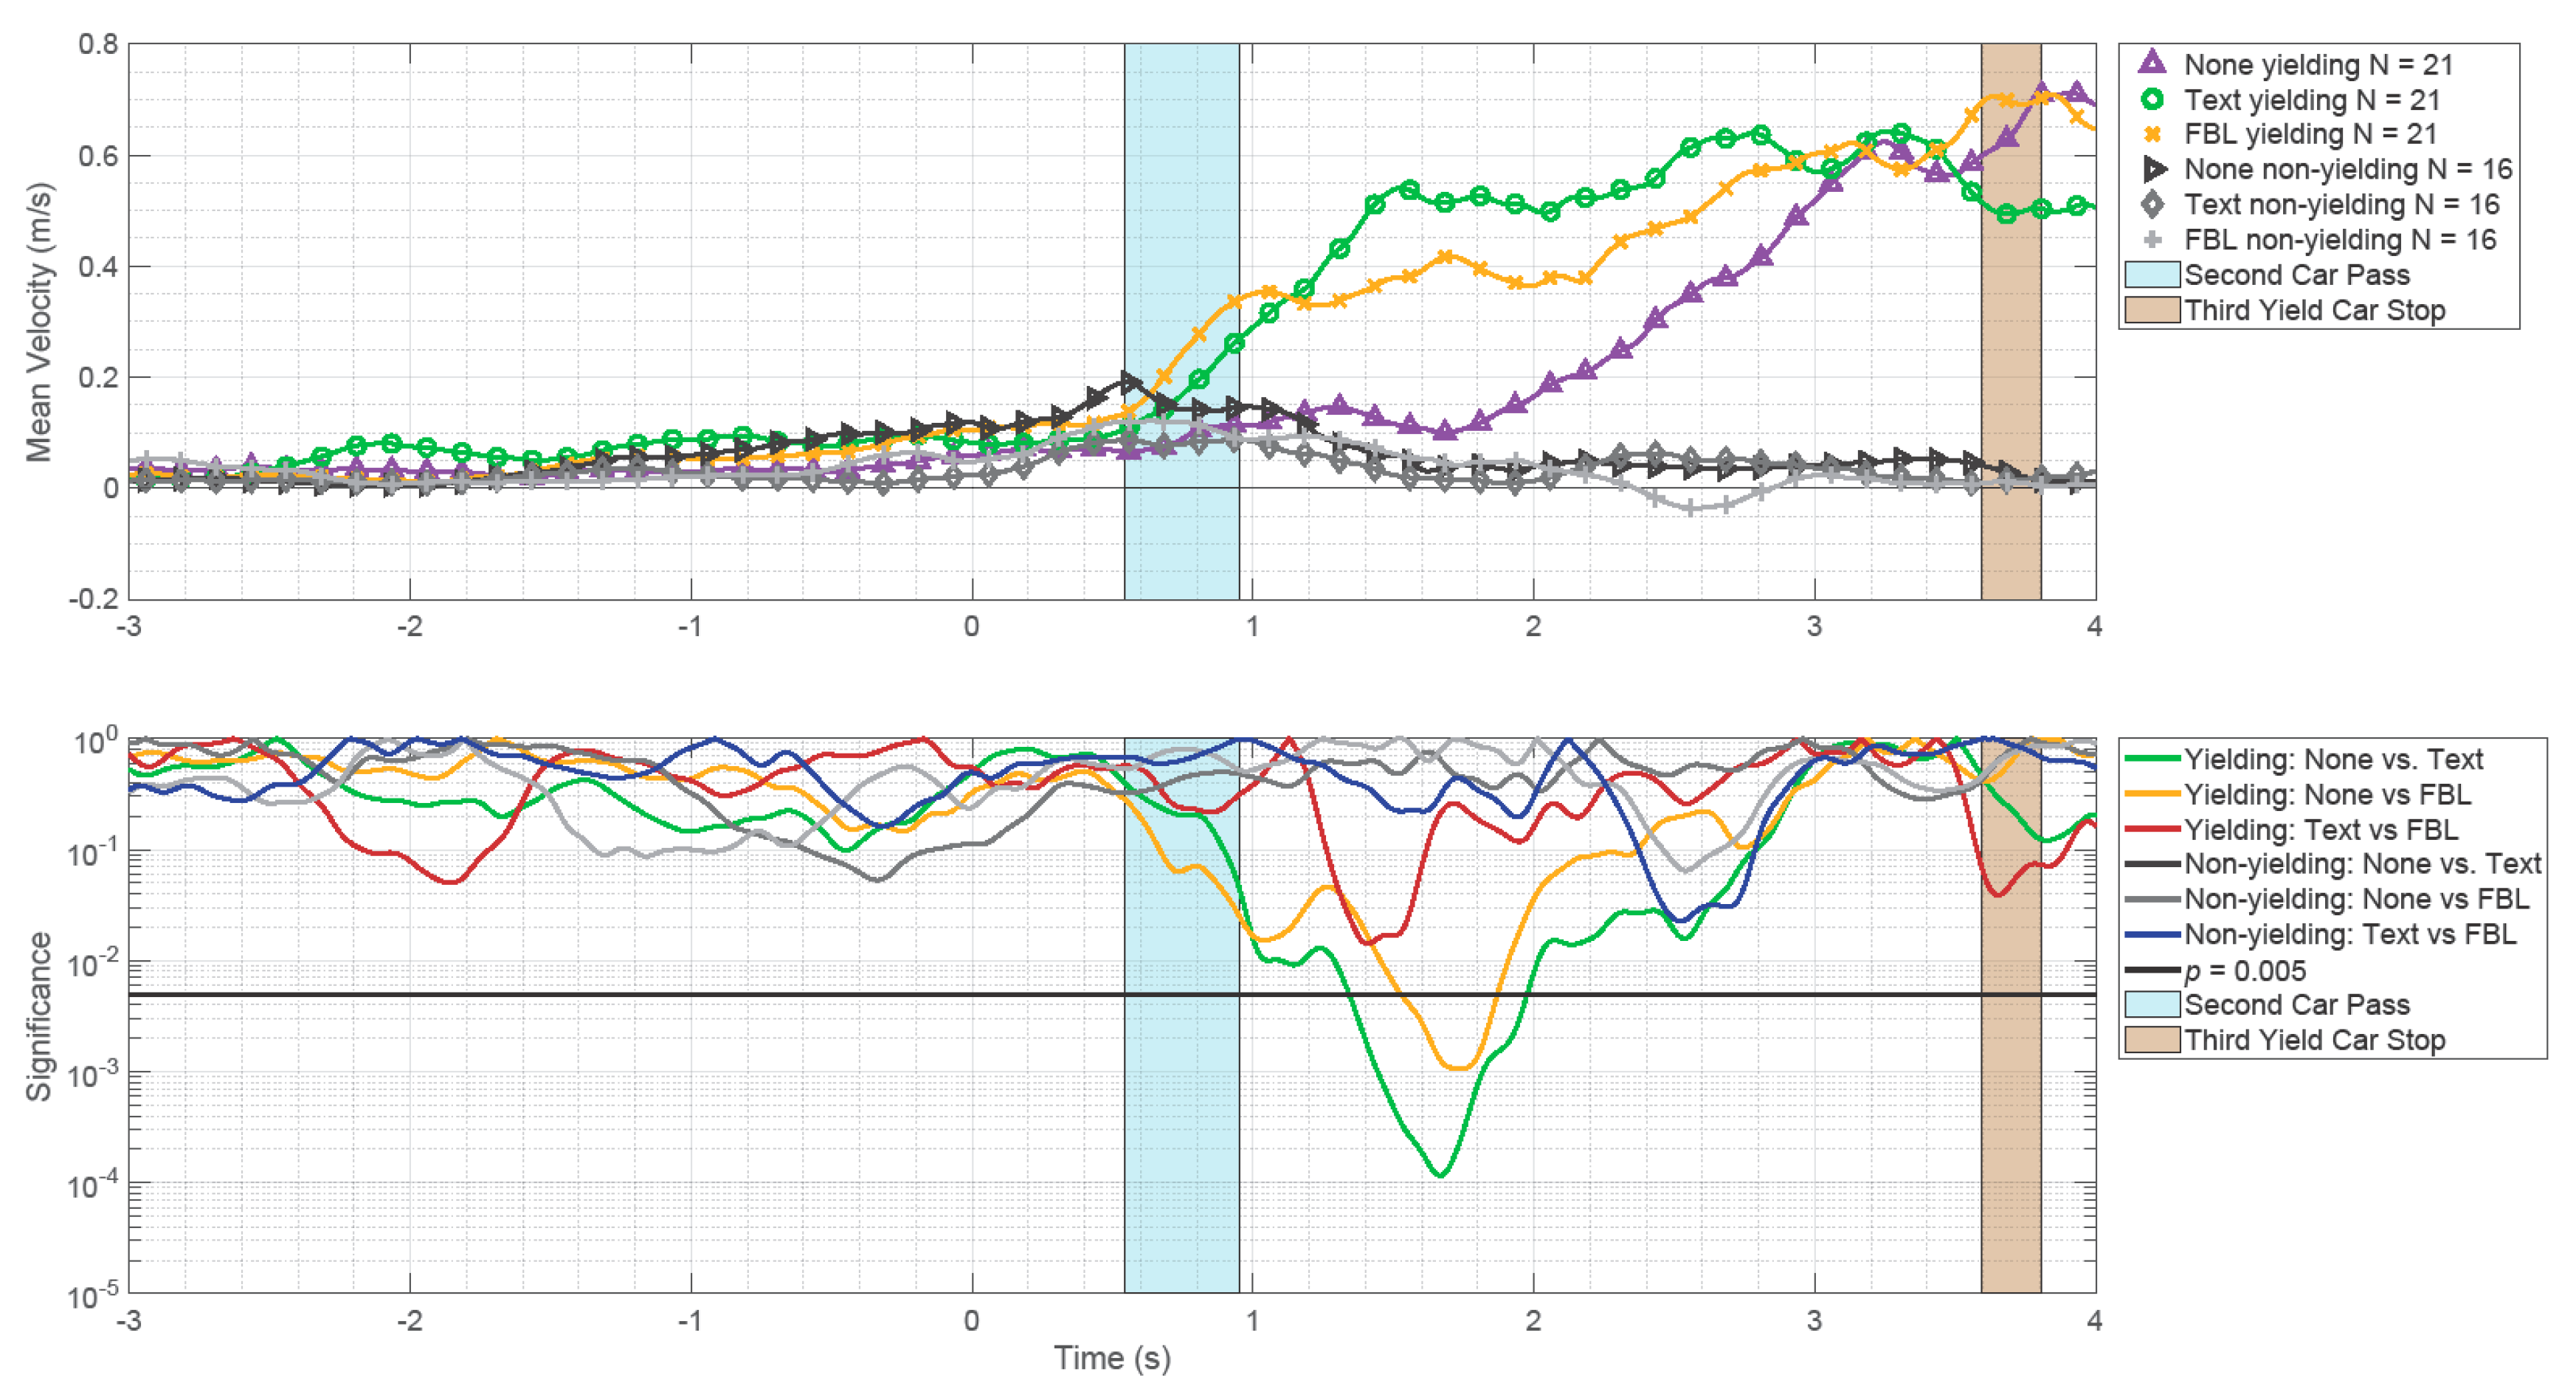
3.2.1. Twenty Meters Condition

Figure 3 shows the mean forward gait velocities of participants during the conditions “20 meters, yielding” and “20 meters, nonyielding”. It can be seen that participants initiated forward motion already before the second car had passed and the third car started braking. If the car yielded, the presence of an eHMI on the third vehicle stimulated pedestrians to start already crossing as soon as the second car was passing, whereas in the condition where no eHMI was present they waited longer. A significant difference was observed for a duration of 1.03 seconds between the Text eHMI and No eHMI. Furthermore, a significant difference was found for 0.45 seconds, and between FBL and No eHMI. For the nonyielding trials, no significant differences were found between the eHMI conditions.
In case the cars did not yield, participants’ forward velocities increased, similar to the yielding condition before the second car had passed in front of them. However, once the second car passed, the average forward velocities decreased to about zero, that is, participants halted their forward motion.

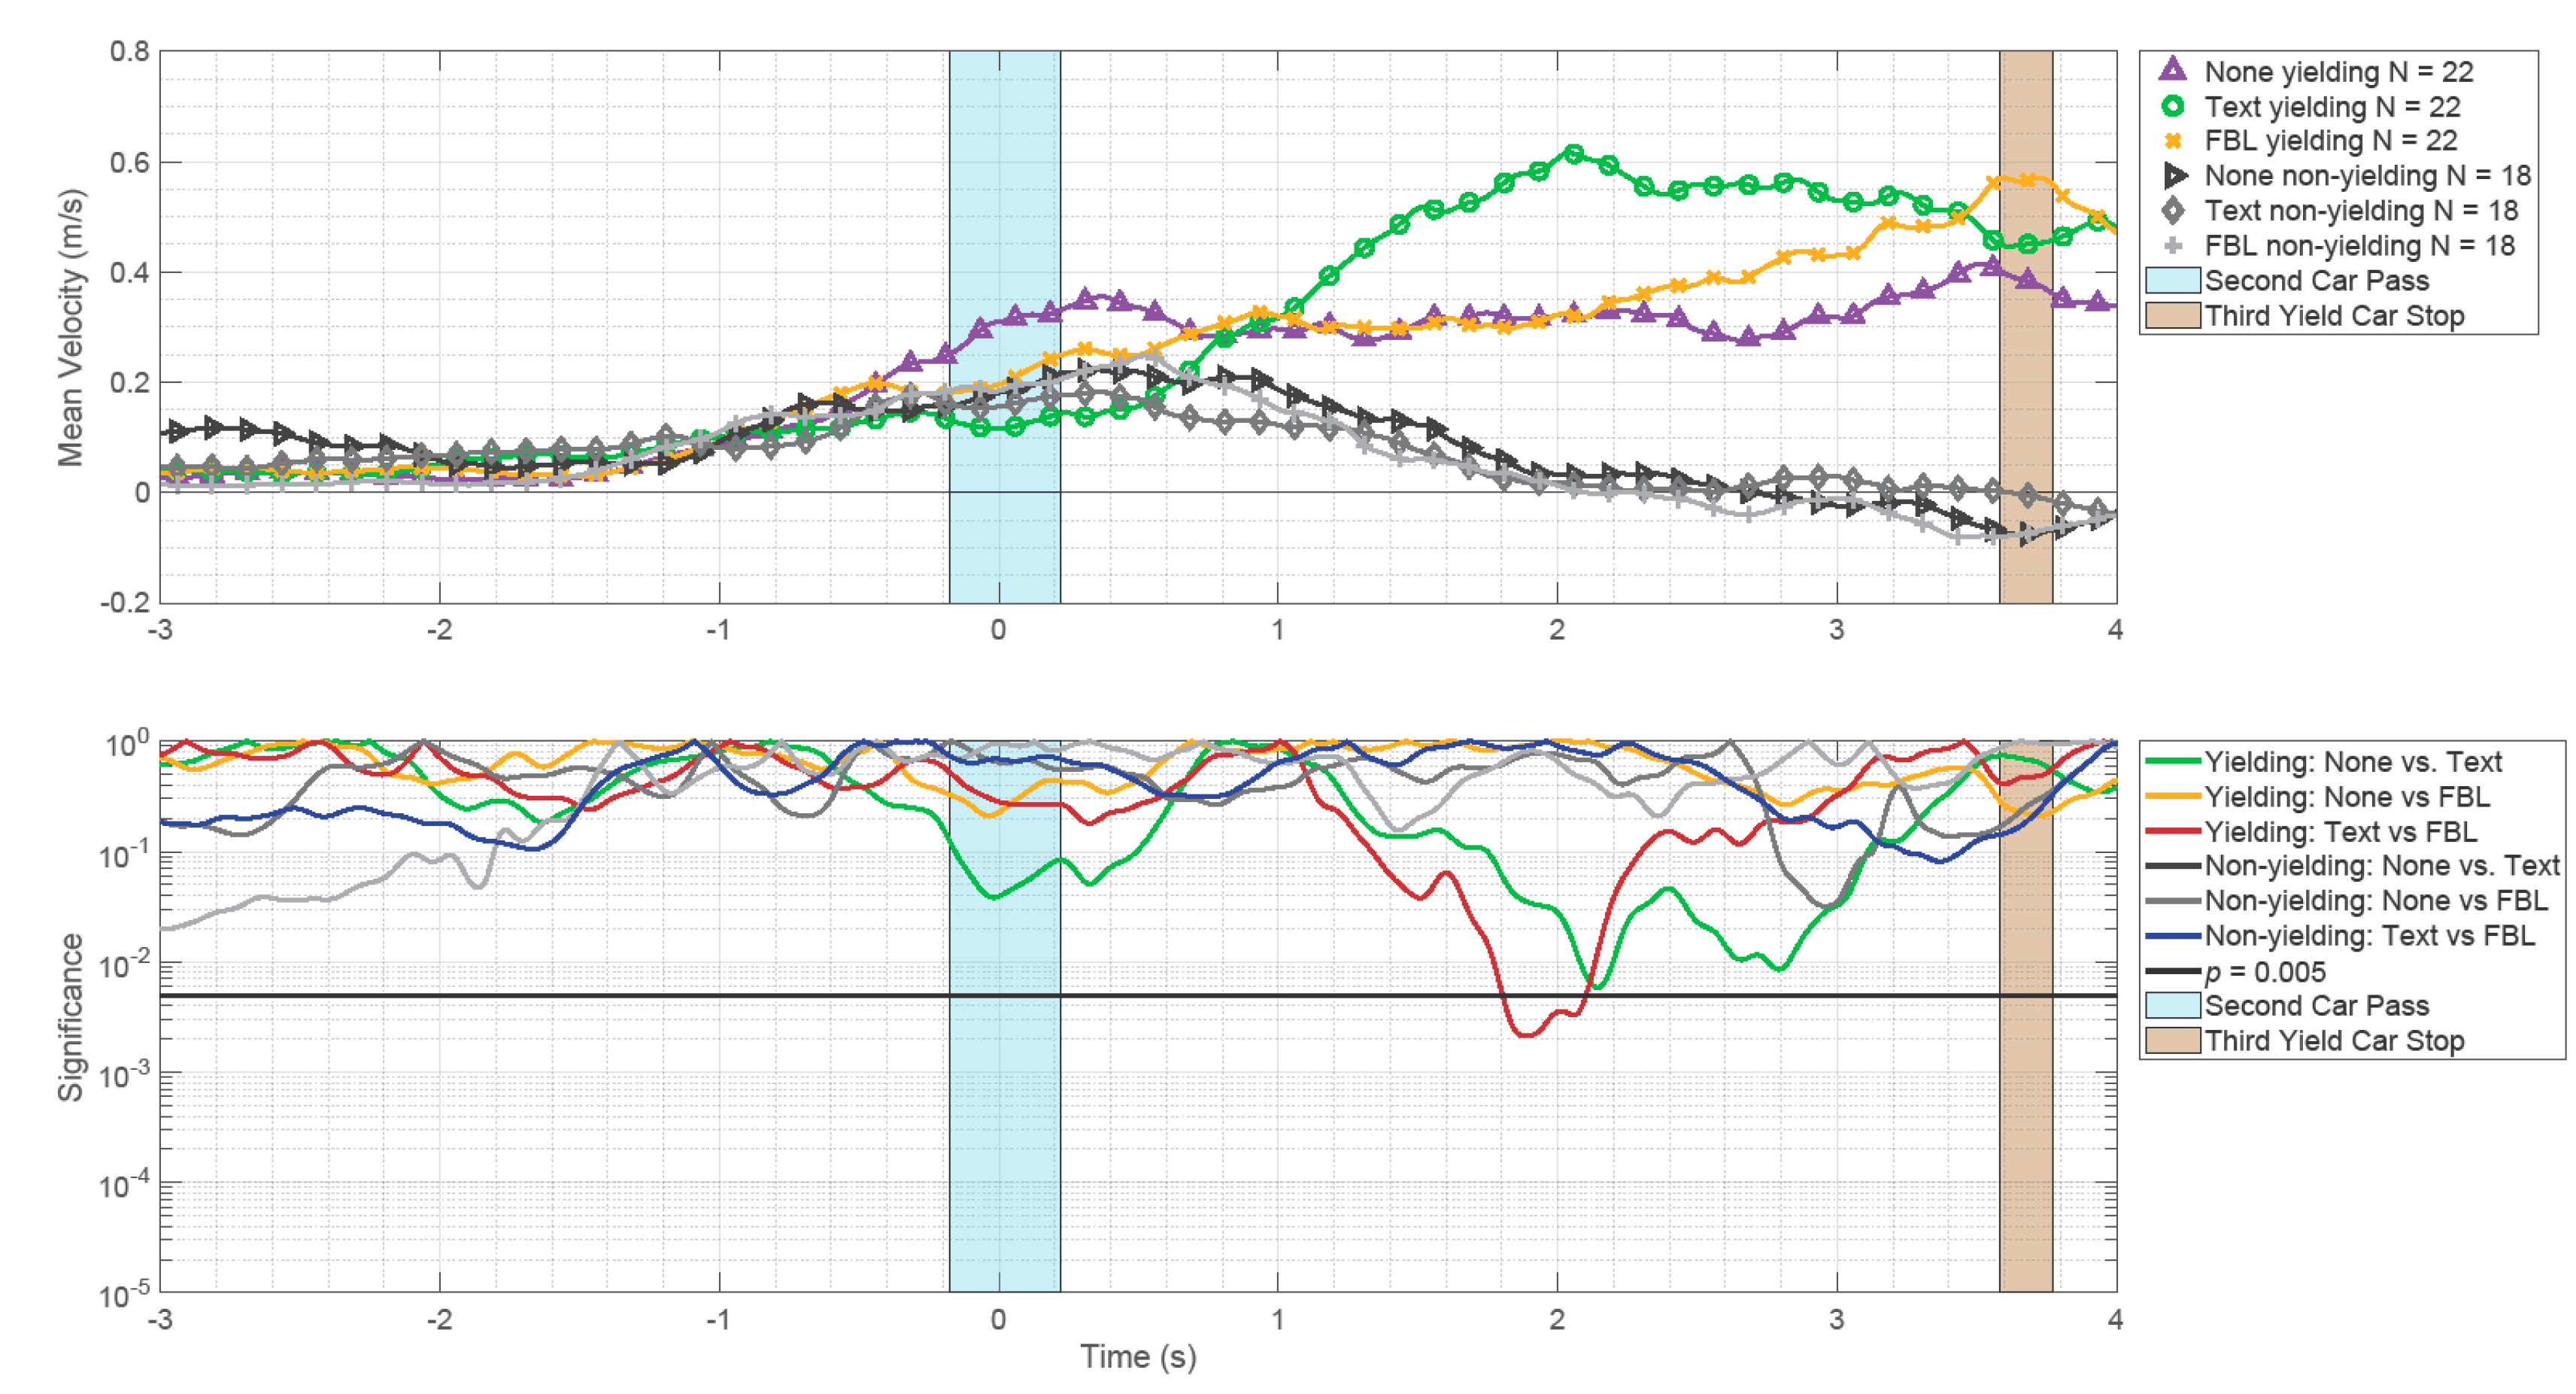
3.2.2. Thirty Meters Condition

Similar to the 20 meters condition, also in the 30-meters condition participants started walking before the second car had passed and the third car started braking, as shown in Figure 4. However, once the second car had passed and the third car advanced further, participants’ mean forward velocity in the No eHMI and FBL yielding conditions did not increase further, whereas in the Text yielding condition their forward speed did increase.
For the nonyielding conditions, participants’ velocity decreased once the second car had passed, which reflects their inability to cross. For the yielding condition, significant differences were observed between the Text eHMI and FBL. For the nonyielding conditions, no significant differences were observed in forward velocity.
A depiction of separate forward velocity curves for each participant for both the 20 meters and 30 meters yielding conditions can be found in Figures S5 and S6.

3.3. Moment Leaving Curb (MLC)
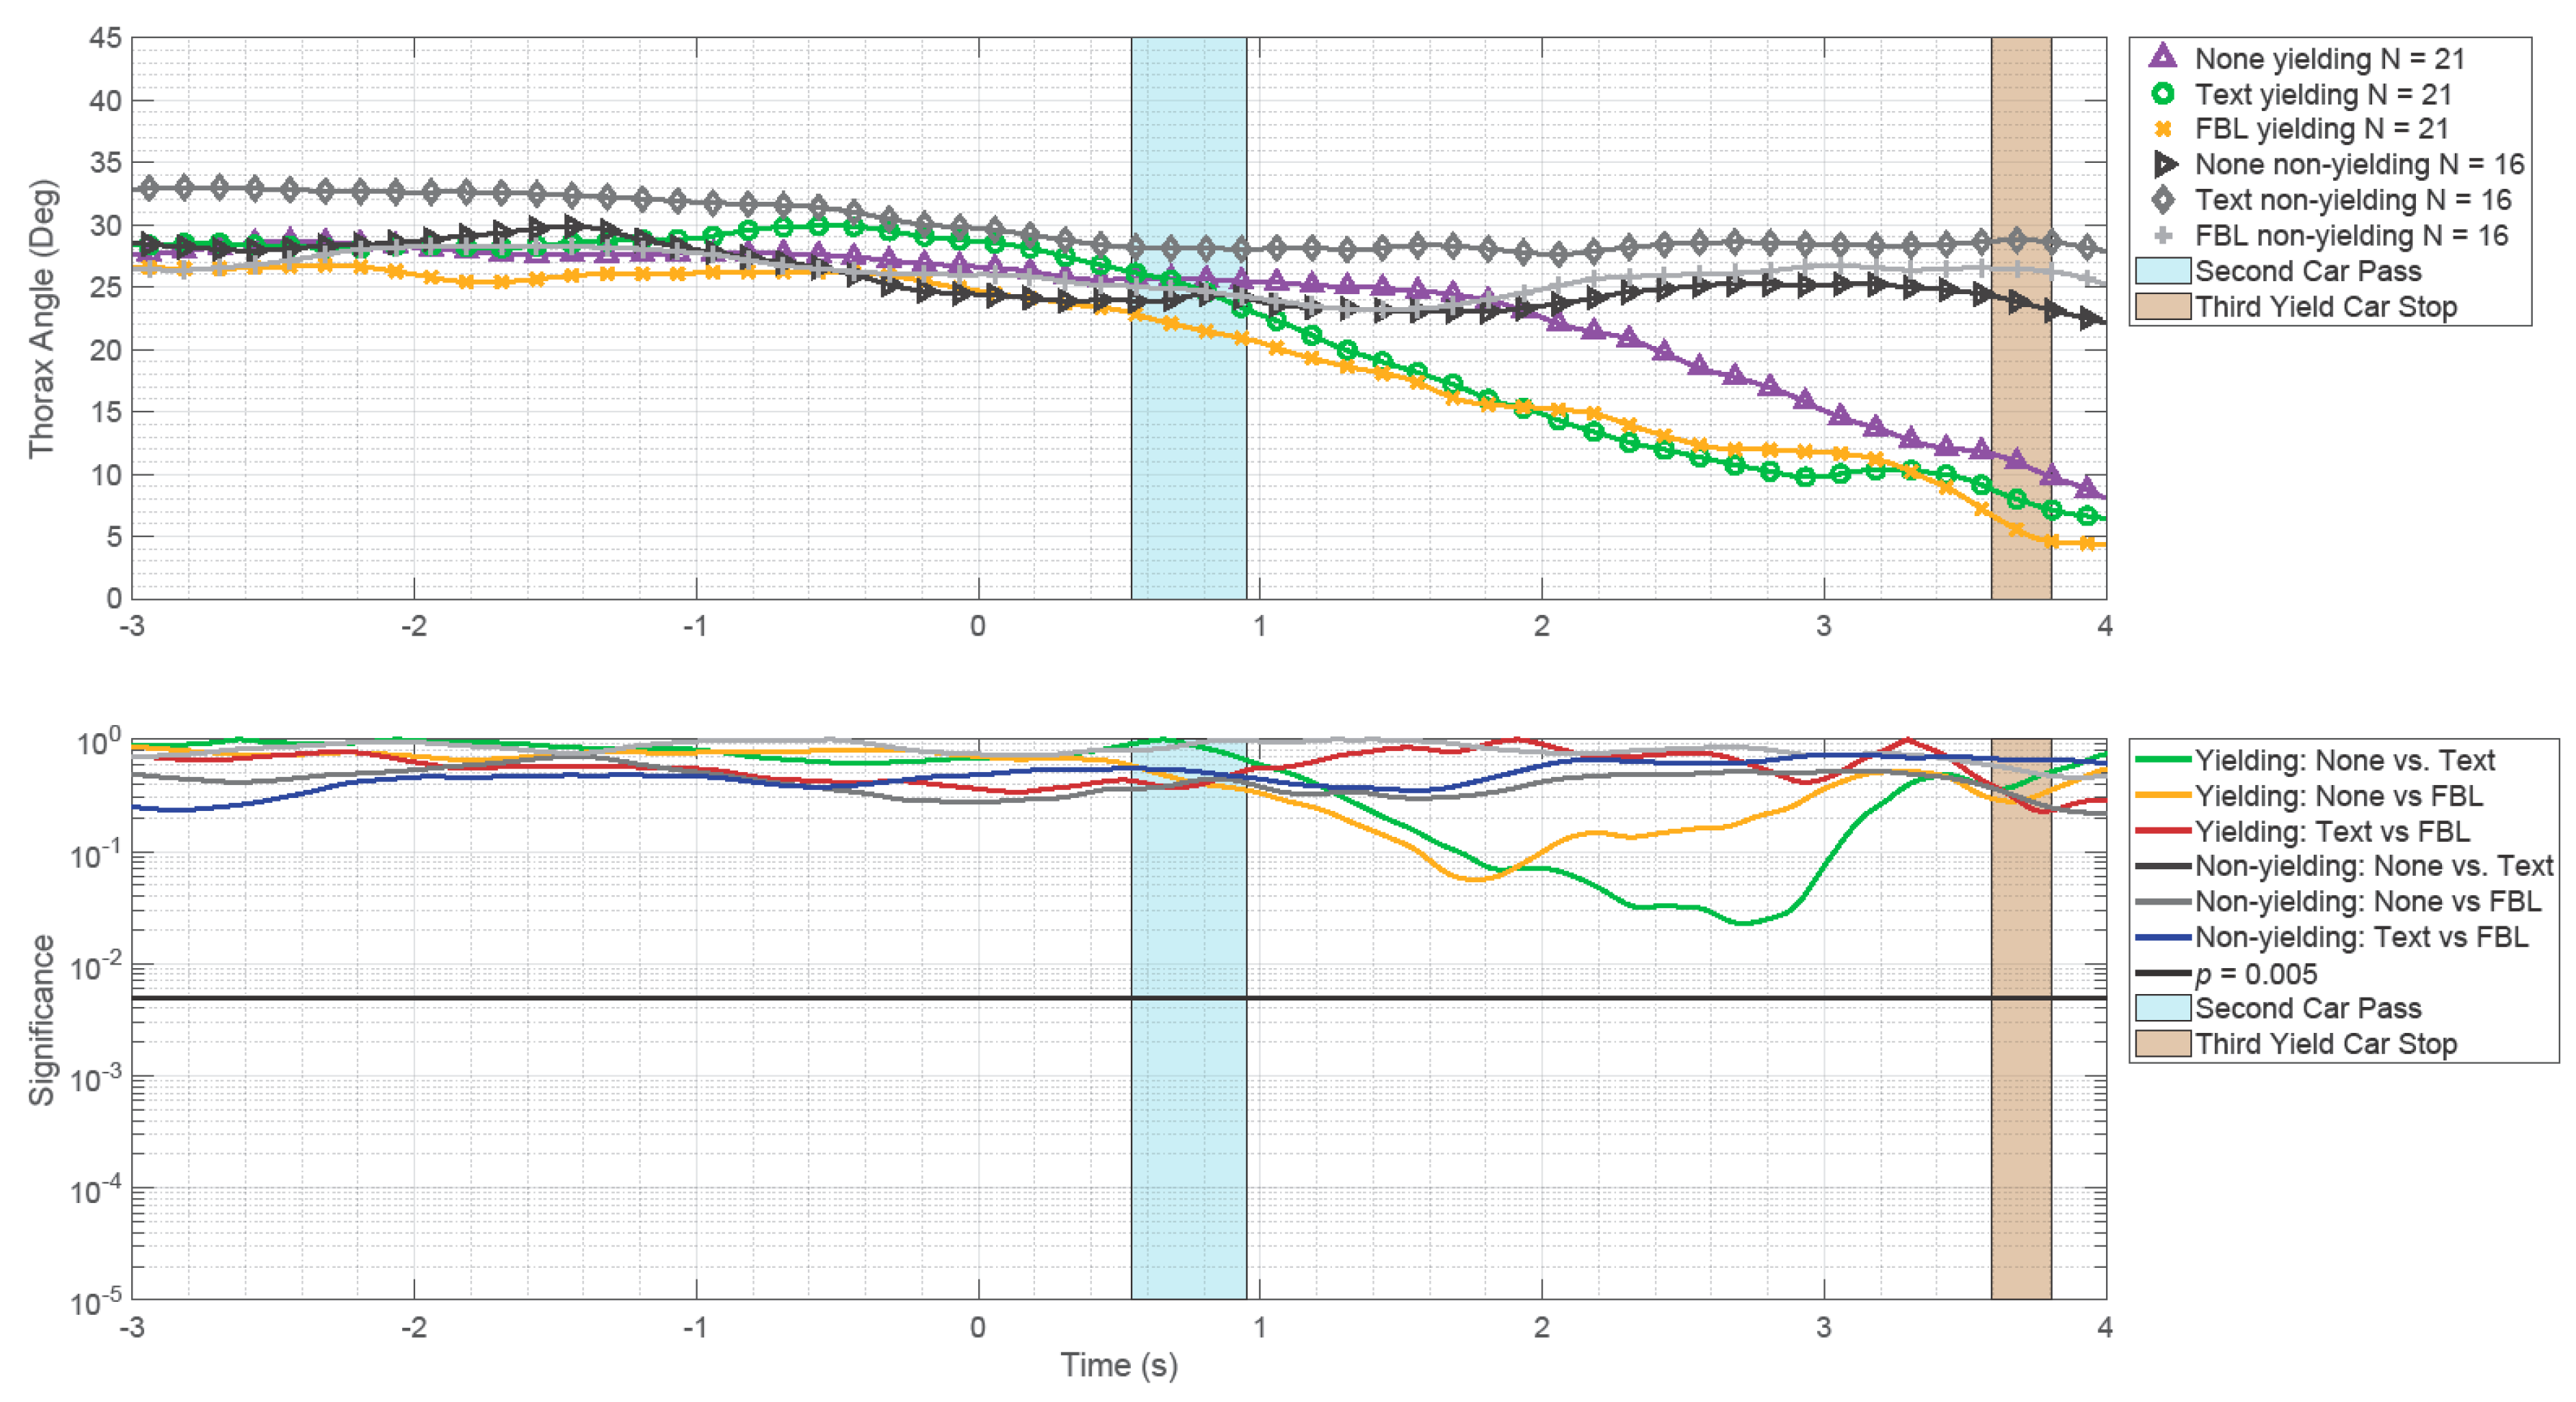
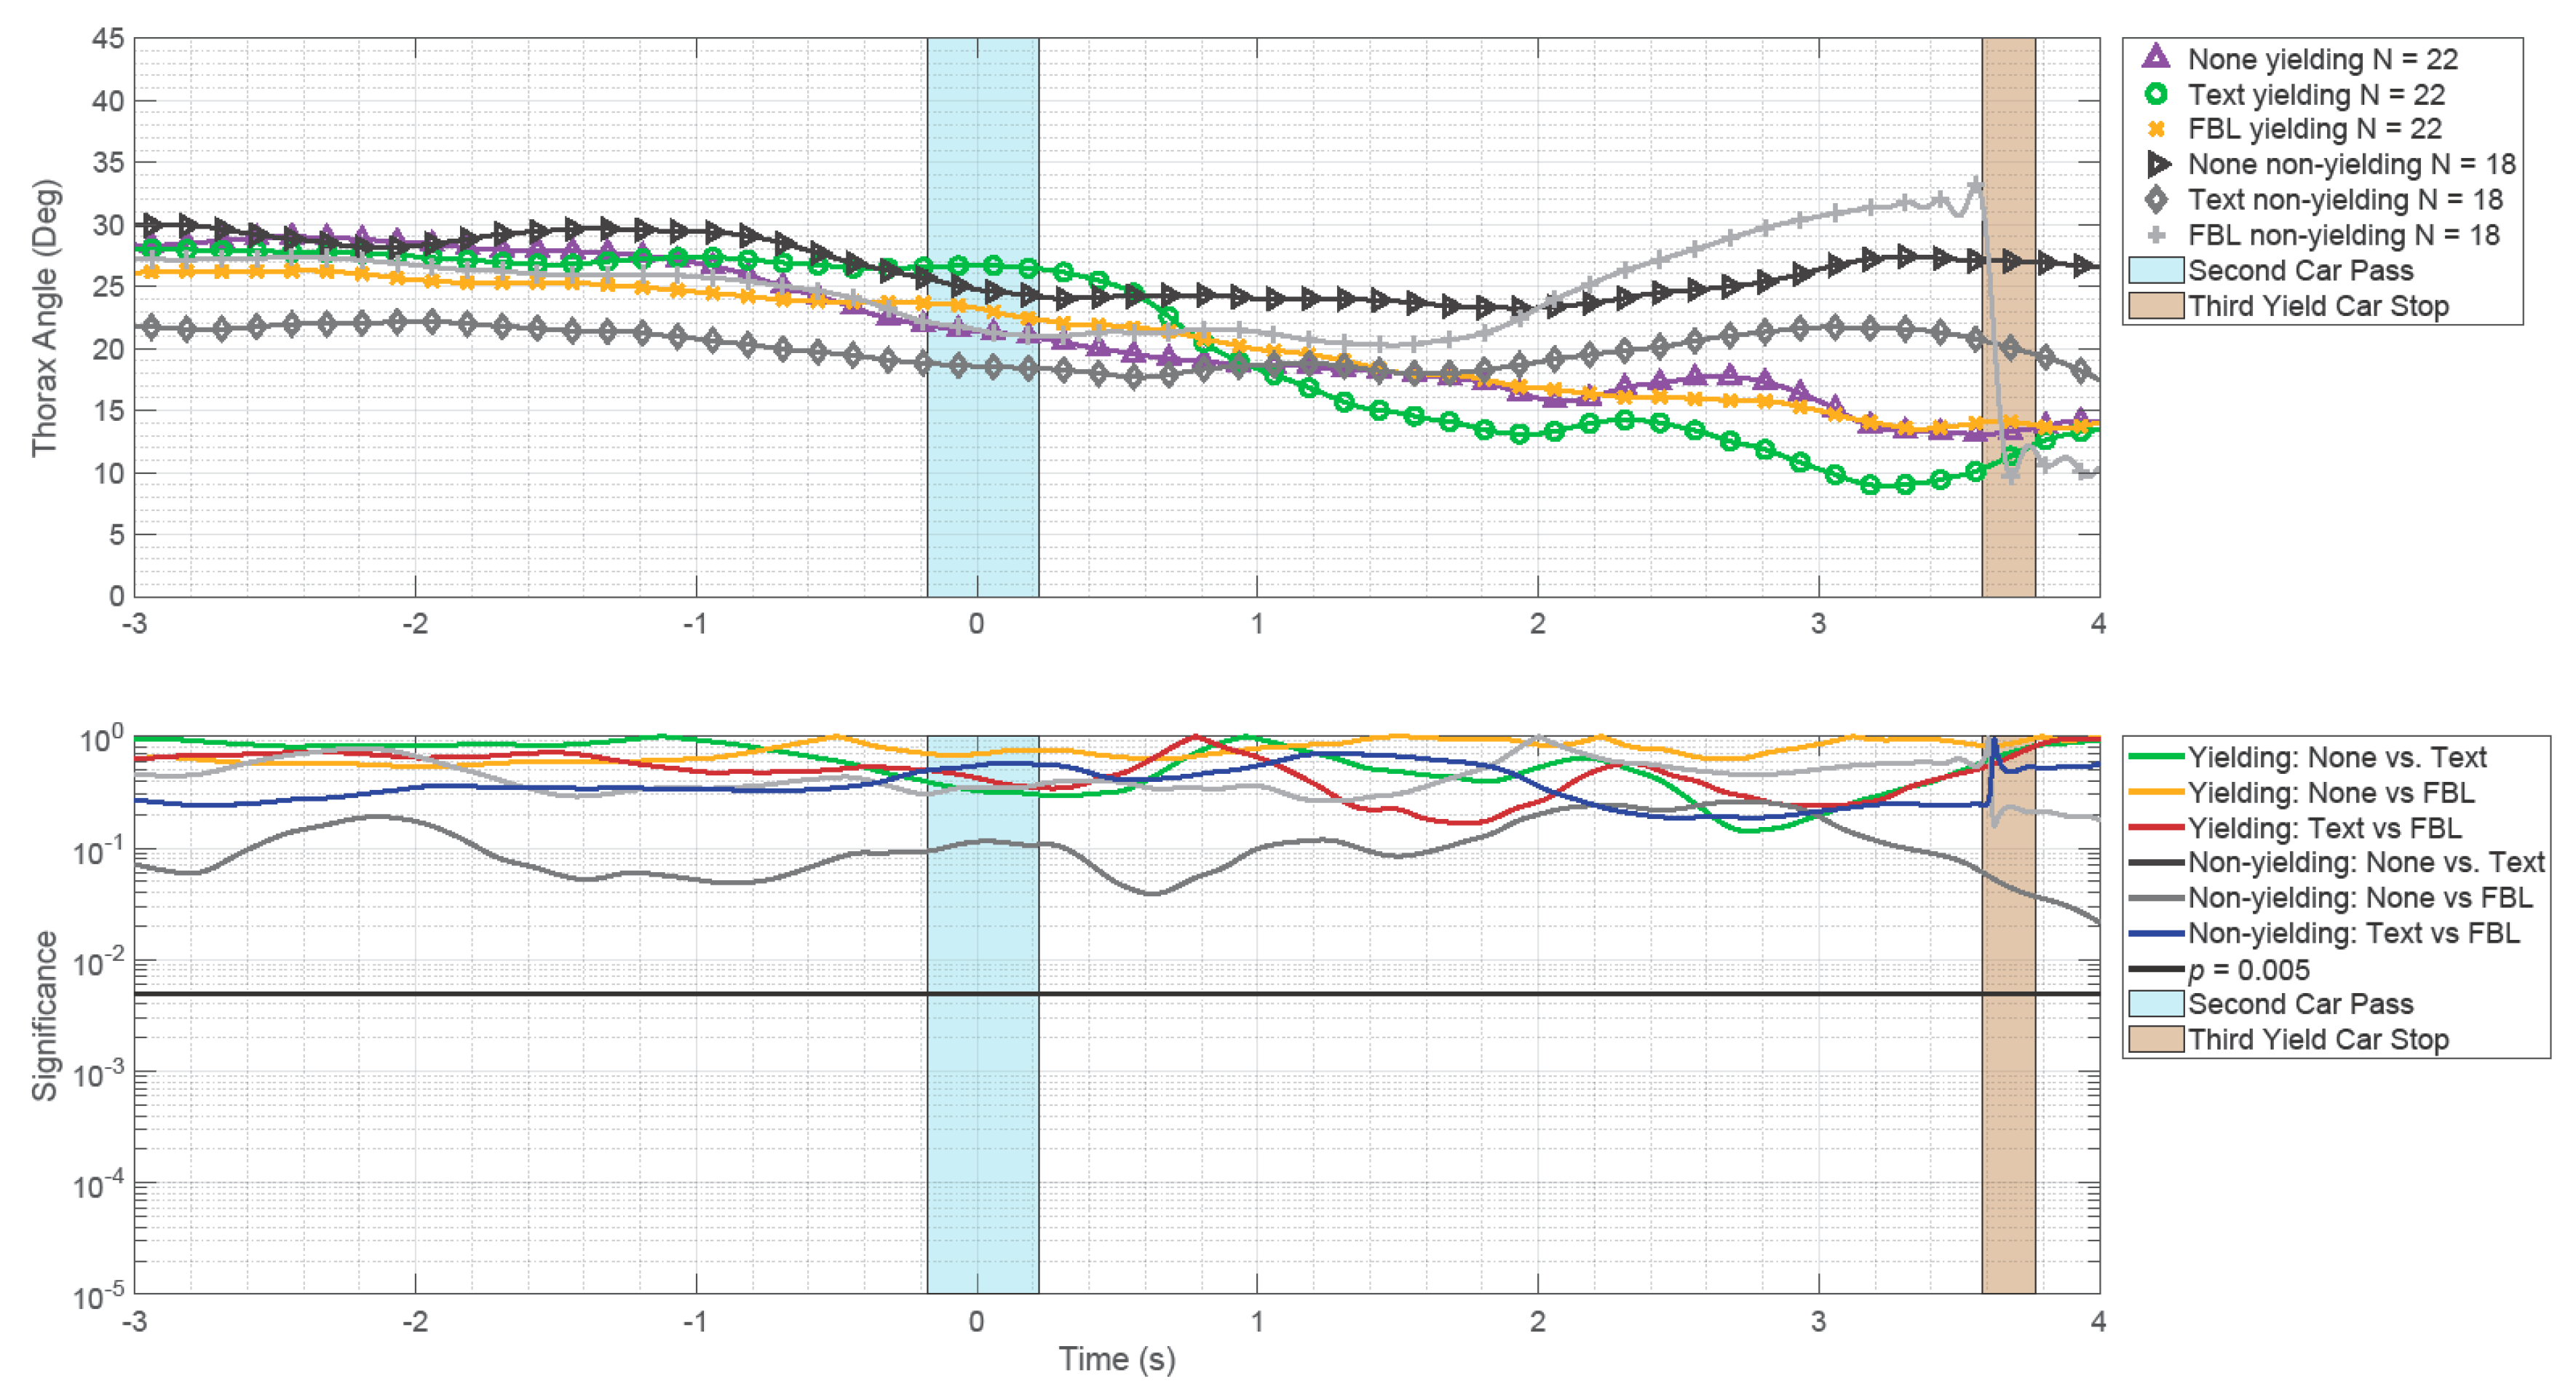
In the condition “20 meters, yielding”, significant differences in MLC were observed between No eHMI and when either a Text eHMI or FBL was present. For the condition “30 meters, yielding”, no significant differences were found between the three eHMI conditions, as can be seen in Table 2.

3.4. Thorax Angle

The mean thorax angles relative to the x-axis (i.e., the crossing direction of the zebra) are depicted in Figure 5 (“20 meters, yielding” and “20 meters, nonyielding” conditions) and Figure 6 (“30 meters, yielding” and “30 meters, nonyielding” conditions). Initially, participants, on average, had their thorax rotated towards the approaching cars on the left. Participants started to rotate their upper body toward the zebra crossing before the second car had passed when an eHMI was present on the third car. In the nonyielding conditions, participants also slightly rotated their upper body before the second car had passed, but refrained from further rotation. No significant differences between the eHMI conditions were observed.

3.5. Self-Reported Predictability of Car Behavior

Participants often stated that they experienced no fear at all, either because they did not cross in the nonyielding conditions or because the car stopped in the yielding conditions. Accordingly, no meaningful comparisons between the eHMI conditions could be made for the fear responses.
Table 3 shows the means and standard deviations of the participants’ difficulty to predict the behavior of the oncoming cars. Participants found it more difficult to predict the car behavior for the no eHMI condition compared to when a Text eHMI was present. Significant differences between Text and No eHMI were observed for the 20 and 30 meters yielding conditions and the 30 meters nonyielding condition. Significant differences between FBL and Text were found for the nonyielding conditions only.

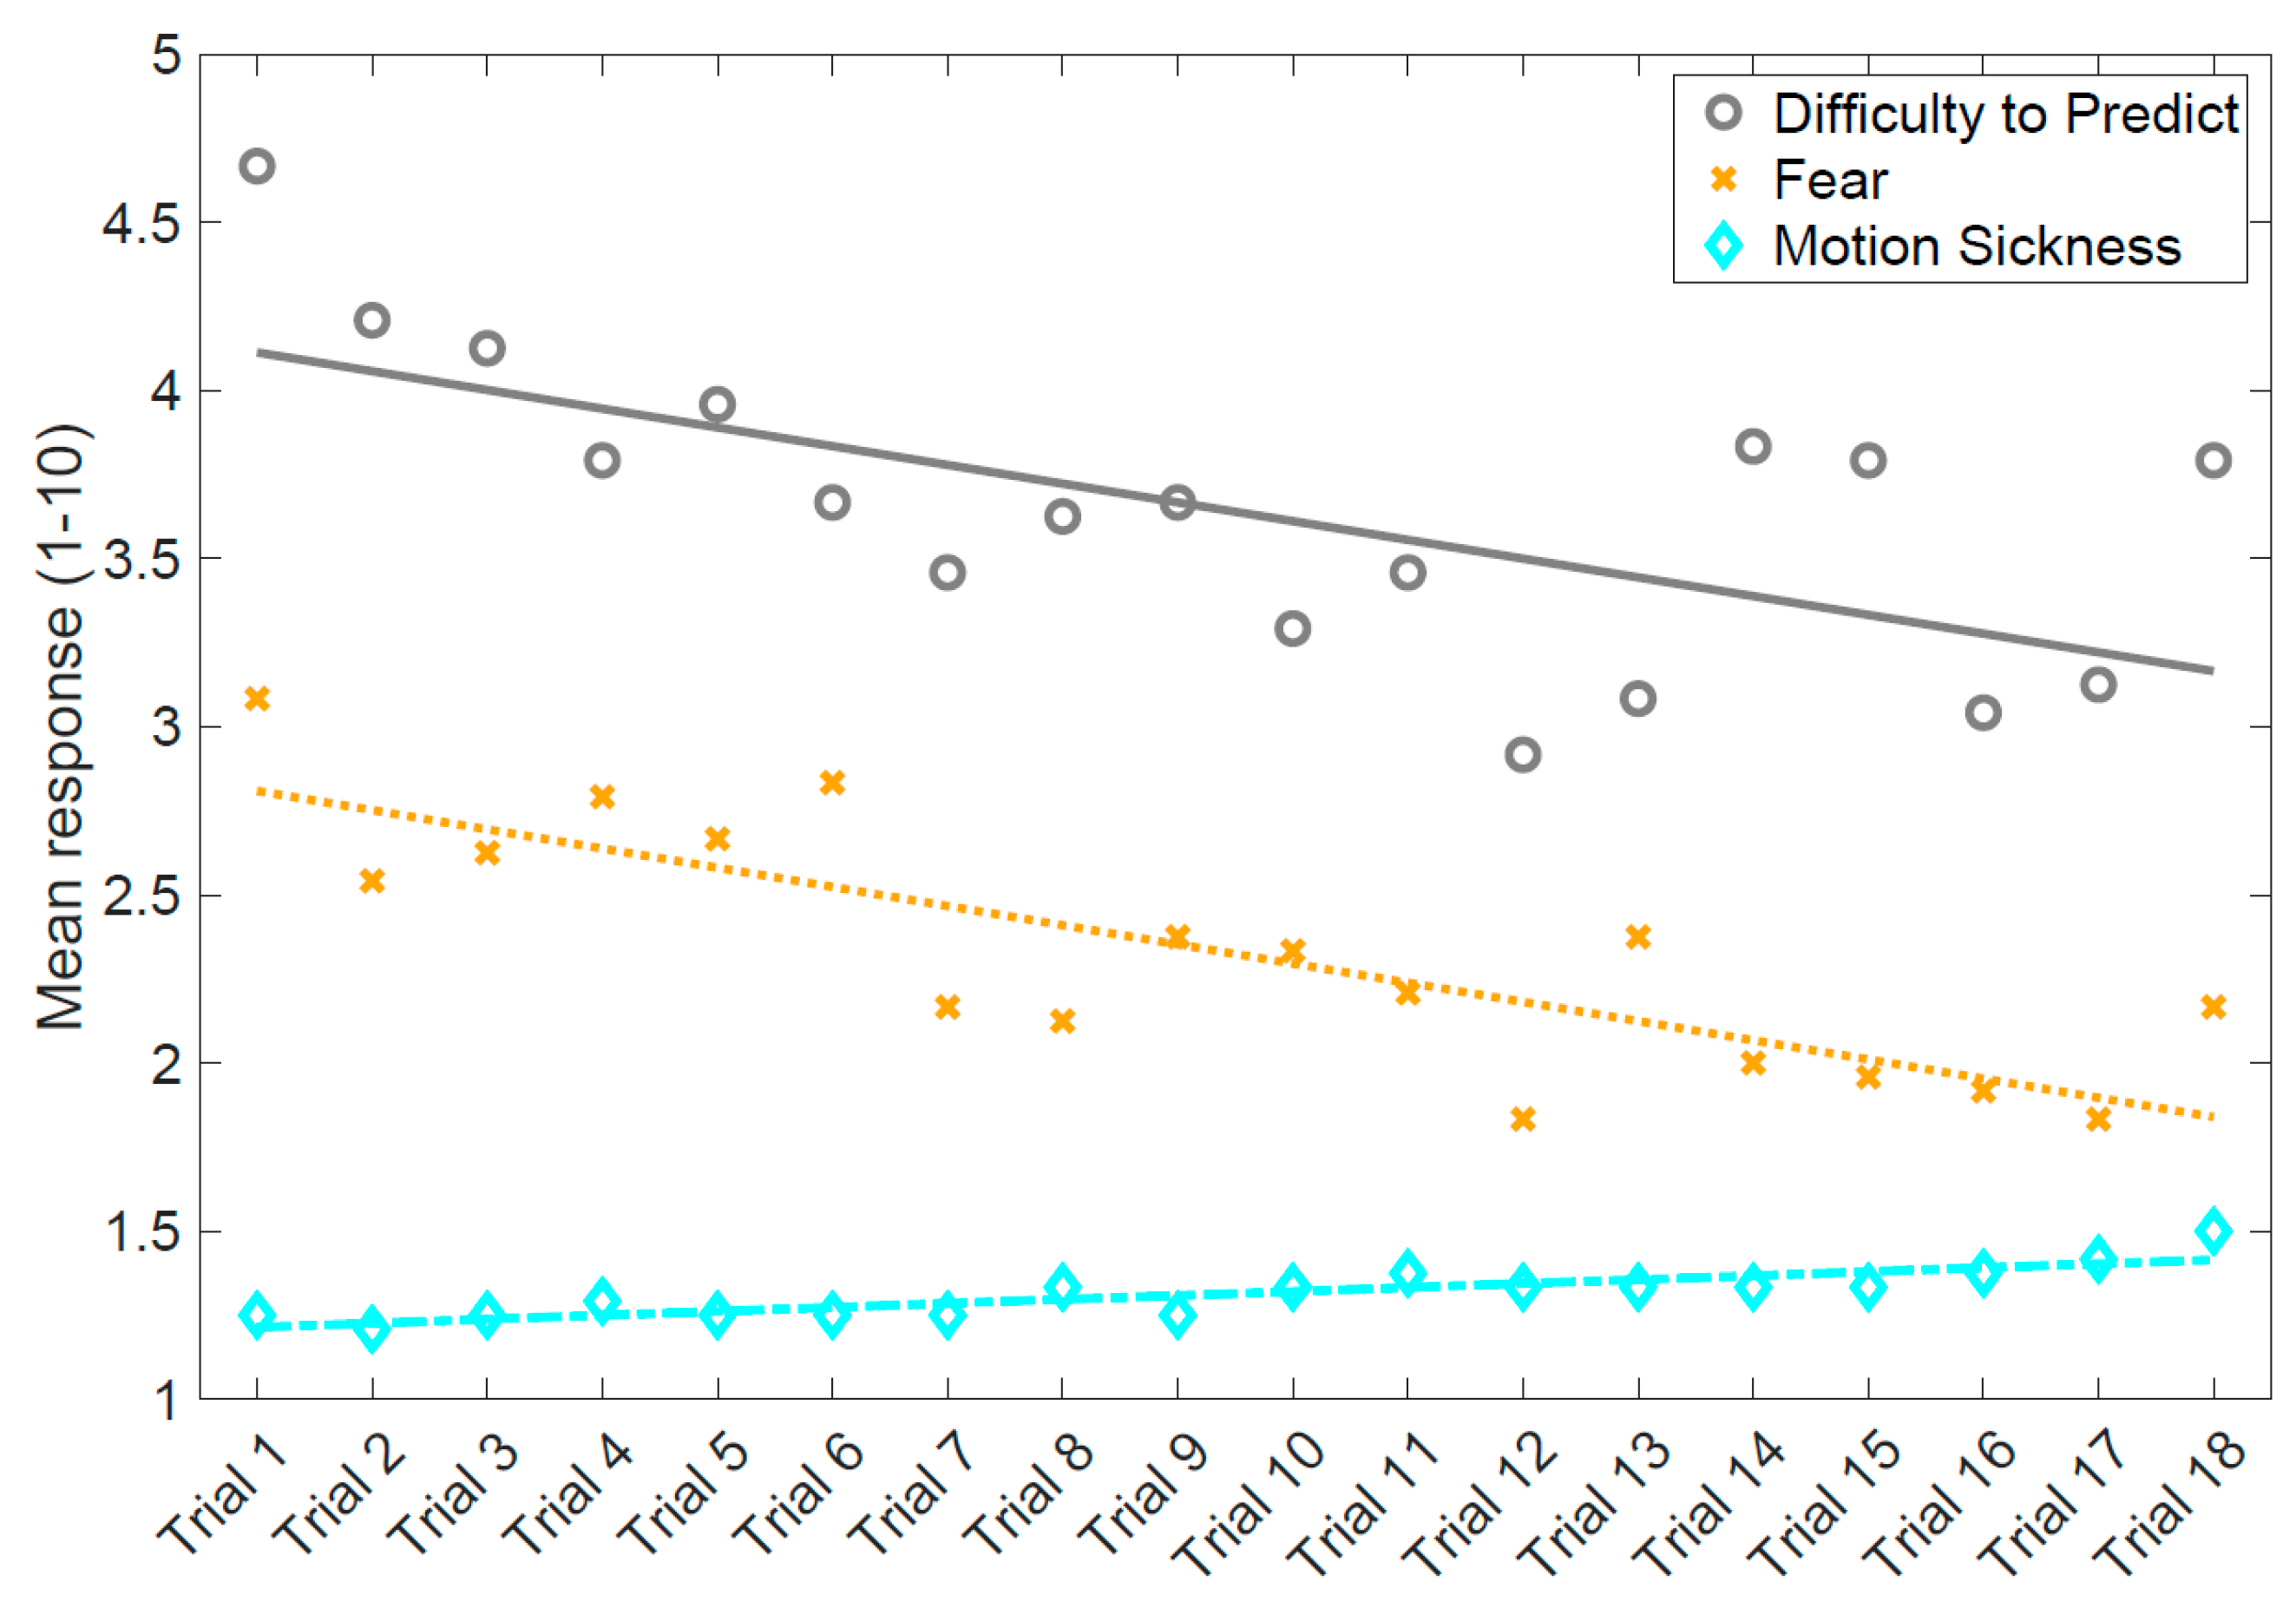
3.6. Reported User Experience

Figure 7 shows the participants’ mean responses to the three statements over the course of the experiment. A downwards trend is visible for the participants’ difficulty to predict the behavior of oncoming cars as well as their feeling of fear when considering crossing the road. A slight upward trend is visible for participants’ self-reported MISC rating. A linear test of within-subject contrasts showed the following: participants’ difficulty to predict the behavior of the oncoming vehicle: F(1,23) = 3.79, p = 0.064, feeling of fear: F(1,23) = 7.34, p = 0.012 and motion sickness: F(1,23) = 1.53, p = 0.229.
Lastly, we compared our VRPQ responses to the results from [18], to investigate whether the implementation of a motion suit and virtual avatar enhanced participants’ virtual immersion. Table 4 shows the mean (SD) response rates of the participants of this study and that of De Clercq et al. [18] to the factors of the VRPQ. No significant differences were found between responses in our study and that of De Clercq et al. [18] for any of the four presence factors. A detailed overview of the responses of our participants to each question of the VRPQ can be found in the Supplementary Materials (Table S3).

4. Discussion

Previous literature has shown that participants consider a text-based eHMI to be less ambiguous than front brake lights (e.g., [6,9,18]). In these prior surveys and virtual reality studies, participants were not able to cross the road. Herein, we investigated the effect of eHMIs on participants’ crossing behavior by visually and audibly immersing participants in a virtual environment where a schematic representation of the participant’ body was present.
We hypothesized that the Text eHMI would be more persuasive than front brake lights (FBLs), and FBLs more persuasive than baseline with No eHMI. Our survey results in Table 3 are consistent with the existing literature, with No eHMI yielding the highest difficulty ratings followed by FBL and then Text. After a Bonferonni correction, the differences between eHMI conditions were significant in 5 out of 12 cases. The objective results, operationalized as forward velocities of the pedestrians, are consistent with these self-reports, with the Text eHMI yielding the highest forward velocities followed by FBL and no eHMI. Of course, these findings only apply to first-time exposures to the eHMIs. It is likely that after training or repeated exposure, participants will get to know the meaning of the front brake lights (see also [18]). The meaning of a front brake light may be confusing as participants may not know whether they should apply an egocentric or allocentric perspective [9]. An additional explanation for the efficacy of the Text eHMI is that it was larger and more salient than the FBL. A similar effect of stimulus size can be found in Ackermann et al. [8], where participants rated large street projections in front of the vehicle as more recognizable than a relatively small text display on the grill.
Significant differences in forward velocity between Text/FBL and no eHMI were found for yielding vehicles in the 20 meter gap condition. The higher average forward velocity for the eHMI conditions can be largely explained by the fact that participants started crossing sooner when an eHMI was present (see Table 2). This effect can also be seen from the graphs depicting the forward velocities for each participant (see Figures S5 and S6 in the Supplementary Materials). The fact that the effects were strongest for the condition with 20 meter inter-vehicle distance can be explained by the fact that crossing through a 20 meters gap was too dangerous without indication from an eHMI that the vehicle will stop. Crossing through a 30-meter gap, on the other hand, was feasible without an eHMI. Thus, the effect of an eHMI was relatively small in the 30-meter condition because some participants started to cross directly after the second car had passed. These findings indicate that a motion suit allows for extracting patterns that are not evident from self-reports.
In non-yielding conditions, no differences in forward velocity between eHMIs are to be expected because participants were unable to cross the road. Participants showed a slight forward motion in the case of nonyielding vehicles, which may point to hesitative behavior. We found clear effects on thorax motion as a function of elapsed time, with participants rotating their upper body towards the target cars, and straight ahead if they were crossing. However, we did not observe significant differences in thorax angle between the eHMI conditions. This lack of significant effect could be explained by the fact that thorax angle is subject to more inter- and intra-individual variability as compared to forward velocity.
An innovation of our setup was that participants could not only walk through the virtual environment but could also see a dynamic representation of their body while having their movements recorded. Although a similar principle has been presented by Doric et al. [36] and Feldstein et al. [25,27], no motion data were presented in those studies to investigate the effects of eHMIs on pedestrian crossing behavior. The implementation of an avatar in our study was expected to yield a compelling sense of presence. Petkova and Ehrsson [37], for example, found that some participants experienced a full-body ownership illusion in virtual reality. However, we did not find significant improvements in participants’ subjective experience by utilizing a motion-tracking suit and implementing a virtual representation of the participants’ bodies compared to a prior study without a motion suit by De Clercq et al. [18]. Although this comparison should be interpreted with caution, as [18] was conducted a year before the present study at a different university and used a fundamentally different measurement of willingness to cross, it does suggest that providing a person with a virtual body does not strongly enhance experienced fidelity. Although participants in our study reported high scores for being in control and able to move around, relatively low scores were obtained for quickly adjusting to the environment, visual display quality, and being able to identify sounds. Thus, it seems that the motion suit offers benefits for presence but at the same time may cause some usability issues. The lack of overall improvement in presence could be explained by the fact that the avatar was a robot-looking genderless avatar. Another factor of importance could be tactile feedback. Petkova and Ehrsson [36] found that the full-body illusion was evoked only if being stimulated by synchronous tactile-visual feedback. It is possible that, if stepping down the sidewalk onto the road could be felt by participants, this would yield a more compelling sense of presence compared to the current setup in which participants walked on the flat lab floor. Lee et al. [38] presented a cave-like simulator, argued to be the largest 4K-resolution pedestrian simulator in the world, to be used for eHMI research. Such a solution is also expected to give a high sense of presence, as participants can walk in a virtual world while being able to see their body without the need for a head-mounted display (although glasses for stereoscopic vision can be used as an option).
In conclusion, we confirmed that eHMIs influence pedestrians’ actual crossing behavior compared to a baseline condition. The usage of a motion suit allows researchers to investigate subtle interaction patterns such as body angles and hesitative behaviors. Nuanced conclusions can be derived from such recordings compared to the discrete or binary information from survey studies (e.g., [6,9]) and virtual reality studies (e.g., [18,19]).
The present results allow for critical thinking about the value of high-fidelity setups for evaluating eHMIs. If a researcher’s goal is merely to evaluate which type of eHMI is clearest, then an immersive virtual reality setup such as the present one may not be needed. Eisma et al. [39] found that asking people on a scale from 0 to 10 whether the eHMI is clear yielded results that correlated nearly perfectly (r = 0.99) with objective results measured using a response key. In turn, the present study found that pedestrians’ forward velocity gave results that are similar to previous research using a response button [18]. However, if one’s goal is to evaluate how people cross, then a high-fidelity setup such as the present one can be valuable.
For future research, we see merit in utilizing a motion-tracking suit in more complex traffic scenarios involving pedestrian-vehicle interaction. For example, it would be worthwhile to test the effectiveness of eHMIs in situations where participants have to distribute their attention, such as situations that involve bidirectional traffic flows, other pedestrians, and a mix of autonomous and conventionally driven vehicles. Additionally, the 3D recording of pedestrians in crossing situations could be beneficial to perception and modeling research (e.g., [40,41]), where the goal is to have self-driving vehicles detecting the posture of pedestrians and infer their crossing intention.

Supplementary Materials

The following are available online at https://0-www-mdpi-com.brum.beds.ac.uk/2078-2489/10/12/386/s1, Figures S1–S6, Tables S1–S3. A video showing two trials, raw data, and scripts can be found here: https://0-doi-org.brum.beds.ac.uk/10.4121/uuid:45378b74-4dab-465d-97dd-e593972d6125.

Author Contributions

Conceptualization, all authors; Methodology, all authors; Software, L.K.; Validation, J.C.F.d.W., R.H.; Formal analysis, L.K., J.C.F.d.W.; Investigation, L.K.; Resources, J.C.F.d.W., R.H.; Data curation, L.K., J.C.F.d.W.; Writing—original draft preparation, L.K., J.C.F.d.W.; Writing—review and editing, all authors; Visualization, L.K.; Supervision, J.C.F.d.W. & R.H.; Project administration, J.C.F.d.W. & R.H.; Funding acquisition, J.C.F.d.W. & R.H.

Funding

This research was supported by the research program VIDI with grant number TTW 016.Vidi.178.047 (2018–2022; “How should automated vehicles communicate with other road users?”), which is financed by the Netherlands Organisation for Scientific Research (NWO). Additionally, this research was supported by the NWO under the grant Safe Interaction with Vulnerable Road Users (SafeVRU) - TTW#14667.

Conflicts of Interest

The authors declare no conflict of interest. The funders had no role in the design of the study; in the collection, analyses, or interpretation of data; in the writing of the manuscript, or in the decision to publish the results.

References

  1. WHO. Global Status Report on Road Safety; WHO: Geneva, Switzerland, 2015. [Google Scholar]
  2. Singh, S. Critical Reasons for Crashes Investigated in the Nation Motor Vehicle Crash Causation Survey; National Highway Traffic Safety Administration: Washington, DC, USA, 2015. [Google Scholar]
  3. Milakis, D.; Snelder, M.; Van Arem, B.; Van Wee, B.; De Almeida Correia, G.H. Development and transport implications of automated vehicles in the Netherlands: Scenarios for 2030 and 2050. Eur. J. Transp. Infrastruct. Res. 2017, 17, 63–85. [Google Scholar]
  4. Matthews, M.; Chowdhary, G.; Kieson, E. Intent communication between autonomous vehicles and pedestrians. arXiv 2017, arXiv:1708.07123. [Google Scholar]
  5. Rasouli, A.; Kotseruba, I.; Tsotsos, J.K. Agreeing to cross: How drivers and pedestrians communicate. In Proceedings of the 2017 IEEE Intelligent Vehicles Symposium (IV), Los Angeles, CA, USA, 11–14 June 2017; pp. 264–269. [Google Scholar]
  6. Fridman, L.; Mehler, B.; Xia, L.; Yang, Y.; Facusse, L.Y.; Reimer, B. To walk or not to walk: Crowdsourced assessment of external vehicle-to-pedestrian displays. arXiv 2017, arXiv:1707.02698. [Google Scholar]
  7. Chang, C.M.; Toda, K.; Igarashi, T.; Miyata, M.; Kobayashi, Y. A video-based study comparing communication modalities between an autonomous car and a pedestrian. In Proceedings of the 10th International Conference on Automotive User Interfaces and Interactive Vehicular Applications, Toronto, ON, Canada, 23–25 September 2018; pp. 104–109. [Google Scholar]
  8. Ackermann, C.; Beggiato, M.; Schubert, S.; Krems, J.F. An experimental study to investigate design and assessment criteria: What is important for communication between pedestrians and automated vehicles? Appl. Ergon. 2019, 75, 272–282. [Google Scholar] [CrossRef] [PubMed]
  9. Bazilinskyy, P.; Dodou, D.; De Winter, J.C.F. Survey on eHMI concepts: The effect of text, color, and perspective. Transp. Res. Part F Traffic Psychol. Behav. 2019, 67, 175–194. [Google Scholar] [CrossRef]
  10. Deb, S.; Hudson, C.R.; Carruth, D.W.; Frey, D. Pedestrians receptivity in autonomous vehicles: Exploring a video-based assessment. Proc. Hum. Factors Ergon. Soc. Annu. Meet. 2018, 62, 2061–2065. [Google Scholar] [CrossRef] [Green Version]
  11. Hagenzieker, M.P.; Van der Kint, S.; Vissers, L.; Van Schagen, I.N.L.G.; De Bruin, J.; Van Gent, P.; Commandeur, J.J.F. Interactions between cyclists and automated vehicles: Results of a photo experiment. J. Transp. Saf. Secur. 2019. [Google Scholar] [CrossRef] [Green Version]
  12. Dey, D.; Martens, M.; Eggen, B.; Terken, J. Pedestrian road-crossing willingness as a function of vehicle automation, external appearance, and driving behaviour. Transp. Res. Part F Traffic Psychol. Behav. 2019, 65, 191–205. [Google Scholar] [CrossRef]
  13. Zhang, J.; Vinkhuyzen, E.; Cefkin, M. Evaluation of an autonomous vehicle external communication system concept: A survey study. In International Conference on Applied Human Factors and Ergonomics; Springer: Berlin/Heidelberg, Germany, 2017; pp. 650–661. [Google Scholar]
  14. Mahadevan, K.; Sanoubari, E.; Somanath, S.; Young, J.E.; Sharlin, E. AV-Pedestrian interaction design using a pedestrian mixed traffic simulator. In Proceedings of the 2019 on Designing Interactive Systems Conference, San Diego, CA, USA, 18 June 2019; pp. 475–486. [Google Scholar]
  15. Nuñez Velasco, P.; Farah, H.; Van Arem, B.; Hagenzieker, M. WEpod WElly in Delft: Pedestrians’ crossing behaviour when interacting with automated vehicles using Virtual Reality. In Proceedings of the 15th International Conference on Travel Behaviour Research, Santa Barbara, CA, USA, 15–20 July 2018. [Google Scholar]
  16. Schmidt, H.; Terwilliger, J.; AlAdawy, D.; Fridman, L. Hacking nonverbal communication between pedestrians and vehicles in virtual reality. arXiv 2016, arXiv:1904.01931. [Google Scholar]
  17. Walker, F.; Dey, D.; Martens, M.; Pfleging, B.; Eggen, B.; Terken, J. Feeling-of-safety slider: Measuring pedestrian willingness to cross roads in field interactions with vehicles. In Proceedings of the 2019 CHI Conference on Human Factors in Computing Systems, Glasgow, UK, 4–9 May 2019. [Google Scholar]
  18. De Clercq, K.; Dietrich, A.; Núñez Velasco, J.P.; De Winter, J.; Happee, R. External human-machine interfaces on automated vehicles: Effects on pedestrian crossing decisions. Hum. Factors 2019, 61, 1353–1370. [Google Scholar] [CrossRef] [Green Version]
  19. Ackermans, S.C.A. The Effects of Attitudes, Autonomous Appearance and Intention Communication in Pedestrian Interactions with Autonomous Vehicles. Master’s Thesis, Eindhoven University of Technology, Eindhoven, The Netherlands, 2019. [Google Scholar]
  20. Weber, F.; Chadowitz, R.; Schmidt, K.; Messerschmidt, J.; Fuest, T. Crossing the street across the globe: A study on the effects of eHMI on pedestrians in the US, Germany and China. In HCI in Mobility, Transport, and Automotive Systems. HCII 2019; Lecture Notes in Computer Science; Krömker, H., Ed.; Springer: Berlin/Heidelberg, Germany, 2019; Volume 11596. [Google Scholar]
  21. Clamann, M.; Aubert, M.; Cummings, M.L. Evaluation of vehicle-to-pedestrian communication displays for autonomous vehicles. In Proceedings of the TRB 96th Annual Meeting Compendium of Papers 2017, Washington, DC, USA, 8–12 January 2017. [Google Scholar]
  22. Palmeiro, A.R.; Van der Kint, S.; Vissers, L.; Farah, H.; De Winter, J.C.F.; Hagenzieker, M. Interaction between pedestrians and automated vehicles: A Wizard of Oz experiment. Transp. Res. Part F Traffic Psychol. Behav. 2018, 58, 1005–1020. [Google Scholar] [CrossRef] [Green Version]
  23. Cefkin, M.; Zhang, J.; Stayton, E.; Vinkhuyzen, E. Multi-methods research to examine external HMI for highly automated vehicles. In HCI in Mobility, Transport, and Automotive Systems. HCII 2019; Lecture Notes in Computer Science; Krömker, H., Ed.; Springer: Berlin/Heidelberg, Germany, 2019; Volume 11596. [Google Scholar]
  24. Rothenbücher, D.; Li, J.; Sirkin, D.; Mok, B.; Ju, W. Ghost driver: A field study investigating the interaction between pedestrians and driverless vehicles. In Proceedings of the 2016 25th IEEE International Symposium on Robot and Human Interactive Communication (RO-MAN), New York, NY, USA, 26–31 August 2016; pp. 795–802. [Google Scholar]
  25. Feldstein, I.; Dietrich, A.; Milinkovic, S.; Bengler, K. A pedestrian simulator for urban crossing scenarios. IFAC PapersOnLine 2016, 49, 239–244. [Google Scholar] [CrossRef]
  26. Le Lee, Y.M.; Uttley, J.; Solernou, A.; Giles, O.; Romano, R.; Markkula, G.; Merat, N. Investigating pedestrians’ crossing behaviour during car deceleration using wireless head mounted display: An application towards the evaluation of eHMI of automated vehicles. In Proceedings of the Tenth International Driving Symposium on Human Factors in Driving Assessment, Training and Vehicle Design. 2019 Driving Assessment Conference, Santa Fe, NM, USA, 24–27 June 2019; pp. 252–258. [Google Scholar]
  27. Feldstein, I.T.; Lehsing, C.; Dietrich, A.; Bengler, K. Pedestrian simulators for traffic research: State of the art and future of a motion lab. Int.J. Human Factors Model. Simul. 2018, 6, 250–265. [Google Scholar] [CrossRef]
  28. MVN Analyze [Computer Software]. Motion Capture Software. Available online: https://www.xsens.com/products/mvn-analyze (accessed on 28 November 2019).
  29. Papadimitriou, E.; Lassarre, S.; Yannis, G. Human factors of pedestrian walking and crossing behaviour. Transp. Res. Procedia 2017, 25, 2002–2015. [Google Scholar] [CrossRef]
  30. Witmer, B.G.; Jerome, C.J.; Singer, M.J. The factor structure of the presence questionnaire. Presence Teleoperators Virtual Environ. 2005, 14, 298–312. [Google Scholar] [CrossRef]
  31. Roether, C.L.; Omlor, L.; Christensen, A.; Giese, M.A. Critical features for the perception of emotion from gait. J. Vis. 2009, 9, 15. [Google Scholar] [CrossRef]
  32. Crane, E.; Gross, M. Motion capture and emotion: Affect detection in whole body movement. In International Conference on Affective Computing and Intelligent Interaction; Springer: Berlin/Heidelberg, Germany, 2007; pp. 95–101. [Google Scholar]
  33. Schreven, S.; Beek, P.J.; Smeets, J.B. Optimising filtering parameters for a 3D motion analysis system. J. Electromyogr. Kinesiol. 2015, 25, 808–814. [Google Scholar] [CrossRef] [Green Version]
  34. Turner, S.D. qqman: An R package for visualizing GWAS results using QQ and manhattan plots. Biorxiv 2014, 5165. [Google Scholar] [CrossRef]
  35. Be Benjamin, D.J.; Berger, J.O.; Johannesson, M.; Nosek, B.A.; Wagenmakers, E.J.; Berk, R.; Bollen, K.A.; Brembs, B.; Brown, L.; Camerer, C.; et al. Redefine statistical significance. Nat. Hum. Behav. 2018, 2, 6–10. [Google Scholar] [CrossRef]
  36. Doric, I.; Frison, A.K.; Wintersberger, P.; Riener, A.; Wittmann, S.; Zimmermann, M.; Brandmeier, T. A novel approach for researching crossing behavior and risk acceptance: The pedestrian simulator. In Proceedings of the 8th International Conference on Automotive User Interfaces and Interactive Vehicular Applications, Ann Arbor, MI, USA, 24–26 October 2016; pp. 39–44. [Google Scholar]
  37. Petkova, V.I.; Ehrsson, H.H. If I were you: Perceptual illusion of body swapping. PLoS ONE 2018, 3, e3832. [Google Scholar] [CrossRef] [Green Version]
  38. Lee, Y.M.; Madigan, R.; Markkula, G.; Pekkanen, J.; Merat, N.; Avsar, H.; Utesch, F.; Schieben, A.; Schießl, C.; Dietrich, A.; et al. interACT D.6.1. Methodologies for the Evaluation and Impact Assessment of the InterACT Solutions. Available online: https://www.interact-roadautomation.eu/wp-content/uploads/interACT_D6.1_01082019_v1.0_uploadWebsite_approved_reduced-size-1.pdf (accessed on 17 November 2019).
  39. Eisma, Y.B.; Bergen, S.; Brake, S.; Hensen, M.; Tempelaar, W.; De Winter, J.C.F. External human-machine interfaces: The effect of display location on crossing intentions and eye movements. Information 2020, 11, 13. [Google Scholar]
  40. Flohr, F.; Dumitru-Guzu, M.; Kooij, J.F.; Gavrila, D.M. A probabilistic framework for joint pedestrian head and body orientation estimation. IEEE Trans. Intell. Transp. Syst. 2015, 16, 1872–1882. [Google Scholar] [CrossRef]
  41. Kooij, J.F.P.; Schneider, N.; Flohr, F.; Gavrila, D.M. Context-based pedestrian path prediction. In European Conference on Computer Vision; Springer: Berlin/Heidelberg, Germany, 2014; pp. 618–633. [Google Scholar]
Figure 1. Cars approaching a participant in the virtual environment. The starting location of the participant during the experiment was visible on the sidewalk. Cars only approached the participants from their left-hand side. Participants were instructed to cross the road up until the third zebra stripe counting from the curb. The avatar was based on the 3D measured participant motion.
Information 10 00386 g001
Figure 2. Distances of the front of the cars to the front edge of the zebra crossing during a trial. Time = 0 s was defined as the moment when the first vehicle in the platoon of cars was approximately 30 meters away from the zebra crossing.
Information 10 00386 g002
Figure 3. Top: Mean forward gait velocities during the conditions “20 meters, yielding” and “20 meters, nonyielding”. Bottom: p-values from paired-sample t-tests. None = No eHMI, Text = Text eHMI, FBL = Front Brake Lights. t = 0 is the moment when the third vehicle in the platoon started braking in the yielding conditions or was at the same point of braking in the nonyielding conditions.
Information 10 00386 g003
Figure 4. Top: Mean forward gait velocities during the conditions “30 meters, yielding” and “30 meters, nonyielding”. Bottom: p-values from paired-sample t-tests. None = No eHMI, Text = Text eHMI, FBL = Front Brake Lights. t = 0 is the moment when the third vehicle in the platoon started braking in the yielding conditions or was at the same point of braking in the nonyielding conditions.
Information 10 00386 g004
Figure 5. Top: Mean thorax angles during the conditions “20 meters, yielding” and “20 meters, nonyielding”. Bottom: p-values over time. None = No eHMI, Text = Text eHMI, FBL = Front Brake Lights. t = 0 is the moment when the third vehicle in the platoon started braking in the yielding conditions or was at the same point of braking in the nonyielding conditions.
Information 10 00386 g005
Figure 6. Top: Mean thorax angles during the conditions “30 meters, yielding” and “30 meters, nonyielding”. Bottom: p-values over time. None = No eHMI, Text = Text eHMI, FBL = Front Brake Lights. t = 0 is the moment when the third vehicle in the platoon started braking in the yielding conditions or was at the same point of braking in the nonyielding conditions.
Information 10 00386 g006
Figure 7. User experience; mean responses of the participants to the three statements after each trial, including least-squares regression lines.
Information 10 00386 g007
Table 1. Appearance of the cars used in this experiment.
Front Brake Lights, yielding Information 10 00386 i001
Front Brake Lights, nonyielding Information 10 00386 i002
Text eHMI, yielding Information 10 00386 i003
Text eHMI, nonyielding Information 10 00386 i004
No eHMI, yielding and nonyielding Information 10 00386 i005
Note: For the No eHMI (Baseline) condition, the vehicles looked the same in their yielding and nonyielding state.
Table 2. Descriptive statistics and results from paired-sample t-tests for the Moment of Leaving Curb (in seconds).
NoneTextFront Brake Lights
M (SD)M (SD)M (SD)
20 meters yielding3.67 (0.99)2.75 (1.25)2.97 (1.21)
30 meters yielding2.94 (1.71)2.28 (1.02)2.59 (1.67)
20 meters yieldingt-test None – Textt(20) = 5.79, p< 0.001
20 meters yieldingt-test None – FBLt(20) = 3.94, p< 0.001
20 meters yieldingt-test Text – FBLt(20) = −1.40, p = 0.175
30 meters yieldingt-test None – Textt(21) = 2.10, p = 0.048
30 meters yieldingt-test None – FBLt(21) = 1.10, p = 0.284
30 meters yieldingt-test Text – FBLt(21) = –1.12, p = 0.274
Note: None = No eHMI, Text = Text eHMI, FBL = Front Brake Lights. Significant differences (p < 0.017) are indicated in boldface.
Table 3. Descriptive statistics and results from paired-sample t-tests of the comparison between the subjective responses of participants’ difficulty to predict the behavior of oncoming vehicles when an eHMI was either present or absent.
NoneTextFront Brake Lights
M (SD)M (SD)M (SD)
20 meters yielding4.48 (2.18)2.43 (1.33)3.43 (2.23)
20 meters nonyielding3.63 (2.42)2.25 (1.53)3.88 (2.09)
30 meters yielding4.36 (2.56)2.91 (1.97)4.00 (2.51)
30 meters nonyielding4.28 (2.65)2.89 (2.22)4.06 (2.21)
20 meters yieldingt-test None vs. Textt(20) = 4.10, p< 0.001
20 meters yieldingt-test None vs. FBLt(20) = 2.02, p = 0.057
20 meters yieldingt-test Text vs. FBLt(20) = −1.80, p = 0.087
20 meters nonyieldingt-test None vs. Textt(15) = 2.59, p = 0.021
20 meters nonyieldingt-test None vs. FBLt(15) = –0.62, p = 0.545
20 meters nonyieldingt-test Text vs. FBLt(15) = −3.64, p= 0.002
30 meters yieldingt-test None vs. Textt(21) = 2.71, p= 0.013
30 meters yieldingt-test None vs. FBLt(21) = 0.76, p = 0.459
30 meters yieldingt-test Text vs. FBLt(21) = −2.11, p = 0.047
30 meters nonyieldingt-test None vs. Textt(17) = 2.98, p= 0.008
30 meters nonyieldingt-test None vs. FBLt(17) = 0.42, p = 0.679
30 meters nonyieldingt-test Text vs. FBLt(17) = −2.87, p= 0.011
Note: None = No eHMI, Text = Text eHMI, FBL = Front Brake Lights. Significant differences (p < 0.017) are indicated in boldface.
Table 4. Subjective evaluation of our study compared to De Clercq et al. [18]. Results from two-sample t-tests, including descriptive statistics.
Responses Per Study
Kooijman et al.De Clercq et al.
MSDNMSDNptdf
Involvement5.100.65244.940.62280.3750.8950
Sensor Fidelity4.791.01245.070.72280.251−1.1650
Adaptation/Immersion5.560.64245.680.72280.546−0.6150
Interface Quality3.190.97242.991.03280.4620.7450
Note: The four factors were defined according to Witmer et al. (2005). Responses are on a scale from 1 to 7.

