Article

Online Plasma Diagnostics in the Remote Spectroscopy Laboratory for Practical Training and Experimental Research

1
Research/Training Center for Plasma Studies, Bauman Moscow State Technical University, 105005 Moscow, Russia
2
Tokamaks Department, National Research Centre “Kurchatov institute”, 123182 Moscow, Russia
*
Author to whom correspondence should be addressed.
Submission received: 27 November 2019 / Revised: 11 December 2019 / Accepted: 12 December 2019 / Published: 21 December 2019
(This article belongs to the Special Issue Online Experimentation and the IoE)

Abstract

:
This paper deals with an integrated Internet-based education laboratory that allows both practical lab sessions and full-blown research projects to be carried out using state-of-the-art experimental facilities. The setup of a system that controls lab equipment via a global computer network is described, and a distributed hardware and software control facility supporting remote lab operations is considered in terms of its structural arrangement and component interaction. We present a computer-aided dispatch-and-information system that allows students to generate their own experiment scenarios, conduct experiments remotely, and store/process experimental results from their personal cabinets. We also discuss the peculiarities of developing a computerized system to support plasma spectroscopy hands-on education and research. Further emphasis is given to the laboratory modernization, regarding both hardware and result processing software.

1. Introduction

State-of-the-art information and telecommunication technologies (ITTs) are playing an increasingly important role in education curricula and research activities at both classical and technology universities. With the knowledge acquisition process becoming more customized, and undergraduate education and research moving to a higher level, there is a continuous need to extend the range of state-of-the art (and often unique) laboratory test stands available to students. A network access to complex technological and scientific training equipment [1,2,3] provides new opportunities for improving academic activities and making this equipment accessible to students from geographically dispersed sites.
A number of remote research-and-training labs were set up at the Bauman Moscow State Technical University (BMSTU) at the turn of the 20th century. One of the first Internet-based labs [4] was intended for holding remote practical lab sessions to explore emission spectra produced by different discharges. In that lab, the remote user–automated plasma diagnostics stand communication was network-enabled and used different data exchange/command transmission protocols. To maintain system reliability and performance, the lab’s Web Server was separated from the computer operating spectroscopic equipment (the Lab Server). When an unexpected user–server disconnection occurred, the Lab Server maintained the experimental session according to parameters preset by the user, without disrupting a stand’s working mode.
The Remote Interactive Dialogue System (RIDS) [5], developed by the authors of this paper in a way to comprehensively support the remote experimenting process, used a software suite for generating remote lab experiment scenarios, which enabled the user–Web Server dialogue and allowed experiments to be conducted in accordance with prescribed parameters, with the results screened on a lab class website. Each stage of a practical lab session was supported methodologically by a tutorial subsystem, which contained a stand/measurement procedure description along with various reference data. This Internet-based laboratory configuration was successfully used for several years in the academic exercise, i.e., in practical lab sessions carried out as part of a general physics or plasma diagnostics course—until its hardware, with monochromator MDR-23 as a basis, became antiquated and obsolete.
Later, the authors of this paper developed the integrated Remote Spectroscopy Laboratory for Practical Training and Experimental Research (RSLPTER), based conceptually on the remote control of state-of-the-art spectroscopic equipment and the use of an electronic detection system. RSLPTER brings the undergraduate and research laboratory settings together, affording opportunities for both educational and full-blown scientific research. RSLPTERS has been consistently upgraded to extend the range of physical processes to study. This was not limited to the addition of new subjects of research but envisaged a wider use of ITTs in remote experiments and in online experimental data processing systems.

2. Internet-Based Educational Laboratory for Plasma Spectroscopy

A hardware and software system (HSS) was developed [6] to exercise a remote, network-enabled control of state-of-the-art spectroscopic plasma diagnostic equipment (Figure 1). The instrumentation is based on the AvaSpec-2048 multi-channel spectrometer, connected to a personal computer over a USB-interface.
The spectrometer electronic systems are controlled by a built-in microprocessor board, which also supports the transmission of control signals and data exchange with the Lab Server. The device is configured to register visible wavelength ranges and has four channels that have different radiation detection ranges, diffraction gratings (ruled gratings with 1200 to 3600 lines/mm), slit sizes (10 to 25 mkm), and 2nd order harmonic cut off filters.
The Lab Server controlling the spectrometer is connected to the Web Server, hosted on the Internet, by a LAN. When a web-based experiment is conducted using a remote user interface generated with PHP-scripts in the form of dynamic HTML pages, the spectrometer working mode and operating parameters are set, verified for correctness, entered in the integrated database, and then implemented.

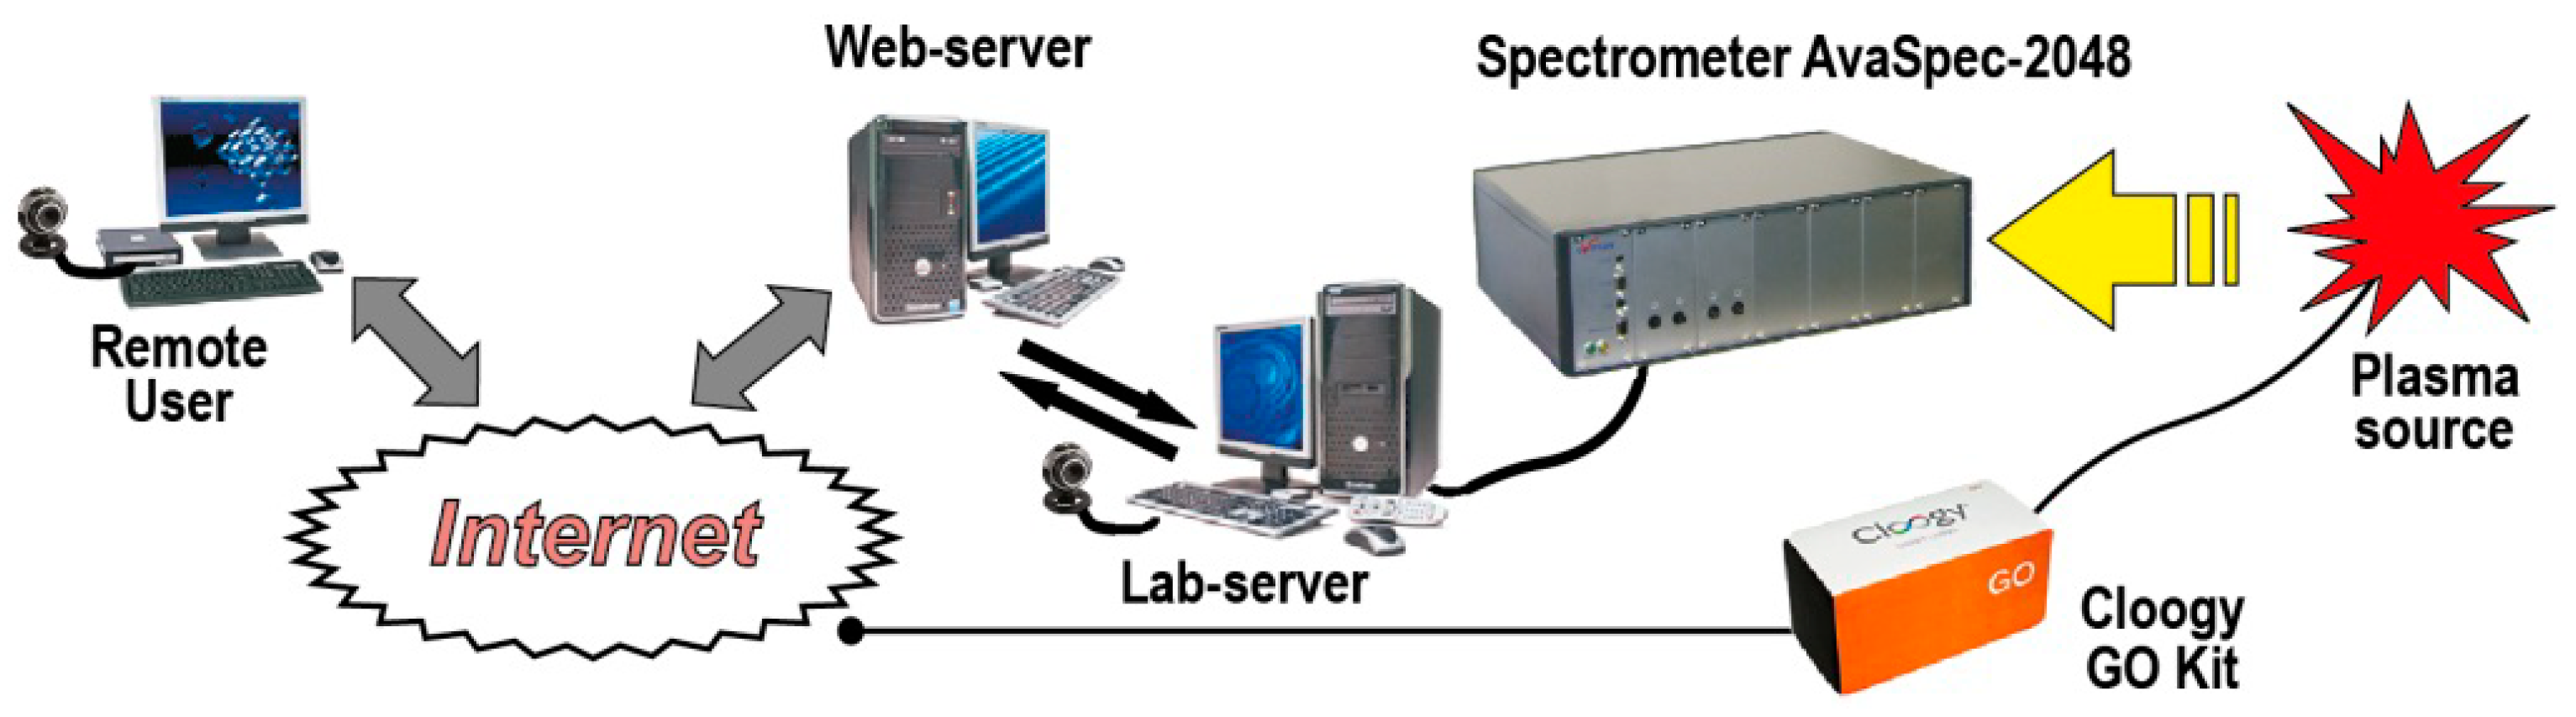
2.1. HSS Structural Arrangement and Component Interaction

The HSS software supports the operation of user registration and authorization subsystems, training and knowledge control subsystems, as well as user web-interfaces for remote control and processing of experimental results. It also includes an integrated database (MySQL). The Windows-generated SpectrService periodically scans database tables that contain information about remote users’ spectrum registration requests and enters corresponding scenarios on an execution queue. A remote experimenter is promptly notified about the experiment status (‘Scenario Queued for Execution’; ‘Spectrum Being Registered’, etc.) In addition, there is a Dispatch & Information System (DIS) in place [7], which manages requests for remote experimenting, education experiment support, and the analysis of experimental results.
After signing in at the RSLPTER website and negotiating lab exercise details via email, a user can request, from his/her personal cabinet, a lab session whenever convenient to him/her. The lab manager views all lab requests and enters them in an experiment activity log, whereupon the fulfilment of requests and memorization of results are controlled automatically. When scheduled, the system gives a go-ahead to the creation of remote experiment scenarios and the setting of parameters. Users are only allowed access to a lab facility remote control after passing a test used to assess their knowledge of guidance materials published on the RSLPTER website. The monitoring of whether experiment parameters are acceptable and practicable is also computer-controlled.

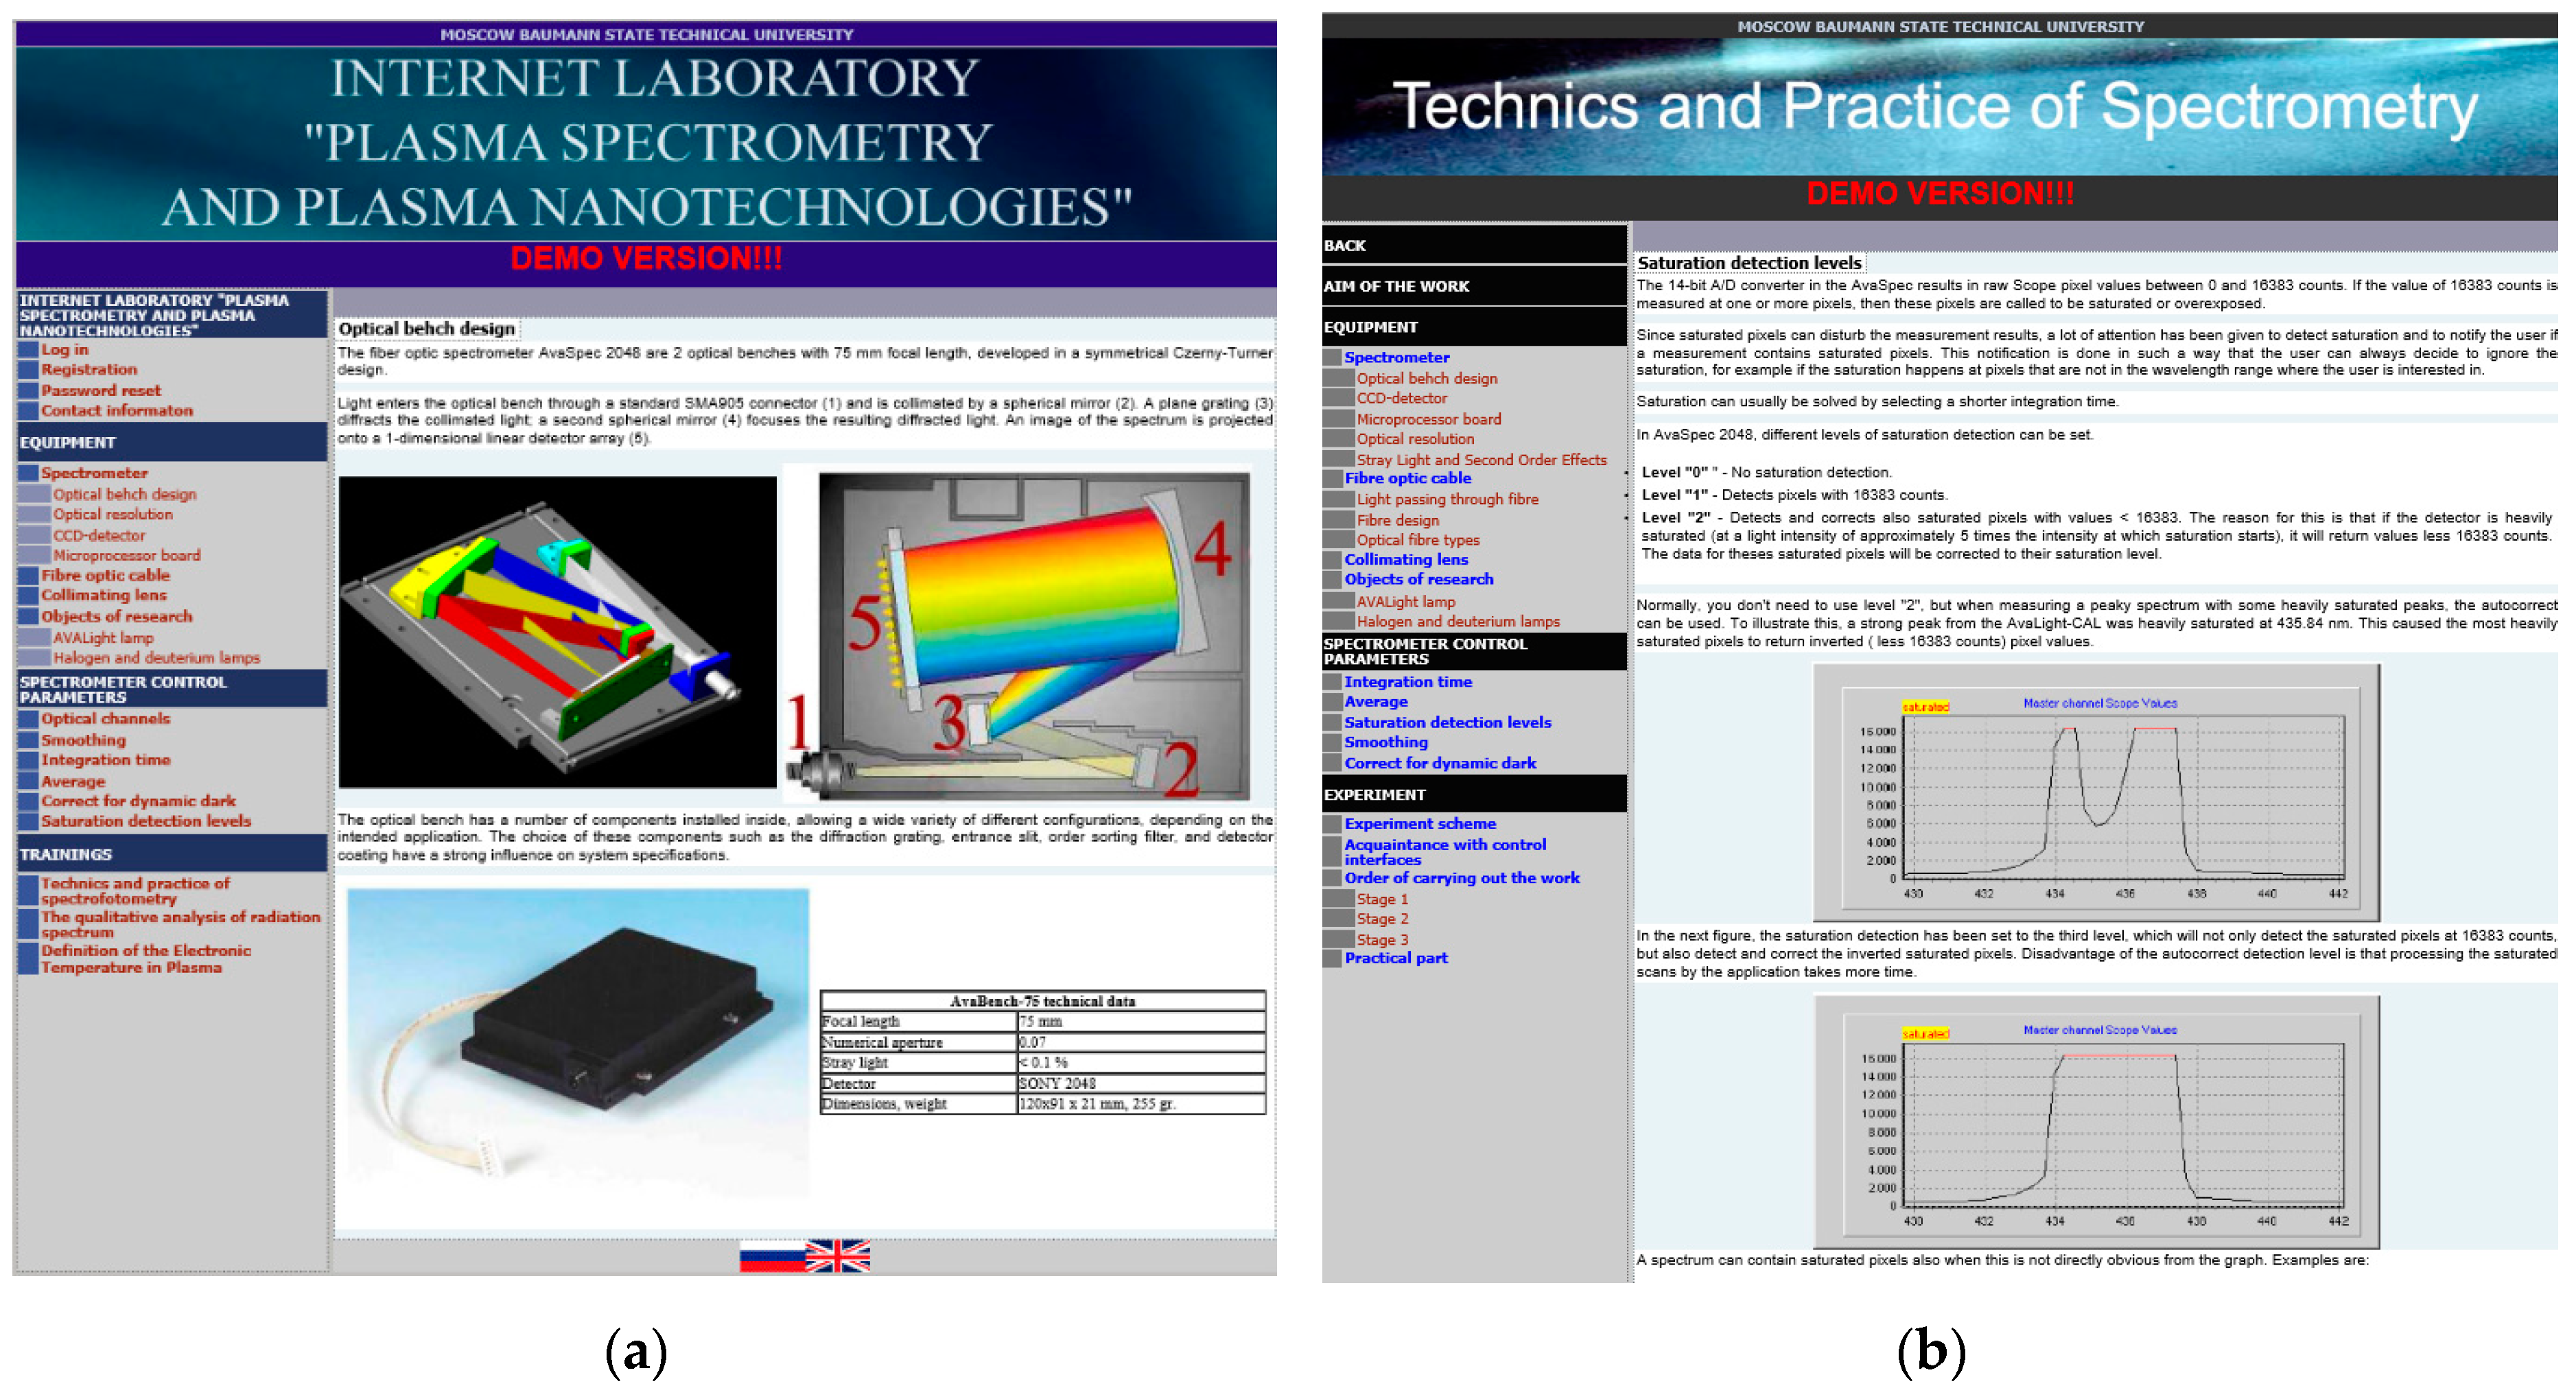
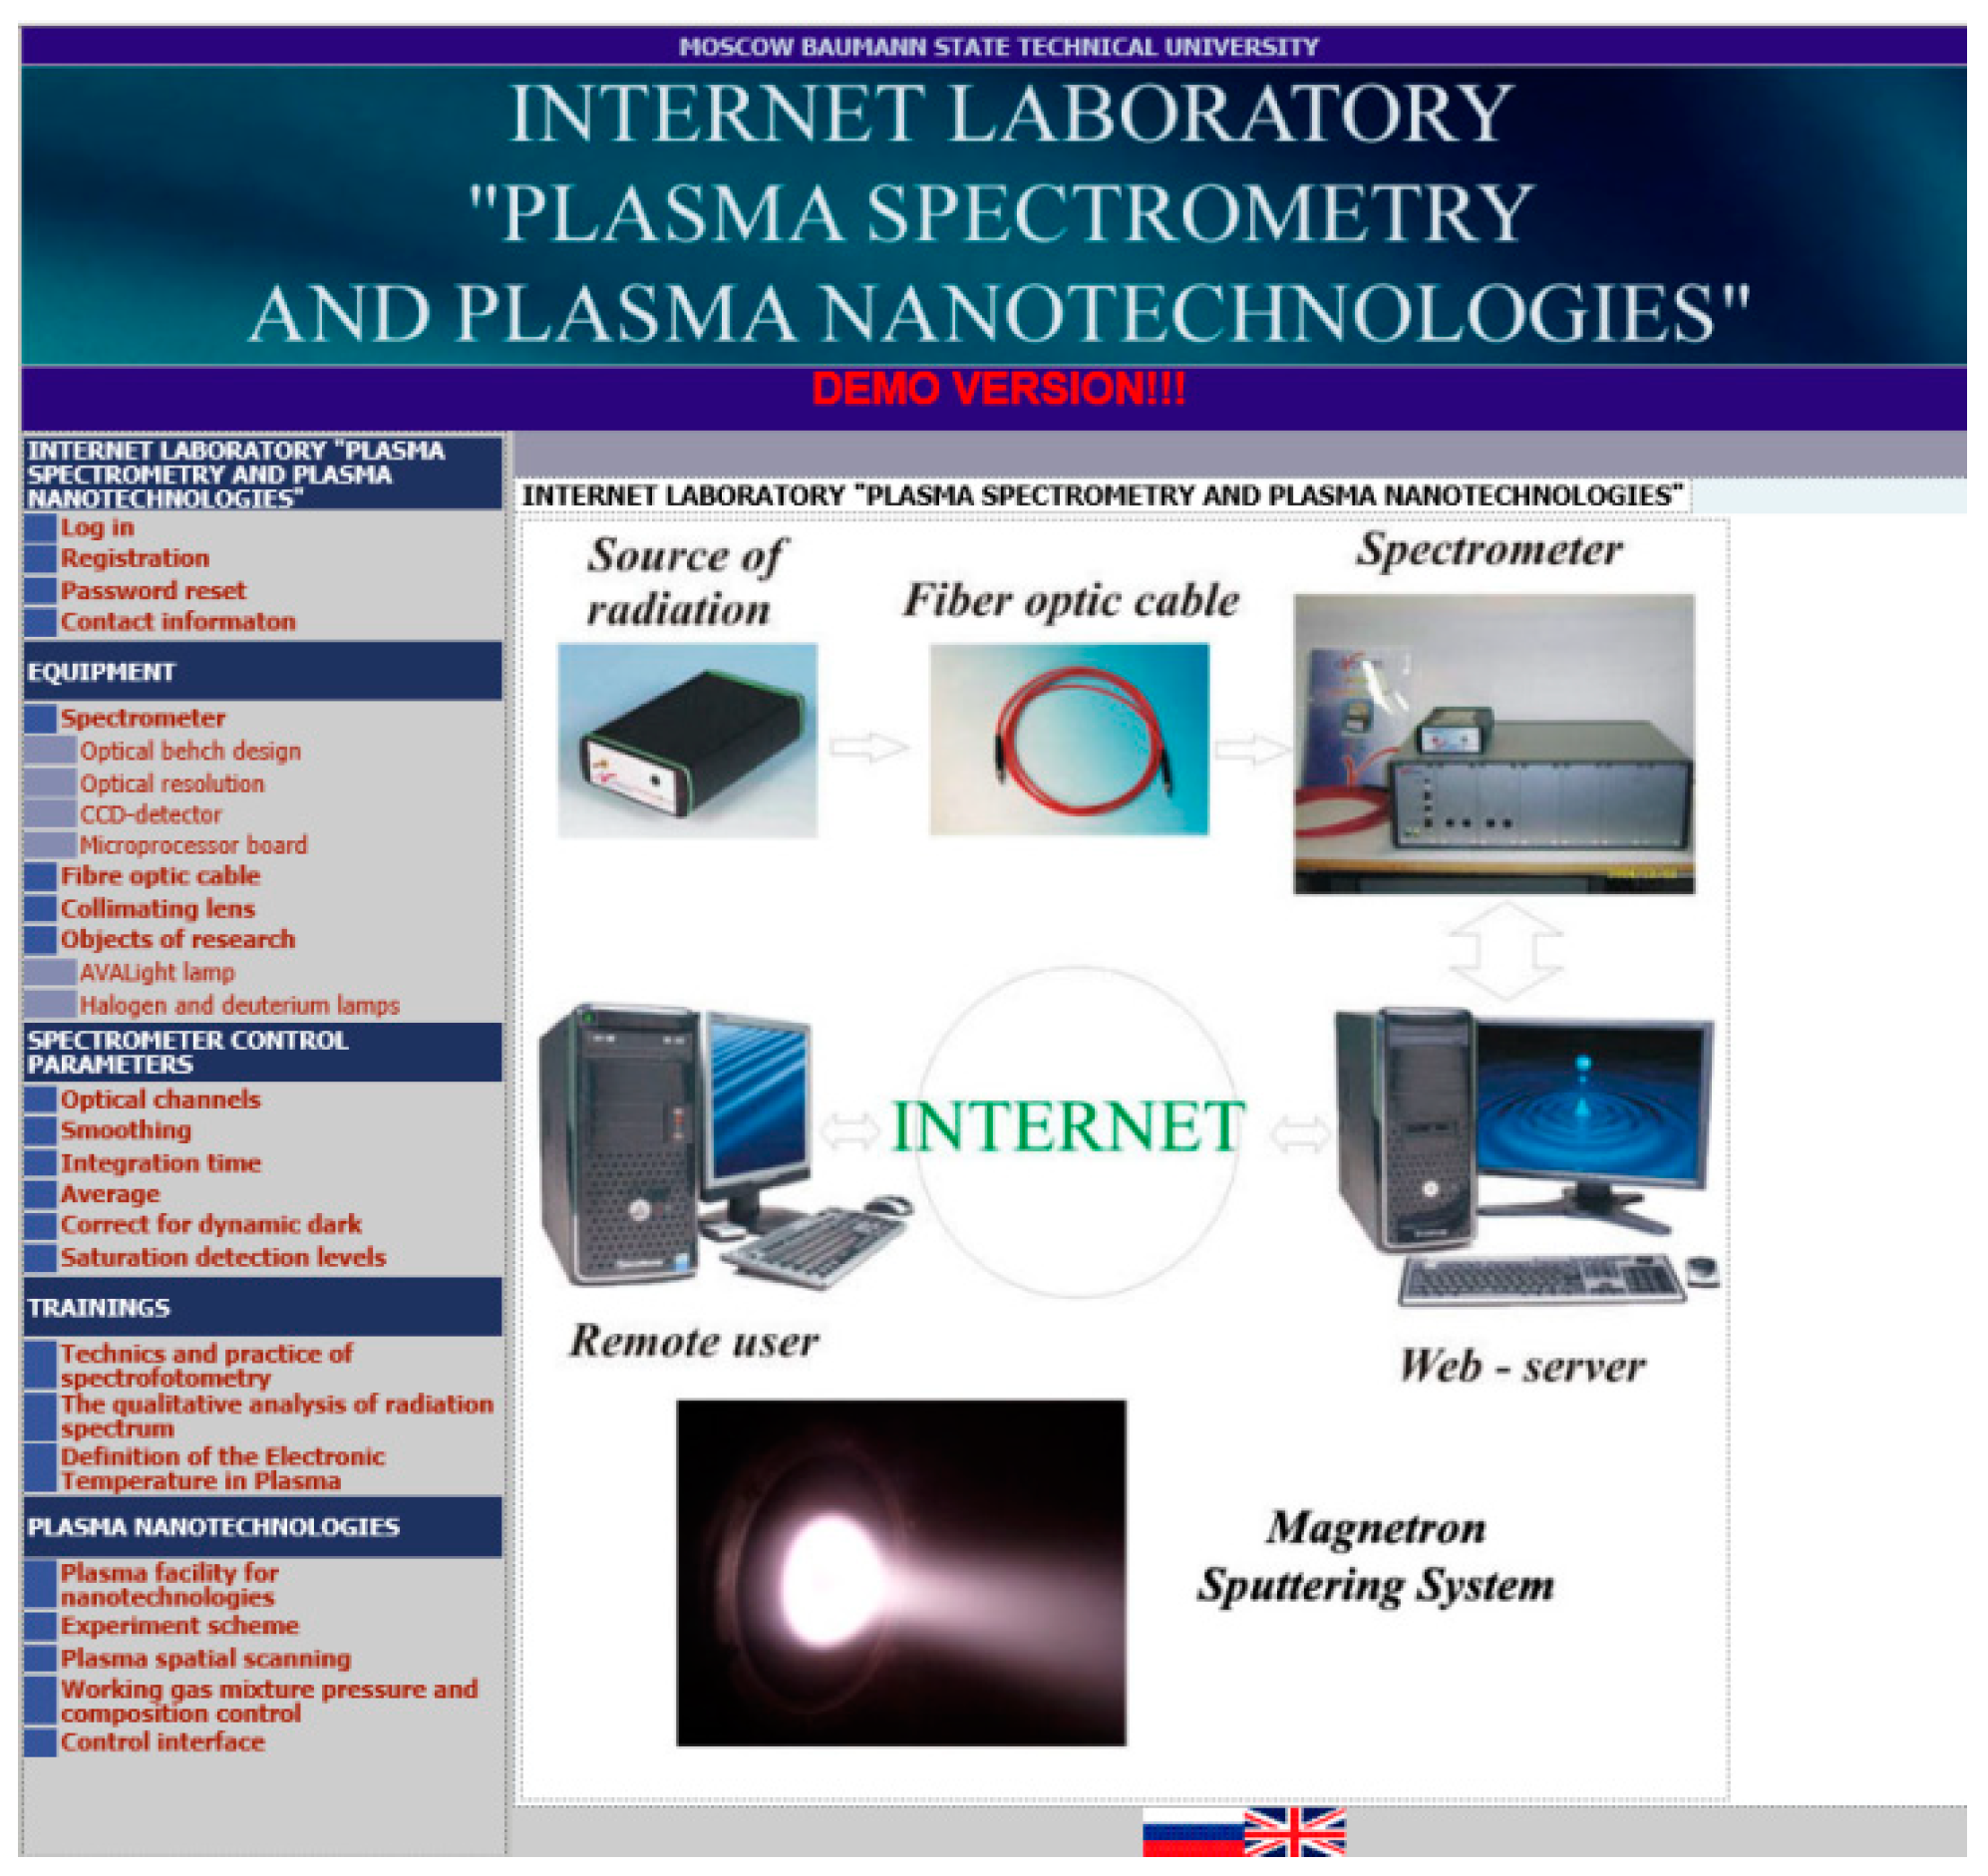
2.2. The RSLPTER Website

The RSLPTER Web Server, accessible during working hours to users wishing to sign in and request a lab session at http://plasma.bmstu.ru, allows practical training sessions, research work, and raw information processing to be conducted at hours coordinated with the lab management. A RSLPTER website demo version is available 24 h a day at http://lud.bmstu.ru in both Russian and English. It contains study guides that help students get prepared for lab exercises and highlight theoretical basics and practical guidelines on the lab equipment, the list of the diagnostic system control parameters and their tolerable ranges, as well as measurement methodologies and sequences (Figure 1). Studying these materials is instrumental to passing the entrance test and gaining access to remote experimenting.
The Windows-based Spectr Service sets the spectrometer working mode over a USB-interface in accordance with the remote user parameters and ensures that the results of spectrum registration are stored on the Web Server, while the database only contains the names of files with the results. This approach enables the implementation of a multi-user environment, which is particularly important for distant university student groups that engage in a lab exercise in a classroom setting.
Users can access experimental results from their personal cabinets using corresponding PHP-scripts. The results are presented in graphical or tabular form both during and after a control session.
The developed software also provides additional possibilities of raw data processing with adequate account for the radiation source specificity.
The integrated database contained the list and details of all practical training courses given at RSLPTER, remote user details, information about individual user remote control sessions, lab equipment operating mode, as well as equipment utilization statistics. Beside that, the connection to the U.S. National Institute of Standards and Technology’s (NIST, http://www.nist.gov) spectral database is implemented.
Students doing lab exercises utilize light sources with different spectral output, including continuous, atomic (line), and molecular (line-and-band) spectra. Light is generated by gas-discharge lamps (e.g., AvaLight-CAL, OSRAM, DDS-30, and the VSB-2 set of lamps filled with different gases) that are widely used in interferometers and spectrophotometers for calibration purposes. All lab exercises mentioned in the paper are done by the students/scientific staff on-line in the 45 min time span.

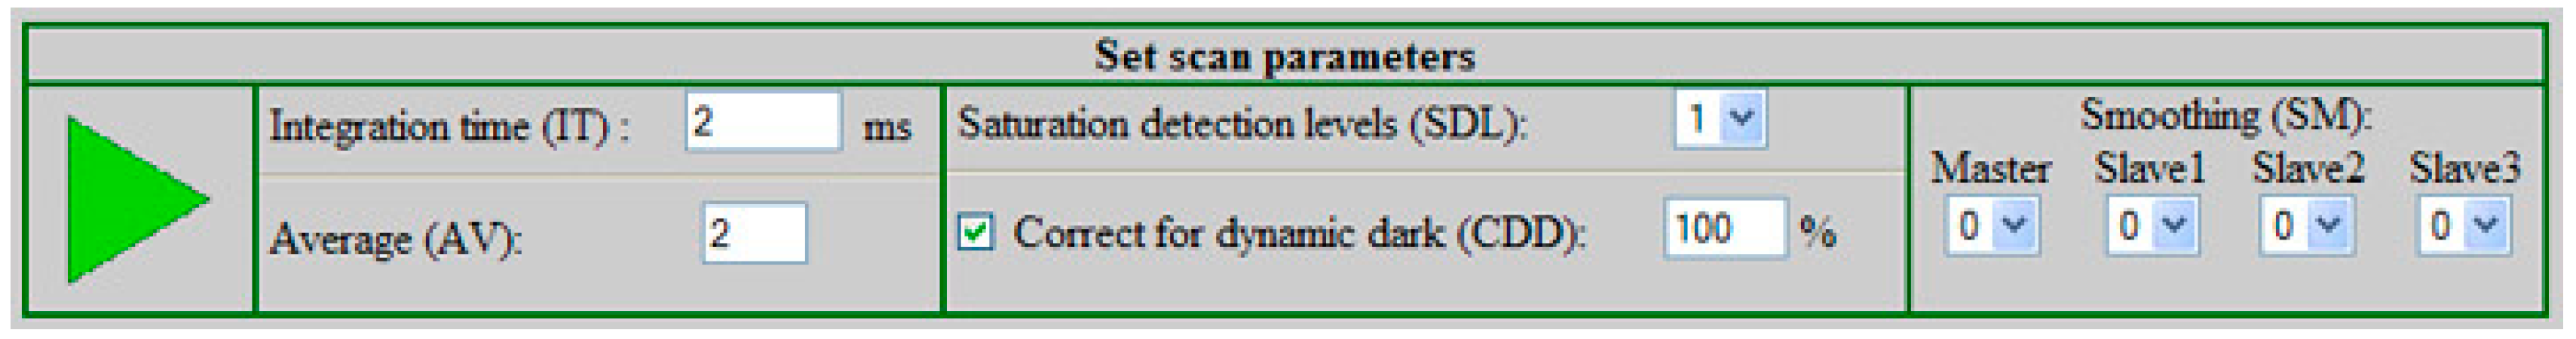
2.3. Remote Educational Experimenting

The remote user interface generated by PHP-scripts (Figure 2) allows the user to set up the key parameters of spectrum registration, i.e., the integration time and the average value; to prescribe the smoothing parameters; and to enable/disable and adjust the ‘Correction for Dynamic Dark’ and ‘Saturation Detection Level’ modes.
The list of remote practical training courses given at RSLPTER begins with a course intended to give students hands on experience in correctly registering a spectrum produced by a given light source, to be used in subsequent lab sessions.

3. RSLPTER Software Upgrade

3.1. Software Modernization

RSLPTER has undergone modernization several times while in operation. The modernization covered both its software suite supporting remote experiments and in-network processing of results, and the lab hardware.

3.2. Modernization Rationale

Training and research lab sessions at PSIP are planned on a simple-to-complex basis. The initial stages of the educational and professional development process are designed to provide introductory training in how to register spectra correctly and use corresponding research techniques, whereas at later stages, the process becomes more shifted towards data online processing and qualitative analysis. At the final experiment stages, the researcher performing a comprehensive spectrum analysis should be able to do automated data processing and generalize results. Because of the limited time available to conduct a remote lab session (around 45 min, including entrance testing, in our laboratory), operations mastered in previous sessions are expected to take much less time to perform, with students becoming more experienced. An example in this area is software, developed to enhance the experiment first stage that previously consisted in a spectrum analysis, performed offline using the Atlas of Spectral Lines (the use of relevant reference materials/tables is discussed in [8], among others). The new software allowed students to determine radiating plasma composition and then obtain plasma properties leveraging on their previous ‘manual’ spectra recognition experience.

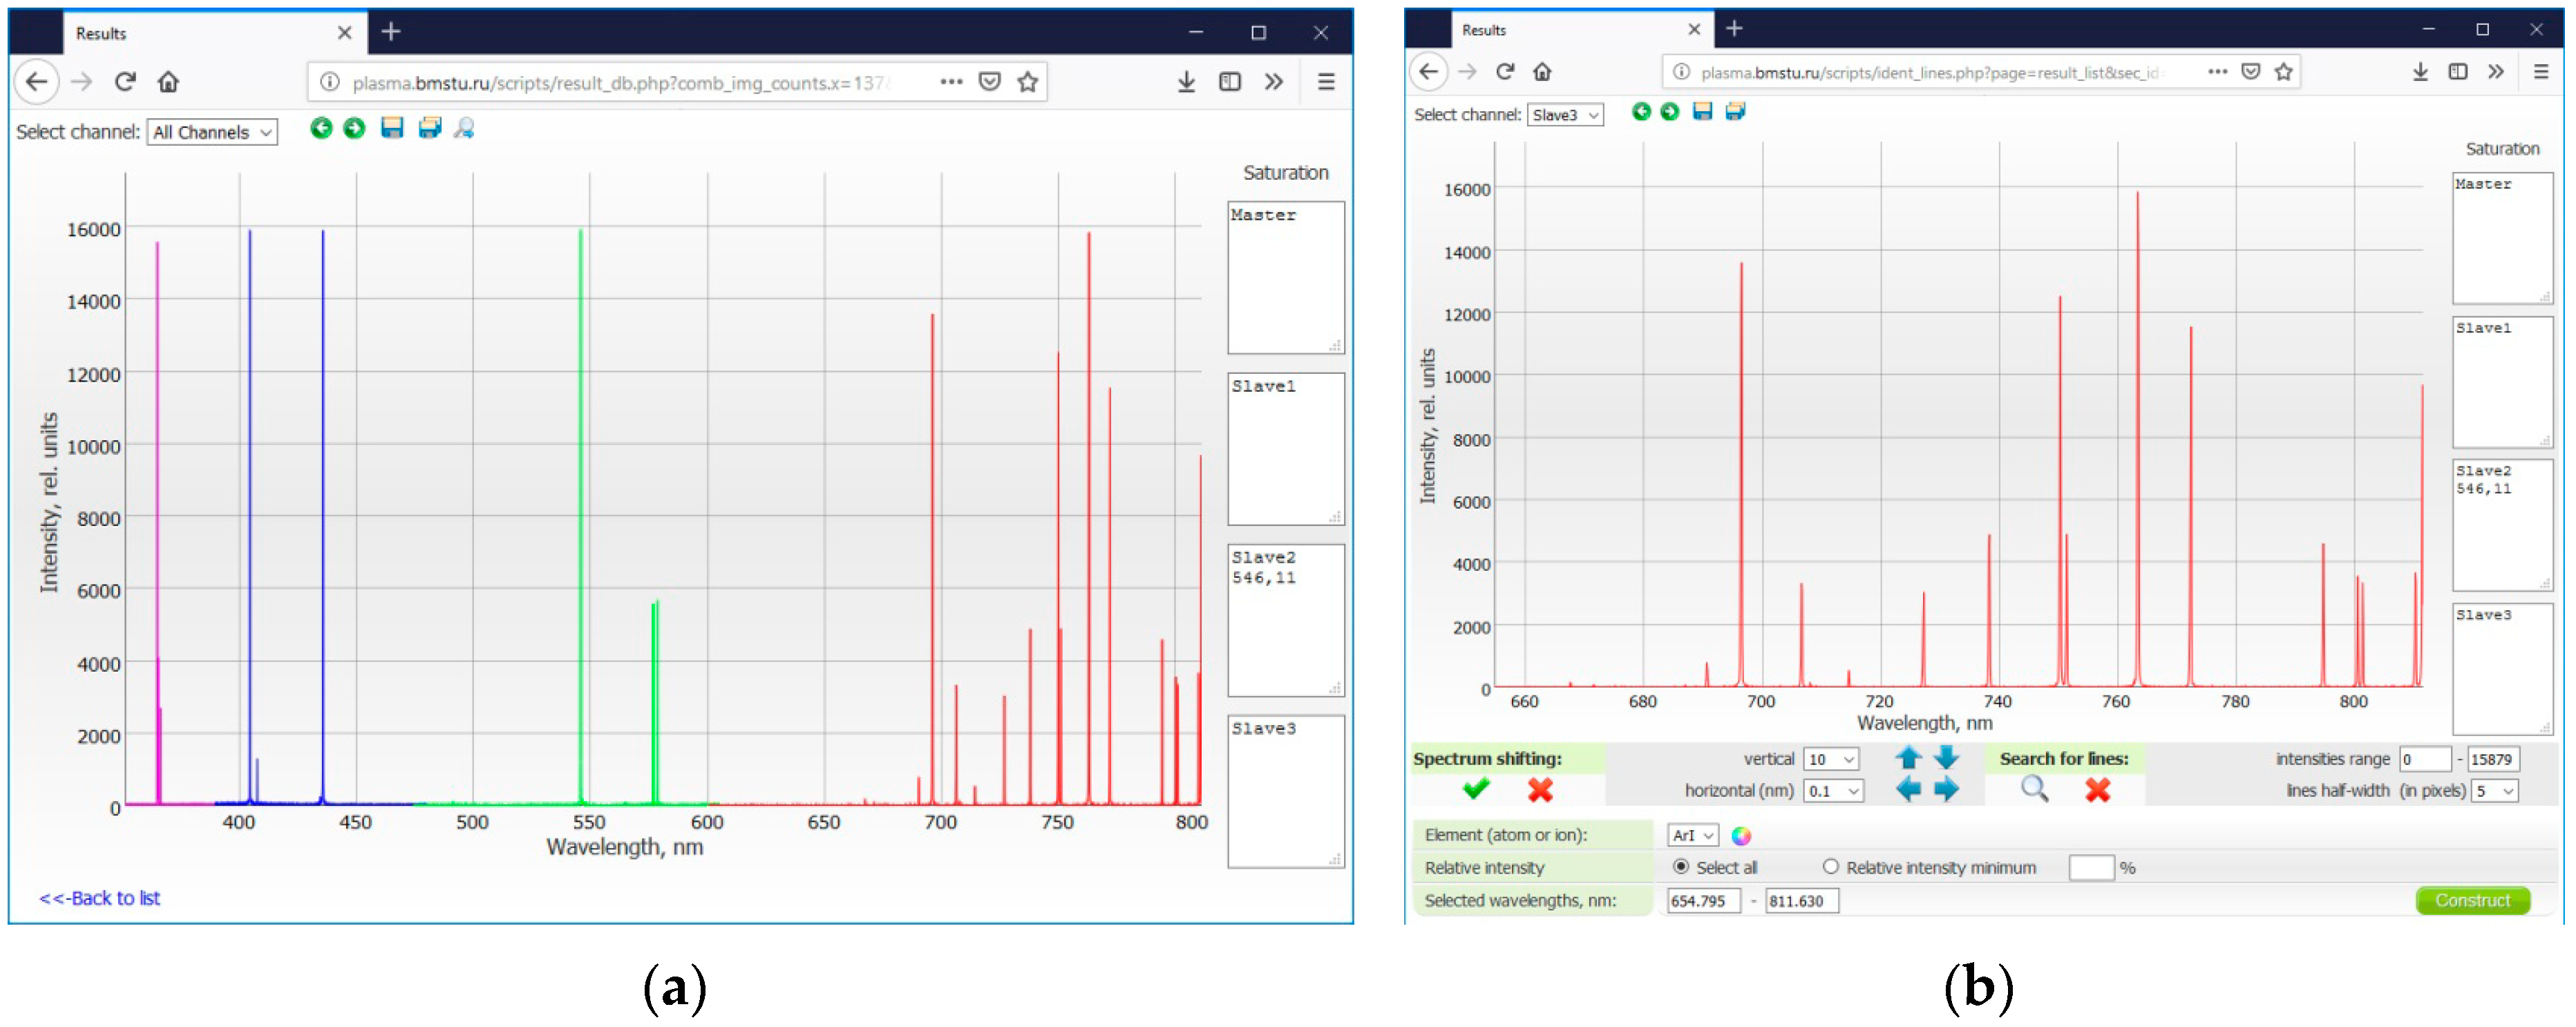
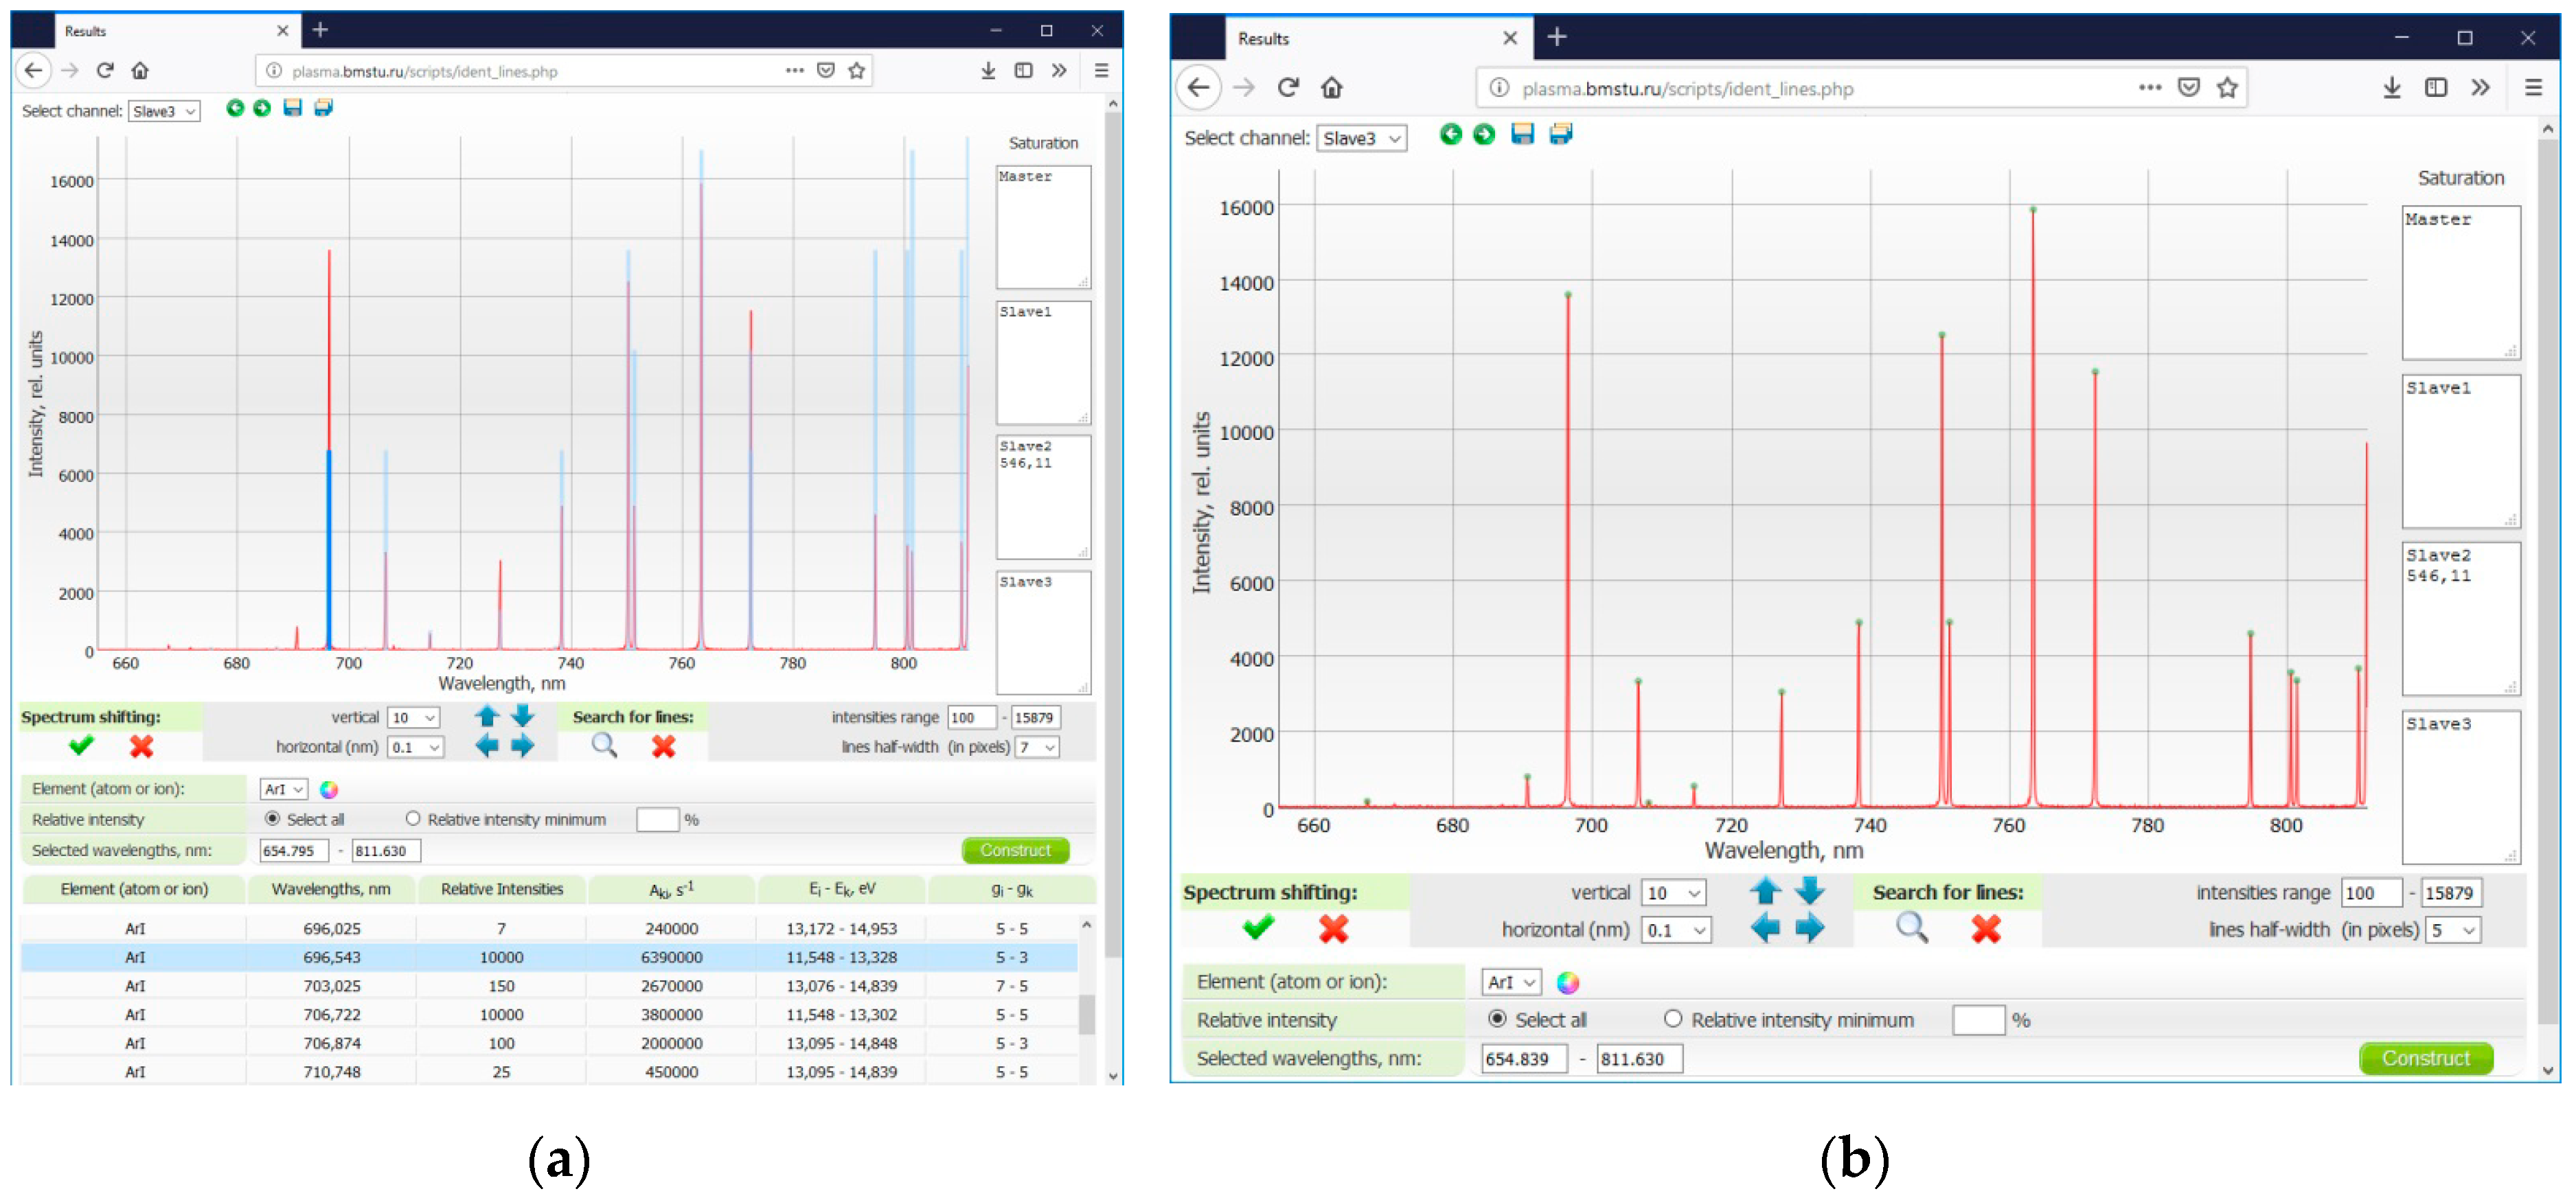
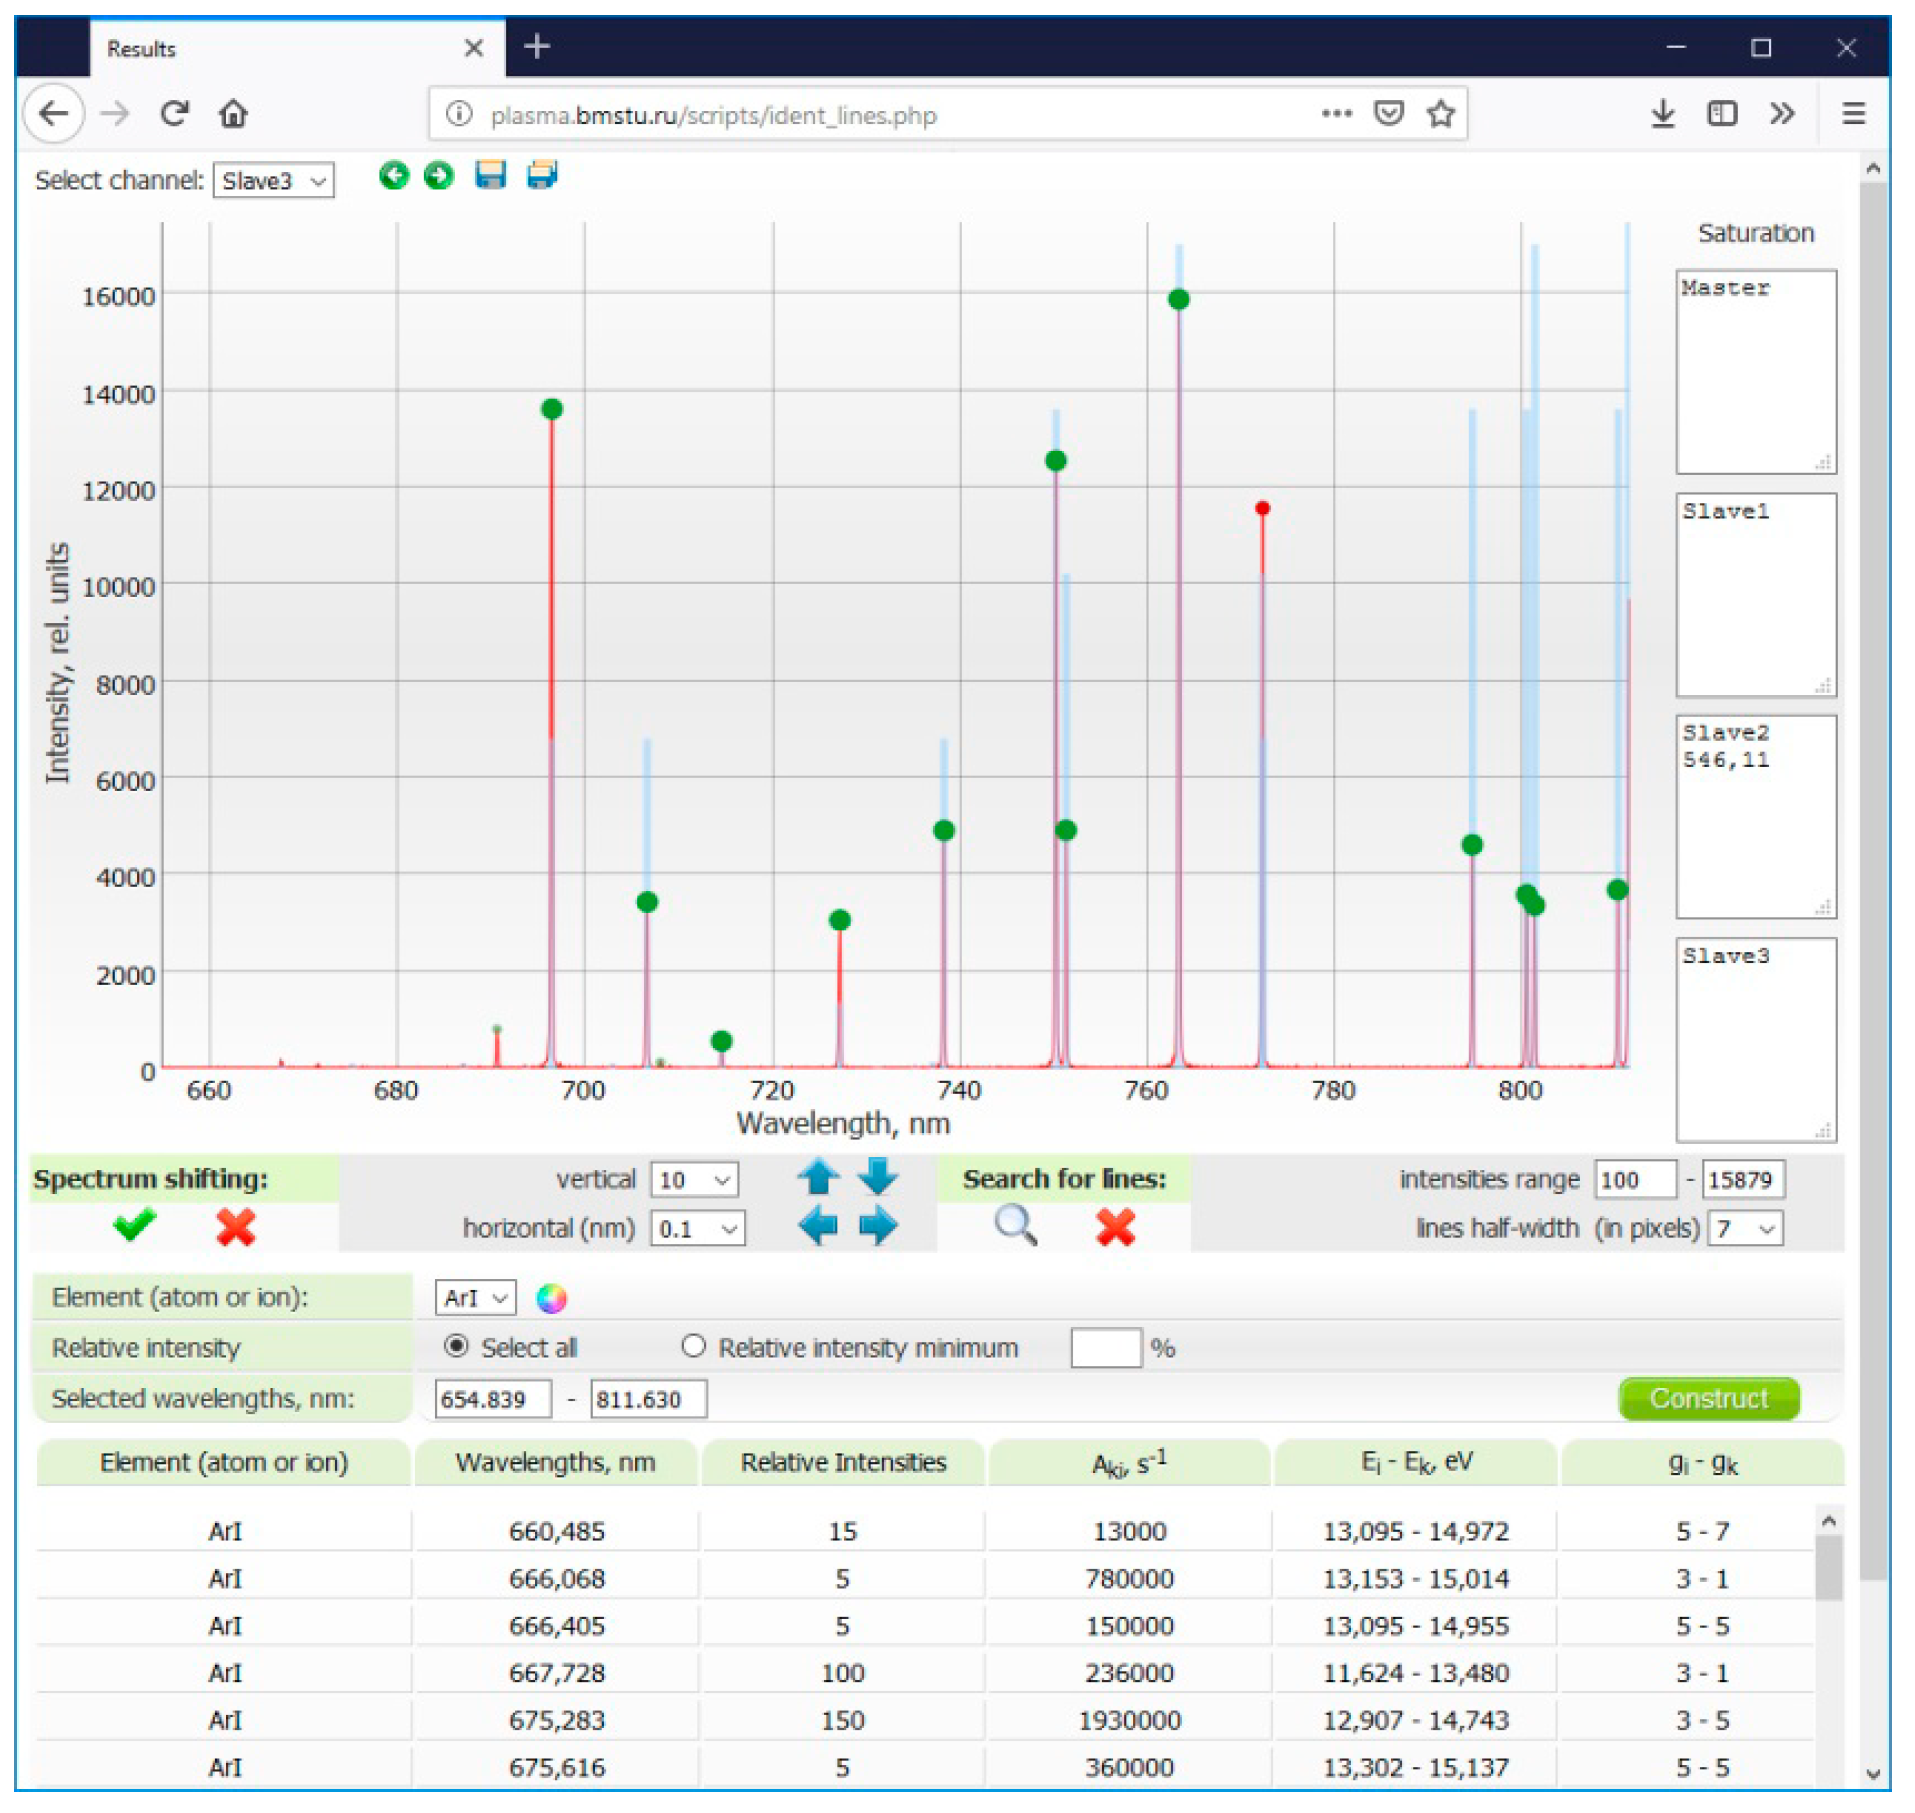
3.3. Automated Spectrum Recognition

The new interface for in-network processing of experimental results helps analyze raw data for the whole range of wavelengths and its parts. This is particularly important in cases where a spectrum has a large number of lines. The interface displays information about saturated spectral lines (i.e., wavelengths at which CCD pixels get exposed to light, and signal intensity is not measured accurately). The first practical training course, ‘Spectrometry Technique and Practical Considerations’ in its early versions, intended only to teach students the technique of mapping a detected spectrum against reference table spectral lines from the Atlas (using the Tables of Spectral Line Intensities, arranged by wavelengths, from the NIST database for line visualization).
More advanced training courses (‘Source Spectrum Qualitative Analysis’ and ‘Plasma Electron Temperature Measurement’) cover the use of plasma spectral diagnostics techniques for determining the elemental composition of a radiation emitting medium and then obtaining the properties of plasma itself. To be admitted to the next practical course, the student must complete the previous one and acquire respective practical skills.
As part of implementation of a web application for remote experimenting, a number of algorithms and corresponding scripts were developed to support the following functions:
  • spectra visualizing and scaling;
  • work with the spectral line database;
  • computerized search for spectral lines by intensity peaks;
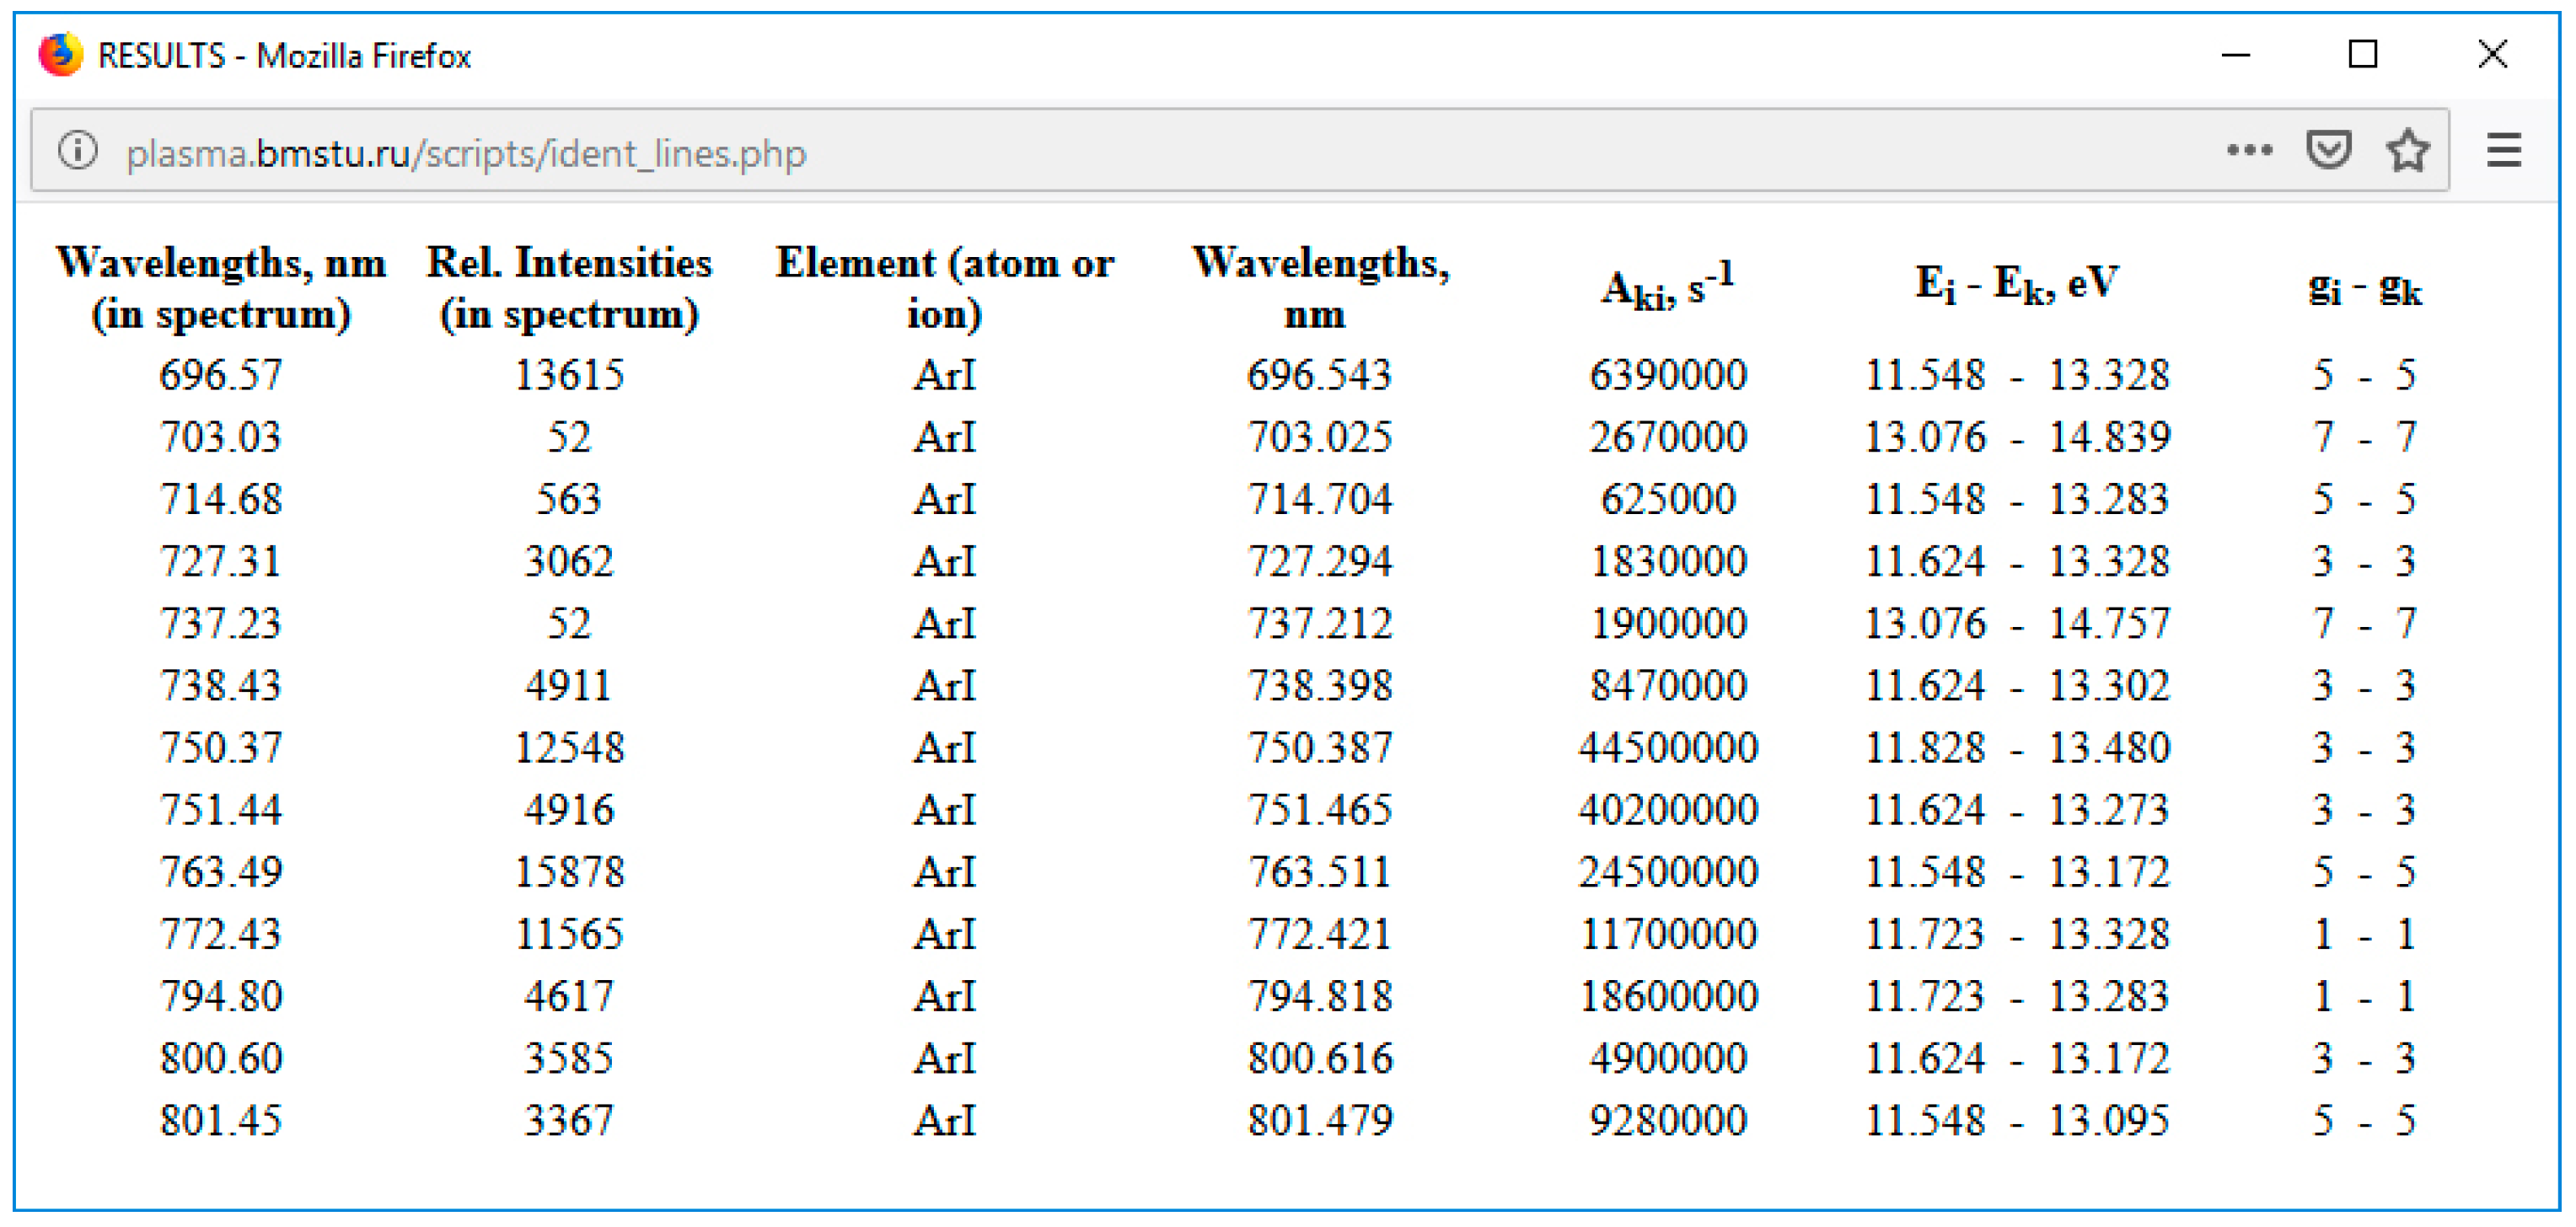
  • spectral line identification against tables of reference wavelengths;
  • output and storage of information about identified spectral lines with corresponding electron transitions and their quantum properties.
Figure 3a shows the web interface for the visualization and storage of the results of a given light source spectrum registration. To use the interface for spectrum processing and analysis one has to click the «Identify Lines» button. Shown in Figure 3b is a web interface designed for the visualization and qualitative analysis of detected spectra. A radiation intensity versus wavelength diagram is displayed at the top of the page. One has the opportunity to process a “full” or composite spectrum detected using optimized spectrometer channel parameters in a previous lab session.
A spectrum scaling option is available for selecting a wavelength range of interest. With Java scripts employed for diagram plotting, there is no need to update the entire HTML page and exchange data with the web server each time one does the scaling.
The web application is then used to retrieve spectral line characteristics from a database. The user locates the required chemical element in the web page respective sections and specifies the wavelength range. In addition, the user can set the lowest table-indicated intensity value, in percent of the peak value. This allows one to disregard weak spectral lines with high quantum numbers, which are not observed in discussed plasma experiments. Thereafter, the user requests a database search for the lines by clicking the ‘Construct’ button.
The table in Figure 4a lists the characteristics of electron transitions. It shows up when the database has spectral lines corresponding to user request. For the convenience of further analysis, the spectral lines of elements selected from the database (viewed as vertical straight lines) are given atop the spectrum obtained in the experiment. When the mouse cursor hovers over a selected spectral line, it becomes highlighted, as does the table row with the quantum characteristics of a corresponding electron transition.
A web application was developed that enables a computer search for intensity peaks corresponding to given spectral lines. Automatically found intensity peaks are shown as small circles in Figure 4b. The list of lines can be corrected by adding/deleting intensity peaks with the mouse buttons. All peaks can be removed from the diagram by pressing the “Delete” button. For spectral lines downloaded from the database, the identification function is enabled automatically after the completion of the intensity peak search. The wavelength of each intensity peak is compared against a reference tabular value.
If the difference between wavelengths is less than the spectrometer’s optical resolution, a line is considered identified and associated with a corresponding electron transition and its quantum properties. Shown in Figure 5 is a spectral region with identified lines (marked with big green circles).
If a line in a spectrum of interest corresponds to several spectral lines of elements selected from the database, it is considered to be overlapped and is marked with a red circle. The table in Figure 6 shows the results of spectrum identification, including a list of identified lines.
As one can see, the developed web application enables a rapid online search and identification of spectral lines. Its interface can represent an experimentally obtained spectrum superimposed by tabular lines, characteristic of chemical elements with wavelengths falling into a specified range. Such a visualization is particularly helpful for the qualitative analysis of complex spectra that contain lines characteristic of different elements. The list of identified lines with electron transition characteristics, obtained in a lab session, can be used later to determine plasma electron temperature, which actually comprises the main subject of the third practical training course in plasma spectroscopy.
In the future, the list of objects to study will be extended to include discharges producing molecular spectra. Then, a relevant database will include the tables and the atlas of hydrogen isotopes’ spectral molecular bands.

4. RSLPTER Hardware Modernization

Undergraduate research is a critical component of the educational experience, and its quality reflects the level and effectiveness of a physical engineering education. To enhance undergraduate research in the area of plasma spectroscopy at BMSTU, the RSLPTER research capability was expanded, and new study opportunities were made available to both students and scientific staff. In particular, remote researchers are now able to vary the operating parameters of investigated radiation sources used for a plasma-based deposition of coatings and films (e.g., magnetron sputtering systems).

4.1. Research Potential Expansion Through Hardware Modernization

The RSLPTER ‘research’ department offers the opportunity to study and remotely correct the operating parameters of subsystems that support plasma devices. This makes the RSLPTER equipment unique and state-of-the-art experimental methodologies available to both students and scientific staff. The minimum set of parameters used in education experiment scenarios and the limits to which they may be stretched in research experiments have both been extended. This required higher standards of technology protection against potential remote misuse.
Senior year students, as well as engineers and scientific staff can control the operation of plasma devices individually and in research, experimentally, the generation and acceleration of particles in a magnetron discharge that may occur in a wide pressure range in practically any plasma-generating gas. Figure 7 shows the demo-version of an interface intended for users engaged in education and research experiments in plasma nanotechnologies [9].
In contrast to the RSLPTER ‘educational’ component, the ‘research’ department used not only spectral diagnostics equipment (represented by a vacuum radiation receiver two-coordinate system), but also a vacuum chamber dynamic pumping unit.
The new remote-control system enables the spatial distribution of plasma parameters to be examined, and a plasma-generating gas composition and pressure to be measured. Obtained data allows changes to be made in the flow and the power spectrum of particles depositing on a substrate. Special web applications were developed to control the plasma-generating gas flow and the two-coordinate movement of the optical head [3,9].
A web-based experiment is performed using a remote-control interface, which is also generated with PHP-scripts in the form of a HTML page. During the experiment, the user sets the parameters of a discharge and a spectrum registration system, which are subject to verification for practicability and implementation safety.

4.2. Remote Control Modernization and Teaching Staff Capability Enhancement

Among other things, the RSLPTER modernization included some improvements in the interoperability of the lab segments and changes in the role of a tutor conducting a remote session. Figure 8 shows the improved lab flowchart [10].
Unlike in the RSLPTER initial setup, where a source under study was turned on/off manually by experiment operator, the modernized lab allows this to be done remotely using the Cloogy kit based on the ZigBee wireless technology. A tutor’s modernized personal cabinet, additionally fitted with a source online switch button, is shown in Figure 9. We note that the tutor can turn the source on/off from any gadget with either iOS, or Android or Windows using respective Cloogy apps.
The above improvements will also be implemented in the RSLPTER ‘research’ department, which currently focuses on stationary and non-stationary toroidal plasma formations occurring in molecular media (e.g., hydrogen isotopes and air). In addition, the lab will be re-equipped with new hardware (including an additional spectral device) to enhance its investigation capability.

5. Conclusions

A plasma spectral diagnostics web-based laboratory (Remote Spectroscopy Laboratory for Practical Training and Experimental Research) was set up at BMSTU as a result of arrangements that opened up a network access to sophisticated and unique equipment and is continuously improving. Remote practical sessions using RSLPTER functionality have been included for some years in the education curricula of a number of Russian universities. Both the hardware and software laboratory components have been thoroughly upgraded in the past few years.
One of the modernization outcomes was the creation of the Remote Plasma Nanotechnology Laboratory for Experimental Research and Practical Training that enables the spatial distribution of plasma parameters to be examined, and the operation of plasma devices to be enhanced.
The laboratory can be accessed from both inside and outside of Russia using state-of-the-art Internet technologies and remote access supporting hardware. A dispatch-and-information system has been developed to help remote experimenters generate and implement their own experiment scenarios using technologies that enable remote user registration and processing of raw experimental data.
Tutorials for users engaging in practical training courses have been developed, which present the training and testing subsystems, as well as the computerized system providing access to lab equipment and enabling the collection and processing of experimental results. The laboratory allows for holding group sessions (workshops) under a tutor’s supervision.
In the future, the list of objects to study will be extended to include discharges of different types including ones producing molecular spectra. Then, a relevant database will include the tables and the atlas of hydrogen isotopes’ spectral molecular bands.

Author Contributions

The contributions from each author of this article can be defined as follows: conceptualization, A.Z. and A.S.; methodology, A.Z. and A.S.; software, A.S. and V.T.; validation, V.T. and I.Z.; resources, I.Z.; writing—original draft preparation, A.Z. and I.Z.; writing—review and editing, A.Z. and I.Z.; visualization, V.T.; project administration, A.S. All authors have read and agreed to the published version of the manuscript.

Funding

This work was funded by the Russian Foundation for Basic Research (RFBR) as part of Research Project No. 18-29-21039.

Conflicts of Interest

The authors declare no conflict of interest.

References

  1. Arodzero, A. World Wide Student Laboratory Project. e-Print Arch. arXiv 1995, 8. [Google Scholar]
  2. Gomes, L.; Bogosyan, S. Current Trends in Remote Laboratories. IEEE Trans. Ind. Electron. 2009, 56, 4744–4756. [Google Scholar] [CrossRef]
  3. Restivo, M.T.; Cardoso, A.; Lopes, A.M. Online Experimentation: Emerging Technologies and IoT; International Frequency Sensor Association Publishing: Barcelona, Spain, 2015; p. 496. [Google Scholar]
  4. Zimin, A.M.; Averchenko, V.A.; Labzov, S.Y.; Perfiliev, A.L.; Fedyaev, A.V.; Shumov, A.V. Remote laboratory work on spectral plasma diagnostics. Inf. Technol. 2002, 3, 37–42. (In Russian) [Google Scholar]
  5. Zimin, A.M. The Development of Remote Access Computer-Aided Laboratories and their Use at Technical Universities. In Proceedings of the 2007 International Conference on Engineering Education (ICEE’07), Coimbra, Portugal, 3–7 September 2007; p. 504. [Google Scholar]
  6. Krivitskiy, S.E.; Romadanov, I.V.; Shumov, A.V.; Zimin, A.M. Integration of Basic Sciences and Engineering: from Optics and Quantum Physics to Spectral Plasma Diagnostics. In Proceedings of the 2008 International Conference on Engineering Education (ICEE’08), Pecs, Hungary, 28–31 July 2008; pp. 13–109. [Google Scholar]
  7. Shumov, A.V.; Troynov, V.I.; Zimin, A.M. Dispatch and Information System for Control and Keeping Records of Remote Laboratory Experiments. In Proceedings of the 2015 3rd Experiment@ International Conference: Online Experimentation (exp.at’15), Ponta Delgada, Portugal, 2–4 June 2015; pp. 187–190. [Google Scholar]
  8. Zimin, A.; Shumov, A.; Krivitskiy, S.; Troynov, V. The Remote Plasma Nanotechnologies Laboratory for Experimental Research and Practical Training. In Proceedings of the 2013 2nd Experiment@ International Conference “Online Experimentation, Coimbra, Portugal, 18–20 September 2013; pp. 118–121. [Google Scholar]
  9. Sansonetti, J.E.; Martin, W.C. Handbook of Basic Atomic Spectroscopic Data. J. Phys. Chem. Ref. Data 2005, 34, 1559–2259. [Google Scholar] [CrossRef] [Green Version]
  10. Zimin, A.; Troynov, V.; Zemtsov, I. Upgraded Plasma Spectroscopy Internet Laboratory. In Proceedings of the 2019 5th Experiment@ International Conference: Online Experimentation (exp.at’19), Funchal, Portugal, 12–14 June 2019; pp. 204–207. [Google Scholar]
Figure 1. Some pages of the Remote Spectroscopy Laboratory for Practical Training and Experimental Research (RSLPTER) website: Description of the lab equipment (a); a parameter change (b).
Information 11 00009 g001
Figure 2. The spectrometer remote control interface.
Information 11 00009 g002
Figure 3. Web interface for the visualization and storage of results (a) and for spectra remote processing and qualitative analysis (b).
Information 11 00009 g003
Figure 4. Experimentally obtained spectrum with rotational lines from the deuterium molecule electronic vibrational-rotational transitions database (a) and the result of computer search for intensity peaks in this spectrum (b).
Information 11 00009 g004
Figure 5. Identification of spectral lines.
Information 11 00009 g005
Figure 6. List of identified lines.
Information 11 00009 g006
Figure 7. Web page of the research and practical training laboratory.
Information 11 00009 g007
Figure 8. Modernized RSLPTER experiment flowchart.
Information 11 00009 g008
Figure 9. The tutor’s personal cabinet in the modernized RSLPTER.
Information 11 00009 g009

