Teaching Software Engineering Topics Through Pedagogical Game Design Patterns: An Empirical Study


1
Faculty of Engineering, University of Porto, 4200-465 Porto, Portugal
2
INESC-TEC, 4200-465 Porto, Portugal
*
Author to whom correspondence should be addressed.
†
Current address: Rua Dr. Roberto Frias, s/n 4200-465 Porto Portugal.
Information 2020, 11(3), 153; https://doi.org/10.3390/info11030153
Submission received: 30 January 2020
/
Revised: 5 March 2020
/
Accepted: 9 March 2020
/
Published: 12 March 2020
(This article belongs to the Special Issue Advances in Mobile Gaming and Games-based Leaning)
Abstract
:Teaching software engineering in its many different forms using traditional teaching methods is difficult. Serious games can help overcome these challenges because they allow real situations to be simulated. However, the development of serious games is not easy and, although there are good practices for relating game design patterns to teaching techniques, there is no methodology to support its use in a specific context such as software engineering. This article presents a case study to validate a methodology that links the Learning and Teaching Functions (LTF) to the Game Design Patterns (PIB) in the context of Software Engineering Education. A serious game was developed from scratch using this methodology to teach software estimation (a specific topic of software engineering). An experiment was carried out to validate the effectiveness of the game by comparing the results of two different groups of students. The results indicate that the methodology can help to develop effective educational games on specific learning topics.
1. Introduction
Software Engineering (SE) is a discipline concerned with all aspects of software production, from the early stages of the system specification to post-delivery maintenance [1]. Its scope is so broad that the IEEE has proposed an organisational structure (known as Swebok [2]), where it is possible to find all the necessary skills that a proficient software engineer must master, for example, requirements, design, testing, management, process and so on.
Using traditional teaching methods in this diverse and extensive context may not be the best way to train professionals capable of assuming positions of responsibility in organisations. In existing learning and teaching techniques, suitable for learning SE [3,4,5,6] topics and concepts, serious games are one of these techniques.
The use of serious games can help improve the capture and understanding of SE knowledge. However, the design of such games tends to be complex, preventing their use on a larger scale [7]. Designing a successful entertainment game does not always mean an effective and appropriate educational game, geared towards specific learning objectives. When it comes to learning SE topics, designing these games is not a trivial task.
Estimating the software design effort is an important topic to be mastered by a software engineer. Most project surpluses are caused by a bad estimate [8], which increases the risk of project failure. With the growing adherence to more agile and iterative development processes, estimation becomes an increasingly recurrent task, increasing its potential impact on project management. Therefore, it is very relevant to educate future software engineering professionals on this topic, addressed in a context of (agile) software development process.
This article presents a serious game for learning software estimation. It was developed from scratch and following a proposed approach to design serious games for software engineering education. This approach (already published [9]) is based on a three-step process, that relies on capturing the specific learning needs (on the SE topic), converting those into (game) design patterns, and, afterwards, using them to design the game.
Validation was conducted through an empirical experiment with software engineering students, aimed at (1) analysing the game’s reliability (i.e., could the game be able to teach a selected software engineering concept in a repeatable fashion) and (2) analysing the game’s effectiveness (i.e., how effectively does it improve knowledge intake).
This article is structured as follows: the next section presents related work. The three-steps approach followed to develop the game is presented in Section 3. Section 5 describes the developed game in detail. The experiment performed with two groups of students and the results achieved are described in Section 6. Finally, conclusions are drawn, and future work is presented.
2. Software Engineering Education and Serious Games
Becoming proficient in Software Engineering is not trivial. According to [10], a software engineer must learn theoretical foundations, process management, and the psychology of interacting with other people. These topics should not be learned in one single way.
There is a need to change the traditional way of teaching, from a more lecture-like format, to team projects, problem-solving, direct involvement with real development, and other formats that require students to exercise and practice the ideas they are learning [11].
Pursuing this line of thinking, Li and Wang [12] proposed a reform method for teaching software engineering where they defend, among others, “transforming a research project into a student project.” This reform highlights the need for real-life projects and points out several difficulties in its implementation: (1) aligning time of the organisation owning the project with the academia; adjusting the complexity of the project; (2) software and hardware requirements may not be available at the university; and (3) difficulty to arrange meetings which can hinder the progress of the project. In general, the teaching of different contents, of different natures, in different ways, and real situations represents a significant challenge in Software Engineering Education (SEE).
For some time now, game-based learning has been seen as a feasible approach to overcome these challenges [13]. These educational games engage the learner in a series of triggered cognitive processes that have proven to be beneficial for learning, while allowing a high focus of attention, fostering the desirable experience of “flow.” Additionally, these games allow for a more self-paced, self-governed type of learning, in which positive experience overcomes barriers such as loss of attention, the frustration of not understanding concepts, demotivation, and lack of guidance. On a broader scope, these games are regarded as a subclass of serious games [14], a concept of training for the serious application of knowledge in reality, without exposing the learners to critical risks or as means to overcome the difficulty of setting up the training scenarios in real life [15].
Browsing the literature, it can be seen that an effort has already been made to produce serious games for learning about software engineering topics, focusing mainly on software project management (e.g., SimSE [16], SE RPG [17], PlayScrum [18], SESAM [19], AMEISE [20], Sim JavaSP [21], SimSoft [22], XMED [23], Problems and Programmers [24], DELIVER [25], ProDec [26]) and software testing (e.g., U-Test [27], iTest Learning [28], iLearnTest [29]). Nevertheless, these are, somewhat, isolated attempts to cope with the challenges behind teaching SE topics. As far as one can tell, these games are concerned with specific teaching goals, yet they do not propose a methodology for game design that can be reused in the development of new games to teach software engineering subjects. Scaling the use of Serious Games into a more adoptable solution lacks a common ground for the development of such type of games, which are, by definition, complex to design [7].
As such, defining an approach to help game designers and teachers to develop serious games, that can cover the aimed learning and teaching functions for a specific context becomes a necessity. In [9], the authors presented a methodology for game design that starts by defining the learning and teaching functions for a specific domain and then, from those, identifies which techniques (design patterns) may be used to design the game. With the validation performed and described in this paper, the authors hope to contribute to the establishment of a basis for designing serious games for software engineering education.
3. The ABC Triangle for Game-Based Software Engineering Education
For an educational game to be effective, it must make sure it promotes learning (“educational”) and it is fun to play (“game”). Providing a methodological scaffold for developing these games arose when reading the work by Kelle [30], where the gap between the learning needs and game design was bridged by converting learning and teaching functions (LTFs) to game design patterns (GDPs). This provided a starting point for the approach [9], which is briefly explained in this section.
3.1. Concepts and Process
Learning functions (LF) regard the learner’s point of view on how to link new information to prior knowledge, how to organise information, and how to acquire cognitive and meta-cognitive knowledge [31]. A teaching function (TF) defines the teacher’s goal as ensuring the learner has the proper equipment (i.e., using the proper learning functions) to engage with the learning material in a meaningful way. Thus, an important teacher’s function is to identify and thoroughly analyse those functions executed by learners when they try to make sense of and learn from teaching and to assist learners in acquiring and executing these functions.
Grosser [31], based on the work of Shuell and Muran [32], created a list of 22 learning and teaching functions that makes up all the pedagogical scope. Grosser regrouped those functions in 5 groups regarding their different types: Preparation, Knowledge Manipulation, Higher Order Relationships, Learner Regulation and Productive Actions. As an example, for the learning function “Expectations” (under the “Preparation” category), its teaching function is “Learners need to have a general idea of what is to be accomplished from the learning task. Providing an overview of the learner identifying the purpose of a lesson are ways in which expectations can be initiated”. Another example might be “Interpreting” (under the “Higher Order Relationships” category), for which its corresponding teaching function is “Assisting learners in converting information from one form of representation to another”.
Design patterns are reusable, good solutions for recurring problems within a specific context [33,34]. Bjork and Holopainen [35] developed a collection of 296 design patterns relevant to games, most specifically, design of games. These patterns are divided into 11 categories, regarding four different views on games: holistic, boundaries, time, and structure of the game.
Having a connection between Grosser’s LTFs and Bjork and Holopainen’s GDPs (Kelle’s work [30]), the process would resort to identifying what were the specific LTFs for Software Engineering topics, and then converting them into GDPs, thus providing a scaffold for designing an effective educational game for Software Engineering Education.
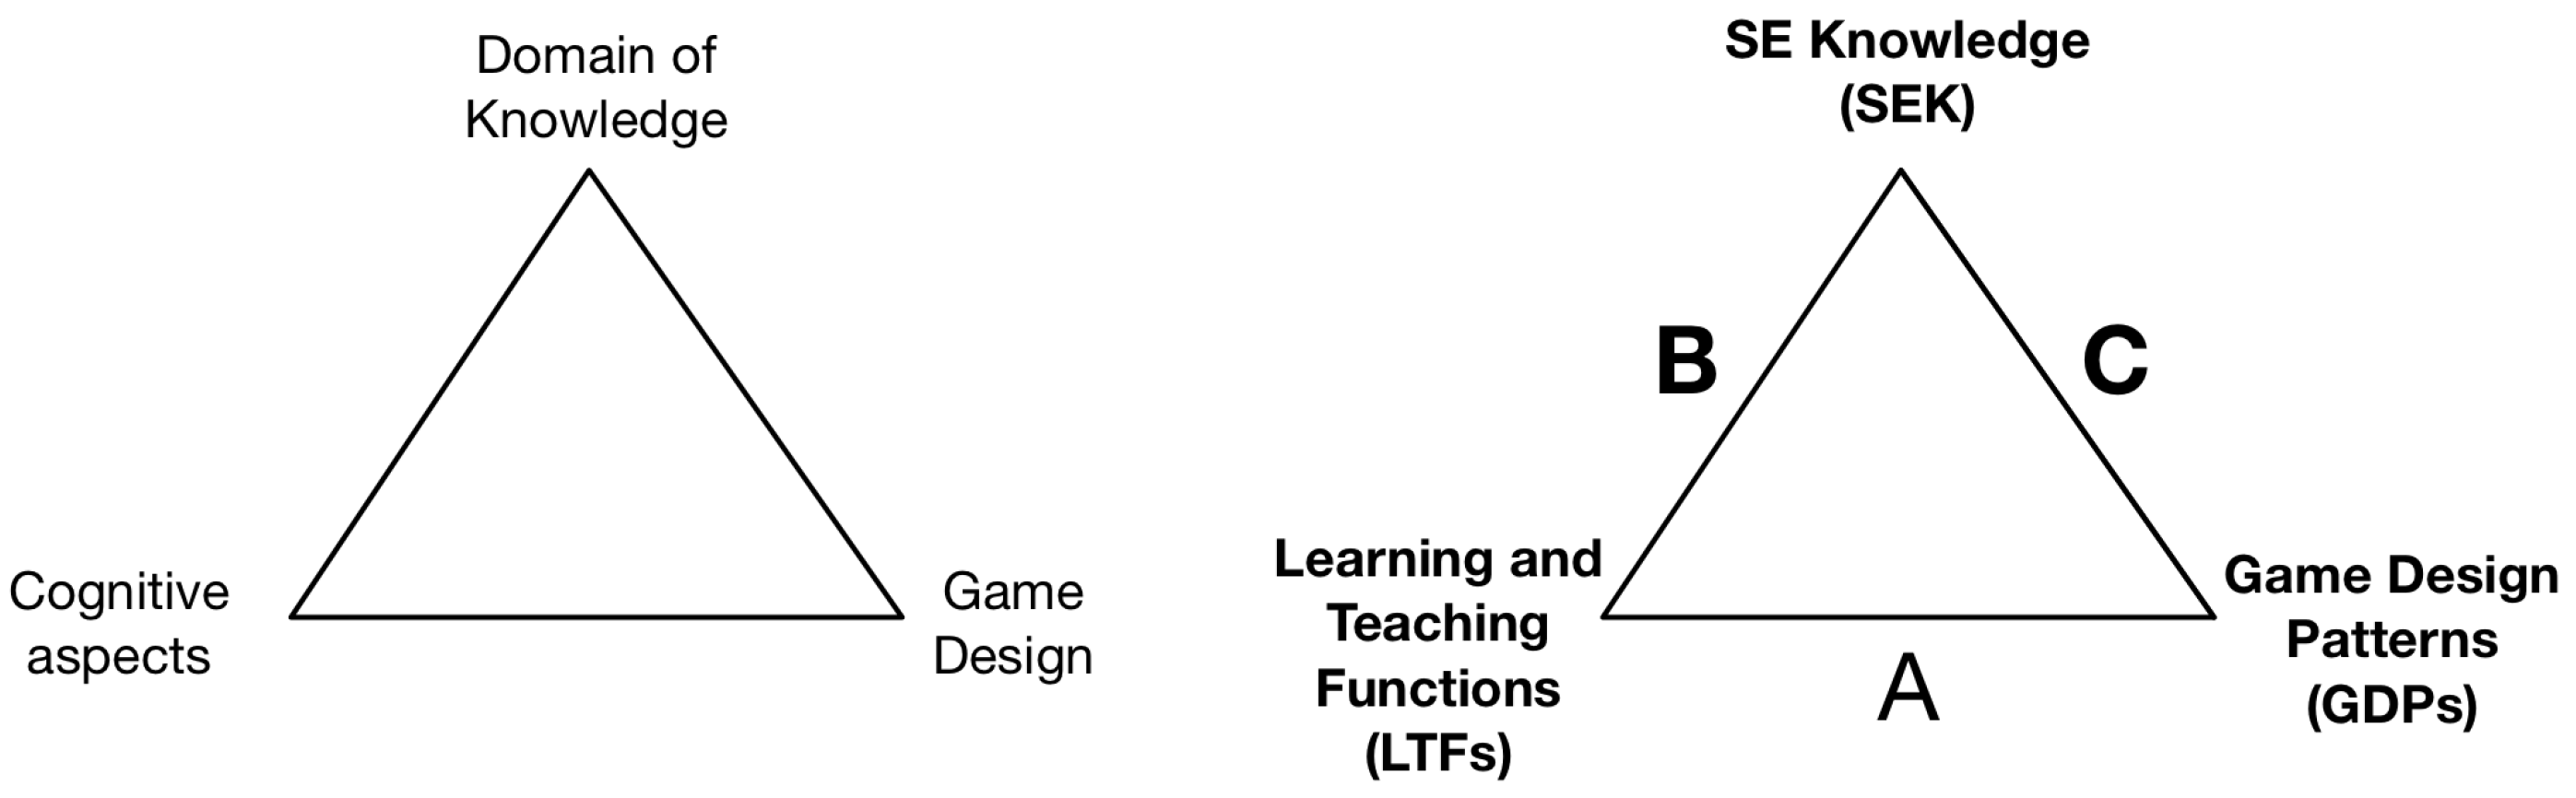
As such, the proposed approach follows a three-step process [9], linking all the concepts mentioned above (Figure 1):
- edge A. The first step is to identify the relationship between game design patterns and teaching and learning functions (already done by Kelle [30]).
- edge B The second step is to establish a mapping between learning and teaching functions and SE knowledge (SEK). This is done by resorting to surveys and inquiries at SE educational specialists and professionals.
- edge C. The third step is enabled by joining the previous two (A + B) whose outcome provides a specific sub-set of GDPs aimed at a SEK education.
As already stated, the scope of Software Engineering is quite broad; thus, it would not be feasible to handle the entire range of topics in one shot. Therefore, the authors divided the scope into sub-topics, as means to progressively and incrementally build up the game design patterns sub-set. The work presented in this paper is one of those iterations, aiming at validating the effectiveness of the design patterns of a specific topic of SE.
3.2. Consolidation of Intermediate Results
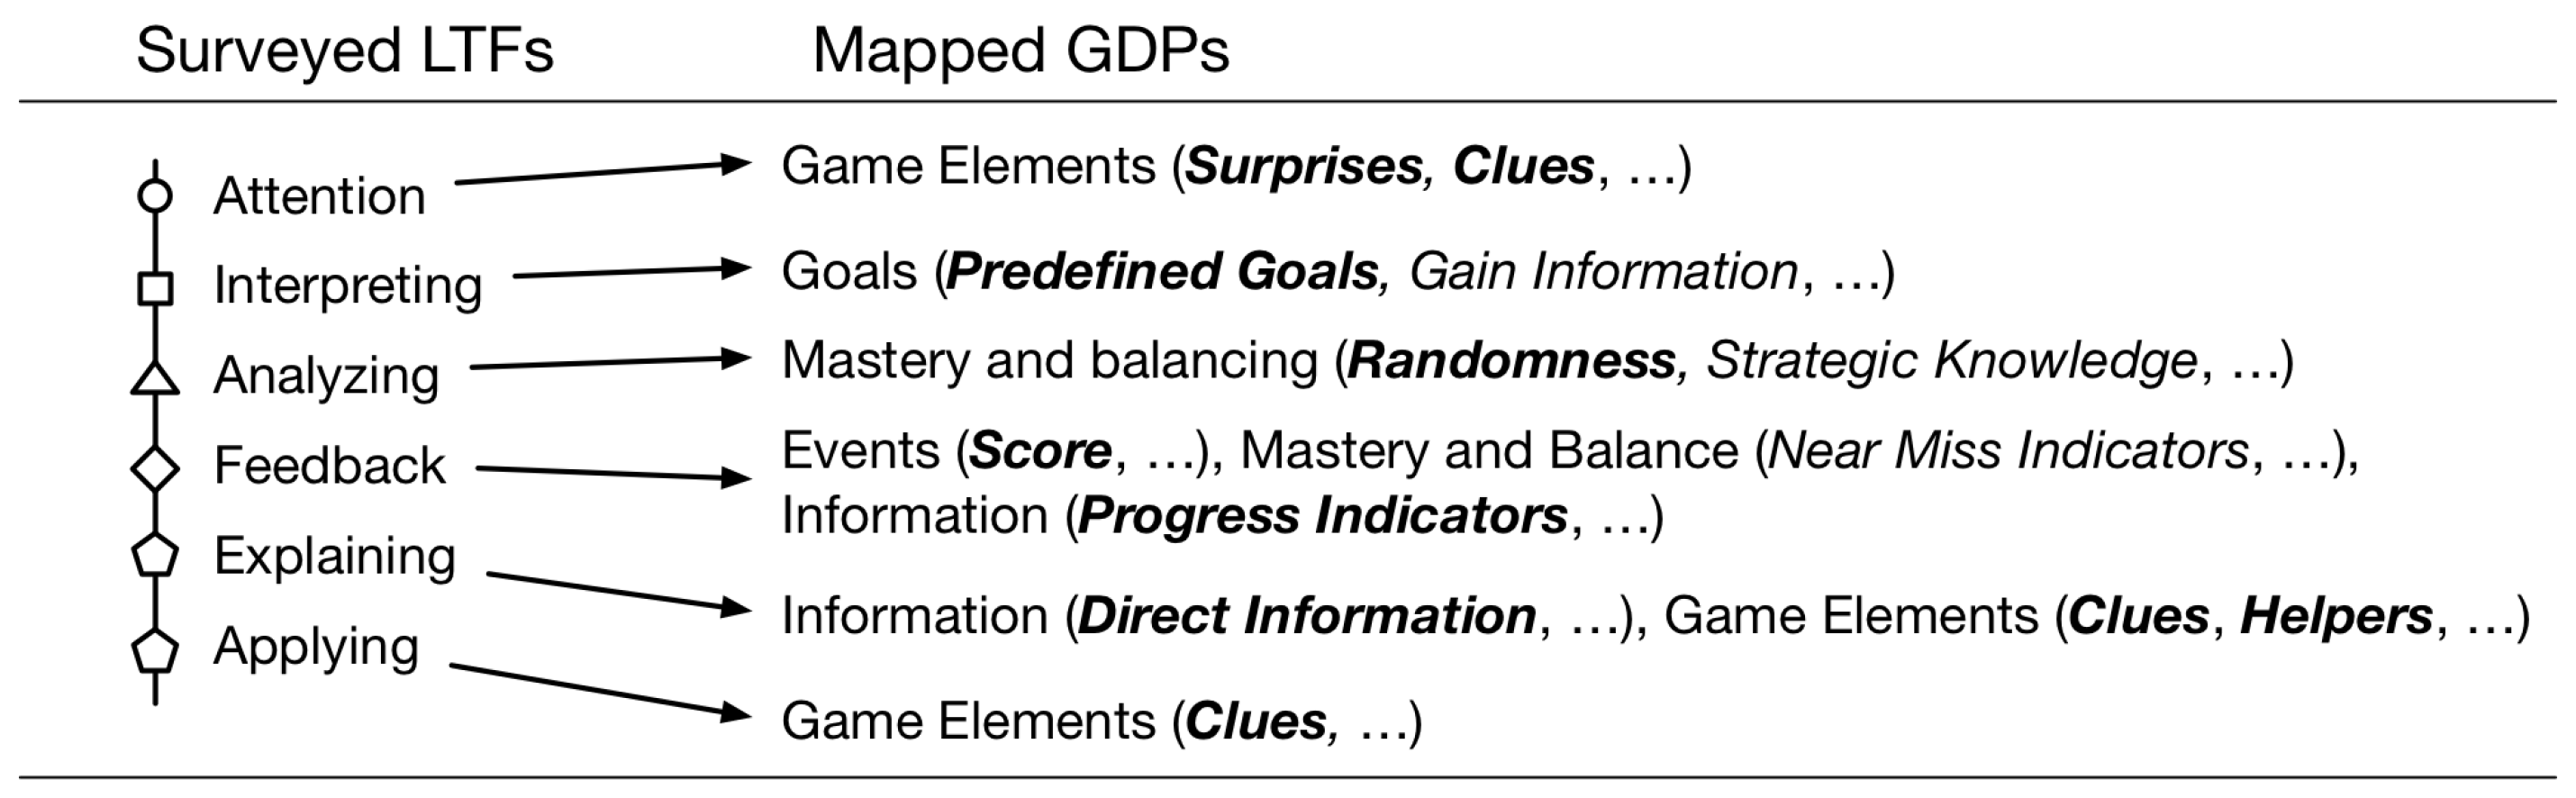
Previous work from the authors [9,36], has resulted in a sub-set of LTFs and their corresponding GDPs, while analysing the SE Project Management sub-topic (Figure 2). This sub-set was validated by performing a case study of existing educational games on the topic (e.g., SimSE [16]).
But to test the approach, an educational game needed to be designed and developed from scratch. The targeted learning topic had to remain within the same scope as before.
One of the most common activities in Software project management is Estimation. Confronted with a series of requirements, translated into a list of prioritised tasks, the development team needs to estimate the cost/effort of a specific task.
Estimation is performed within the group of developers and relies on the experience of the entire team. One such process of estimation is called “Planning Poker”. Its mechanics resemble a card game: Each player has four cards, numbered 1, 2, 4, and 8. These values refer to “story points” and measure cost/effort. At each turn, a task (or “user story”) is presented to the team. Then, each member appraises its cost/effort according to the scale the cards allow. Usually, the Product Owner—the actual stakeholder for whom the system is valuable, and that has the specifications and requirements the system needs to have—is available to clarify any issue regarding the effective outcome of the task. Then, at the same time, the players “show” the card each selected and consensus is reached through discussion. Commonly, the players that deviated the most from the average value justify their option and try to convince (or not) the others of why they’ve played that card.
Although not being difficult to practice this concept during traditional, “face-to-face” classes, on a remote, virtual, e-learning kind of environment, practising this concept would be highly difficult. As such, choosing “Planning Poker” as the Software Engineering topic for developing a Serious Game proved useful in a two-fold manner: (1) It facilitated the design of the Serious Game, as “Planning Poker” is, in itself, a game and (2) posed as a suitable subject for applying Game Design patterns into its conception, as means to validate prior research results.
3.3. Research Methodology
Considering the above, the research method selected to consolidate our initial findings was a hybrid methodology consisting on Design Research [37] (of an educational game using specific design patterns) and a Controlled Experiment [38].
The design research aimed at developing an educational game that would allow exposing students to Software Estimation challenges. The game was built using a typical game design process [39], enhanced by the use of specific game design patterns (as proposed in [9]), and described in Section 3), together with an agile software development process (i.e., SCRUM [40]) to actually implement the game. Section 4 details this further.
The controlled experiment aimed at investigating a testable hypothesis (i.e., Can a game provide a fun and effective way of learning about software estimation?), where one or more independent variables are manipulated (i.e., having the game vs not having the game) to measure their effect on one or more dependent variables (i.e., knowledge intake and fun). Each combination of values of the independent variables is a treatment. Most software engineering experiments require human subjects (i.e., students) to perform some task, where the effect of the treatments is measured on the subjects. Section 5 will provide further details.
4. EEEE—Expert and Efficient Estimators Enterprise
The developed Serious Game is called “EEEE—Expert and Efficient Estimators Enterprise” (referred to as “E4”, henceforth). Its primary learning objectives intended to cover the following topics:
- Software Estimation: definition, purpose, advantages and more generic concepts, such as sprints and user stories.
- Planning Poker: roles, mechanics and outcomes.
- SCRUM —an agile methodology for software development [40]: general concepts about the process, its phases and roles.
The general concept of the game is to simulate an ongoing, iterative software development process of a specific project. The game focuses the player on task estimation, as part of a team of developers using the “Planning Poker” methodology.
The following sections will explain the game concepts, narrative, its characters, gameplay and mechanics. To clarify the pedagogical purpose (PP) behind most of these concepts, “PP”-prefixed and italicised sections will be added throughout the text, explaining the learning/pedagogical rationale of a (set-of) specific game element(s), together with the game design pattern(s) (in bold with the “gdp:” prefix) used, whenever applicable.
4.1. Narrative and Characters
As the game starts, the player is given the following narrative:
“You’ve just been hired as a Junior Software Estimator at E4, a software house. You have four colleagues on your team, which is responsible for developing an application for managing local selling stores. Its features range from product browsing and rating (by customers) to stock management and customer accounting (by a manager). All these features are presented as User Stories. The goal of your team is to deliver the project on time and budget.”
The game mechanics simulate a team of developers that undertake a specific project with specific requirements. The development process is based on SCRUM, where the team performs “Planning Poker” at the beginning of each weekly sprint. There, it tries to estimate and fit as much User Stories into each sprint as possible in order to complete the project on the shortest possible time.
There are seven non-playable game characters, each with specific roles, with whom the player may interact:
- The Guru Master is the wise tutor and narrator. This elder figure introduces the game and guides the player (at his/hers demand) throughout each step of the game.
- John, the Scrum Master, is the team leader. Not so much a project manager, he is more of a facilitator and mediator of the “Planning Poker” team meeting. He is a good communicator, skilled at driving the planning meeting.
- Natalie, the Product Owner, serves as a communication surrogate between the project stakeholders and the development team. She holds the product vision and tries to pass that onto the team, while responsible for prioritising the User Stories and validating the completed tasks. She is present at the planning meeting to clarify the team doubts on the product requirements during user story estimation.
- The remaining team members are the developers, with different experience levels: Peter is more experienced in back-end development, while Adam is proficient in front-end development. Sarah has some experience in both front-end and systems integration, while Barry, the rookie, is the least experienced.
PP: So far, all game elements serve to “set the stage” where the learning process will take place. Overall, they impersonate real-life setting elements such as team members, development locations and organisational entities. The learner is taken to a believable simulated environment of a real project, promoting immersion and engagement into the game. The game’s objective is set and explained (gdp:predefined goals), having the Guru Master character as a permanently available tutor (or help system, gdp:helpers), that, at any time and at the learner’s discretion, may assist in coping with difficulties that may arise during gameplay.
4.2. Gameplay
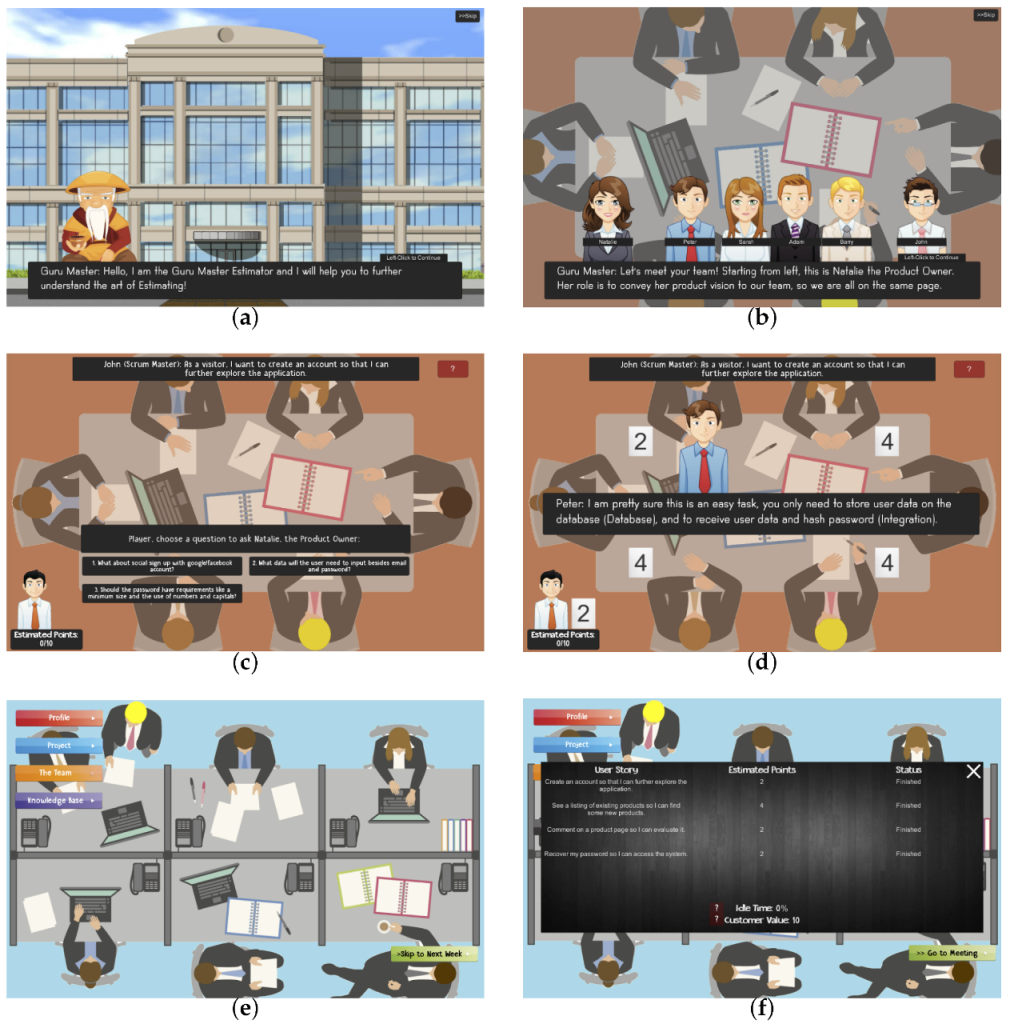
After an introductory scene (Figure 3a), where the Guru Master explains the overall game mechanics, the player is immediately taken to a first weekly planning meeting, where he/she plays the “Planning Poker” game. Here, the Guru Master briefly presents the team members (Figure 3b), and the Scrum Master begins the estimation cycle, consisting of the following steps:
- Presenting—The Scrum Master presents the team with a User Story. This is a quick and concise description of what the intended system should do. An example of a possible User Story might be: “As a visitor, I want to create an account so that I can access the application.”
- Q&A—The player has to select a question, out of a possible three, to ask the Product Owner (Figure 3c). Choosing a proper question adds to the team’s knowledge about the User Story and increases the chance of a more accurate team estimation.
- Estimation—At this point, the team is ready to estimate the user story. The player chooses which card he/she intends to “play” as his/her estimation value. All team member cards are then shown simultaneously.
- Discussion—If all members played the same card, it jumps directly to the Consensus step. If not, members whose card deviates from the “most played card”, explain why they chose that card (Figure 3d). If the player happens to be one of those members, then all members explain their estimates.
- Consensus—Finally, the Scrum Master suggests a final estimation value to be agreed upon by the team. At this point, the player can “force” his/hers estimate or can accept the proposed value.
- Back to step 1, with a new user story.
This estimation cycle repeats until enough user stories are estimated to fit the team velocity—the amount of story points the team can complete in a single sprint (10 story points, by default)—thus ending the planning meeting and starting the development sprint.
PP: Throughout this estimation cycle, the learner perceives the Planning Poker mechanics and is challenged to take part in the process actively. Challenging the learner to seek options that will impact the process, and whose evaluation is immediately fed back to the learner (gdp:score), consolidates knowledge intake. For example, at step 2. (Q&A), choosing the better question will immediately earn the learner a higher score and will effectively impact on the other team members’ estimates. Furthermore, choosing poorly will trigger specific responses from the Product Owner that hint (gdp:clues) towards a more proper question, so that the learner may improve its performance over time. During step 4. (Discussion) the learner discloses the reasons behind the other team members’ estimates (gdp:clues), progressively building up a mental model about their profiles and their user story judgement and appraisal.
The player is then directed to the Office scene (Figure 3e). In this scene, the player has access to diverse in-game information and metrics:
- Player Profile: Experience level, current employment position, number of correctly asked questions and number of accurately estimated user stories.
- Project Monitoring: Completed user stories, current sprint (and user story completion), remaining user stories and sprints (until the deadline).
- Team Members: profile description of each team member, their roles and expertise.
- Knowledge Base: Contains definitions and explanation about both Software Estimation and the development process concepts present in the game.
PP: During the Office scene, the learner gets complementary knowledge sources, containing more detailed and accurate information (gdp:direct information) on the team, process, project and his/hers game progression (gdp:progress indicators). Every time an estimation cycle ends, the learner can look for more information on these elements, as a means to clarify or consolidate doubts that might have arisen during the estimation cycle. To avoid excessive information and promote a sustainable learning process, data are not disclosed all at once. As the game progresses, more becomes available, focusing the student’s attention on what is essential at the time and promoting an incremental intake of new, consolidated knowledge.
In this scene, the player can quickly advance to the end of the week and see the weekly results of the sprint (Figure 3f). These results list the allocated user stories, its estimated points and completion status. Two other metrics are Idle Time and Customer Value, which will be explained further in Section 4.3.3.
The game ends when all user stories are completed, and the project is delivered.
4.3. Game Engine
Simulating a real Planning Poker scenario, tries to cope with human interaction and, consequently, lots of subjectiveness. Providing a rich and complex debating environment, although an interesting challenge, would prove too costly to implement within a reasonable time frame. As such, the authors tried to simplify reality down to a point where it would not hinder the learning process and would allow achievement of the learning goals.
This section unveils the internals of the game rules and how the main concepts were modelled. They were aimed at providing a feasible and believable simulation of the real world, focused on allowing the player to capture and assimilate the main concepts without losing engagement and fun. Evaluating the impact of the game engine internal parameters on the learning process is beyond the scope of this work. Nevertheless, its details are presented for the sake of clarity.
4.3.1. User Stories and Questions
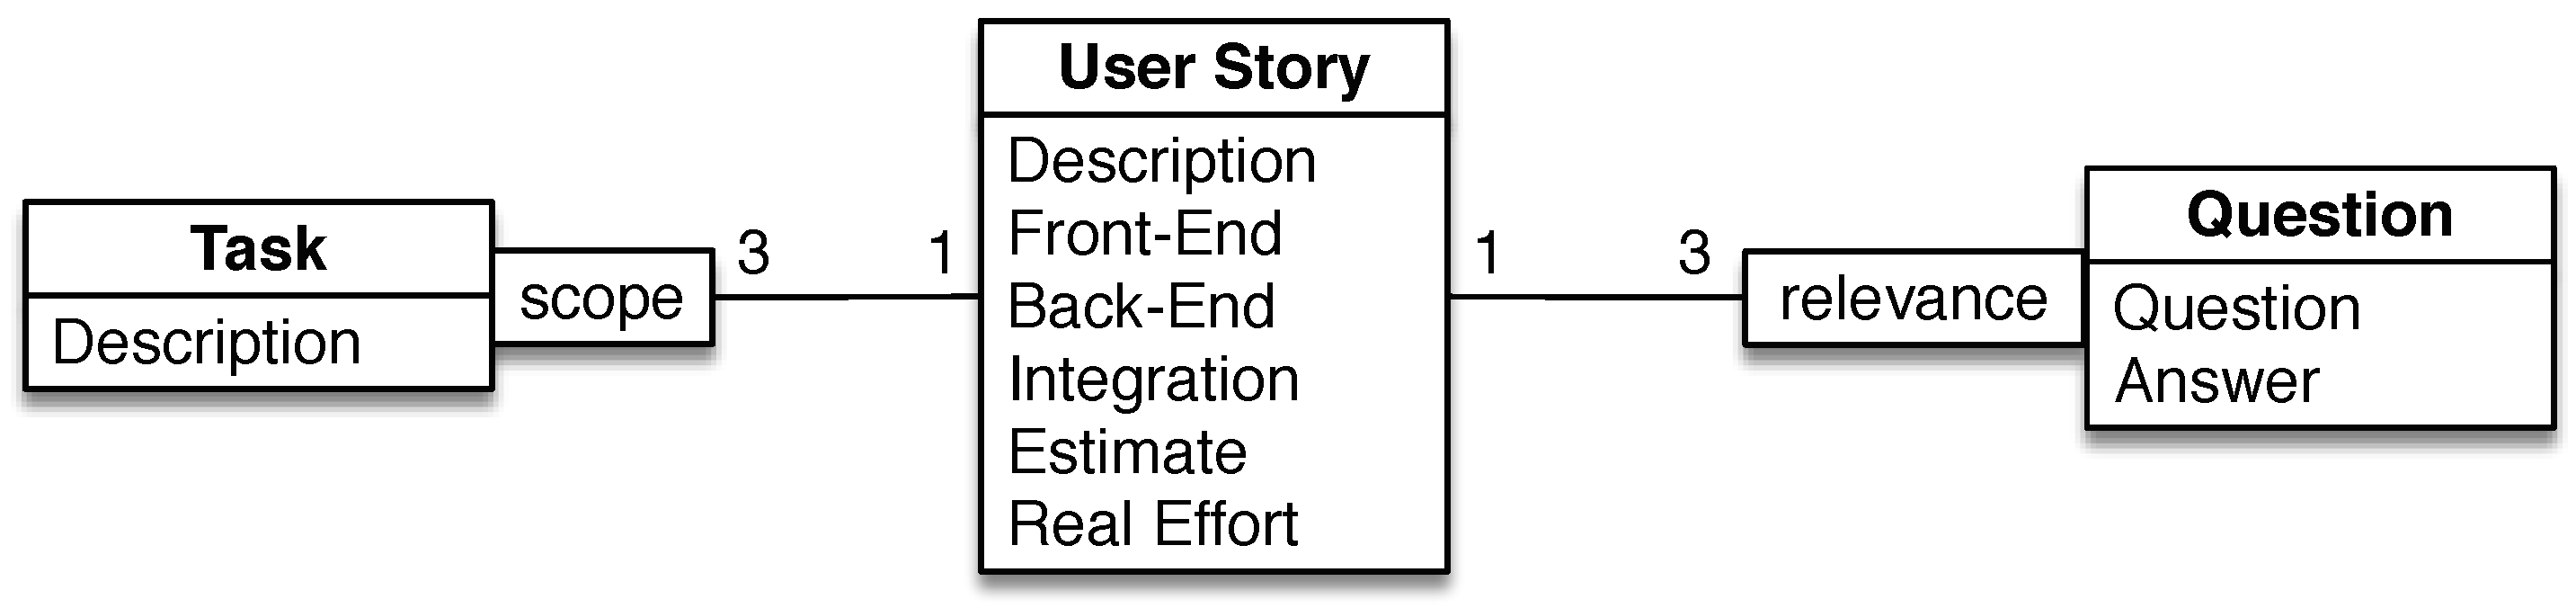
A User Story (see Figure 4) is composed of a textual description (Description), a complexity/difficulty level for its three scope components (Front-End, Back-End and Integration, ranging from 1 to 4), an estimate (Estimate, given during Planning Poker) and the actual effective effort of completing the user story (Real Effort, never disclosed to the player).
Each User Story has three associated (sub-)tasks, each covering a specific scope component (“Front-End”, “Back-End” and “Integration”). The team members refer to these tasks during the discussion of their estimates.
Each User Story has three associated questions (and its corresponding answer), discriminated by their relevance (“high”, “medium” or “low”). These are the questions the player may ask the Product Owner during Planning Poker. Selecting a highly relevant one not only results in a higher score, but it impacts the team members estimation accuracy for that particular User Story. Scoring at this point is measured in Experience Points (XP) and will be further explained in Section 4.3.3.
For example, for a User Story whose description is “As a visitor, I want to register so that I can access the application.”, three possible questions to ask the Product Owner might be:
- What data will the user need to input besides email and password? (High relevance. If selected, player scores +2 XP.)
- Should the password have requirements like minimum size and the mandatory use of numbers and capitals? (Medium relevance. If selected, player scores +1 XP.)
- What about social sign up with Google or Facebook credentials? (Low relevance. If selected, the player does not score.)
The player not only knows how much he/she has scored, but the Product Owner’s answer is also intuitive to the importance of the question. In this example, choosing the medium relevant question would produce a response such as: “That is not a bad idea, but I would not force that at this time.”
4.3.2. Team Members, Estimation and Discussion
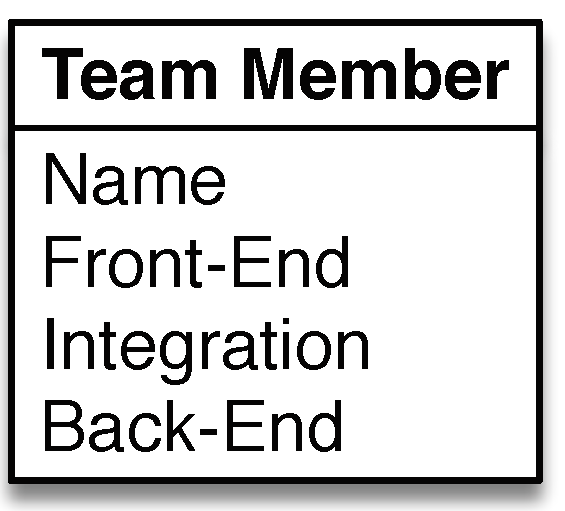
A Team Member (see Figure 5) is composed of a Name, a skill level for each scope component (Front-End, Back-End and Integration, ranging from 1 to 4). To map the profile descriptions of the team members, their actual stats during the game were (FE/I/BE): Peter (2/2/4), Sarah (3/3/1), Adam (4/1/2) and Barry (1/2/2). These skill levels were used, not only to select the appropriate task during discussion but to compute each member’s confidence level when estimating a User Story.
Estimation Confidence Level. In real life, a team member estimates according to its subjective perception of what a User Story encompasses, relying on its knowledge and experience. In E4, this is modelled by a computational property called “Estimation Confidence Level” and is calculated as follows:
Let’s assume that: is the Front-End difficulty level value of User Story u and that is the Front-End skill level value for team member m. Similarly, and concern the level values for Integration and and concern the level values for Back-End. In addition, , , , , , Then, the estimation confidence level of team member m for User Story u is given by the following equation:
where . It should be noted that individual team member skill levels are temporarily modified for each user story, according to the player’s performance on the Q&A step, as to incorporate the extra knowledge impact on the team’s estimation criteria.
Estimating. Team member’s estimation considers their value and acts accordingly:
- . The team member performs an accurate estimate, choosing the Real Effort value of the User Story.
- . The team member has a 50% change of performing an accurate estimate, a 25% change of overestimating (+1) and a 25% change of underestimating (−1) (PP:gdp: randomness).
- . The team member estimates poorly, randomly over or underestimating (PP:gdp: randomness), by a measure of more than one.
The rationale behind these values was to provide an increasingly wider interval as confidence levels drop. Consequently, high confidence has a range of 0.5, medium confidence has a range of 1, whereas minimum confidence has a range of 1.5. Empirically, this would simulate that very accurate estimates are always hard to make, whereas less accurate estimates are easier and more common.
Discussing. Debating to reach consensus was simplified so that each team member justifies why they chose that particular estimate. This justification or “opinion” is issued by composing a “paragraph” or “sentence” that describes the rationale behind the estimate. This description incorporates three components:
- The confidence level () translates to quotes such as: “I’m confident that…”, or “I’m pretty sure that…”, if the is high, or “I think that…”, or “I believe that…” for medium values of and “I suppose that…”, or “I’m not sure, but…” for lower values of .
- the difficulty level of the user story, according to its nominal estimate translates to quotes such as (preceded by “this user story is…”) “very easy…”, “easy…”, “a bit demanding…” or “quite demanding….”
- the focusing task(s) the team member chooses to measure the effort needed to complete the User Story. These tasks are selected according to the team member’s best skill level for each scope component. If the of the team member is high, more than one task is used to compose the “opinion”.
As an example, if a team member had a medium value, being highly skilled at Back-End and gave a 4 as an estimated value, a possible justification of this estimate might be: “I believe that this user story is a bit demanding because the server’s database has to be restructured to handle new data.” The vocabulary database for automatically composing these sentences included about four variations of each component to maintain some unpredictability during gameplay.
4.3.3. Project Metrics and Scoring
A project is composed of a set of User Stories, gathered into the Product Backlog. The project is divided into weekly sprints, each having a planning meeting where the User Stories are estimated through “Planning Poker”. With a fixed Team Velocity of 10 Story Points, enough User Stories are estimated per meeting so as to fit into the next sprint.
At the end of each sprint, the player is presented with project progression metrics, such as User Story completion state (“Done”, “In Progress” together with the executed Story Points, “Not Started”), Idle Time and Customer Value.
Idle Time. This measures the amount of time the team was idle, and is calculated as follows:
This metric (percentage) allows the player to perceive if, overall, the team is underestimating (no idle time and user stories not done) or overestimating (amount of idle time).
Customer Value. During the planning meeting, the user stories are presented and estimated, already sorted according to their real value to the Product Owner. Thus, simplifying this concept, this metric is the sum of the Real Effort values of all the completed User Stories of the sprint.
Scoring. There are two types of scores:
- Experience Points (XP): The player gains XP as a way of improving his/her Player Character, which will, in future versions, unlock new abilities and access to additional sources of information. In this version, it transmits a sense of advancement in the progress of the game’s narrative, not only by giving feedback on performance, but also promoting engagement. The player only scores experience points (XP) when: (a) selects a proper question to ask the Product Owner (+2 XP for a highly relevant question, +1 XP for a medium relevant question); and (b) performs an accurate estimate on a User Story (+3 XP for an exact estimate, +1 XP if it only deviates by one).
- Overall Project Score (OPS): This is the actual final game score when a project is finished and is computed as follows: Let be the number of effective sprints used to finish the project, the number of ideal sprints the project should have spent to complete, the number of high-relevance questions posed to the Product Owner, the number of exact estimates (same as Real Effort value) and the total experience points of the player. Then, the Overall Project (Final) Score is calculated according to the following equation:Thus, there is an initial 30 point default score, where a 10 point penalty is subtracted for each “extra” sprint taken beyond the ideal number of sprints needed to complete the project. To this value, 10 points are added for each highly relevant question posed to the Product Owner and 20 points for each “spot-on” estimate. Lastly, the player’s experience points are added.
4.4. Game Design Patterns
Based on the sub-set of surveyed GDPs seen in Figure 2, these were included in the design of the game. Despite being mentioned in previous sections (within the PP paragraphs), they are briefly summarised in this section, for the sake of clarity.
- Clues. These are implicit or explicit bits of information that might hint or direct the player towards a more successful path within the game. The Product Owner answering on questions posed by the player (implicit) or team members explaining why they have chosen a specific estimate (explicit) are examples of this pattern.
- Predefined Goals. Almost every game has a (set of) predefined goal(s). Beyond the typical “win the game”, the initial introduction of the game (by the Guru Master) defines the main objective of “deliver the project on time and budget”. Implicitly, by explaining the mechanics of the game, the Guru Master also defines high estimation accuracy as an expected outcome for successfully achieving the goal of the game.
- Randomness. Every game must have a component of uncertainty, or else, it will become predictable and boring. This is introduced during computation of the team members estimate, so that, after a while, estimates do not become fully deterministic, due to understanding the underlying mechanics.
- Score. This “reward feedback” happens throughout the game, so as to keep the player motivated. Namely, it occurs when asking questions to the Product Owner and estimating User Stories, scoring experience points (XPs). At the end of each project, a final score is also awarded.
- Progress Indicators. In the Office scene, the player can see how good (or bad) he/she is faring, perceiving the User Stories completion ratio (completed/to complete). This feedback is important to keep the player aware of his/her progress so that tactical/strategical ideas might be reviewed to improve performance.
- Direct Information. This is explicit, clear knowledge information about concepts, context and game aspects. This is achieved by providing a “Knowledge Base” element, in the Office scene, where the player can review, consolidate and capture specific topics on the learning context (e.g., “sprints”, “User Stories”, “Story Points”, “SCRUM”, etc.).
- Helpers. This introduces aids to the players whenever he/she becomes stuck or lost inside the game. The “Guru Master” character acts as such a mechanism, allowing the player to resort to him, whenever he/she deems necessary.
- Surprises. These are random, unexpected events that impact on the course of the game and that try to trigger a different response from the player. In this particular pattern, the authors did not find a suitable metaphor within the game to apply this pattern. There was the idea of introducing new User Stories during the course of the project so that it would “scramble” the planned work (as it usually happens in real projects). However, it was seen as too intrusive to the primary learning goals by introducing added complexity to the game mechanics at a first game level. It is planned to be introduced in future versions of the game.
5. Empirical Study with Students
As already stated in Section 3.3, an Empirical Study with Students (ESWS) was performed as a validation experiment. The use of ESWSs in software engineering helps researchers gain insight into new or existing techniques and methods. Scientific grounds and discussion for the use of such controlled [38] methods for software engineering research validation can be found in [41,42,43]. ESWSs can be valuable to the industrial and research communities if they are conducted adequately, address appropriate goals, do not overstate the generalisation of the results and take into account threats to internal and external validity [44].
5.1. Goal
The experiment aimed at answering the following research question:
RQ: Can a game provide a fun and effective way of learning about Software Estimation?
Overall, experiment subjects would play the E4 game, having the “fun” metric measured through observation and a post-game satisfaction questionnaire. Effectiveness would be measured with pre- and post-game knowledge questionnaires about Software Estimation.
5.2. Subjects
The experiment subjects were 20 MSc students from the Integrated Master in Informatics and Computing Engineering, lectured at the University of Porto, Faculty of Engineering. They were part of a 2nd-year class, attending a laboratory course on object-oriented programming. The overall profile of the subjects was deemed suitable for the experiment. They all had some programming experience and had already been in contact with web development. Furthermore, they had still not enrolled in the 3rd-year Software Engineering course, where they address the topic of Software Estimation. During laboratory classes, they were asked to develop a simple digital game (as a means to consolidate their object-oriented skills); therefore, asking them to play a game would not come as strange, thus, integrating this experiment into their course work proved seamless.
5.3. Environment
According to [44], regarding ESWSs,
The study setting must be appropriate relative to its goals, the skills required and the activities under study.
Considering this requirement, the experiment was conducted in a familiar setting to the students, so as to minimise the external environmental factors that might threaten the validity of the results. It took place in laboratory classrooms, usually used by the students to attend classes or develop their course work. They were only required to use a personal computer, being otherwise, self-sufficient in terms of the expected skills to undertake the experiment.
5.4. Protocol
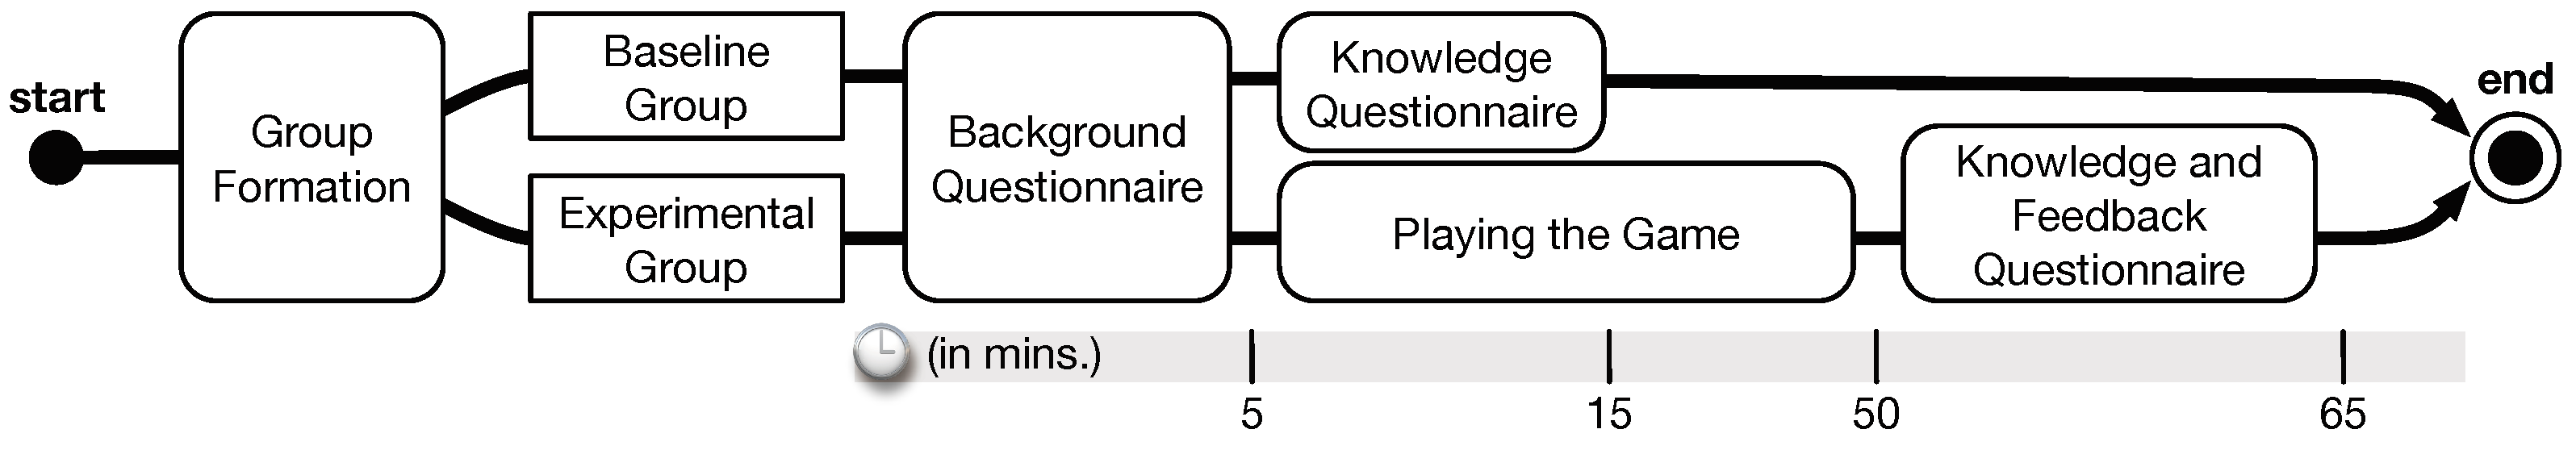
The experiment undertook the following protocol (see Figure 6), which basically, divided the students into two homogeneous groups of 10, after which they had no contact with each other during the entire experiment. Each group underwent a specific “treatment”, described next:
- Baseline Group (BL): Firstly, this group answered a 5-minute questionnaire (Background Questionnaire) to ascertain the students’ background and general profile. The goal was to screen out possible “outliers” among the students regarding their basic skills, and (non-) acquaintance with Software Estimation. The group then answered a 10-minute questionnaire (Knowledge Questionnaire) regarding the Software Estimation topic, to measure the amount of knowledge the students would possess (presumably, not much, if any at all) at this point.
- Experimental Group (EG): This was the group that played the game. After being put the same background questionnaire as the BL group, these students then, in pairs, played the game for about 45 minutes. In the end, they answered (individually) to the same knowledge questionnaire as the BL group, so as to measure the knowledge attained upon playing the game. To rule out external threats to the validity of the results, questions on external factors and overall satisfaction were also posed to these students. During the “playing” stage, the students were constantly, and discreetly, monitored and observed by the authors.
The purpose of the BL group was to measure the amount of knowledge subjects possessed at the beginning of the experiment so that it could be compared with the “post-game” acquired knowledge of the EG group. Having the EG group also answering the same knowledge questionnaire before playing the game would, most likely, bias their in-game performance. They would aim at finding specific knowledge based on the questions they were unable to answer, thereby threatening the results. The experiment was devised to measure to what degree knowledge acquisition was produced, without focusing on specific learning goals.
All the questionnaires were designed using a Likert scale [45]. This psychometric bipolar scaling method contains a set of Likert items, or statements, which the respondent is asked to evaluate according to any subjective or objective criteria, thus measuring either the negative or positive response to the statement. For the questionnaires in this experiment, the Likert items had a five-point format: (1) strongly disagree, (2) somewhat disagree, (3) neither agree nor disagree, (4) somewhat agree, and (5) strongly agree.
6. Results
This section presents and discusses the results of the experiment.
6.1. Background
The goal of the Background questionnaire was to provide an objective comparison between the technical background of each group. It was composed of the following questions:
- BG1 I have experience in Software programming.
I have considerable experience in using…
- BG2.1 …Java.
- BG2.2 …SQL.
- BG2.3 …Swing or JavaFX.
- BG2.4 …HTML.
- BG3 I have considerable knowledge in the Software Engineering area.
- BG4 I have developed projects using the SCRUM methodology.
- BG5 I know what Planning Poker is and I have played it.
Both groups results were compared for similarity using the, non-parametric, two-sample, rank-sum Wilcoxon–Mann–Whitney test [46], with . The significance level for all tests was set to 5%, so probability values of were considered significant, and were considered highly significant.
As can be seen in Table 1, an analysis of the results showed there was no significant difference ( 0.05 in all cases) between the BL and EG. As such, any subjective difference among the participants regarding their basic skills was rejected, thus confirming the homogeneity of both groups. Nevertheless, one element of the EG had to be rejected, due to, personally being adept at Software Engineering, already possessing considerable knowledge on the topic.
6.2. Knowledge Intake
In order to measure the knowledge intake after playing the game, a set of 18 items was devised and presented to the subjects at the end of the experiment. These questions intended to ascertain how much correct information about Software Estimation topics the participants had acquired. These were the questions presented to the subjects:
- KW1. I feel I am acquainted with Software Estimation and its applications.
- KW2. Software Estimation allows for control of project development progress in order to meet its goals.
- KW3. An estimate is as accurate as the person’s knowledge about the task at hand.
- KW4. An estimate can be absolute or relative (compared with previous similar User Stories).
- KW5. A Sprint is the short time before a deadline where a developer team works extra hard.
- KW6. A Sprint is a pre-defined time interval during which there is specific work to be completed.
- KW7. In Planning Poker, the estimates are shown at the same time to avoid bias.
- KW8. In Planning Poker, the discussion phase comes after giving an estimate.
- KW9. A User Story is a sentence where a functionality is described.
- KW10. A User Story does not follow a template.
- KW11. Number sequences like Fibonacci (1,2,3,5,8) or T-Shirt sizes (1,2,4,8) may represent the number of hours needed to complete a User Story.
- KW12. An Epic is a User Story that is too big, thus is discarded.
- KW13. Late deliveries and unexpected time delays are a consequence of underestimating.
- KW14. An inefficient resource usage and a low productivity team may be consequences of overestimating.
- KW15. The Product Owner’s main goal is to share his vision with the development team, while also participating in Sprint Meetings to clarify any doubts.
- KW16. The Product Owner also gives estimates.
- KW17. The Scrum Master is the leader of the software development team, and can override an estimate.
- KW18. In Scrum methodology, there are successive software deliveries since the start of the project.
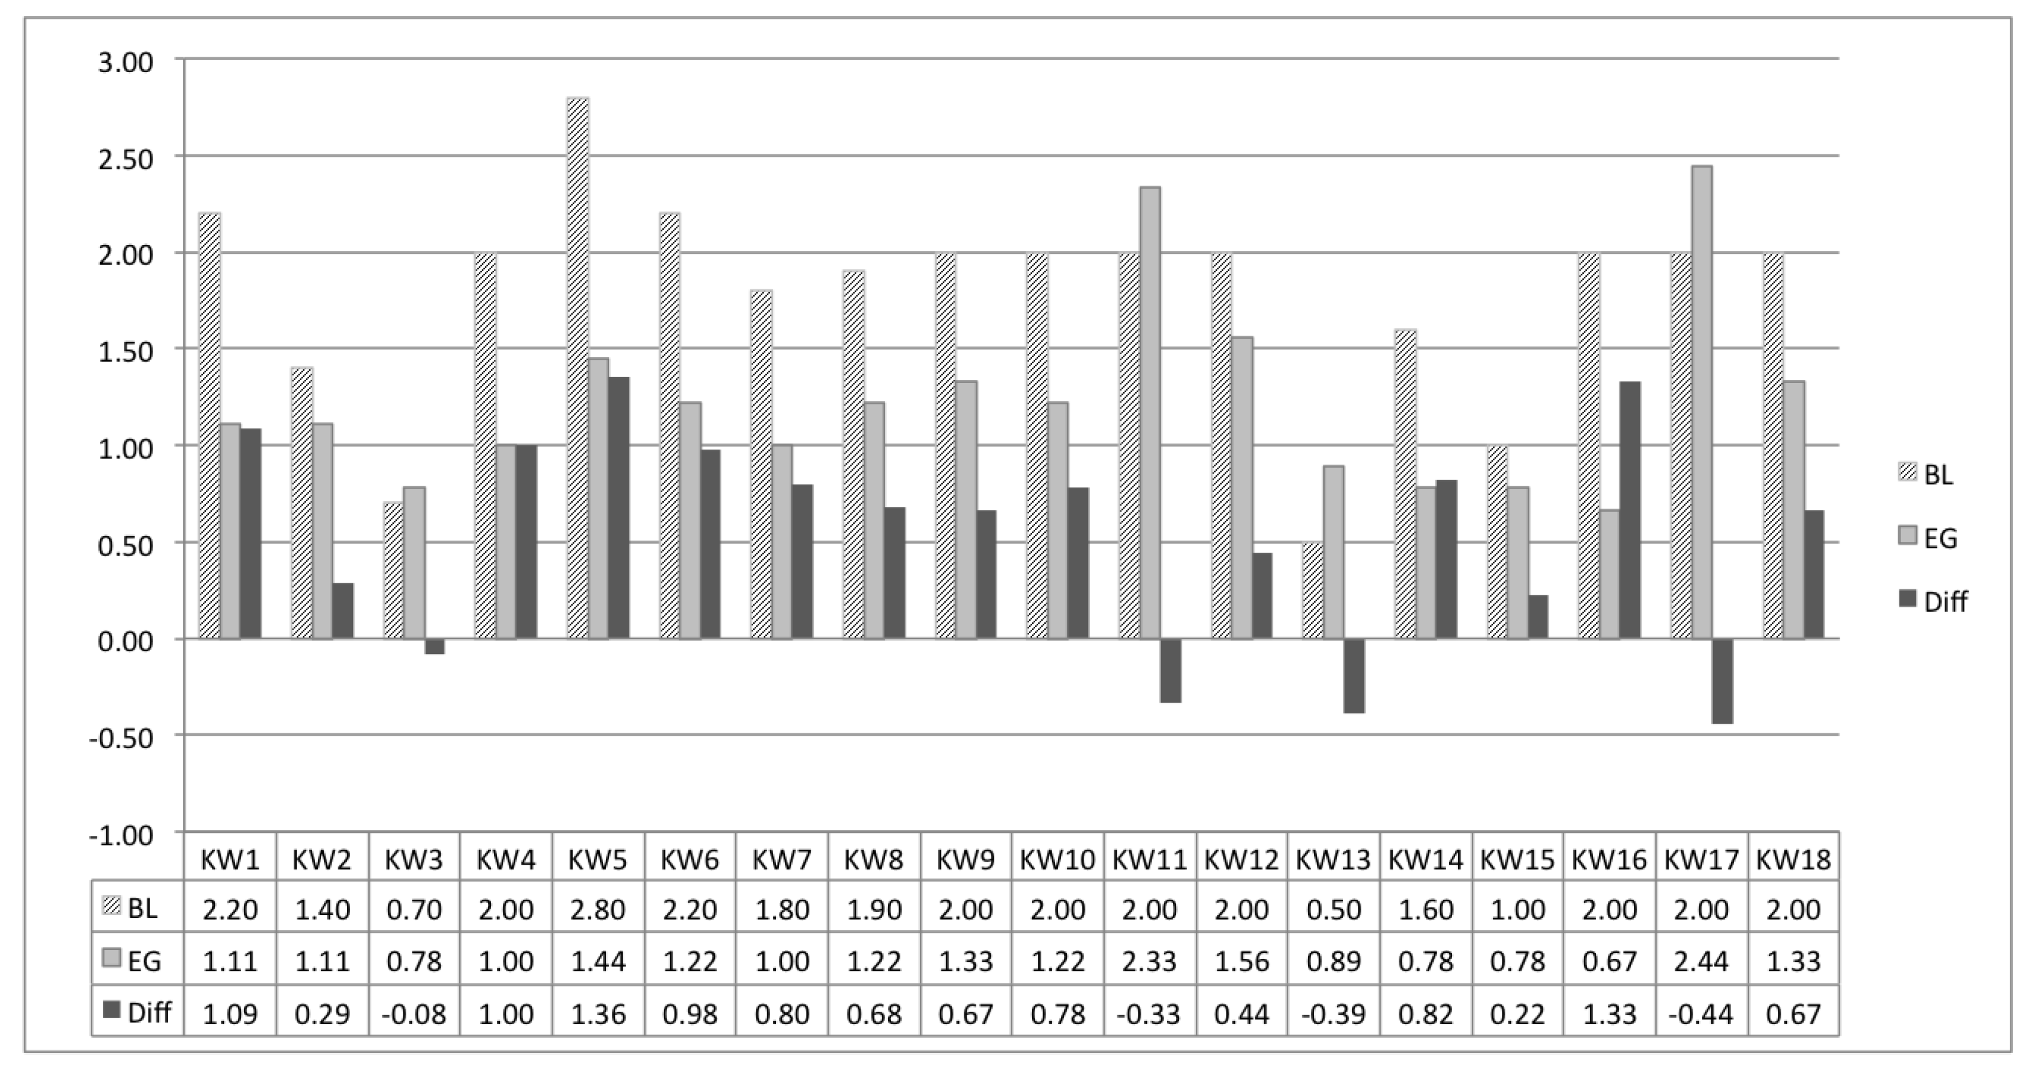
When answering a true or false statement, using a five-point format Likert scale, the scores not only show the answer (strongly disagree (1) as false and strongly agree (5) as true) but also the confidence level of the respondent. The closer the answer gets to the boundaries of the scale, the more certain the subject is of the answer (being neither agree nor disagree (3) not knowing the answer). The scores were then processed and converted into distances from the correct answer, e.g., a score of 2 for a true statement (5) converts into a distance of 3 (), whereas for a false statement, it converts into a distance of 1 () and so forth. Items for which the subjects did not know the answer (3) would always contribute the same distance (2). Finally, an average of the scores for each item was computed, and an independent samples t-test was conducted to compare the averages of the items between the BL and EG groups. These results can be seen in Table 2 and Table 3. A comparison of the knowledge distances for each question can be seen in Figure 7.
Analysis of the results indicates a positive gain in knowledge intake shown by the positive difference between the BL and GE groups for all but four questions. A more comprehensive analysis of these four questions is needed to assess the cause of these results.
- KW3. An estimate is as accurate as the person’s knowledge about the task at hand. The negative difference for this question was only 0.08, (BG: 0.70 vs EG: 0.78). Comparing the answers using the Mann–Whitney–Wilcoxon test (), further showed that there was no statistically significant difference between the responses of both groups. These results indicate that, regarding this specific question, playing the game did not offer further insight into the subjects, with both groups giving similar answers based on their background knowledge and intrinsic common-sense.
- KW11. Number sequences such as Fibonacci (1, 2, 3, 5, 8) or T-Shirt sizes (1, 2, 4, 8) may represent the number of hours needed to complete a User Story. Although the difference is only 0.33 (BG: 2.00 vs EG:2.33), the concept of Story Points was not correctly assimilated by playing the game. Story Points are not a measure of time, but of effort/cost of task completion (without a specific unit). In the game, this concept is, consequently, not as clear as expected (the “time” factor is not mentioned). Therefore, the notion of effort as a time-based measure is of natural adherence, when task duration is considered. Making this non-assumption explicit in the game should improve the correct understanding of this concept.
- KW13. Late deliveries and unexpected time delays are a consequence of underestimating. This question had a negative difference value of 0.39 (BG: 0.50 vs. EG:0.89), and this is mainly due to the concepts of “late delivery” and “unexpected time delays”, which, although being mentioned during the game, did not occur during gameplay. It was expected that the subjects could, subjectively, perceive and reinforce these as consequences of underestimating, but the results do not support that. The game could be improved by provoking these events during gameplay, as a result of underestimating.
- KW17. The Scrum Master is the leader of the software development team, and can override an estimate. This was a trick question (diff: 0.44, BL: 2.00 vs EG:2.44), with both a true (“leader”) and false assumptions (“can override an estimate”), thus resulting in an overall false statement. During gameplay, the Scrum Master character never overrides an estimate, yet, nothing is said about his permission to do so if desired. The subjects assumed that it could be possible, as there was no clear evidence of otherwise. Again, demonstration during gameplay of this constraint would enhance the expected learning outcomes.
Overall, the knowledge intake results were as expected, whereas the deviations were mostly due to (1) non-acquisition of implicit knowledge and (2) specific omissions that led to incorrect assumptions. These caveats are easily improved by adding explicit references into gameplay and improvements on the knowledge questionnaire.
6.3. Overall Satisfaction
Besides measuring effective knowledge intake, the subjects were asked about specific game aspects (fun factor, engagement levels, goals), learning experience and several external factors. This inquiry would help, not only filter out possible threats to validity, but understand the perceivable impact the game had on the subject’s learning process.
The post-experiment satisfaction questionnaire consisted of the following questions:
- OS1. I enjoyed playing EEEE.
- OS2. I felt overwhelmed by the amount of information in the game.
- OS3. I felt like I was in a lecture class.
- OS4. I think the game allowed to experience real situations that otherwise would be hard to simulate in a regular class.
- OS5. I had fun playing the game.
- OS6. I feel I learned new things.
- OS7. I liked this learning method.
- OS8. I would like to learn other topics using this method.
- OS9. The game kept me focused.
- OS10. The main goal of the game was clear.
- OS11. The game gave me good feedback about my performance (scores, metrics, progress bars, etc.)
- OS12. I felt the game was too predictable.
- OS13. The information shown on the screen was enough.
- OS14. The game assisted me in understanding what I needed to do.
- OS15. The game session was too long.
- EF1. I found the whole experience environment intimidating.
- EF2. I would play with my partner again.
- EF3. I kept getting distracted by other colleagues outside my group.
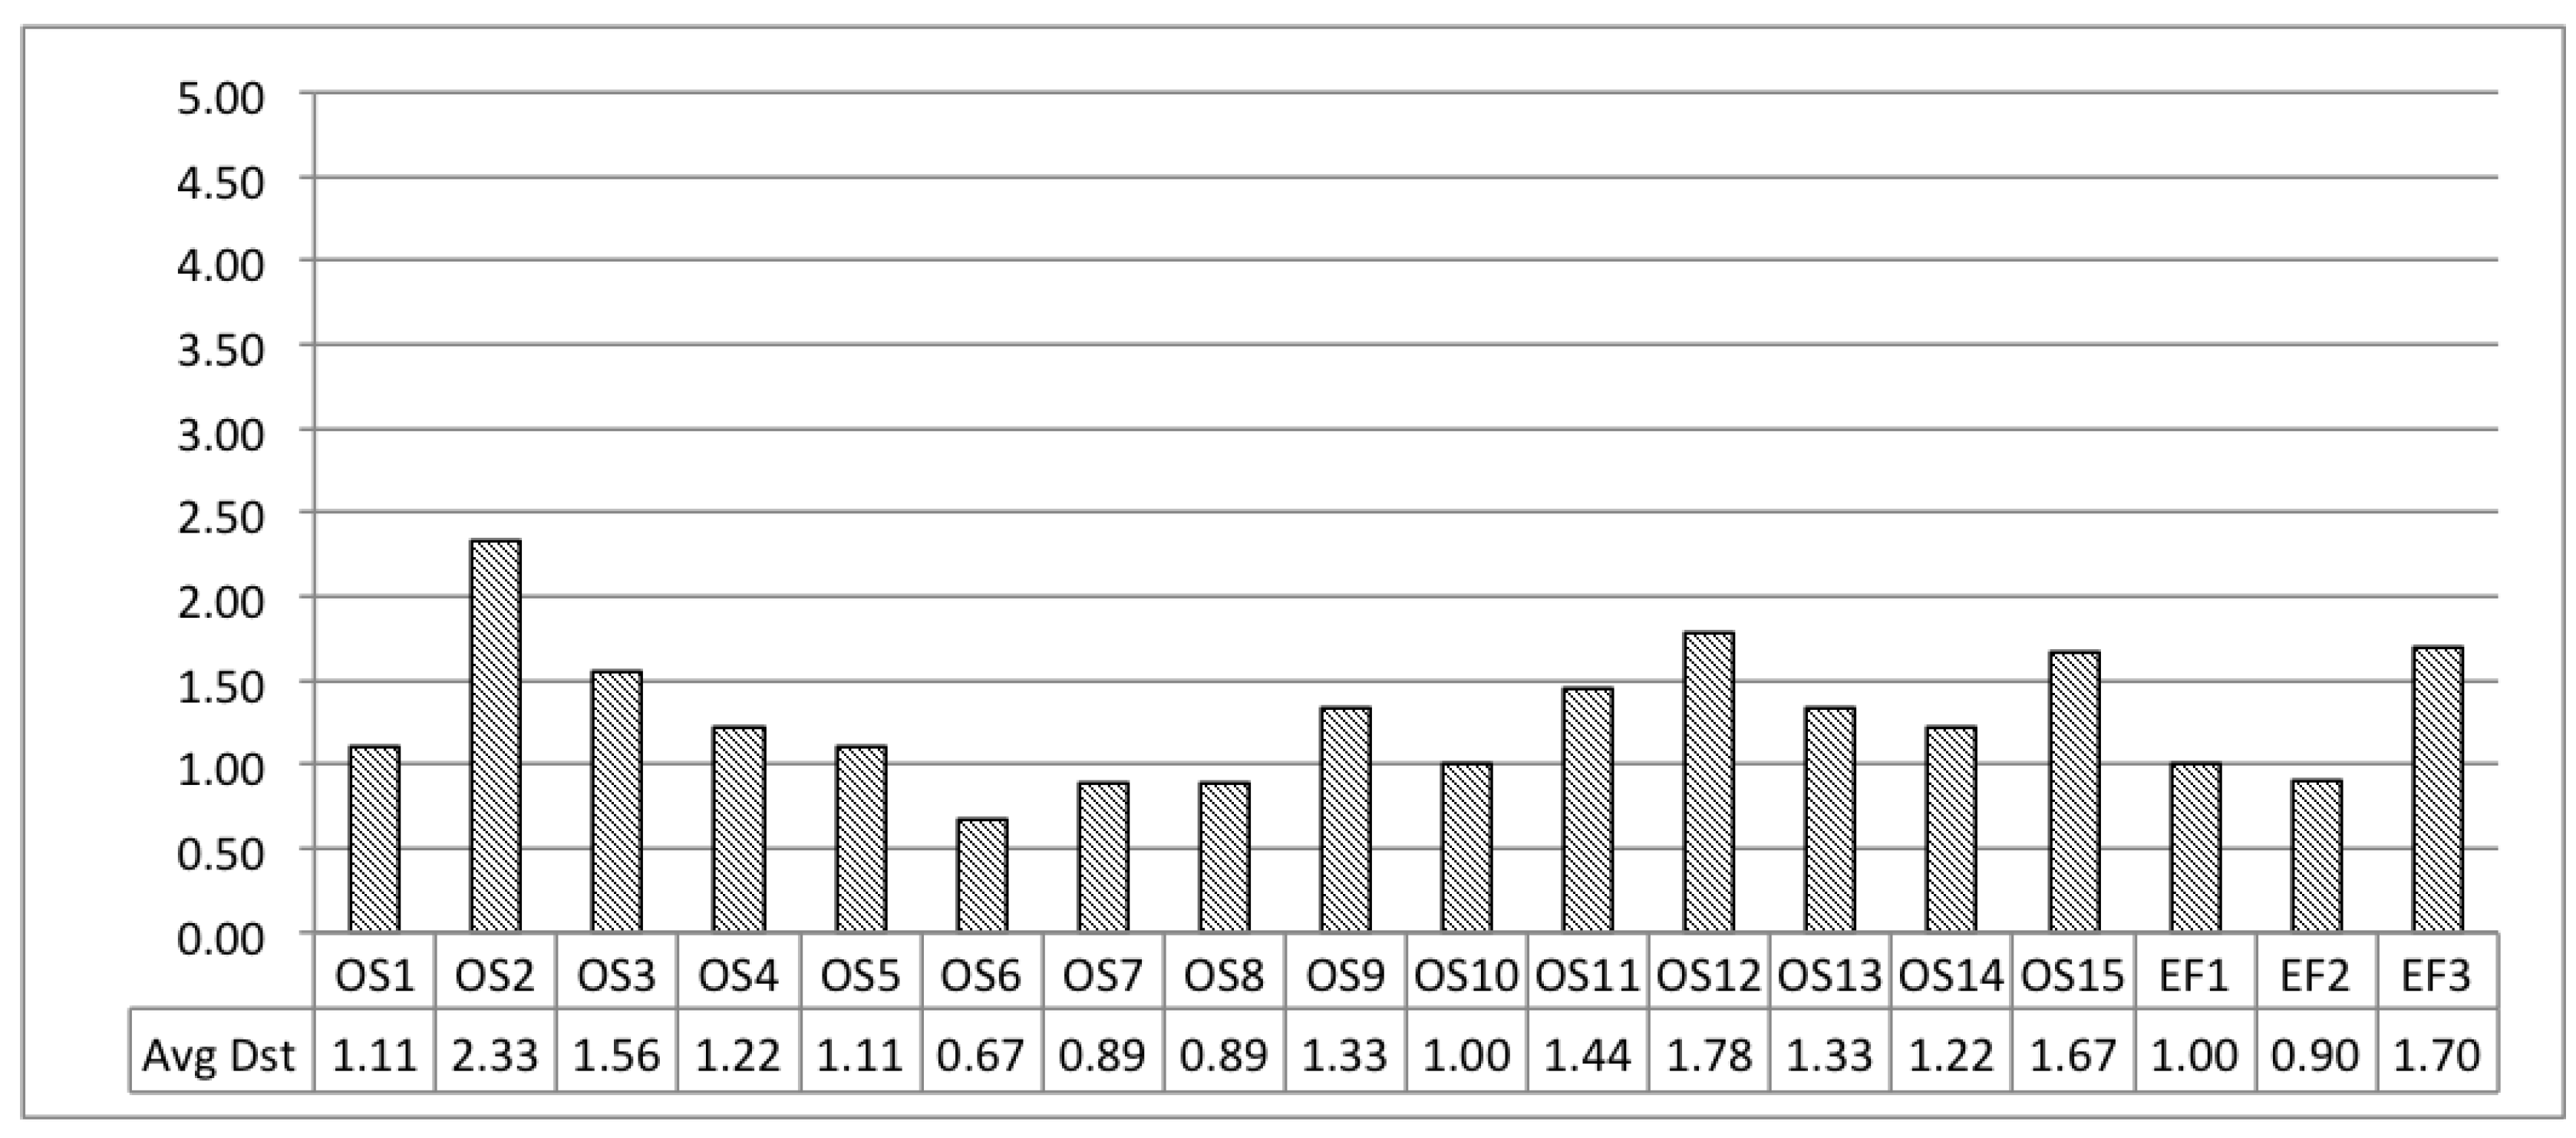
The results can be seen in Figure 8, which shows the distances to the expected answer, as analogous to the knowledge intake results. Overall, the results indicate a positive response (distances averaging below 2.0) to the game session as a fun, repeatable, learning activity.
6.4. Threats to Validity
The outcome of validation is to gather enough scientific evidence to provide a sound interpretation of the results. Validation threats are issues and scenarios that may distort that evidence and thus incorrectly support (or discard) expected results. Each validation threat should be anticipated and addressed a priori to yield unbiased results or, at least, minimised a posteriori with effective counter-measures.
The experiment was performed using 20 students. Although this number could be higher, the main concern was to mitigate this problem by making sure the selected sample would be representative of the overall population. As such, the students were screened for average marks, genre and age as to provide, not only a heterogeneous group but one that would be representative.
The following threats to validity were discarded through the post-experiment questionnaire:
- Environmental factors affected the course of the experiment. As already stated, the experiment took place within the familiar physical space of the course class, so as to prevent the overall setting from having any influence on the performance of the subjects (and as corroborated by answers to questions EF1, EF2 and EF3).
- The game (fun factor) did not keep the students engaged or focused. On the contrary, the students held their focus and enjoyment of the game (questions OS1, OS5 and OS9) throughout the duration (question OS15) of the experiment. Possible impediments were also screened, such as overloading of information (question OS2) and lecture class aversion (question OS3).
- Learning was not perceived at the end of the game. Not only was learning perceived, but enjoyed (questions OS6, OS7 and OS8). The purpose and utility of the game were also acknowledged (questions OS10 and OS14), and some key design aspects of the game were screened (questions OS11, OS12 and OS13). Of course, inside a typical learning environment (class), it is expected to engage in learning activities. Thus, the perception of learning is somewhat expected. Even so, posed questions addressed game usage and not learning in class.
As already stated, while analysing knowledge intake results (Section 6.2), the knowledge questionnaire could be improved so as to become clearer in specific aspects. Nevertheless, these did not impact the results in such a way so as to threaten its validity.
Concerning the selected game design patterns, it is assumed that the observed results would be the same, regardless of the chosen pattern within the set of possible choices for a specific category (see Figure 2). Nonetheless, there was an effort to cover all categories, by choosing, at least, one game design pattern from each category. Assessing if variations inside each category have a relevant impact on the results is beyond the scope of this study and is left for future work.
Typically, everyone likes to play games. Nevertheless, there is such a thing as game aversion. Some people do not like to play games or to mix games with a supposedly “serious” context, such as learning complex, technical concepts in Higher Education. Despite that not being the case here, if that situation occurs, this solution will not apply, and other forms of education will have to be addressed to cope with this issue.
7. Conclusions
This article presents a serious game designed to teach the estimation of the software development effort. This game was developed through a methodology starting with the identification of the learning and teaching functions. From these, you can find the related design patterns recommended for use in game development. The final objective of this work is to validate whether the developed game would increase the effectiveness of learning and, consequently, show the usefulness of the underlying methodology.
An experiment was carried out with two groups of students. One of these groups used the game as a form of learning, but the other did not. In the end, the knowledge acquired by the two groups was measured. The overall results were motivating. The students who played not only achieved most of the expected learning objectives but did so in a fun and enjoyable way. Minor improvements in gameplay were observed while monitoring the experiment, and all major threats to validity were ruled out through a final questionnaire.
The positive result of learning through play increases confidence in the usefulness of the proposed game development approach. Future work will include similar experiments, with games (developed from scratch using the approach) on other software engineering topics. The goal is to have at least one game per subtopic to try to cover the entire scope of software engineering and thus refine and validate the subset of game design patterns. Further analysis of the impact of each game design pattern should be subject to additional study to provide a more refined perception of its specific contributions to the learning process.
Author Contributions
Conceptualization, N.F., A.C.R.P. and N.C.; methodology, N.F., A.C.R.P. and N.C.; software, N.F. and N.C.; validation, N.F., A.C.R.P. and N.C.; formal analysis, N.F. and N.C.; investigation, N.F. and A.C.R.P.; writing—original draft preparation, N.F.; writing—review and editing, A.C.R.P.; visualization, N.C.; supervision, N.F. All authors have read and agreed to the published version of the manuscript.
Funding
This research received no external funding.
Conflicts of Interest
The authors declare no conflict of interest.
References
- Sommerville, I. Software Engineering, 10th ed.; Pearson: London, UK, 2015. [Google Scholar]
- Society, I.C.; Bourque, P.; Fairley, R.E. Guide to the Software Engineering Body of Knowledge (SWEBOK(R)): Version 3.0, 3rd ed.; IEEE Computer Society Press: Los Alamitos, CA, USA, 2014. [Google Scholar]
- Claypool, K.; Claypool, M. Teaching Software Engineering Through Game Design. SIGCSE Bull. 2005, 37, 123–127. [Google Scholar] [CrossRef]
- Paasivaara, M.; Lassenius, C.; Damian, D.; Räty, P.; Schröter, A. Teaching students global software engineering skills using distributed Scrum. In Proceedings of the 2013 35th International Conference on Software Engineering (ICSE), San Francisco, CA, USA, 18–26 May 2013; pp. 1128–1137. [Google Scholar]
- Schilling, W.W., Jr.; Sebern, M.J. Teaching Software Engineering: An Active Learning Approach. ASEE Comput. Educ. (CoED) J. 2013, 4, 13. [Google Scholar]
- Yu, L. Overcoming Challenges in Software Engineering Education: Delivering Non-Technical Knowledge and Skills, 1st ed.; IGI Global: Hershey, PA, USA, 2014. [Google Scholar]
- Westera, W.; Nadolski, R.; Hummel, H.; Wopereis, I. Serious games for higher education: A framework for reducing design complexity. J. Comput. Assist. Learn. 2008, 24, 420–432. [Google Scholar] [CrossRef]
- Molokken, K.; Jorgensen, M. A review of software surveys on software effort estimation. In Proceedings of the 2003 International Symposium on Empirical Software Engineering, Rome, Italy, 30 September–1 October 2003; pp. 223–230. [Google Scholar]
- Letra, P.; Paiva, A.C.R.; Flores, N. Game Design Techniques for Software Engineering Management Education. In Proceedings of the 2015 IEEE 18th International Conference on Computational Science and Engineering, Porto, Portugal, 21–23 October 2015; pp. 192–199. [Google Scholar]
- Ghezzi, C.; Mandrioli, D. The Challenges of Software Engineering Education. In Proceedings of the 27th International Conference on Software Engineering, Louis, MO, USA, 15–21 May 2005; ACM: New York, NY, USA, 2005; pp. 637–638. [Google Scholar]
- Shaw, M. Software Engineering Education: A Roadmap. In Proceedings of the Conference on the Future of Software Engineering, Limerick, Ireland, 4–11 June 2000; ACM: New York, NY, USA, 2000; pp. 371–380. [Google Scholar]
- Li, J.; Wang, X. Research on Reform in the Teaching of Software Engineering Course. In Advances in Intelligent Systems; Lee, G., Ed.; Springer: Berlin/Heidelberg, Germany, 2012; pp. 141–144. [Google Scholar]
- Garris, R.; Ahlers, R.; Driskell, J.E. Games, motivation, and learning: A research and practice model. Simul. Gaming 2002, 33, 441–467. [Google Scholar] [CrossRef]
- Ritterfeld, U.; Cody, M.; Vorderer, P. Serious Games: Mechanisms and Effects, 1st ed.; Routledge: New York, NY, USA, 2009. [Google Scholar]
- Susi, T.; Johannesson, M.; Backlund, P. Serious Games—An overview; Technical Report HS-IKI-TR-07-001; University of Skövde: Skövde, Sweden, 2007. [Google Scholar]
- Navarro, E. SimSE: A Software Engineering Simulation Environment. Ph.D. Thesis, University of California, Irvine, CA, USA, 2006. [Google Scholar]
- Benitti, F.B.V.; Molléri, J.S. Utilização de um RPG no Ensino de Gerenciamento e Processo de Desenvolvimento de Software. In WEI-Workshop Sobre Educação em Computação; Sociedade Brasileira de Computação: Belém do Pará, Brazil, 2008; pp. 258–267. [Google Scholar]
- Fernandes, J.M.; Sousa, S.M. PlayScrum—A Card Game to Learn the Scrum Agile Method. In Proceedings of the 2010 Second International Conference on Games and Virtual Worlds for Serious Applications, Braga, Portugal, 25–26 March 2010; IEEE Computer Society: Washington, DC, USA, 2010; pp. 52–59. [Google Scholar]
- Drappa, A.; Ludewig, J. Simulation in Software Engineering Training. In Proceedings of the 22nd International Conference on Software Engineering, Limerick, Ireland, 4–11 June 2000; ACM: New York, NY, USA, 2000; pp. 199–208. [Google Scholar]
- Bollin, A.; Hochmuller, E.; Samuelis, L. Teaching Software Project Management using Simulations—The AMEISE Environment: From Concepts to Class Room Experience. In Proceedings of the 2012 IEEE 25th Conference on Software Engineering Education and Training, Nanjing, China, 17–19 April 2012; pp. 85–86. [Google Scholar]
- Shaw, K.; Dermoudy, J. Engendering an Empathy for Software Engineering. In Proceedings of the 7th Australasian Conference on Computing Education, Newcastle, NSW, Australia, 31 January–4 February 2005; Australian Computer Society, Inc.: Darlinghurst, Australia, 2005; Volume 42, pp. 135–144. [Google Scholar]
- Xia, J.C.; Caulfield, C.; Baccarini, D.; Yeo, S. Simsoft: A game for teaching project risk management. In Proceedings of the 21st Annual Teaching Learning Forum, Perth, Australian, 2–3 February 2012. [Google Scholar]
- Von Wangenheim, C.G.; Thiry, M.; Kochanski, D. Empirical Evaluation of an Educational Game on Software Measurement. Empir. Softw. Engg. 2009, 14, 418–452. [Google Scholar] [CrossRef]
- Baker, A.; Navarro, E.O.; van der Hoek, A. An experimental card game for teaching software engineering. In Proceedings of the 16th Conference on Software Engineering Education and Training, Madrid, Spain, 20–22 March 2003; pp. 216–223. [Google Scholar]
- von Wangenheim, C.G.; Savi, R.; Borgatto, A.F. DELIVER!—An Educational Game for Teaching Earned Value Management in Computing Courses. Inf. Softw. Technol. 2012, 54, 286–298. [Google Scholar] [CrossRef]
- Calderón, A.; Ruiz, M.; Orta, E. Integrating Serious Games As Learning Resources in a Software Project Management Course: The Case of ProDec. In Proceedings of the 1st International Workshop on Software Engineering Curricula for Millennials, Buenos Aires, Argentina, 27 May 2017; IEEE Press: Piscataway, NJ, USA, 2017; pp. 21–27. [Google Scholar]
- Silva, A.C. Jogo Educacional para Apoiar o Ensino de Técnicas para Elaboração de Testes de Unidade. Master’s Thesis, Computação Aplicada, São José, Brazil, 2010. [Google Scholar]
- Farias, V.; Moreira, C.; Coutinho, E.; Santos, I.S. iTest Learning: Um Jogo para o Ensino do Planejamento de Testes de Software. In Proceedings of the V Fórum de Educação em Engenharia de Software (FEES 2012), Natal, Brazil, 26–27 September 2012. [Google Scholar]
- Ribeiro, T. iLearnTest: Jogo Educativo para Aprendizagem de Testes de Software. Master’s Thesis, Faculty of Engineering, Porto, Portugal, 2014. [Google Scholar]
- Kelle, S.; Klemke, R.; Specht, M. Design Patterns for Learning Games. Int. J. Technol. Enhanc. Learn. 2011, 3, 555–569. [Google Scholar] [CrossRef]
- Grosser, M. Effective teaching: Linking teaching to learning functions. S. Afr. J. Educ. 2007, 27, 37–52. [Google Scholar]
- Shuell, T.; Moran, K. Learning theories: Historical overview and trends. In The International Encyclopedia of Education, 2nd ed.; Husen, T., Postlethwaite, T., Eds.; Pergamon Press: Oxford, UK, 1994; pp. 3340–3345. [Google Scholar]
- Alexander, C. A Pattern Language: Towns, Buildings, Construction; Oxford University Press Inc: New York, NY, USA, 1977. [Google Scholar]
- Gamma, E.; Helm, R.; Johnson, R.; Vlissides, J. Design Patterns: Elements of Reusable Object-Oriented Software; Addison-Wesley Longman Publishing Co., Inc.: Boston, MA, USA, 1995. [Google Scholar]
- Bjork, S.; Holopainen, J. Patterns in Game Design (Game Development Series); Charles River Media, Inc.: Rockland, MA, USA, 2004. [Google Scholar]
- Flores, N.H.; Paiva, A.C.; Letra, P. Software Engineering Management Education through Game Design Patterns. Procedia Soc. Behav. Sci. 2016, 228, 436–442. [Google Scholar] [CrossRef] [Green Version]
- Faste, T.; Faste, H. Demystifying “design research”: Design is not research, research is design. In Proceedings of the IDSA Education Symposium, Las Vegas, NV, USA, 15–20 July 2012; p. 15. [Google Scholar]
- Zelkowitz, M.V.; Wallace, D.R. Experimental models for validating technology. Computer 1998, 31, 23–31. [Google Scholar] [CrossRef] [Green Version]
- Kapp, K.M. The Gamification of Learning and Instruction: Game-Based Methods and Strategies for Training and Education, 1st ed.; Pfeiffer: San Francisco, CA, USA, 2012. [Google Scholar]
- Schwaber, K. Scrum Development Process. In OOPSLA Business Object Design and Implementation Workshop; Sutherland, J., Patel, D., Casanave, C., Hollowell, G., Miller, J., Eds.; Springer: London, UK, 2012; Volume 10. [Google Scholar]
- Goulao, M.; e Abreu, F.B. Modeling the Experimental Software Engineering Process. In Proceedings of the 6th International Conference on the Quality of Information and Communications Technology (QUATIC 2007), Lisbon, Portugal, 12–14 September 2007; pp. 77–90. [Google Scholar]
- Kitchenham, B.; Al-Khilidar, H.; Babar, M.A.; Berry, M.; Cox, K.; Keung, J.; Kurniawati, F.; Staples, M.; Zhang, H.; Zhu, L. Evaluating guidelines for reporting empirical software engineering studies. Empir. Softw. Eng. 2008, 13, 97–121. [Google Scholar] [CrossRef]
- Shull, F.; Singer, J.; Sjøberg, D.I. Guide to Advanced Empirical Software Engineering; Springer: Berlin/Heidelberg, Germany, 2007. [Google Scholar]
- Carver, J.C.; Jaccheri, L.; Morasca, S.; Shull, F. A checklist for integrating student empirical studies with research and teaching goals. Empir. Softw. Eng. 2010, 15, 35–59. [Google Scholar] [CrossRef]
- Likert, R. A Technique for the Measurement of Attitudes; The Science Press: New York, NY, USA, 1932; Volume 22. [Google Scholar]
- Hollander, M.; Wolfe, D.A.; Chicken, E. Nonparametric Statistical Methods; Wiley: Hoboken, NJ, USA, 2013. [Google Scholar]
Figure 1.
The ABC triangle.

Figure 2.
Sub-set of LTFs and corresponding GDPs. Taken from [9].
Figure 2.
Sub-set of LTFs and corresponding GDPs. Taken from [9].

Figure 3.
E4 Game screenshots. (a) Guru Master introducing the game. (b) Team being introduced at first planning meeting. (c) Player choosing which question to ask the Product Owner. (d) Team mates discussing why they chose their estimates. (e) Office screen. (f) Ending current sprint screen.
Figure 3.
E4 Game screenshots. (a) Guru Master introducing the game. (b) Team being introduced at first planning meeting. (c) Player choosing which question to ask the Product Owner. (d) Team mates discussing why they chose their estimates. (e) Office screen. (f) Ending current sprint screen.

Figure 4.
User Story and Question attributes and relationship.

Figure 5.
Team member attributes.

Figure 6.
Experiment protocol.

Figure 7.
Knowledge intake distances results, per question.

Figure 8.
Satisfaction questionnaire distances results.


Table 1.
Summary of the results of the background questionnaire between the BL and EG groups, including the values of the non-parametric significance Mann–Whitney–Wilcoxon (MWW) test.
Table 1.
Summary of the results of the background questionnaire between the BL and EG groups, including the values of the non-parametric significance Mann–Whitney–Wilcoxon (MWW) test.
| EG | BL | MWW (EG1 vs. BL) | |||||
|---|---|---|---|---|---|---|---|
| U | |||||||
| BG1 | 4.10 | 0.70 | 3.50 | 0.50 | ≠ | 27.5 | 0.062 |
| BG2.1 | 3.70 | 0.46 | 3.90 | 0.30 | ≠ | 40.0 | 0.276 |
| BG2.2 | 2.80 | 0.60 | 3.20 | 0.75 | ≠ | 35.0 | 0.218 |
| BG2.3 | 2.00 | 1.34 | 2.40 | 0.92 | ≠ | 41.0 | 0.478 |
| BG2.4 | 1.40 | 0.80 | 1.90 | 1.22 | ≠ | 39.5 | 0.401 |
| BG3 | 3.00 | 0.63 | 3.10 | 0.83 | ≠ | 43.0 | 0.546 |
| BG4 | 1.30 | 0.64 | 1.40 | 0.49 | ≠ | 42.0 | 0.451 |
| BG5 | 1.10 | 0.30 | 1.30 | 0.90 | ≠ | 49.5 | 0.942 |
Table 2.
Knowledge intake group statistics.
| Group | N | Mean | Std. Deviation | Std. Error Mean |
|---|---|---|---|---|
| BL | 18 | 1.7833 | 0.5628 | 0.1326 |
| EG | 18 | 1.2339 | 0.4861 | 0.1146 |
Table 3.
Independent Samples Tests for Knowledge intake. The first two columns are the Levene’s Test for Equality of Variances, showing a significance greater than 0.05 (Sig). The other three columns are the t-test for Equality of Means. Since we can assume equal variances, the two-tailed value of 0.004 allow us to conclude that there is a statistically highly significant difference between the two groups.
| F | Sig. | t | df | Sig. (2-Tailed) | |
|---|---|---|---|---|---|
| Eq. Var. Assumed | 0.418 | 0.522 | 3.134 | 34.00 | 0.004 |
| Eq. Var. Not Assumed | 3.134 | 33.30 | 0.004 |
© 2020 by the authors. Licensee MDPI, Basel, Switzerland. This article is an open access article distributed under the terms and conditions of the Creative Commons Attribution (CC BY) license (http://creativecommons.org/licenses/by/4.0/).
Share and Cite
MDPI and ACS Style
Flores, N.; Paiva, A.C.R.; Cruz, N. Teaching Software Engineering Topics Through Pedagogical Game Design Patterns: An Empirical Study. Information 2020, 11, 153. https://0-doi-org.brum.beds.ac.uk/10.3390/info11030153
AMA Style
Flores N, Paiva ACR, Cruz N. Teaching Software Engineering Topics Through Pedagogical Game Design Patterns: An Empirical Study. Information. 2020; 11(3):153. https://0-doi-org.brum.beds.ac.uk/10.3390/info11030153
Chicago/Turabian StyleFlores, Nuno, Ana C. R. Paiva, and Nuno Cruz. 2020. "Teaching Software Engineering Topics Through Pedagogical Game Design Patterns: An Empirical Study" Information 11, no. 3: 153. https://0-doi-org.brum.beds.ac.uk/10.3390/info11030153
Note that from the first issue of 2016, this journal uses article numbers instead of page numbers. See further details here.