Article

Influence Factor Analysis of Bicycle Free-Flow Speed for Determining the Design Speeds of Separated Bicycle Lanes

1
College of Automobile and Traffic Engineering, Nanjing Forestry University, Longpan Road 159#, Nanjing 210037, China
2
School of Transportation, Southeast University, Dongnandaxue Road 2#, Jiangning Development Zone, Nanjing 211189, China
3
China Design Group Co., Ltd., Ziyun Road 9#, Nanjing 210014, China
4
School of Architecture and Transportation, Guilin University of Electronic Technology, Jinji Road 1#, Guilin 541004, China
*
Author to whom correspondence should be addressed.
Submission received: 3 September 2020 / Revised: 17 September 2020 / Accepted: 21 September 2020 / Published: 25 September 2020

Abstract

:
To provide a knowledge basis for updating the design speed in bicycle facility codes, this paper examines factors that influence bicycle free-flow speed. We investigated six segments of Nanjing’s separated bicycle lane and established a generalized linear model of the relationship between bicycle free-flow speed and bicyclists’ gender, age, bicycle type, lane width, bicycle lateral position, and travel period. With the model, we determined the statistical significance of each factor and assessed each factor’s impact extent. Through comparing the 85th percentile speeds of different groups, we proposed the recommended values and a method for calculating the design speed of separate bicycle lanes. The following results and conclusions were obtained: (1) The significant influential factors of bicycle free-flow speed were bicyclists’ gender and age, bicycle type, lane width, and bicycles’ lateral position. (2) Bicycle type had the greatest impact on bicycle free-flow speed, following by bicycle lateral position, gender, age, and lane width in sequence. (3) The recommended design speeds for separate lanes of less than 3.5 m and the wider lanes were 25 km/h and 30 km/h, respectively.

1. Introduction

In recent years, Chinese cities have experienced a noticeable increase in electric bicycles (EB), because of their higher speeds, flexibility, and low cost. By the end of 2017, EB ownership reached 250 million and is still growing at a fast rate [1]. Meanwhile, having replaced the conventional human-powered bicycle, EBs have become the dominant bicycle type in bicycle travel and have increased bicycle flow speed dramatically [2,3]. Accidents related to electric bikes have been significantly increasing [4]. In 2014, the death crashes of EB accounted for 7.8% of total fatal crashes, and it has become a serious social problem [5].
In contrast to conventional bicycles (CB), EBs are faster, heavier, and thus more demanding in terms of steering control. This means of transport is playing a more important role in commuting. EBs’ features and function in city travel propose the requirement for updating design speed in the current codes in China. In the Code for Design of Urban Road Engineering [6], design speeds for bicycle lanes are from 15–20 km/h. This interval is far less than the real operating velocity of bicycle flow, which consists mainly of EBs [7]. Besides EBs’ performance and role, travellers are another factor to consider for increasing the design speed of a bicycle facility. With urbanization quickly developing, citizens are experiencing increased traveling distances, forcing them to desire higher travel speeds. According to Dong’s survey about the citizens’ attitudes toward the maximum bicycle speed in Chengdu, 68% of those surveyed thought the bicycle speed maximum should be higher than 25 km/h [8]. Thus, updating the regulations about design speed of bicycle facility is a common requirement of vehicle and travel development.
Bicycle free flow speed (BFFS) is a speed when a bicycle is in the fully free condition. In a free operating situation, without any disturbances, a bicyclist acquires the maximum level of service and rides most comfortably. Thus, BFFS better reflects the natural property of a bicyclist’s riding behavior rather than non-BFFS. Generally, BFFS is higher than non-BFFS and is also the desired speed a bicyclist in a restricted condition wants to reach. Based the above reasons, it is appropriate to take into consideration BFFS as an important reference in determining the design speed of bicycle facilities. Therefore, transport engineers and administrators need an understanding of the characteristics of BFFS and its influential factors in order to choose suitable design speeds for bicycle facilities and EB production.
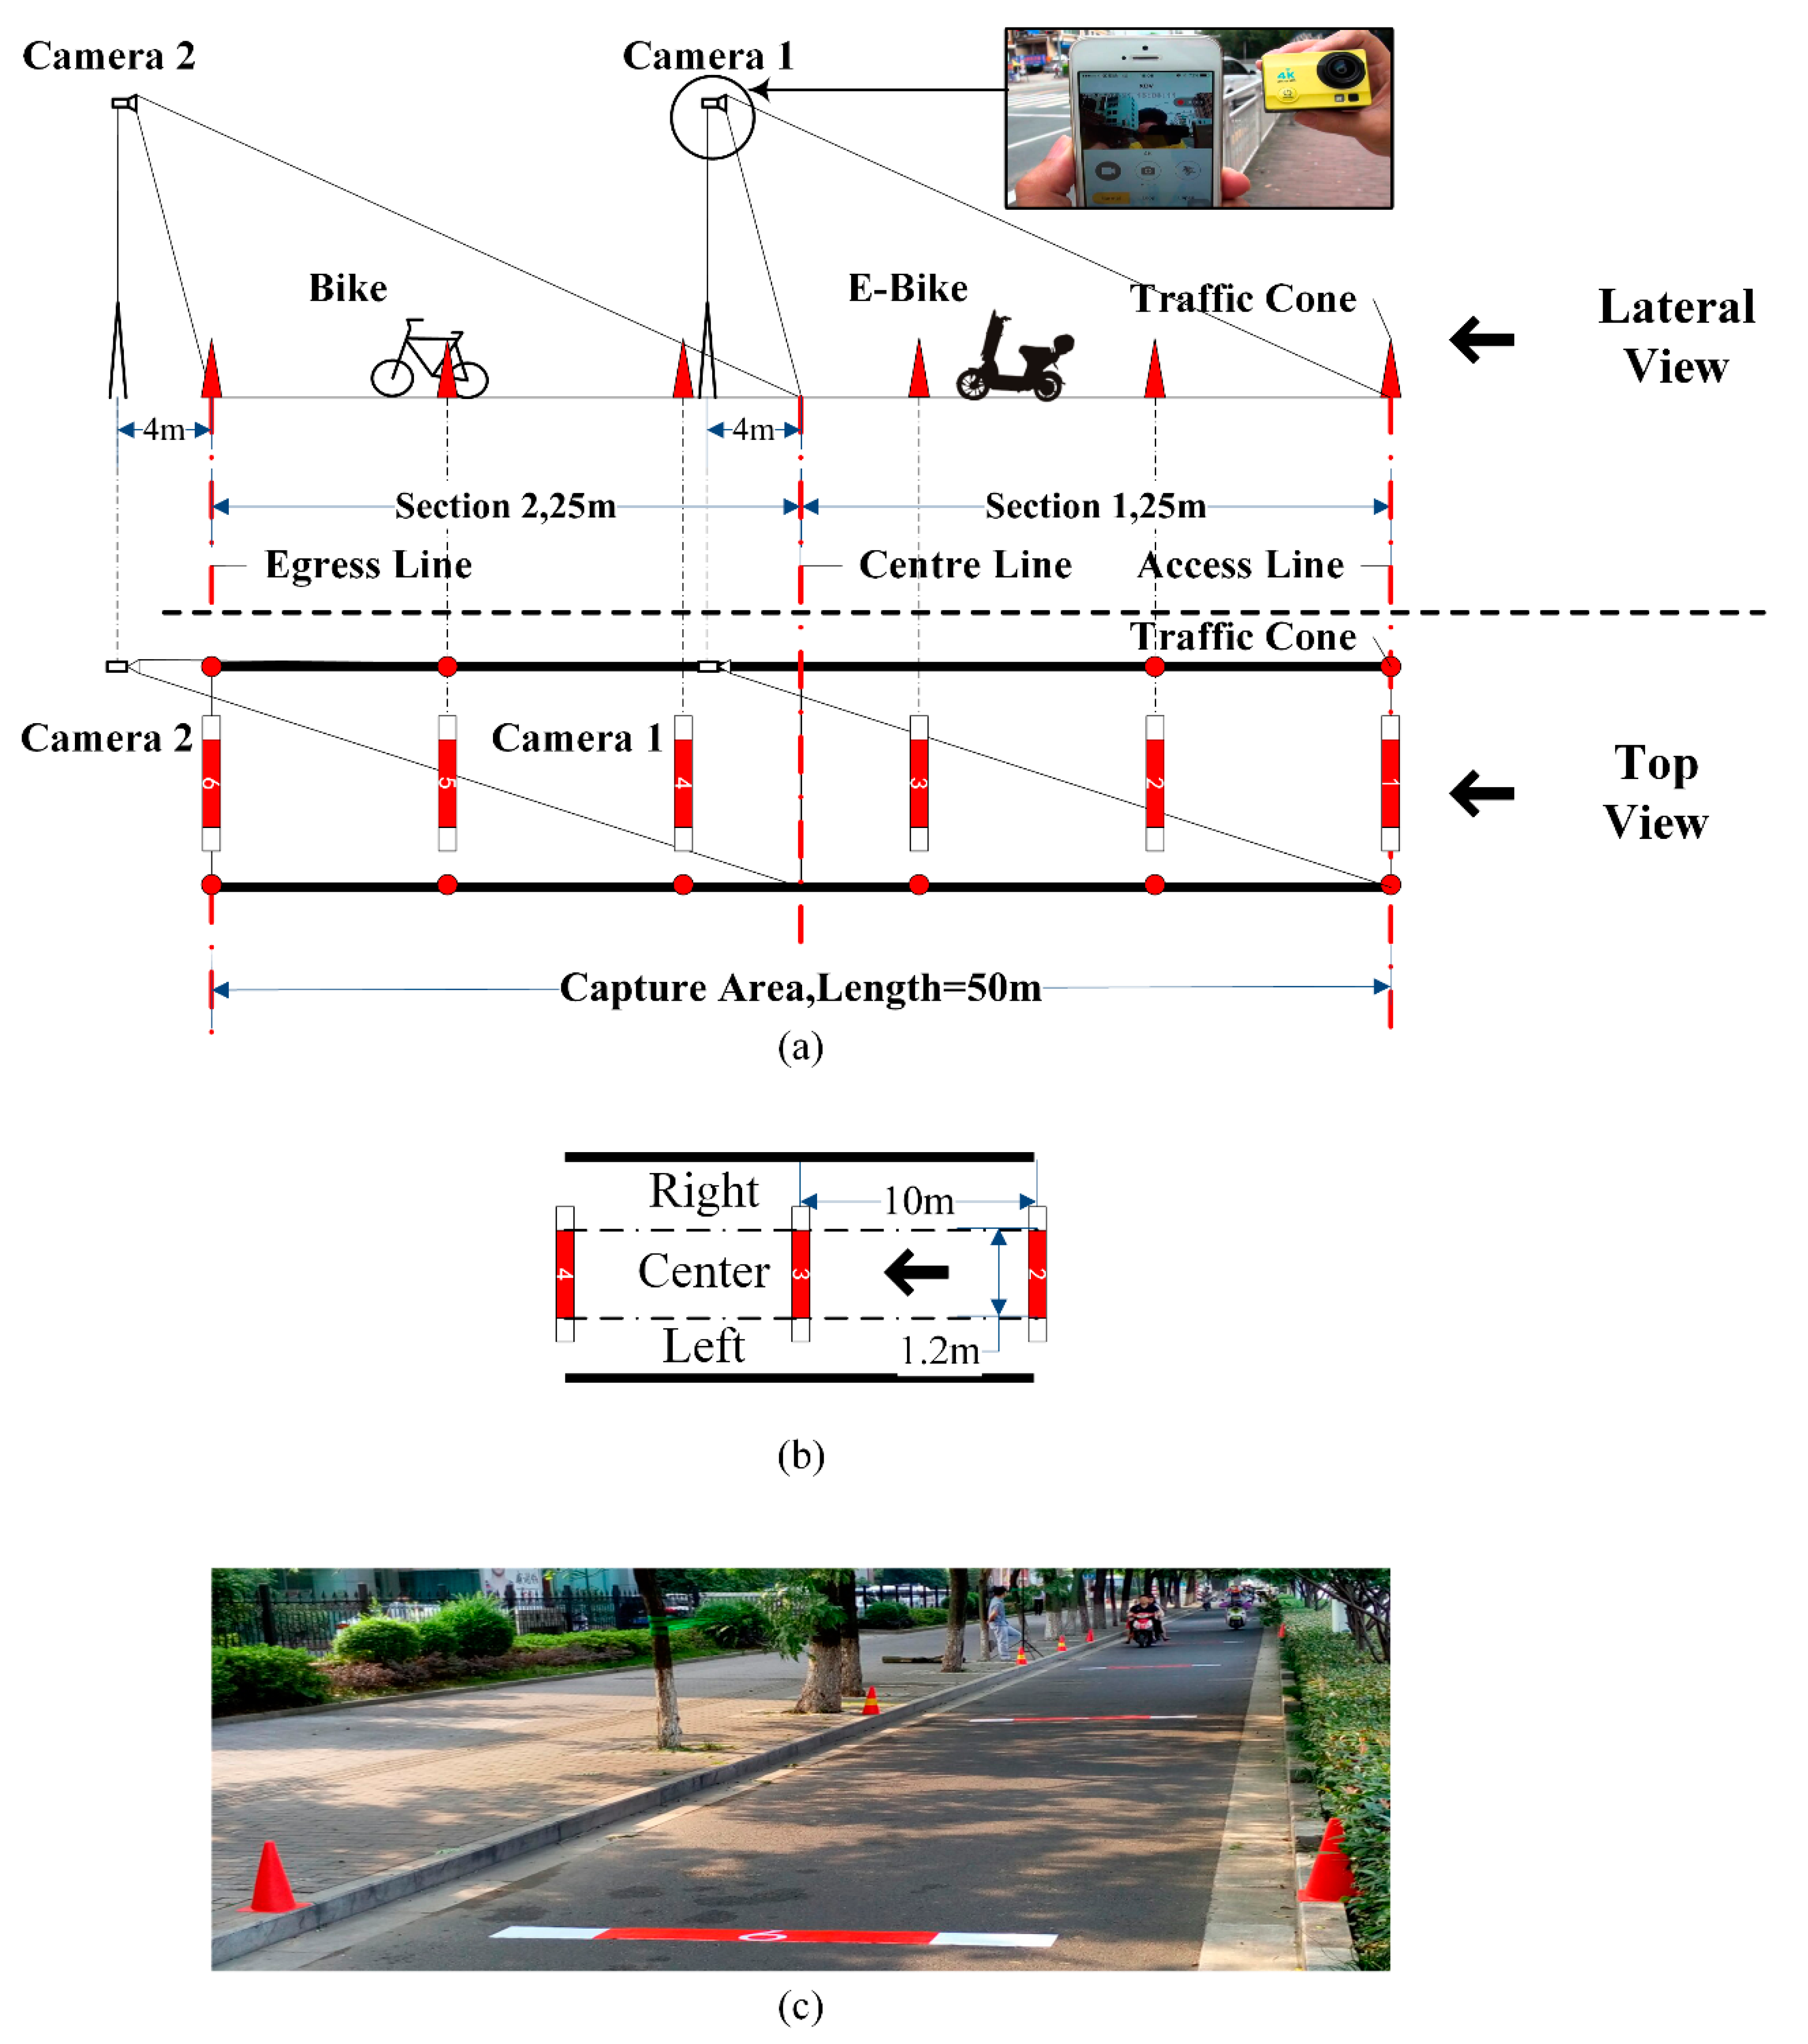
The objective of the paper is to examine the significant factors influencing bicycle free flow speed and to evaluate their individual impact degree. The facility we studied is a physically separated bicycle lane, a one-way operation and without sub-lane division. On this type of bicycle lane, there are no any lateral disturbances from other transport modes and meeting events. In this context, it is easy to observe the fully free riding of bicycle.
The rest of the paper is organized as follows. We first summarized the previous researches about BFFS and the design speed for bicycle facilities. The second section provides a brief description of the data collection and the generalized linear model (GLM) used. Afterwards, we discuss the influential factors of bicycle free-flow speed, the extent to which each factor impacts BFFS, and the speed differences between various groups. On the basis of these discussions, we propose recommended values for the design speeds of separated bicycle lanes.

2. Literature Review

2.1. Bicycle Free Flow Speed and Its Influential Factors

Speed is one of important parameters describing bicycle flow operation. Many scholars conducted research on it. We summarized the studies on free flow speed of CB and EB before 2017, which are listed in Table 1. We can see the velocities in the West are higher than those in China, many of which are even more than the speeds of EBs. There are two reasons for this: (1) In the US, Canada, and other countries, the bicycle is mainly used in recreation and sports while it is a major commuting tool in China. The different application purposes result in a speed gap. (2) Although in the Netherlands and other counties in western Europe people adopt bicycles to commute, the ridership there is considerably lower than that in China.
Direct factors influencing a bicycle’s speed involve vehicle characteristics, demographics of cyclists, and facility conditions, so knowledge about bicycle speed and how the factors above impact bicycle speed constitute the basis to determine a suitable design speed of a bicycle facility. However, few studies were found on this issue. Lin et al. performed a comparison study of the operating speed and its distribution between EBs and CBs and they discussed influence of riders’ gender and age on operating speed distribution [9]. Parkin and Rotheram reported the results of a study of a cohort of cyclists to determine their speed and acceleration characteristics relative to gradient and other influencing factors [10]. Jin et al. conducted a cycleway capacity study and they compared the speeds under different bicycle types, genders, ages, and the states of carrying something [7]. Also, Schleinitz et al. compared the speeds under different bicycle types and ages in Germany [11]. To sum up, the speed differences under general factors have been discussed deeply, but the previous studies did not explore the extent to which those factors impact bicycle speed. The influencing extent determines which factors will be considered primarily to propose design speeds of bicycle facilities.

2.2. Design Speeds in Domestic and International Bicycle Facility Guidelines

To understand design speeds of bicycle facilities better, this study compared the related regulations in the guideline documents of Europe, North America, Australia, and China in Table 2. These design speeds can be grouped into three categories: (1) local access routes and mixed traffic streets, with a speed distribution of 10–20 km/h, (2) commuter and through-cycle routes, with a speed distribution of 20–30 km/h, and (3) longer routes and routes in downhill areas, with a speed distribution of 30–40 km/h. Note that the design speed in China is distributed between 15 and 20 km/h and only bicycle-exclusive lanes reach 30 km/h. These numbers are far below their counterparts in the West. This partly results from the different application purposes of bicycles in China (utilization) and the West (recreation and sports). Moreover, current guidelines in China still consider conventional human-powered bicycles as the design vehicle even though EBs have been the main tool in bicycle travel.

3. Methodology

3.1. Data Collection

3.1.1. Field Collection

We investigated the bicycle operation using two cameras during commuting intervals in Nanjing: 7:00 to 9:00 for morning peak and 17:00 to19:00 for evening peak. Survey sites were chose based on the following criteria:
A.
Variety in bicycle lane width;
B.
Paved level terrain; good sight;
C.
Far from intersections, block accesses and bus stations;
D.
Suitable installing space for cameras.
According to the above and another one of our studies [36], the investigation selected six 50-m-long segments on Hunan Rd, Zhongshan Rd, Taiping North Rd, Longpan Rd, Zhongshan East Rd, and Zhongshan North Rd. All were separated bicycle lanes and their widths were 2 m, 3.4 m, 3.85 m, 4 m, 5 m, and 5 m, respectively.
The instruments used in our fieldwork included a 50 m tape measure, two wide-angle cameras (a type of wifi action camera that can be remotely controlled and viewed in real time on a mobile phone as shown in Figure 1a), two tripods, 12 red traffic cones, and six marking tapes. Each marking tape was custom built. The total width was 2 m and the centre part of 1.2 m was coloured with red to divide bicycle lanes into three lateral parts: left, centre, and right (see Figure 1b). The value of 1.2 m is the minimum operating width of a bicycle according to literature [13]. Bicycle lanes vary between 2 m and 5 m and are not necessarily an integer multiple of 1.2 m, so we painted the center 1.2 m of the sign strip red to observe the lateral cycling distribution of cyclists. The setting details for field observation are described in Figure 1a,c. A 50 m long segment was observed by two cameras, each capturing 25 m (Section 1 and Section 2, respectively) which is the maximum length of our device.

3.1.2. Data Extraction

When a bicycle entered the observing area, an investigator manually identified the rider’s gender, age (estimated), and the bicycle type. Specially, to address the estimating error of age, we divided all cyclists into three age groups (≤30 yrs, 30–40 yrs, and >40 yrs). Then, the investigator only needed to judge the age group of a rider. When each bicycle reached a marking tape, its lateral position and arrival time were recorded. The speed of a bicycle is computed by Equation (1), and the space headway between any two bicycles is calculated by Equation (2). We defined that one bicycle was in a free flow state when it met the following three conditions, as shown in Figure 2: (a) its lateral position was different from the nearest one ahead, (b) the space headway between them ( s h m n ) was more than its relative velocity ( v m n ) to the nearest one ahead, and (c) the two states above had not changed throughout the observation process. In this case, one cyclist is free to choose riding speed and lateral position. The processes of speed calculation and free flow state evaluation were completed with Matlab (version 2011b).
v n i j = 10 t j t i ,
s h m n = t h m n · v n ,
where v n i j speed of bicycle n between tape i and tape j; t i , t j moments that bicycle n reached tape i and tape j; s h m n space headway between bicycle m and bicycle n, bicycle m riding ahead; t h m n time headway between bicycle m and bicycle n; v n speed of bicycle n.

3.1.3. Data Summary

According to the data collection and extraction methods above, we collected 1370 pieces of BFFS data, accounting for 17% of the overall data. As indicated in Figure 3, among these bicyclists, 62% were male and the rest were female. Bicyclists aged less than 30, 30–40, and more than 40 accounted for 25.4%, 42.3%, and 32.3%, respectively. For vehicle type, EB dominated in total, and in each sample at about 71.4%. The data for bicycles’ lateral position on the bicycle lanes show that the center part is most used, making up 44.2% of bicyclists. The right part ranks after it with 38.2%, and the left is the least at 17.6%.
From Table 3, we can see the speeds in 12 samples are mainly distributed between 7 and 45 km/h. The mean of each sample is from 18 to 24 km/h. Speed standard deviation presents an ascending trend with the growth of bicycle lane width. The speed minimums of the 12 samples are similar and are distributed in (7, 11) km/h. As the bicycle lane width increases, the speed maximum shows an upward trend. To confirm the validity of our data, the means of EBs’ and CBs’ speed were compared with the counterparts in literature [9], 23.25 vs. 21.86 km/h for EB and 14.75 vs. 14.81 km/h for CB. It does not exist a significant difference.

3.2. Methodology and Model

By reviewing the previous related studies [7,9,10,11], vehicle characteristics (type and power) and demographics of cyclists, including bicyclists’ gender and age, are the common variables taken into consideration as the influential factors of bicycle speed. Moreover, lane widths, riding position, and travelling period are also examined for determining the design speed of bicycle facilities. These six factors are closely related with riding speed. Differences of gender and age perform directly in physical strength and speed choice. Bicycle type imposes an important impact on bicycle performance. Generally, EB is faster than CB. Lateral position determines the riding space of a bicycle. Travelling period is relevant to travel purpose when commuting cyclists ride in higher speeds than the leisure ones do. For these variables, lane width is continuous while the others are discrete. BFFS is a continuous dependent variable. For this situation, the generalized linear model (GLM) is suitable for modelling their relationship [37]. Here, the concrete form of GLM is:
V b s f = β 0 + β 1 · g + β 2 · a + β 3 · b + β 4 · t + β 5 · w + β 6 · l p
where
A.
V b s f : bicycle free flow speed, unit (m/s);
B.
g : gender variable, value at 1 or 2, 1, male; 2, female;
C.
a : age variable, value at 1, 2 and 3, 1, (20,30]; 2, (30,40]; 3, (40,60);
D.
b : bicycle type variable, value at 1 or 2, 1, EB; 2, CB;
E.
t : travelling time, value at 1 or 2, 1, morning peak; 2, evening peak;
F.
w : lane width, valuing from 2 m to 5 m;
G.
l p : bicycle lateral position, value at 1, 2 and 3, 1, left part of a bicycle lane; 2, centre part; 3, right part.
The stepwise regression method was used to calibrate the coefficients, where the choice of predictive variables was determined using an automated procedure. In order to evaluate the level of impact of each variable, the variations of root mean square error (RMSE), r-squared (R2), and adjusted r-squared (adjusted R2) for a model were recorded when a variable was added or removed.

4. Results and Discussions

4.1. Which Are the Significant Factors Influencing BFFS?

We performed a regression with the data from the 12 samples collected and established a GLM as indicated in Table 4.
The R-square of the model is 0.474, this means BFFS is moderately correlated with the six factors. The P-values of the model and all coefficients are below 0.05, so the model is significant. With respect to the level of impact of each variable, among these six variables, travel period covered the least, at less than 2% (see Table 5). To further and delicately confirm the significant influence of travel period on bicycle speed, analysis of variance (ANOVA) was performed on the speed data sets from the subcategories of the other five factors. The results are shown in Table 6. Except for cyclist gender, travel period had an insignificant effect on the speed of at least one subcategory of the other factors. Therefore, the effect of travel period on bicycle speed needs to be tested and supported by more data.

4.2. Influence Extent of Gender, Age Groups, Bicycle Types, Lane Widths and Lateral Position

Table 5 illustrates the contributions of different factors to the goodness of fit for our model. RMSE, R2, and adjusted R2 simultaneously show that bicycle type was on the top, at more than 50%. Bicycles’ lateral position, age, gender, and lane width follow, ranking in descending order. Traveling period contributed little, covering less than 2%. This means the first five factors explain the BFFS variation well by the total accumulated contribution at more than 98%.
In terms of the contribution to the goodness of fit of the model, bicyclists’ age was a little bigger than gender. However, the coefficient of gender was distinctly greater than that of age (0.534 VS 0.388). Therefore, gender had a greater effect on BFFS. In total, the five factors affecting BFFS, in terms of influence, are bicycle type, bicycle lateral position, gender, age, and lane width.

4.3. BFFS Comparison under Different Genders, Age Groups, Bicycle Types, Bicycle Lateral Positions and Lane Widths

Bicyclists’ gender and bicycle type both had two categories, and the ANOVA proved the speed differences between their subcategories. However, age, lane width, and bicycle lateral position had more than two groups or levels. Therefore, the ANOVA could not be used to determine the definite pairwise differences of the groups of a factor. Multi-comparing is useful to process the situation. Figure 4 indicates the results while Figure 4a shows that there is an overlap between the age groups of less than 30 years and 30–40, while the two do not overlap the group more than 40. Thus, the speeds of bicyclists aged less than 30 and 30–40 are not significantly different, while the situation is contrary between the two and more than 40. For the BFFSs on different widths of bicycle lanes, we can clearly see two separate distributions: the lanes of less than 3.5 m (2 m and 3.4 m) and the lanes of more than 3.5 m (3.85 m, 4 m, and 5 m). It is clear that the lanes of pairwise widths in each distribution have no difference in BFFS, but the two distributions do have speed distinctions (no overlap exists) (see Figure 4b). From Figure 4c, we see the BFFSs of the three positions of a bicycle lane are different.
According to the comparison above, age can be further grouped into ≤40 and >40. Speeds of bicycle lanes were divided into two distinct intervals of lanes of less than 3.5 m and more than 3.5 m. For different groups or levels of the influential factors, we calculated the velocity statistics as shown in Table 7. Through comparing the means of different groups of every factor, we found male was 12.41% higher than female in BFFS. Bicyclists aged no more than 40 drove 20.86% faster than those older when the speed of EB was 57.64% higher than that of CB. Bicycles on separated bicycle lanes of <3.5 m were 12.47% slower than those on wider lanes. When it comes to bicycle speeds of different lateral parts of a lane, the left was 10.72% higher than the center while the center was 26.31% higher than the right.

4.4. Suggestions and Recommendations for Separate Bicycle Lane and Electric Bicycle

According to the results in Table 7, we plotted the 85th percentile speed comparison figure of different groups in influential factors, as shown in Figure 5. Note that the maximum 85th percentile speeds of all factors are close to 30 km/h, as illustrated by the longest red line.
Through one-way ANOVA and multi-comparison, we divided lane width into two intervals: less than 3.5 m and more than 3.5 m. The 85th percentile speeds of the two were 24.52 km/h and 28.66 km/h, respectively. They stand closely at 25 km/h (the lowest red line) and 30 km/h. Because of this, we recommend setting 25 and 30 as the design speeds of separate bicycle lanes of ≤3.5 m and >3.5 m, respectively. Actually, 30 km/h has multi-group applicability and generality for bicycle lane design speed. As previously mentioned, it was a common value approached by the 85th percentile speeds of all bicycle groups. This means that even if bicycle flow formation changed in different cities or on different types of roads, 30 km/h is still a suitable upper limit. Moreover, other countries and regions usually adopted 30 km/h as the design speed for commuter bicycle facilities.
In the last paragraph, we proposed two general design speeds for separate bicycle lanes. However, for different cities and different classes of functional roads, the bicycle travel group is diverse. Therefore, it is reasonable to set a flexible design speed for a bicycle lane under different contexts. The diversity of bicycle travel groups is mainly represented in terms of demographics and vehicle type. According to the discussion above, bicycle type was the most influential factor on BFFS. Therefore, we primarily consider bicycle type when calculating the design speed for separate bicycle lanes. The formula to compute a design speed of lanes of ≤3.5 m and >3.5 m when considering bicycle formation is:
V N d e s i g n = 25.53 · p e + 17.47 · p c ,
V W d e s i g n = 29.56 · p e + 17.97 · p c ,
where, V N d e s i g n , V W d e s i g n : design speed for no more than 3.5 m of lanes and the wider. p e : estimated EB ratio on the designed bicycle lane, 25.53 and 29.56 is the 85th percentile speeds of EB on the lanes of ≤3.5 m and >3.5 m. p c : estimated CB ratio on the designed bicycle lane, 17.47 and 17.97 is the 85th percentile speed of CB on the lanes of ≤3.5 m and >3.5 m.

5. Conclusions

The study investigated basic segments on six bicycle lanes and established a generalized linear model governing the relationship between BFFS and bicyclists’ gender, age, bicycle type, lane width, bicycle lateral position, and travel period. With the model, we examined each factor’s significance and assessed the extent of each factor’s impact. Through comparing the 85th percentile speeds of different groups under every significant factor, we proposed general values and a calculating method for the design speed of separate bicycle lanes. We acquired the following results and conclusions:
A.
The significant factors on BFFS were bicyclist gender, age, bicycle type, lane width, and bicycle lateral position on a lane.
B.
Bicycle type was the most influential factor on BFFS, followed by bicycle lateral position, gender, age, and lane width in sequence.
C.
It was suggested that the design speed for the separated lanes of less than 3.5 m be 25 km/h and that the design speed for the separated lanes of more than 3.5 m be 30 km/h.
Our results and conclusions provide a basis for determining the design speed of separated bicycle lanes. Additionally, the observed results of the BFFS of different bicycle groups are a good numerical basis for the research on bicycle flow, especially for bicycle flow simulation. However, there are some deficiencies in our research. Road gradient was not included in the study. Moreover, the data extraction was performed by manual labour and the ages of cyclists were estimated, which impacts the accuracy of our model. These factors need to be improved with new popular methods like AI technology.

Author Contributions

Z.Y. undertook the data collection; X.Y. provided an interpretation of the results and wrote the majority of the paper; T.W. and H.B. contributed to the paper review and editing; X.Y. performed the software work of the paper; J.C. was the supervisor of the paper. All authors have read and agreed to the published version of the manuscript.

Funding

This research was funded by the National Key R&D Program of China (grant No. 2018YFC0704704), Natural Science Foundation of Jiangsu Province (grant No. BK20180775&BK20170932), Key Project of National Natural Science Foundation of China (grant No. 51638004), Fund for Less Developed Regions of the National Natural Science Foundation of China (grant No. 71861006) and Guangxi Natural Science Foundation(NO2020GXNSFAA159153).

Acknowledgments

The authors would like to express their sincere thanks to the anonymous reviewers for their constructive comments on an earlier version of this manuscript.

Conflicts of Interest

The authors declare no conflict of interest.

References

  1. Wang, T.; Chen, J.; Wang, C.; Ye, X. Understand e-bicyclist safety in China: Crash severity modeling using a generalized ordered logit model. Adv. Mech. Eng. 2018, 10. [Google Scholar] [CrossRef] [Green Version]
  2. Cherry, C.R. Electric Two-Wheelers in China: Analysis of Environmental, Safety, and Mobility Impacts; University of California: Berkeley, CA, USA, 2007. [Google Scholar]
  3. Fishman, E.; Cherry, C. E-bikes in the Mainstream: Reviewing a Decade of Research. Transp. Rev. 2015, 36, 72–91. [Google Scholar] [CrossRef]
  4. Wang, C.; Xu, C.; Xia, J.; Qian, Z.; Lu, L. A combined use of microscopic traffic simulation and extreme value methods for traffic safety evaluation. Transp. Res. Part C Emerg. Technol. 2018, 90, 281–291. [Google Scholar] [CrossRef]
  5. Wang, C.; Stamatiadis, N. Sensitivity analysis on new simulation-based conflict metrics. Saf. Sci. 2016, 82, 399–409. [Google Scholar] [CrossRef]
  6. Code for Design of Urban Road Engineering; Ministry of Housing and Urban-Rural Development of the People’s Republic of China: Beijing, China, 2012.
  7. Jin, S.; Qu, X.; Zhou, D.; Xu, C.; Ma, D.; Wang, D. Estimating cycleway capacity and bicycle equivalent unit for electric bicycles. Transp. Res. Part A 2015, 77, 225–248. [Google Scholar] [CrossRef]
  8. Dong, B. The Study of Characteristics of Electric Bicycle. Master Thesis, Tongji University, Shanghai, China, 2008. [Google Scholar]
  9. Lin, S.; He, M.; Tan, Y.L.; He, M.W. Comparison Study on Operating Speeds of Electric Bicycles and Bicycles Experience from Field Investigation in Kunming, China. Transp. Res. Record. 2008, 2048, 52–59. [Google Scholar]
  10. Parkin, J.; Rotheram, J. Design speeds and acceleration characteristics of bicycle traffic for use in planning, design and appraisal. Transp. Policy 2010, 17, 335–341. [Google Scholar] [CrossRef]
  11. Schleinitz, K.; Petzoldt, T.; Franke-Bartholdt, L.; Krems, J.; Gehlert, T. The German Naturalistic Cycling Study–Comparing cycling speed of riders of different e-bikes and conventional bicycles. Saf. Sci. 2017, 92, 290–297. [Google Scholar] [CrossRef]
  12. Miller, R.E.; Ramey, M.R. Width Requirements for Bikeways: A Level of Service Approach; Report 75-4; University of California: Davis, CA, USA, 1975. [Google Scholar]
  13. Department of Transportation. Safety and Locational Criteria for Bicycle Facilities; FHWA-RD-75-114; U.S. Department of Transportation: Washington, DC, USA, 1976.
  14. Homburger, W.S. Capacity of Bus Routes, and of Pedestrian and Bicycle Facilities; Institute of Transportation Studies: Berkeley, CA, USA, 1976. [Google Scholar]
  15. Vagverk, S. Bicycle Traffic Facilities. In Swedish Capacity Manual; National Swedish Road Administration: Borlänge, Sweden, 1977. [Google Scholar]
  16. China Highway and Transportation Society. Traffic Engineering Handbook; China Comunications Press: Beijing, China, 1998. [Google Scholar]
  17. Opiela, K.S.; Khasnabis, S.; Datta, T.K. Determination of the Characteristics of Bicycle Traffic at Urban Intersections. Transp. Res. Rec. 1980, 743, 30–38. [Google Scholar]
  18. Lui, Y. The Capacity of Highway with a Mixture of Bicycle Traffic. In Highway Capacity and Level of Service, Proceedings of the International Symposium on Highway Capacity, Karlsruhe, Germany, 24–27 July 1991; AA Balkema: Rotterdam, The Netherlands, 1991. [Google Scholar]
  19. Liu, X.; Shen, L.D.; Ren, F. Operational Analysis of Bicycle Interchanges in Beijing, China. Transp. Res. Rec. 1993, 1396, 18–21. [Google Scholar]
  20. Navin, F.P. Bicycle traffic flow characteristics: Experimental results and comparisons. ITE J. 1994, 64, 31–37. [Google Scholar]
  21. Botma, H. Method to Determine Level of Service for Bicycle Paths and Pedestrian-Bicycle Paths. Transp. Res. Rec. 1995, 1502, 38–44. [Google Scholar]
  22. Wei, H.; Huang, J.; Wang, J. Models for Estimating Traffic Capacity on Urban Bicycle Lanes. In Proceedings of the 76th Annual Meeting of the Transportation Research Board, Washington, DC, USA, 12–16 January 1997. [Google Scholar]
  23. He, M. Research on Micro Simulation Key Techniques for Mixed Traffic Flow. Ph.D. Thesis, Beijing University of Technology, Beijing, China, 2003. [Google Scholar]
  24. Li, X. Study on Driving Behavior Models of Non-Motorized Vehicles in Microscopic Traffic Simulation. Master’s Thesis, Nanjing Forestry University, Nanjing, China, 2010. [Google Scholar]
  25. Zhang, S. Traffic Characteristics and Safety Promoting Countermeasures of Mixed Bicycle. Ph.D. Thesis, Southeast University, Nanjing, China, 2011. [Google Scholar]
  26. Jia, H. The Research on Traffic Characteristics of Electric Bicycle. Master’s Thesis, Southwest Jiaotong University, Chengdu, China, 2014. [Google Scholar]
  27. Scottish Executive. Cycling by Design; Scottish Government: Edinburgh, UK, 1999.
  28. Highways Agency. The Geometric Design of Pedestrian, Cycle and Equestrian Routes; Highways Agency: Guildford, UK, 2005.
  29. Department for Transport. Cycle Infrastructure Design; Department for Transport: London, UK, 2008.
  30. CROW. Design Manual for Cycle Traffic; CROW: Ede, The Netherlands, 2006. [Google Scholar]
  31. Roads and Traffic Authority. New South Wales Bicycle Guidelines; Roads and Traffic Authority: North Sydney, Australia, 2003.
  32. Austroads. Cycling Aspects of Austroads Guides; Austroads: Sydney, Australia, 2014. [Google Scholar]
  33. American Association of State Highway and Transportation Officials. Guide for the Development of Bicycle Facilities; American Association of State Highway and Transportation Officials: Washington, DC, USA, 2012. [Google Scholar]
  34. Transportation Association of Canada. Bikeway Traffic Control Guidelines for Canada; Transportation Association of Canada: Ottawa, ON, Canada, 2009. [Google Scholar]
  35. He, K.; Zhu, Z.F. Code for Design of Urban Road Engineering; China Architecture & Building Press: Beijing, China, 2012. [Google Scholar]
  36. Yan, X.; Wang, T.; Ye, X.; Chen, J.; Yang, Z.; Bai, H. Recommended Widths for Separated Bicycle Lanes Considering Abreast Riding and Overtaking. Sustainability 2018, 10, 3127. [Google Scholar] [CrossRef] [Green Version]
  37. McCullagh, P.; Nelder, J.A. Generalized Linear Models, 2nd ed.; Routledge: New York, NY, USA, 2019. [Google Scholar]
Figure 1. (a) Setting details for field observation and wifi camera adopted; (b) track surface markings; (c) real photo for installation of traffic cones and marking tapes.
Information 11 00459 g001
Figure 2. Indication of a Bicycle in Free Flow State.
Information 11 00459 g002
Figure 3. Statistical Description of Field Survey Data.
Information 11 00459 g003
Figure 4. Multi-comparison Results for Velocities under (a) Different Age Groups, (b) Lane Widths and (c) Horizontal Positions.
Information 11 00459 g004
Figure 5. Eighty-fifth Percentile Velocities by Gender, Age, Bicycle Type, Lane Width and Lateral Position.
Information 11 00459 g005
Table 1. Speed of Bicycles from Previous Studies
StudyPlaceReport TimeLane ConditionFree Flow Speed (km/h)Literature
1California1975The 1st grade bicycle exclusive lane19.00 (CB) [12]
The 2nd grade bicycle exclusive lane17.70–20.10 (CB)
2California1976Bicycle exclusive lane17.70 (CB) [13]
3United States1976Bicycle exclusive lane24.00 (85%) (CB) [14]
4Switzerland1977Bicycle exclusive lane16.00–28.00 (85%) (CB) [15]
5Beijing1979–1981Mixing nonmotor-lane14.21 * (CB) [16]
Bicycle exclusive lane16.28 * (CB)
6Michigan1980Bicycle lane20.30 (CB) [17]
Bicycle exclusive path 24.90 (CB)
7China1991Various bicycle facility12 (CB) [18]
8Beijing1993General bicycle lane14.00 * (CB) [19]
9Canada1994Bicycle exclusive lane25.00 (CB) [20]
10Holland1995Bicycle exclusive lane18.00 * (CB) [21]
11Beijing1997Mixing nonmotor-lane13.90 * (CB) [22]
Bicycle exclusive lane18.20 (CB)
12Beijing2003Bicycle exclusive lane14.75 * (CB) [23]
13Shanghai2006Bicycle exclusive lane18.20 (EB),13.00 (CB) [2]
Kunming17.90 (EB),12.80 (CB)
14Shanghai2008Bicycle exclusive lane13.68 (CB),19.58 (BSEB), 20.16 (SSEB) [8]
15Nanjing2010Bicycle exclusive lane24.50–25.7 (EB),12.10 (CB) [24]
16Kunming2010Bicycle exclusive lane21.86 (EB),14.81 (CB) [9]
16Nanjing and Ningbo2011Bicycle exclusive lane20.30 (EB),13.90 (CB) [25]
17Chengdu2014Bicycle exclusive lane22.56 * (EB) [26]
18Hangzhou2015Bicycle exclusive lane13.48 * (CB), 16.48 * (BSEB), 17.22 * (SSEB) [7]
19German2017Bicycle lane16.10 (CB), 19.00 (BSEB), 24.90 (SSEB) [11]
Note: * indicates mean of operating speed of bicycle rather than free flow speed. BSEB = bicycle style electric bike; SSEB = scooter style electric bike.
Table 2. Design Speed of Bicycles Facility from Previous Studies.
NumberApplication Scenario or Suitable UsersDesign Speed (km/h)LiteraturePlaceCountry or Region
1longer routes30 [27]ScotlandWest Europe
commuter routes25
access routes20
2over short distances coupled with ‘SLOW’ markings10 [28]UK
other areas30
3commuter routes32 [29]UK
local access routes19
4general value20 [30]Dutch
through cycle routes30
where there are gradients and in the downhill direction35
5high operating speed range25–40 [31]New South WalesAustralia
medium range20–30
6wherever possible and desirable given the purpose of the path30 (minimum) [32]Australia
7relatively flat areas (grades less than 2%)30 [33]USNorth America
hilly terrain and sustained steeper grades48 (maximum)
8general value30 (minimum) [34]Canada
downgrade exceeds 4%50
unpaved paths25
9exclusive pathway30 [16]ChinaChina
separated bike lane20
marked bike lane15
mixed traffic10
10general value15–20 [35]China
Table 3. Statistical Results for Bicycle Free Flow Speed (unit: km/h).
NumberSitePeriodMeanMedianStandard DeviationMinimumMaximum
11Evening18.6117.78 4.64 10.91 30.92
2Morning19.6618.97 5.72 9.68 39.49
32Evening17.8918.47 4.79 6.95 33.44
4Morning20.5619.76 6.26 9.36 35.86
53Evening21.3521.46 6.19 8.35 42.05
6Morning22.6822.61 6.70 7.85 37.73
74Evening21.4920.30 6.80 9.22 39.46
8Morning21.3521.56 6.12 8.35 39.46
95Evening23.6223.62 7.34 13.79 40.46
10Morning22.9723.15 6.66 9.50 35.71
116Evening20.2320.48 6.05 7.78 35.32
12Morning21.7821.17 7.31 8.82 42.73
Table 4. Results of Parameter Estimating and Goodness of Fit for Generalized Linear Model.
VariableCoefficientP-ValueGoodness of Fit
gender−0.5344.56 × 10−250RMSE1.292
age−0.3882.94 × 10−13R-square0.474
bicycle type−1.8312.38 × 10−16Adjusted R-square0.471
travel period−0.2842.25 × 10−94F-value204.363
lane width0.2755.41 × 10−05P-value6.45 × 10−186
horizontal position−0.6698.34 × 10−13
intercept10.5891.67 × 10−36
Table 5. Contributions of Selected Factors to Goodness of Fit of the GLM Model.
CovariateRMSER2Adjusted R2
Contribution RateAccumulated ContributionContribution RateAccumulated ContributionContribution RateAccumulated Contribution
Bicycle Type56.8%56.8%58.0%58.0%58.3%58.3%
Lateral Position20.2%77.0%19.7%77.7%19.7%78.0%
Age8.3%85.3%8.0%85.7%8.0%85.9%
Gender6.5%91.8%6.3%92.0%6.2%92.2%
Lane Width6.3%98.1%6.1%98.1%6.0%98.2%
Travel Period1.9%100.0%1.9%100.0%1.8%100.0%
Table 6. Results of Parameter Estimating and Goodness of Fit for Generalized Linear Model (significance level = 0.05).
FactorSubgroupP-ValueSignificance
genderMale0.0072yes
Female0.0404yes
age(20,30] yrs0.0142yes
(30,40] yrs0.0044yes
(40,60) yrs0.5499No
bicycle typeEB0.0003yes
CB0.0902No
lane width2 m0.0992No
3.4 m0.0034yes
3.85 m0.1199No
4 m0.9916No
5 m0.0146yes
lateral positionleft0.1846No
centre0.0022yes
right0.0955No
Table 7. Velocity Statistics by Gender, Age, Bicycle Type, Lane Width and Lateral Position.
FactorLevelMean85% ValueMinimumMaximumGap
m/skm/hm/skm/hm/skm/hm/skm/h
GenderMale6.0921.928.0428.931.936.9611.8742.7312.41%
Female5.4219.507.1125.602.458.819.9535.81
Age≤406.1422.107.9028.452.779.9811.8742.7320.86%
>405.0818.296.8224.551.936.9610.9639.45
Bicycle TypeEB6.4623.258.0729.072.167.7611.8742.7357.64%
CB4.1014.754.9017.631.936.969.7735.19
Width≤3.5 m5.2718.996.8124.521.936.9610.9739.50−12.47%
>3.5 m6.0321.697.9628.662.167.7611.8742.73
lateral PositionLeft6.8524.668.6030.953.0711.0510.4937.7710.72%
Center6.1922.278.0228.862.699.6711.6842.06
26.31%
Right4.9017.636.4023.051.936.9611.8742.73
Overall5.8220.947.7327.841.936.9611.8742.73

