Leveraging Edge Intelligence for Video Analytics in Smart City Applications
by
 , , , ,
Aluizio Rocha Neto
1,2,* ,
,
Thiago P. Silva
1 ,
,
Thais Batista
1 ,
,
Flávia C. Delicato
3 ,
,
Paulo F. Pires
3 and 
Frederico Lopes
2 1
Department of Informatics and Applied Mathematics, Federal University of RN (UFRN), Natal 59078-970, Brazil
2
Digital Metropolis Institute, Federal University of RN (UFRN), Natal 58078-970, Brazil
3
Computer Science Department, Fluminense Federal University (UFF), Niteroi 24220-900, Brazil
*
Author to whom correspondence should be addressed.
Information 2021, 12(1), 14; https://0-doi-org.brum.beds.ac.uk/10.3390/info12010014
Submission received: 19 November 2020
/
Revised: 8 December 2020
/
Accepted: 11 December 2020
/
Published: 31 December 2020
(This article belongs to the Special Issue Smart Cyberphysical Systems and Cloud–Edge Engineering)
Abstract
:In smart city scenarios, the huge proliferation of monitoring cameras scattered in public spaces has posed many challenges to network and processing infrastructure. A few dozen cameras are enough to saturate the city’s backbone. In addition, most smart city applications require a real-time response from the system in charge of processing such large-scale video streams. Finding a missing person using facial recognition technology is one of these applications that require immediate action on the place where that person is. In this paper, we tackle these challenges presenting a distributed system for video analytics designed to leverage edge computing capabilities. Our approach encompasses architecture, methods, and algorithms for: (i) dividing the burdensome processing of large-scale video streams into various machine learning tasks; and (ii) deploying these tasks as a workflow of data processing in edge devices equipped with hardware accelerators for neural networks. We also propose the reuse of nodes running tasks shared by multiple applications, e.g., facial recognition, thus improving the system’s processing throughput. Simulations showed that, with our algorithm to distribute the workload, the time to process a workflow is about 33% faster than a naive approach.
1. Introduction
Since the advent of the Internet of Things (IoT) in the early 2000s [1], the Internet has become the central infrastructure for transporting all types of information, from simple text to complex multimedia streams, produced by both physical and virtual entities. Simultaneously, the proliferation of things (devices endowed with sensors and actuators) connected to the Internet has grown significantly and spurred the development of all kinds of applications. Nowadays, several types of devices with sensory and computing capabilities are increasingly present in people’s life. Smartphones and smartwatches are the most common, processing the personal sensing data and yielding valuable information to their users.
For several emerging IoT applications, a widely used sensing device consists of cameras scattered in public spaces capturing the events that occur in the monitored locations. The proliferation of this type of device has raised a specialized subset of IoT, known as the Internet of Multimedia Things (IoMT) [2], also called Multimedia Internet of Things (M-IoT) [3] or Internet of Media Things (IoMT), as proposed in the recent ISO/IEC 23093-1:20202 standard.
According to Cisco [4], by 2022, more than 80% of the global Internet bandwidth will consist of video traffic. A relevant part of this traffic comes from Intelligent Surveillance Systems (ISS) [5,6] deployed in smart cities and smart buildings. From these systems, it is possible to gather useful and actionable information related to the events occurring in the entire building or city.
In traditional ISS, a set of cameras send their produced streams to video analytic software running on powerful infrastructures (e.g., data centers) due to the high demand to process and store such massive data. An example of an ISS application, used in law enforcement agencies, is to find criminal suspects or missing persons in the context of a smart city. Face recognition technology applied to the city’s camera streams allows the identification of people of interest in public spaces. However, this event of identifying a given person is only valuable if the location of such a person is immediately reported to the competent authorities. Otherwise, the produced information may be useless as the person will no longer be in the reported location. This feature indicates the volatility of the data in IoT and points to the fact that processing this data for the production of relevant events depends on the speed of this processing. In this context, Forrester Research, Inc. [7] coined the term perishable insights to refer to information that must be quickly used at the expense of losing its value. It can be said that the knowledge produced by IoT devices in various application domains is perishable and events should be detected (and reactions taken from them) preferably over data in motion, as close to the moment of occurrence as possible.
In the example of ISS application, we mentioned the adoption of face recognition as the main technology to extract knowledge from data streams. Facial recognition is a challenging topic being investigated in both image processing and Machine Learning (ML) fields. Machine Learning is a research field of Artificial Intelligence (AI) that has recently been widely applied to application domains that depend on complex and massive data processing [8], such as ISS. Most ML techniques can recognize patterns within a large dataset. In the context of IoMT, for example, multimedia devices running ML algorithms can identify objects (e.g., a person’s face) within an image, or voice commands (e.g., “Ok Google” or “Alexa”) within an audio stream. The high-level abstraction data yielded by ML techniques can produce valuable insights to guide the automated decision-making processes [9]. The aim of adopting ML techniques in IoMT data processing is using data pattern models to make inferences about the content produced by a sensor device. For instance, in video surveillance, an inference (assumption) made by an ML model is detecting and classifying the content captured by monitoring cameras.
Most machine learning techniques, mainly when applied to massive data streams, are extremely demanding computationally. Therefore, in general, they run in high-performance computing or cloud computing environments. However, as mentioned above, in dynamic contexts such as the IoMT and where information is potentially perishable, the unpredictable latency of cloud environments is not suitable, as it can lead to obsolescence of the generated knowledge or the detected events. Moreover, in smart city scenarios with hundreds of cameras, this approach generates excessive traffic on the network backbone. A promising approach to deal with such issues is to explore the emerging paradigms of Edge and Fog computing. In Edge Computing [10], data streams are processed by heterogeneous devices located at the edge of the network to reduce bandwidth and latency. Another promising technique in this context is Multilevel Information Fusion (MIF) [11], traditionally applied to the sensor data processing as a method to filter raw data reducing overall communication and avoiding redundant processing. With MIF, a pipeline of tasks processes data according to the data abstraction level. Each task is responsible for transforming data from a lower to a higher abstraction level, reducing data volume to be processed at each level [12]. Moving these data processing tasks to the edge of the network allows minimizing the delays and network bandwidth issues that appear in cloud-dependent solutions.
According to Ramos et al. [13], moving the intelligence towards the IoT end-device introduces the notion of Distributed Machine Intelligence (D-MI). However, the authors mentioned that the current landscape of D-MI solutions presents some drawbacks that require further investigations. In particular, the lack of intelligence sharing among applications hinders the development of smart IoT systems. The authors argue that intelligence is tightly bound to the application that implements the MI, restricting the provisioning of ML methods to other systems, even in the same domain. For instance, in a smart building scenario, it is reasonable that the same facial recognition system is used both to unlock a door for an employee and to identify visitors in restricted areas, by checking if they are authorized to be there. Besides, the same inference system can feed multiple applications interested in the same type of event detected. An example would be a smart parking application authorizing vehicles entering by identifying the car’s owner and the same event feeding another application to register the presence of that person in the building. Many smart city service providers can benefit from sharing such distributed machine intelligence, improving the return of investment on smart solutions for governments and companies. However, strategies and solutions that promote intelligence sharing are not yet explored in the literature.
In addition to the challenge of promoting the sharing services for intelligence production in an edge assisted IoMT environment, there are other open issues that demand innovative solutions. ML methods to detect and identify objects of interest are voracious consumers of computational resources. Although, on the one hand, processing at the network edge reduces bandwidth consumption and latency, on the other hand, edge computing resources are limited and inferior compared to those found in cloud data centers. In this context, the following issue arises: how to process large-scale video streams to yield real-time events of interest using edge computing while meeting high-throughput criteria. To address this issue, it is necessary to propose a new strategy to distribute and allocate resources in edge nodes in an efficient and fair way, while meeting the applications’ requirements.
In this context, we present a distributed system for video analytics designed to leverage edge computing capabilities. Such a system offers the following benefits:
- (i)
- obtaining high-level semantic information from raw data by breaking the burdensome processing of large-scale video streams into various tasks;
- (ii)
- deploying these tasks as a workflow of data processing in MI processors near the stream producers to improve the usage efficiency of the edge node resources while keeping low delays; and
- (iii)
- improving the system’s throughput by leveraging the reuse of processors running tasks shared by multiple applications.
For Item (i), in previous work, we proposed the Multilevel Information Distributed Processing Architecture (MELINDA) [14]. MELINDA is a microservice architecture (MSA) [15] encompassing a set of software components to apply MIF and ML in multimedia stream processing. MELINDA components implement a method to classify and create the processing tasks according to the input data abstraction level. MELINDA also provides a decision mechanism to allocate adequate processing nodes to run each job with lower processing time. In this work, we go further and tackle Items (ii) and (iii). Item (ii) is addressed by allocating the workflow of tasks on edge nodes close to cameras (in terms of network-proximity). These nodes use embedded hardware accelerators for ML to speed up the inference process. In the created workflow, each node assumes the role of producer, worker, or consumer of messages. A message carries an image of interest collected by the producer and the sensor’s event data. To address Item (iii), the processing task that can be reused by multiple applications becomes an intelligence service (IS), such as an IS for identifying people. Various stream processing applications share the nodes running an IS. We developed an algorithm to deal with the load balance of nodes running IS and to achieve high-throughput.
The organization of this paper is as follows. Section 2 reviews the challenges and techniques related to video analytics approaches. Section 3 describes the proposed distributed architecture to deploy the processing subsystem on the edge tier. Section 4 introduces a running example to better demonstrate the proposal and evaluates its performance using some setups of processing nodes. Section 5 discusses related work. Finally, Section 6 provides the conclusions and future directions.
2. Background
Before discussing related works (Section 5), it is essential to understand the problems related to massive data processing (multimedia streams) that demand immediate responses. This section covers some challenges related to large-scale video analytics event-based applications and techniques recently developed to address them. The research community considers processing massive video streams as a Big Data problem, so several challenges are inherited from the Big Data field. Section 2.1 discusses some of them. Promising techniques to deal with Big Data and low-level data semantics are information fusion and machine learning. Section 2.2 discusses how these techniques can be applied to identify high-abstraction events of interest from video streams in smart city scenarios, also motivated by recent advancements in computer vision methods to transform raw multimedia data in knowledge performed by edge devices.
2.1. Processing Large-Scale Data Streams
The challenges introduced by IoT systems related to the data explosion phenomenon belong to three different dimensions: the generation, transmission and processing of data. Such aspects are typically associated with and addressed by three well-known research fields: Big Data, Big Data stream and data stream processing [16]. Big Data and Big Data stream refer to large and complex datasets and data streams, respectively, that require advanced data processing techniques. These fields involve several challenges that encompass capturing, storing, searching, transferring, analyzing, visualizing and protecting data [8]. One reason for this data explosion is that a plethora of applications are emerging, exploiting the diversity of real-time monitored data and combining them in different ways to provide value-added information to users. Examples of advanced and intelligent applications are smart home, smart building and smart city.
High data rate sensors, such as surveillance cameras, are one of the responsible for this trend of data explosion. The enormous proliferation of such a device has posed many challenges for communication infrastructure and data processing. Data scientists have used the term “5Vs” to characterize some issues related to Big Data: volume, velocity, variability, veracity and value. For video streams from surveillance cameras, data exhibit the following characteristics:
- Volume: The camera’s sensor resolution (quantity of pixels in width and height) determines the size in bytes of each frame. Most cameras use the following resolutions: HD (1280 × 720 p), Full HD (1920 × 1080 p) and Ultra HD 4K (3840 × 2160 p). Without compression, a Full HD frame (2,073,600 pixels) with the color of each pixel determined by the combination of three color bytes (RGB, Red, Green and Blue) is 6.22 MB in size.
- Velocity: This is related to the rate of data generation and transmission. In the context of the video stream, the unit used is FPS (frames per second). Most CCTV (closed-circuit TV) cameras use a frame-rate of 20 FPS. Thus, within 1 s, for a Full HD camera, we have 124 MB of data to process.
- Variability: This feature refers to the different data flow rates, which may vary from time to time or place to place. Many videos are manipulated in some compression formats to save on bandwidth and storage. The compression CODEC H.264 is quite common in the industry [17]. The CODEC compresses pixels that have not changed between subsequent frames. In this way, the more movement there is in the images, the less the flow compression will be. The bit rate of a Full HD camera at 20 FPS ranges from 4 to 32 Mbps [18].
- Veracity: One of the most important aspects of any data is that they are true. This importance increases when, for example, a smart city application uses the data to apply some decision rule, such as fining a vehicle for an illegal movement. To not leave room for doubt, the image of the license plate identifying the car must be of good quality, i.e., with high-resolution, ensuring the data integrity and accuracy required for the decision-maker.
- Value: The data to be processed must have some value; otherwise, their processing loses its meaning. In the context of surveillance cameras, most of the time they will be capturing only images of the monitored environment, that is, without any object that could generate an event of interest. Thus, some pre-processing scheme is required to filter out those frames whose processing is unnecessary. Generally, some motion detection technique works as a filter to gather the frames to be processed, and many modern cameras have this filter embedded.
Data stream processing is a paradigm that deals with a sequence of data (a stream) and a series of operations applied to each element in the stream [19]. To process complex video streams in a smart city analyzing the scenes captured by multiple cameras, one of the operations to do is filtering from the streams the data of interest. These data are represented by some objects, not belonging to the background image (showing the environment), doing some action that characterizes an event of interest.
The detection of events of interest from moving images (video stream) has been a challenge for decades to the scientific community working in computer vision [20]. In a smart city context, the processing results must be near real-time, and the response must be accurate and valuable. For instance, an intelligent transportation system might interpret the absence of traffic jams for a road, given the time of day, as a traffic anomaly caused by a car crash on another road that prevents vehicles from regularly driving. By combining the change of event patterns from multiple road sensors, it is possible to infer the accident location and redirect traffic to other regions.
In this context, the issue of translating such massive low-level semantic data (pixels of images) into high-level representations for humans (event of interest) is not a trivial operation and poses many challenges for the video stream processing infrastructure. Recently, to tackle these challenges, information fusion and machine learning techniques have been applied to classify and process data with different data abstraction levels producing valuable insights. The next section discusses these techniques in the context of video analytics.
2.2. Extracting Insights from Video Analytics
Most data stream processing techniques provide reactive actions by correlating data streams using predefined rules [21]. For example, a state in a traffic control application would be: “if a vehicle is making a non-permitted movement, then it will get a fine.” Considering that raw data to activate the rule are video streams from cameras watching traffic, this application should transform low-abstraction data (pixels of images) into pieces of high-level information (e.g., vehicle, non-permitted movement, etc.). Thus, the lower is the data abstraction level coming from sensors, the more difficult it is to write a rule representing a high-abstraction complex event. Multilevel Information Fusion (MIF) is usually applied to process data at various abstraction levels [11,22]. With the pipeline of processing tasks proposed by MIF, each task fuses the low-abstraction input data to extract as output some information at a higher level of abstraction. This approach, combined with Machine Learning (ML) methods, has brought significant benefits in sensor data processing, such as performing data dimensionality reduction and achieving greater precision in the information yielded [12].
The ML technique specially designed to recognize patterns in large datasets, is Deep Learning (DL) [23]. DL methods apply Artificial Neural Network to simulate how the human brain operates—a collection of neurons wired together, processing the data from our sensing organs collaboratively. Deep learning architectures such as Deep Neural Network (DNN) and Convolutional Neural Network (CNN) have been applied to many fields, including computer vision, audio recognition, speech transcription, and natural language processing. They have produced results comparable to human experts. Analyzing images for object detection and classification, a CNN model is generally the best method for this operation because of its translation-invariance property [24]. DNN might not learn the features that undergo minor changes in some images, such as a face’s rotation. Therefore, in the design of the MIF processing tasks for video analytics, CNN models are usually applied.
In [6,25,26], the authors examined multimedia data processing stages and how DL can be applied. Analyzing these works, we could identify the processing steps that handle the three data abstraction levels provided by the MIF technique when using CNN models. Measurement Level Fusion deals with the raw data stream loading, decoding and dimensionality reduction for processing only the image that contains some data of interest, e.g., an object detected. After the CNN model for object detection, depending on the application, it is necessary to identify the direction of movement (motion tracking) and the characteristics of this object, such as size, shape, color, etc. (feature annotation). In addition, in this level, the fusion of the imagery information with contextual data, such as timestamp, geolocation and camera identification, occurs. This information fusion is essential for a better understanding of the captured scene. Besides augmenting the meaning of the captured data, thus helping in the following inference/decision process, this processing stage also acts as a filter to reduce the volume of data transmitted and processed, which can decrease delay, bandwidth and energy consumption.
The next processing step corresponds to the Feature Level Fusion by identifying the objects or events of interest in the image captured in the previous step. In addition, using a CNN model for pattern-recognition, this feature extraction task reduces the image to specific regions or characteristics to decrease the amount of data that has to be processed. In the context of a smart city and smart building, applications are generally interested in pattern-recognition for identifying vehicles, pedestrians and people through face recognition.
The last processing step is related to the Decision Level Fusion. From the observation of several lower-level abstraction data, it is possible to infer a global view of the activities and events. From a simple counting of vehicles entering a parking lot to a complex phenomenon, such as a person trying to come in an environment he/she is not authorized to be, this processing stage can analyze and take some action accordingly. The decision stage uses the features extracted in the previous step to gain further information about the scene and infer valuable and actionable knowledge from that. Figure 1 shows a compilation of the processing tasks in video analytics for applications in smart cities/buildings.
Integrating all these processing steps in a single video analytics platform allows creating an autonomous and intelligent monitoring system for cities. In the past, humans performed these tasks. They needed to be watching events in all images from cameras scattered around the city. In addition to being imprecise and a tiresome task for humans, it was quite expensive because it usually involved many people in this monitoring process. Thinking of the potential that such autonomous monitoring systems have allied with recent advances in hardware resources, the industry has presented some initiatives to develop an ecosystem of distributed machine intelligence using edge computing [27,28]. With these initiatives, many of the image processing tasks are publicly available in pre-trained DL models developed by the research community and released in AI development frameworks, such as Intel OpenVINO [29], NVIDIA Jetson [30] and Google Coral [31]. Myriad smart applications and services have been developed with embedded CNN models to extract valuable insights from video analytics in smart city context, e.g., waste management [32], intelligent transportation [33,34] and parking lot management [35,36]. The next section presents our work in this context.
3. A Distributed System for Video Analytics Based on Edge Capabilities
Motivated by recent advances in edge computing and MSA for IoT [15], our research group proposed a strategy to distribute video analytics, leveraging the potential of new generation edge devices tailored for running deep learning techniques near the data sources. Our work is focused on smart city scenarios with a considerable number of cameras generating massive data streams to be processed. To tackle the issues related to real-time responsiveness in such scenarios, in our previous work, we developed Multilevel Information Distributed Processing Architecture (MELINDA) [14]. MELINDA is a three-tier architecture (Figure 2) that provides software components to break down the intensive processing duty of transforming raw data streams into high-abstraction events of interest. In [14], besides describing MELINDA software components, we proposed a method to classify and create processing tasks according to their data abstraction level and to distribute such tasks at the edge tier. In this paper, we extend our previous work and enhance MELINDA with mechanisms to achieve high throughput in this workflow of tasks. Moreover, we exploit and illustrate the benefits and feasibility of the intelligence service sharing.
First, in this section, we briefly present MELINDA and its main software components related to the work developed in this paper. A complete description of this architecture is in [14]. Next, before presenting our algorithms for deploying and distributing video processing workflow, Section 3.2 introduces the formal notation used to define the data types, entities and parameters used in these algorithms. Section 3.3 presents the algorithm for workflow deployment. Section 3.4 presents the algorithm to distribute the workload efficiently utilizing the paradigm of producer, worker and consumer of message queues.
3.1. MELINDA Architecture
One of the target applications for MELINDA is an intelligent surveillance system as the primary source of smart cities’ information. In such a scenario, many cameras are capturing the events related to some objects of interest, such as people and vehicles. Some of these events may require an almost immediate response from the system. In our previous work in the context of MELINDA, the proposed approach for video analytics encompasses three stages:
- he filtering of the video stream from cameras selecting only those frames that have the object of interest to feed the workflow;
- the identification of this object; and
- the interpretation of the event triggered by the object in the monitored environment for later decision making.
Performing all these processing stages in cloud data centers creates some issues, such as the massive consumption of network bandwidth when transferring images from the camera to the data center. This data transfer also increases the latency of the system response. MELINDA mitigates these issues by applying the multilevel information fusion (MIF) technique to split the processing job into multiple tasks, off-loading them at resource-constrained edge devices. A MIF based approach allows classifying each processing task according to the abstraction-level of the input data. In this approach, each of the three processing stages mentioned above is a processing task. Each task corresponds to one of the levels of data abstraction: measurement (filtering), feature extraction and decision making. Thus, we have three types of processing tasks: Measurement Level Tasks (MLT), Feature Level Tasks (FLT) and Decision Level Tasks (DLT).
Figure 3 presents MELINDA software components. Devices in the Sensors tier play the role of data sources. The Edge tier contains the edge devices responsible for running the processing tasks. The nodes in the Cloud tier are responsible for managing the entire system and orchestrating the execution of processing tasks on the edge nodes. In this way, we group MELINDA components in two subsystems, namely Management Subsystem (MS) and Processing Subsystem (PS). The PS encompasses the elements used in the edge nodes near the data sources to achieve high-throughput and decrease network overload. Thus, there will be several instances of these components; each instance running in an edge node. On the other hand, to achieve high reliability, the MS components are hosted in cloud nodes. Thus, there will be only one centralized instance of each element of MS for the entire architecture.
The Data Communication Manager component (colored green) is common to both subsystems. It provides the communication and standardization of the format of inputs and outputs of intelligent services and of the other types of tasks that compose a processing request for an application. The Stream Processing Service Delivery (SPSD) component is located in the Cloud and has two purposes: (i) to receive requests from end-users for the execution of a video stream processing application; and (ii) to receive requests from end-users to retrieve event data associated with video stream processing. When receiving a request for an application execution, this component forwards the request to the Intelligence Orchestrator (IO), which is responsible for choosing and allocating the processing nodes (edge devices) that meet the end-user request requirements. This component is essential to distribute the intelligence at the edge tier in systems with many heterogeneous devices. The processing request contains three types of tasks (MLT, FLT and DLT) and its configuration data, e.g., the addresses of the data sources and the expected maximum processing delay for that data processing.
The Intelligence Service Instance Manager (ISIM) keeps a list of intelligence services (FLT tasks) currently running on each node, allowing new requests for these services to reuse the already existing instances of them. The Processing Node Manager (PNM) is responsible for registering the processing nodes, keeping information about the location and hardware resources of each node. The IO uses this information to choose the nodes closer to the data source that have the required hardware resources for the requested tasks. In addition, PNM stores the resource usage information about each node (e.g., memory, CPU, GPU and storage). The Monitor obtains such information via periodic queries. The Processing Task Repository Manager (PTRM) offers a hub for storing and sharing descriptions of the processing tasks to manage their provision. PTRM also stores information about the required input and output parameters of each task so that it can attend multiple applications requiring such processing service. The Resource Allocation Manager (RAM) is the component that has a local view of all tasks running on the node. It receives requests from the IO to execute or stop a certain task (or an intelligence service). It uses the auxiliary component Resource Provisioning Manager (RPM) to perform the instantiation of a processing task. When the RAM receives a request for execution of a task, the request message contains the reference of the task allowing the RPM to fetch it from the PTRM and properly instantiate the task.
Considering that video stream processing requires different hardware resources, the Processing Task component executes tasks with the three levels of information fusion previously mentioned—measurement level tasks (MLT), feature level tasks (FLT) and decision level tasks (DLT). This organization facilitates the decision phase regarding the software architecture deployment in the hardware elements [37]. Each Processing Task component is a packaged code that implements a logic part of the video stream processing.
Finally, the Sensing Manager is the component in charge of abstracting the access to stream sources from the underlying tier, providing a service for the Processing Task component to gather raw sensing data.
Considering the software components defined in MELINDA architecture, in this work, we develop algorithms that implement the logic of two of these components. The first proposed algorithm is the core of the Intelligence Orchestrator component to perform edge node allocation. The second is the algorithm for distributing the processing flows via a broker for the Data Communication Manager component. In the next sections, we present these algorithm formulations and parameters.
3.2. General Definitions and Parameters
MELINDA specification includes an application model. In this model, the application requirements for video stream processing tasks are represented through a workflow. The workflow creates the notion of a logical plan [38] for executing tasks within a pipeline. This pipeline is represented as a Directed Acyclic Graph (DAG) consisting of data sources, processing tasks and data sinks [39], as shown in Figure 4.
The measurement level task has as input the raw stream obtained from a set of data sources of workflow defined as where represents a stream source (camera) and j is the number of cameras producing streams for this workflow. The output of an MLT task for the stream source is an image of interest message that is captured on time t. Each message is received by a node as input data, processed and forwarded as output data. This message contains the payload defined as where is the payload as a tuple of data items. Each task can add new data items in the tuple of output messages as a result of the input message processing. For example, the FLT tasks add information related to object identification.
Some jobs of object identification are processing tasks that can serve multiple workflows. In such cases, an instance of FLT defines an Intelligence Service (IS) as that can be shared by various applications. For example, people identification is an IS instantiated by a facial recognition FLT task. The Intelligence Service Instance Manager (ISIM) component keeps a list of IS currently available for application’s workflow. Finally, the application requesting the execution of the workflow must inform its maximum processing delay (MaxDelay) in seconds as a quality of service (QoS) parameter to be met. Hence, a workflow for an application with a set of data sources is represented as where might be an instance of . The tasks will be instantiated to run on a set of edge nodes when deploying the workflow.
When the Intelligence Orchestrator component receives a request to execute a new workflow , it has to check if there is enough processing capacity with idle edge nodes to process the flow of . The workflow data source represents a set of j cameras () transmitting multiple video streams. Each camera produces a certain quantity of frames per second (FPS) as a known parameter. Thus, the required processing capacity to process all streams of a workflow is represented by function as the sum of FPS of each camera.
The set of all edge nodes is defined as ... where n is the number of edge nodes registered on the Processing Node Manager component. The links among edge nodes are represented by .... From , we have two subsets: allocated nodes as ... and idle nodes as ..., having . The allocated nodes running the intelligence services is defined as .
For a given workflow , the Orchestrator must choose a set of edge nodes that can run the set of tasks . An operator is the implementation of a processing task that runs on an edge node. In this way, we have measurement level operator (MLO), feature level operator (FLO) and decision level operator (DLO). MLO and FLO operators perform deep learning (DL) tasks to detect and identify objects of interest in messages , respectively. Thus, to achieve low processing delays, these operators run on edge nodes equipped with hardware accelerators optimized for neural networks. On the other hand, DLO operator deals only with decision algorithms that are lightweight and it can run on an ordinary edge node.
The set of edge nodes have different image processing capacities measured in FPS. This capacity is associated with the DL task running on a specific node. Without loss of generality, we can assume that all ...∞ takes the same processing time on a given node . Therefore, function returns the capacity in FPS of node running task. To guarantee this capacity, a node can only execute one DL task per time. The reason for exclusive use is that this type of processing generally consumes all available hardware resources. The available idle capacity is given by function as the smallest value between the sums of capacities of nodes U for and nodes V for , having . The formal notation for function is given in Equation (2) where and are the sizes of U and V, respectively, and .
As an example of checking if idle edge nodes’ processing capacity can process the workflow’s volumes of images per second, consider the scenario in Figure 5a. In this example, the maximum FPS for and running on these edge nodes is presented in parentheses. Figure 5b presents the bipartite graph G to calculate the maximum flow in this nodes network, where stream sources are represented by vertex s and the sink DLO node by vertex t. For this example, , and .
The allocation of nodes should ensure that there will be no bottlenecks in processing that could lead to a steady increase in delays. If condition in Equation (3) is not satisfied, then the workflow demands processing capacity not available with the current set of idle edge nodes, and the application request to process will be declined. Otherwise, if Equation (3) is true, then there are two sets and of edge nodes that can process the workflow . In such a case, the orchestrator allocates the edge nodes to workflow as . Formally, , where , and is the set of edge nodes chosen to run , and , respectively. The network of allocated edge nodes for workflow is represented as the graph , where . Function (workflow processing time) calculates the expected maximum processing time (in seconds) of a workflow using the Equation (4). Considering the graph in Figure 5, the processing time would be 1/(8 + 16) = 0.041 s. To measure the network latency of a node , we use the function where is the input data source node for . This function checks how much time (in seconds) it takes a message hop from to and is calculated using Equation (5).
Finally, the orchestrator checks condition (6), verifying if the sum of the lowest processing time with the highest network latency is lower than the parameter informed on the application request. If this condition is not valid, then the orchestrator notifies the application that it is impossible to guarantee such a metric, despite having the capacity to process the entire flow.
3.3. Workflow Deployment
Requesting the execution of a workflow by an application requires the allocation of several edge nodes to distribute the processing tasks of the associated video streams. In this work, the node allocation represents a Deployment Plan (DP), and it is carried out by the Intelligence Orchestrator component. The allocation of image processing tasks to nodes must meet the requirements of low delay (considering the total processing time and network latency) and maximum throughput, allowing the use of all the computational capacity of the allocated nodes. The workflow deployment plan must also take into account the following requirements:
- The total processing time of MLT and FLT tasks at the respective chosen edge nodes must not exceed the MaxDelay attribute of the workflow.
- If the object identification task (FLT) is an intelligence service, it must be shared between different workflows to maximize their use.
Therefore, the ideal deployment plan is one that respects the processing capacity of each node and simultaneously processes an adequate number of flows for that set of allocated nodes. The application’s request for processing the streams has tasks that will be instantiated as operators running on the graph of edge nodes. An example of such an application could be a smart building system that unlocks the door when the camera fixed on it recognizes the people authorized to do so. The MLO node detects faces on camera stream and forwards that image of interest to FLO node running the intelligence service of facial recognition. The DLO node decides to unlock the door or deny it depending on the person identified by the FLO node.
Algorithm 1 shows the intelligence orchestrator component’s provisioning mechanism to deploy a new workflow request . Function (Line 1) returns a tuple of nodes from consisting of two sets of nodes for MLO and FLO operators capable of running and , respectively, and one sink node to run . Line 3 is the check condition represented by Equation (3) when the workflow demands processing capacity not available with the current set of idle edge nodes. Function (Lines 4, 6 and 8) selects a subset of the nodes set informed on its first parameter with enough capacity to run the task (second parameter) for the flow volume given as third parameter. The condition on Line 5 checks whether the is an intelligence service and whether edge nodes are running this service. After selecting the nodes, the orchestrator observes if the workflow processing time is below the maximum delay informed in the request (Line 12), deploying it if positive. Otherwise, the orchestrator notifies (Line 15) the application that it is impossible to meet the tolerable delay with current idle nodes.
| Algorithm 1: Orchestrator workflow provision |
 |
3.4. Workload Distribution
In our work, the workflow deployment plan is a strategy for creating a distributed processing infrastructure, such as a cluster. As in most cluster frameworks, we needed a load balancing mechanism that guarantees the best throughput meeting dynamic processing demand, since the FLO nodes run on-demand processing. Only when some MLO node produces an image of interest message (), an FLO node processes it. In addition, an FLO node may be executing a task in such a way that messages from different workflows are competing to be processed on the same node. To prevent overload in FLO nodes and avoid bottlenecks in the processing flow, we developed a load balancing mechanism for making the best possible usages of the available resources at these nodes.
Our load balance approach uses the pattern of messages queue. We created a specialization of the Data Communication Manager component as a broker to control the load balancing. Figure 6 shows the workflow nodes organization. MLO nodes are the message producers, FLO nodes are the workers and one DLO is the final consumer of the processing flow. Simultaneously, FLO nodes might be serving the same intelligence service to another workflow. MLO nodes are continually analyzing the video stream, processing each frame from the data source to detect the object of interest. Since the broker and the DLO operator’s tasks are lightweight processes compared to those of the MLO and FLO operators, the broker and DLO operator will be running on the same edge node. Having a broker for each workflow has the benefit of isolating data from different applications in different message queues at each broker.
The broker uses two message queues to receive all messages produced by the MLO nodes (producers) and forward them to the final consumer, the DLO node. The producers feed the input queue, and the broker delivers the messages in the output queue to the consumer. To route the producer’s messages to the broker, ensuring parallelism and agility in the communication between them, we use the PUSH–PULL messaging pattern. Although the broker is on the same node as the consumer, we chose leaving the interaction between them based on the PUSH–PULL mode, thus allowing easy separation if they need to run on different nodes. The broker’s communication with workers is through the REQUEST–REPLY pattern based on the traditional client–server paradigm. In this case, the broker is a client of the workers’ processing service, requesting the messages in the input message queue and putting the replies in the output message queue.
Algorithm 2 presents the broker’s load balance mechanism to control the messages’ distribution to FLO nodes. As these nodes can have different processing capacities, the processing of a message in a given node cannot delay processing the next message in the queue. Thus, we use the thread-based parallelism technique to treat the various messages that arrive in the input queue through the processing on different nodes simultaneously. There will be one thread to communicate with each FLO node. All threads read from the input queue the first messages concurrently arrived from the producers. The input and output queues are FIFO queues (First In, First Out). The thread that connects to a fast FLO node will have its reply before the others so that it will be able to read and forward more messages than a thread with that slower node. The broker also creates a thread to deal with the DLO node, and its job is to read the output message queue and forward messages to that node. Lines 2–13 are the main broker code and Lines 14–27 are the threads’ procedures. To receive the image of interest messages (), the broker uses the function to create an object representing a buffer and a listening port where the producer connects to push the messages. Function represents the object on the other side of this communication pattern. Its send method is blocking, i.e., it waits for the reply of the request. When the worker thread receives the reply message from FLO node, it adds to the respective the payload as a new data element (Line 19).
| Algorithm 2: Broker’s load balance mechanism |
 |
4. Evaluation
This section presents the experimental evaluations of our proposal. First, we developed a smart application to evaluate the processing time of running deep learning algorithms on edge nodes. The processing times were analyzed using real edge devices equipped with accelerators for neural networks. Once obtaining the operators’ processing times, we then used them in the YAFS simulator [40] to scale up for a scenario with many cameras and processing nodes. With this simulator, we could evaluate the proposed algorithms capacity of meeting the requirements high-throughput in video analytics on the edge tier.
This section is structured as follows. Section 4.1 presents a running example consisting of a smart application that makes use of an intelligence service for facial recognition. Section 4.2 presents the methodology used to plan and execute the performed experiment. Section 4.3 describes the experimental setup, showing the parameters used in the simulator. Finally, Section 4.4 presents the results obtained from the simulations.
4.1. Running Example
The scenario used as a running example consists of a smart building with cameras scattered in open spaces monitoring people’s circulation. In such an environment, edge nodes are in the same camera’s network and equipped with hardware accelerators for Edge AI. The hypothetical smart application monitors the access of unauthorized persons to the restricted areas of the building. An example of an event of interest is detecting a visitor on a floor where he/she is not authorized to be. In such a situation, the security system receives an alert from the application. To evaluate the facial recognition algorithm, we used a public dataset of faces available in [41] containing 7900 images of 395 people. Hence, the application’s workflow is composed of the following tasks:
- Face Detection as the measurement level task (MLT): The object of interest is people’s faces. When this task detects faces in the video stream from the cameras, it generates an image of interest message () containing the frame with these faces and contextual data.
- Face Recognition as the feature level task (FLT): It recognizes people in the image of interest from the detected faces, generating an event.
- Decision Rule as the decision-level task (DLT): It employs the application’s decision rule in the detected event. The decision rule is to check if the identified person is authorized to be in that restricted area of the camera, alerting the security system if necessary.
For each task, we developed an operator that encapsulates the task program/source code and additional files, such as the DL model file used in the inference processes for MLT and FLT tasks. In this way, an operator is an implementation of processing microservice deployed on edge nodes. The measurement level operator (MLO) that implements the face detection task uses the neural network model known as SSD MobileNet [42] to capture frames containing the object of interest (faces) from camera video streams. This operator generates an message when it detects a face in video frame from camera at the timestamp t. The feature level operator (FLO) implements the facial recognition task. FLO uses the neural network model FaceNet [43]. This model learns a mapping of face images to a compact Euclidean space, where distances correspond directly to a measure of face similarity. This operator implements the facial recognition intelligence service. Thus, it can process concurrently image messages from different workflows. The decision level operator (DLO) interprets the event yielded and responds accordingly.
To run the operators, we prepared three edge devices. Two devices to run the MLO and FLO operators are equipped with accelerators optimized for running artificial intelligence algorithms and one device to run the DLO operator. The device for MLO is a Raspberry Pi 4 (quad-core ARM CPU, 4GB RAM) equipped with a Google Coral Edge TPU accelerator plugged into a USB-3 port. The device for FLO is an NVIDIA Jetson Nano (quad-core ARM CPU, 4GB RAM, NVIDIA Pascal 128-CUDA-core GPU). The third edge device is a Raspberry Pi 3 (quad-core ARM CPU, 1GB RAM) to run the DLO operator. As the video stream source, we used an IP camera generating Full-HD images (1920 × 1080 pixels) at 20 FPS with H.264 compression. A region of interest of 500 (width) × 420 (height) pixels within the video frame was defined, representing the ideal position to capture people’s faces passing by the camera. The MLO operator accesses the camera’s stream via the Real-Time Streaming Protocol (RTSP). Table 1 shows the operators’ processing time in seconds running on these edge nodes.
For image manipulation, we used the OpenCV library [45]. We implemented the broker that ensures communication between edge nodes using the ImageZMQ library [46], derived from ZeroMQ [47], to handle the transport of OpenCV image data structures. The ZeroMQ library provides a single socket API (application programming interface) for message queues that is light and fast. It automatically reconnects to peers as they come and go, and queues messages at both sender and receiver, as needed, doing all I/O in background threads. We also measure the average delay (107 ms) of the workflow, i.e., the sum of processing time and network communication.
Despite the importance of this running example, it is necessary to test our solution in a larger scenario, for example using several edge nodes and cameras scattered across a smart city. Therefore, considering the values of processing times obtained in the example, the next sections present the simulations performed for larger-scale environments.
4.2. Evaluation Methodology
Before proceeding with the simulations, it is essential to define their objectives. We are interested in evaluating how FLO nodes running an IS are efficiently shared, considering that the broker invokes an FLO node only when an MLO node yields an image of interest message. In addition, we must analyze our strategy of using the paradigm of producer–consumer of messages implemented by the broker algorithm to achieve the highest throughput with the lowest number of workers. For these evaluations, we defined the metrics presented in Table 2.
To calculate the maximum processing time of a workflow for an from any producer passing by the broker and a worker to the consumer , MWT is defined as the sum of the workflow processing time () with the network latency (). NL function calculates the maximum network latency checking the time for three message hops, MLO node → Broker → FLO node → DLO node, disregarding the small reply message from FLO node to the Broker.
Considering the set of times ..., where is the time for a to travel from the producer to the consumer and is the number of messages produced during simulation time (ST), we define function as
The DMR metric is defined as
To evaluate the load balance among the set of nodes running an intelligence service , Equation (10) defines the workload of a node , where is the number of messages processed by node during simulation time (ST).
Therefore, the average workload of all FLO nodes is calculated in Equation (11) where q is the size of .
Metric WB calculates the workload balancing as the standard deviation of the total workload of FLO nodes (Equation (12)).
In this way, the smaller is the value of the , the more balanced is the workload of each edge node. Finally, the processing throughput (PT) metric is the division of the number of messages produced () by simulation time (), and defined as
4.3. Experimental Setup
We conducted two experiments (E1 and E2) to evaluate our proposal. In the first experiment, we performed four simulations varying the number of FLO nodes and the generation rate of images of interest yielded by MLO nodes when processing the video frames. This experiment intended to identify an acceptable limit of processing delays when reducing the number of FLO nodes to reflect the actual frequency of occurrence of events in those workflows. Experiment E2 intended to evaluate the workload balance developed using the paradigm of producer–consumer of message queues when the workers (FLO nodes) have different processing capacities.
The results were obtained from simulations using the YAFS simulator [40]. YAFS is an open-source simulator and provides libraries of graphs and discrete event simulation that allow communication between nodes for any topology. The network topology used in the simulations was composed of cameras and edge devices connected in a Fast-Ethernet network (100 Mbps). The YAFS configuration parameters for edge nodes processing capacities are the same as the devices used in the running example section. Table 3 presents these parameters.
4.4. Results
In Experiment E1, we used the processing times from the running example (Section 4.1) and created two workflows running simultaneously and sharing the FLO nodes serving the IS. Each workflow had two cameras with 20 FPS each, demanding 80 FPS as processing capacity requirement. In addition, we considered MLO nodes with 40 FPS as capacity, meaning that an MLO node could process frames from two cameras. We simulated different probabilities of a frame being an image of interest (100%, 50%, 25% and 10%) and varying the number of FLO nodes. The probability model used in YAFS to decide if a frame contains an image of interest is randomized. Therefore, during the simulation at some moments, there may be frames from all the cameras that are images of interest (peak demand). Thus, at these moments, the MLO nodes generated a demand equal to that produced by the cameras. Figure 7 and Figure 8 show the results obtained for Experiment E1.
Figure 7a illustrates the workflow time observed in a 100% image propagation by the MLO nodes when processing the video stream from the set of cameras. In this situation, all 80 frames generated per second are images of interest, and the MLO nodes create an IIM message to process each one. As expected, four instances of FLO nodes (workers) are required to handle the stream produced by the cameras, with a maximum workflow processing time (MWT) around 107 ms. The perceived delays in MWT shown in Figure 7 occur when fewer workers are processing a demand greater than their processing capacity. In this case, messages are queued in nodes and processed with additional delays.
A situation in which all the frames in the video stream are images containing objects of interest is improbable. Thus, using a sufficient number of FLO nodes to process this volume of messages that does not happen in practice ends up leaving these nodes idle. To evaluate how the number of FLO nodes can be reduced when the IIM generation rate is lower, we ran other simulations with three variations of these parameters. When 50% of the frames are images of interest (Figure 7b), reducing to two FLO nodes is enough to process the messages with a MWT of up to 245 ms. Figure 7c shows the scenario when the probability of IIM generation is set to 25%. Only one FLO node is not able to keep MWT under 200 ms. Finally, using a 10% probability, Figure 7d shows that two FLO nodes are sufficient to keep MWT within 107 ms in almost all simulation time. There were a few situations (3% of the measured data), where MWT was greater than 107 ms. This behavior occurs due to the probabilistic distribution used to make a frame as an image of interest.
Figure 8a–d shows the values calculated for the DMR metric with the same parameter variations applied to the MWT metric. Figure 8a shows that, if all the camera frames are images of interest, any smaller number of nodes will cause a constant increase in the number of delayed messages. Having half the frames being of interest (Figure 8b), the reduction of only one node maintains an acceptable DMR. If percentage of frames of interest is up to 25% (Figure 8c,d), then two nodes are sufficient to process the workflow, maintaining an acceptable DMR of around 20–25%. Having the 10% rate of generation of images of interest, MWT was never more than 129 ms despite delays in message processing. Therefore, it is possible to use a configuration with fewer FLO nodes for those applications with a reasonable tolerance to delays. These results allow us to conclude that in situations where not all frames are images of interest, it is possible to share FLO nodes even if the sum of their processing capacities in FPS is less than the demand produced by the cameras.
In Experiment E2, to evaluate WB and PT metrics, we used two workflows running simultaneously and sharing three heterogeneous FLO nodes serving an IS. Each workflow has two cameras with 20 FPS each, demanding 80 FPS as processing capacity. We also considered two MLO nodes with 40 FPS of processing capacity, and the simulations have two different sets of FLO nodes with different capabilities. In this simulation, we considered each video frame as an image of interest. We ran simulations to process 100, 300, 600 and 1000 . Figure 9 shows the results for Experiment E2.
Figure 9a shows the results for workload balance (WB) metric using FLO nodes with 40, 20 and 10 FPS as processing capacities. MELINDA’s broker performed the load balancing better than a Round Robin solution (RR). A RR makes an equal distribution of messages among workers. However, in a scenario with heterogeneous edge nodes, faster edge nodes can be idle for processing too fast. At the same time, another message waits in the queue of a lower edge node. Figure 9b presents a scenario where there is a 6× difference in processing capacity from one edge node to another (60, 30 and 10 FPS). With MELINDA broker, in both scenarios, the fastest edge node processes more messages than the lower nodes, keeping all nodes processing messages according to their capacities.
The load balancing technique used in MELINDA controls the workers’ workload. It assigns a new message only if a worker can process it, avoiding the accumulation of messages in queues. Besides, the load balancing technique improves throughput since more messages are processed in a given time interval. Figure 10a shows the processing throughput (PT) calculated for FLO nodes with 60, 30 and 10 FPS as processing capacities. PT achieved over 90 messages per second. Using RR, the PT metric was around 63 messages per second.
Using MELINDA, the processing time by the set of FLO nodes with capacities 40, 20 and 10 FPS was about 15% lower when compared to a RR technique. However, when there is a significant disparity between the capabilities of the FLO nodes, MELINDA’s time to process the messages is about 33% faster than a RR solution, as illustrated in Figure 10b. MELINDA took 1100 ms to process 100 messages while the RR technique took 1640 ms. These results show that MELINDA improves system throughput.
5. Related Work
There is a consensus in the research community that video analytics will drive the development of a wide range of smart applications [48]. With the rapid evolution of hardware, the adoption of edge processors embedded in cameras or near them is a promising approach to meet the real-time requirements of large-scale live video analytics [49]. In this context, this section presents recent papers that explore the potential of edge computing by creating architectures for distributed video stream processing.
In [22], the proposed architecture creates a cluster of edge devices to process stream images (video) in parallel. The authors implemented the solution using Apache NiFi [50], where a chain of processing jobs represents a data flow. Each task is a processor performing a data operation with an input and an output network port, which serves to interconnect the processors, thus creating a data flow topology. To evaluate the performance of the proposed system, the authors developed a prototype of an intelligent surveillance system (ISS) to recognize persons by their faces from CCTV-cameras. They also assessed the strategy of splitting the dataset of known faces in small subsets with each edge node responsible for searching the detected face in its own subset. Compared with a similar cloud-based solution, the delay obtained with the edge processors was up to five times lower when using a complete training set on all nodes, and nine times lower when using separate face subsets given to each edge node. Despite the positive results, the work had some limitations arising from Apache NiFi architecture. Similar to our proposal, Apache NiFi also uses a data flow based programming model, in which each processor performs part of the processing, in the form of a pipeline. However, it suffers from a limitation in the communication model between the nodes of this data flow. One node cannot communicate with another in the opposite direction to the pipeline, that is, a node cannot send, for example, a processing status message to the node before it in the direction of the flow. Our architecture does not have this type of limitation regarding the directionality of communication between nodes. Our proposal adopts a very flexible communication model, based both on the request–reply pattern (when the broker needs to consume the processing services of workers—FLO nodes) and on push–pull for the normal flow of messages in the data flow.
Ledakis et al. (2018) [26] and Ali et al. (2018) [25] proposed similar architectures for distributing large-scale video analytics utilizing a three-layer processing system with processors at the edge, fog (cloudlet) and cloud. In both works, edge devices were used only for the video stream pre-processing stages. The authors argued that such an approach was a consequence of the lack of computational capabilities to run complex ML inferences at edge nodes. A pre-processing task filters the video stream with motion detection to process the image containing some object of interest. The fog layer encompasses small server computers with storage and processing capacity equal to or fewer resources than in the cloud. These small server computers perform the inferences into the content captured by the edge device, using CNN models to classify the object. The cloud layer, represented by the organization’s public or private cloud infrastructure, is used when the cloudlet cannot handle sudden picks in the processing workload and for managing the events. This strategy may bring some performance gain for video analytics, but it does not fully address all issues in scenarios with hundreds of cameras spread across a city, for example. The city’s backbone saturation is one of them. MELINDA tackles this problem by offloading the computation to the edge tier.
Sada et al. (2019) [51] presented a distributed video analytics architecture based on edge computing and federated learning. They also designed a three-layer architecture for processing the video streams. The Sensor Data Acquisition Layer (SDAL) performs the preprocessing stage of converting all video feeds to a predetermined coding scheme. The Detection and Identification Layer (DIL) is composed of edge servers to detect and identify objects of interest. The Federated Learning and Data Dissemination Layer (FL&DDL) runs on a city server between the lower layers and the cloud. It is responsible for a distributed training scheme to optimize the inference models to ensure privacy. The cloud is used only for the management of FL&DDL and storage of the processing results. Since this is a work in progress, they do not cover any implementation-specific technologies nor present an evaluation performance.
Ke et al. (2020) [52] explored the potential of advanced DL models specially designed to deploy on IoT devices. Using a three-tier architecture similar to MELINDA (camera, edge and cloud tiers), they developed a parking surveillance system running the object detector on a Raspberry Pi 3 (quad-core ARM CPU, 1 GB RAM). The CNN SSD-Mobilenet [42] detector is implemented using Tensorflow Lite to check from street camera images the parking space occupancy. After detection, the system only transmits the image containing the bounding box of the vehicle detected to a remote server for labeling the parking space. The network between the edge device and server is 4G LTE. As this type of application does not require an immediate response time, the total processing delay of a few seconds is acceptable. MELINDA does all processing stages on edge devices while meeting low processing delays.
As shown above, the typical scenario of video analytics is over a three-tier architecture. In such architectures, edge devices continuously pull the video streaming from cameras, preprocess it and transmit data of interest to nearby edge infrastructures (e.g., cloudlets). It is only in this more powerful infrastructure that the AI-based analysis takes place. In the literature consulted, few incipient works explore the potential of the new hardware accelerators [53] to deploying machine learning at the edge of the network. Besides, we propose a mechanism of intelligence sharing among edge nodes by exploiting intelligence services’ reuse. There is a recent trend in developing the concept of smart cameras [49], which can detect and classify the captured object and only transmit to management stations high-level information. Our architecture intends to integrate these services and devices with a city’s information systems, allowing smart applications’ rapid development.
6. Final Remarks and Ongoing Work
Smart city applications that use large-scale video analytics to process events in public spaces require architectures to support distributed and near real-time processing of data streams. In this paper, we present our proposal to contribute and advance the state of the art in this field. Our proposal encompasses an architecture, called MELINDA, and a set of companion algorithms and techniques to process video streams at the edge of the networks in an efficient way. We exploit recent advancements in edge computing and machine learning fields, leveraging the new Edge AI hardware potential.
As part of our original contributions, we developed an efficient workload balance technique that promotes sharing of the intelligence services among different applications. This technique will also facilitate the integration of future smart cameras, which will have embedded DL models to detect and classify the perceived objects. According to the proposed model, this type of cameras will be our MLO node cooperating with the workers (FLO nodes) to produce valuable insights into the monitored environment. Therefore, we believe that our proposal meets all the requirements for building a robust video analytics platform in the smart city context.
Other requirements for further improving the proposed platform for video analytics are still in development, such as: (i) security and privacy techniques to ensure data integrity and protection; (ii) a mechanism to retrain and distribute the DL models across edge devices when the accuracy of inferences is below a certain threshold; and (iii) a machine learning technique to predict the generation of camera events based on its historical data. We also intend to build a set of smart applications in a real-world scenario to validate our developed techniques and procedures.
Finally, we believe that the combination of IoT with machine learning will drive a myriad of intelligent systems with great impact in our society. These disruptive technologies have transformed many activities and services in modern cities, such as intelligent transportation and smart parking. Research communities have worked hard to develop new hardware, software and network protocols to address all the challenges posed by such systems.
Sample Availability
Code and data samples are available from the authors in Available online: https://github.com/aluiziorocha/MELINDA.
Author Contributions
Conceptualization, A.R.N. and T.P.S.; methodology, A.R.N.; validation, T.B., F.C.D., P.F.P. and F.L.; formal analysis, A.R.N.; investigation, A.R.N.; resources, A.R.N.; writing—original draft preparation, A.R.N.; writing—review and editing, A.R.N.; visualization, A.R.N.; supervision, T.B. and F.C.D.; project administration, A.R.N. and T.B.; and funding acquisition, T.B., F.C.D. and P.F.P. All authors have read and agreed to the published version of the manuscript.
Funding
This work was partially funded by CNPq (grant number 306747/2018-9) and by FAPESP (grant 2015/24144-7). Professors Thais Batista, Flavia Delicato and Paulo Pires are CNPq Fellows.
Conflicts of Interest
The authors declare no conflict of interest. The funders had no role in the design of the study; in the collection, analyses, or interpretation of data; in the writing of the manuscript, or in the decision to publish the results.
Abbreviations
The following abbreviations are used in this manuscript:
| AI | Artificial Intelligence |
| CNN | Convolutional Neural Network |
| DL | Deep Learning |
| DLO | Decision Level Operator |
| DLT | Decision Level Task |
| DNN | Deep Neural Network |
| FLO | Feature Level Operator |
| FLT | Feature Level Task |
| FPS | Frames Per Second |
| IIM | Image of Interest Message |
| IoT | Internet of Things |
| IS | Intelligence Service |
| ISS | Intelligent Surveillance System |
| MELINDA | Multilevel Information Distributed Processing Architecture |
| MIF | Multilevel Information Fusion |
| MI | Machine Intelligence |
| ML | Machine Learning |
| MLO | Measurement Level Operator |
| MLT | Measurement Level Task |
| MSA | Microservice Architecture |
References
- Ashton, K. That ‘Internet of Things’ Thing. 2009. Available online: https://www.rfidjournal.com/articles/view?4986 (accessed on 24 June 2020).
- Alvi, S.A.; Afzal, B.; Shah, G.A.; Atzori, L.; Mahmood, W. Internet of multimedia things: Vision and challenges. Ad Hoc Netw. 2015, 33, 87–111. [Google Scholar] [CrossRef]
- Nauman, A.; Qadri, Y.A.; Amjad, M.; Zikria, Y.B.; Afzal, M.K.; Kim, S.W. Multimedia Internet of Things: A Comprehensive Survey. IEEE Access 2020, 8, 8202–8250. [Google Scholar] [CrossRef]
- Barnett, T.; Jain, S.; Andra, U.; Khurana, T. Cisco Visual Networking Index (VNI) Complete Forecast Update, 2017–2022. Cisco Systems. 2018. Available online: https://bit.ly/385BAhJ (accessed on 14 December 2020).
- Valera, M.; Velastin, S.A. Intelligent distributed surveillance systems: A review. IEE Proc. Vision Image Signal Process. 2005, 152, 192–204. [Google Scholar] [CrossRef]
- Nazare, A.C.; Schwartz, W.R. A scalable and flexible framework for smart video surveillance. Comput. Vis. Image Underst. 2016, 144, 258–275. [Google Scholar] [CrossRef]
- Gualtieri, M.; Curran, R. The Forrester WaveTM: Big Data Streaming Analytics, Q1 2016. Available online: https://bit.ly/3oR3ftA (accessed on 14 December 2020).
- Qiu, J.; Wu, Q.; Ding, G.; Xu, Y.; Feng, S. A survey of machine learning for big data processing. EURASIP J. Adv. Signal Process. 2016, 2016, 67. [Google Scholar] [CrossRef] [Green Version]
- Mohammadi, M.; Al-Fuqaha, A.; Sorour, S.; Guizani, M. Deep Learning for IoT Big Data and Streaming Analytics: A Survey. IEEE Commun. Surv. Tutor. 2018, 20, 2923–2960. [Google Scholar] [CrossRef] [Green Version]
- Garcia Lopez, P.; Montresor, A.; Epema, D.; Datta, A.; Higashino, T.; Iamnitchi, A.; Barcellos, M.; Felber, P.; Riviere, E. Edge-centric Computing: Vision and Challenges. SIGCOMM Comput. Commun. Rev. 2015, 45, 37–42. [Google Scholar] [CrossRef]
- Nakamura, E.F.; Loureiro, A.A.F.; Frery, A.C. Information Fusion for Wireless Sensor Networks: Methods, Models, and Classifications. ACM Comput. Surv. 2007, 39, 9-es. [Google Scholar] [CrossRef]
- Ganz, F.; Puschmann, D.; Barnaghi, P.; Carrez, F. A Practical Evaluation of Information Processing and Abstraction Techniques for the Internet of Things. IEEE Internet Things J. 2015, 2, 340–354. [Google Scholar] [CrossRef] [Green Version]
- Ramos, E.; Morabito, R.; Kainulainen, J. Distributing Intelligence to the Edge and Beyond [Research Frontier]. IEEE Comput. Intell. Mag. 2019, 14, 65–92. [Google Scholar] [CrossRef]
- Rocha Neto, A.; Silva, T.P.; Batista, T.V.; Delicato, F.C.; Pires, P.F.; Lopes, F. An Architecture for Distributed Video Stream Processing in IoMT Systems. Open J. Internet Things (OJIOT) 2020, 6, 89–104. [Google Scholar]
- Razzaq, A. A Systematic Review on Software Architectures for IoT Systems and Future Direction to the Adoption of Microservices Architecture. SN Comput. Sci. 2020, 1, 350. [Google Scholar] [CrossRef]
- Rocha Neto, A.; Delicato, F.C.; Batista, T.V.; Pires, P.F. Distributed Machine Learning for IoT Applications in the Fog. Available online: https://0-onlinelibrary-wiley-com.brum.beds.ac.uk/doi/abs/10.1002/9781119551713.ch12 (accessed on 16 October 2020).
- Tsakanikas, V.; Dagiuklas, T. Video surveillance systems-current status and future trends. Comput. Electr. Eng. 2018, 70, 736–753. [Google Scholar] [CrossRef]
- Forret, P. Toolstud.io. 2006. Available online: https://toolstud.io/video/bitrate.php (accessed on 6 November 2020).
- Garofalakis, M.N.; Gehrke, J.; Rastogi, R. (Eds.) Data Stream Management—Processing High-Speed Data Streams; Data-Centric Systems and Applications; Springer: Berlin/Heidelberg, Germany, 2016. [Google Scholar]
- Rosebrock, A. Deep Learning for Computer Vision with Python, 1.3.0 ed. 2018. Available online: https://www.pyimagesearch.com/static/cv_dl_resource_guide.pdf (accessed on 14 December 2020).
- Etzion, O.; Niblett, P. Event Processing in Action; Manning Publications Company: Shelter Island, NY, USA, 2010; pp. 1–360. [Google Scholar]
- Dautov, R.; Distefano, S.; Bruneo, D.; Longo, F.; Merlino, G.; Puliafito, A. Pushing Intelligence to the Edge with a Stream Processing Architecture. In Proceedings of the 2017 IEEE International Conference on Internet of Things (iThings) and IEEE Green Computing and Communications (GreenCom) and IEEE Cyber, Physical and Social Computing (CPSCom) and IEEE Smart Data (SmartData), Exeter, UK, 21–23 June 2017; pp. 792–799. [Google Scholar]
- LeCun, Y.; Bengio, Y.; Hinton, G.E. Deep learning. Nature 2015, 521, 436–444. [Google Scholar] [CrossRef] [PubMed]
- Goodfellow, I.; Bengio, Y.; Courville, A. Deep Learning; MIT Press: Cambridge, MA, USA, 2016; Available online: https://mitpress.mit.edu/books/deep-learning (accessed on 14 December 2020).
- Ali, M.; Anjum, A.; Yaseen, M.U.; Zamani, A.R.; Balouek-Thomert, D.; Rana, O.F.; Parashar, M. Edge Enhanced Deep Learning System for Large-Scale Video Stream Analytics. In Proceedings of the 2018 IEEE 2nd International Conference on Fog and Edge Computing (ICFEC), Washington, DC, USA, 1–3 May 2018; pp. 1–10. [Google Scholar]
- Ledakis, I.; Bouras, T.; Kioumourtzis, G.; Skitsas, M. Adaptive Edge and Fog Computing Paradigm for Wide Area Video and Audio Surveillance. In Proceedings of the 2018 9th International Conference on Information, Intelligence, Systems and Applications (IISA), Zakynthos, Greece, 23–25 July 2018; pp. 1–5. [Google Scholar] [CrossRef]
- NVIDIA. NVIDIA Metropolis. 2018. Available online: https://www.nvidia.com/en-us/autonomous-machines/intelligent-video-analytics-platform (accessed on 14 December 2020).
- Google. Coral. 2019. Available online: https://coral.ai (accessed on 3 December 2019).
- Movidius. Applications for the Intel NCS 2 (or Original NCS) with OpenVINO Toolkit. 2019. Available online: https://github.com/movidius/ncappzoo/blob/master/apps/README.md (accessed on 14 April 2020).
- NVIDIA. TensorFlow/TensorRT Models on Jetson. 2018. Available online: https://github.com/NVIDIA-AI-IOT/tf_trt_models (accessed on 10 February 2020).
- Google. Models Built for the Edge TPU. 2019. Available online: https://coral.ai/models (accessed on 13 October 2019).
- Mittal, G.; Yagnik, K.B.; Garg, M.; Krishnan, N.C. SpotGarbage: Smartphone App to Detect Garbage Using Deep Learning. In Proceedings of the 2016 ACM International Joint Conference on Pervasive and Ubiquitous Computing, UbiComp ’16, Heidelberg, Germany, 12–16 September 2016; Association for Computing Machinery: New York, NY, USA, 2016; pp. 940–945. [Google Scholar] [CrossRef]
- Ma, X.; Yu, H.; Wang, Y.; Wang, Y. Large-Scale Transportation Network Congestion Evolution Prediction Using Deep Learning Theory. PLoS ONE 2015, 10, 1–17. [Google Scholar] [CrossRef] [PubMed]
- Tian, Y.; Pan, L. Predicting Short-Term Traffic Flow by Long Short-Term Memory Recurrent Neural Network. In Proceedings of the 2015 IEEE International Conference on Smart City/SocialCom/SustainCom (SmartCity), Chengdu, China, 19–21 December 2015; pp. 153–158. [Google Scholar] [CrossRef]
- Ling, X.; Sheng, J.; Baiocchi, O.; Liu, X.; Tolentino, M.E. Identifying parking spaces detecting occupancy using vision-based IoT devices. In Proceedings of the 2017 Global Internet of Things Summit (GIoTS), Geneva, Switzerland, 6–9 June 2017; pp. 1–6. [Google Scholar] [CrossRef]
- Amato, G.; Carrara, F.; Falchi, F.; Gennaro, C.; Meghini, C.; Vairo, C. Deep learning for decentralized parking lot occupancy detection. Expert Syst. Appl. 2017, 72, 327–334. [Google Scholar] [CrossRef]
- Rocha Neto, A.; Soares, B.; Barbalho, F.; Santos, L.; Batista, T.; Delicato, F.C.; Pires, P.F. Classifying Smart IoT Devices for Running Machine Learning Algorithms. In 45o̠ Seminário Integrado de Software e Hardware 2018 (SEMISH 2018); SBC: Porto Alegre, Brazil, 2018; Volume 45. [Google Scholar]
- de Assunç ao, M.D.; Veith, A.D.S.; Buyya, R. Resource Elasticity for Distributed Data Stream Processing: A Survey and Future Directions. Available online: https://arxiv.org/abs/1709.01363 (accessed on 15 July 2019).
- Röger, H.; Mayer, R. A Comprehensive Survey on Parallelization and Elasticity in Stream Processing. ACM Comput. Surv. 2019, 52. [Google Scholar] [CrossRef] [Green Version]
- Lera, I.; Guerrero, C.; Juiz, C. YAFS: A Simulator for IoT Scenarios in Fog Computing. IEEE Access 2019, 7, 91745–91758. [Google Scholar] [CrossRef]
- University of Essex. Face Recognition Data. 2019. Available online: https://cswww.essex.ac.uk/mv/allfaces/ (accessed on 5 May 2019).
- Howard, A.G.; Zhu, M.; Chen, B.; Kalenichenko, D.; Wang, W.; Weyand, T.; Andreetto, M.; Adam, H. MobileNets: Efficient Convolutional Neural Networks for Mobile Vision Applications. In Proceedings of the Computer Vision and Pattern Recognition (cs.CV), Honolulu, HI, USA, 21–26 July 2017. [Google Scholar]
- Schroff, F.; Kalenichenko, D.; Philbin, J. FaceNet: A Unified Embedding for Face Recognition and Clustering. Available online: https://arxiv.org/abs/1503.03832 (accessed on 26 May 2019).
- Geitgey, A. Face Recognition Library. 2018. Available online: https://github.com/ageitgey/face_recognition (accessed on 19 October 2019).
- OpenCV.org. Open Source Computer Vision Library. 2018. Available online: https://opencv.org/ (accessed on 17 April 2019).
- Bass, J. imageZMQ: Transporting OpenCV Images. 2019. Available online: https://github.com/jeffbass/imagezmq (accessed on 4 September 2019).
- ZeroMQ.org. ZeroMQ—An Open-Source Universal Messaging Library. 2018. Available online: https://zeromq.org/ (accessed on 4 September 2019).
- Ananthanarayanan, G.; Bahl, P.; Bodík, P.; Chintalapudi, K.; Philipose, M.; Ravindranath, L.; Sinha, S. Real-Time Video Analytics: The Killer App for Edge Computing. Computer 2017, 50, 58–67. [Google Scholar] [CrossRef]
- James, A.; Sirakoulis, G.C.; Roy, K. Smart cameras everywhere: AI vision on edge with emerging memories. In Proceedings of the 2019 26th IEEE International Conference on Electronics, Circuits and Systems (ICECS), Genoa, Italy, 27–29 November 2019; pp. 422–425. [Google Scholar]
- Apache.org. Apache NiFi—An Easy to Use, Powerful, And Reliable System To Process and Distribute Data. 2018. Available online: https://nifi.apache.org/ (accessed on 6 October 2018).
- Ben Sada, A.; Bouras, M.A.; Ma, J.; Runhe, H.; Ning, H. A Distributed Video Analytics Architecture Based on Edge-Computing and Federated Learning. In Proceedings of the 2019 IEEE International Conference Dependable, Autonomic and Secure Computing, Fukuoka, Japan, 5–8 August 2019; pp. 215–220. [Google Scholar] [CrossRef]
- Ke, R.; Zhuang, Y.; Pu, Z.; Wang, Y. A Smart, Efficient, and Reliable Parking Surveillance System With Edge Artificial Intelligence on IoT Devices. IEEE Trans. Intell. Transp. Syst. 2020, 90, 1–13. [Google Scholar] [CrossRef] [Green Version]
- Yau, S. Battle of Edge AI— Nvidia vs. Google vs. Intel. 2019. Available online: https://medium.com/p/8a3b87243028 (accessed on 7 August 2019).
Figure 1.
Dividing the processing tasks for event-based video analytics.

Figure 2.
MELINDA Three-Tier Architecture [14].
Figure 2.
MELINDA Three-Tier Architecture [14].

Figure 3.
MELINDA software components [14].
Figure 3.
MELINDA software components [14].

Figure 4.
Application’s workflow.

Figure 5.
(a) Example scenario for nodes allocation. (b) Flow graph with edge capacities in FPS.

Figure 6.
Workload distribution with load balance on worker (FLO) nodes.

Figure 7.
Workflow Time Processing considering: (a) 100%; (b) 50%; (c) 25%; and (d) 10% of the frames are images of interest.
Figure 7.
Workflow Time Processing considering: (a) 100%; (b) 50%; (c) 25%; and (d) 10% of the frames are images of interest.

Figure 8.
Delayed Messages Ratio considering (a) 100%; (b) 50%; (c) 25%; and (d) 10% of the frames are images of interest.
Figure 8.
Delayed Messages Ratio considering (a) 100%; (b) 50%; (c) 25%; and (d) 10% of the frames are images of interest.

Figure 9.
Workload balancing with heterogeneous nodes, where the difference in processing capacity between the fastest and the slowest is 4× (a) and 6× (b).
Figure 9.
Workload balancing with heterogeneous nodes, where the difference in processing capacity between the fastest and the slowest is 4× (a) and 6× (b).

Figure 10.
(a) Processing throughput; and (b) processing time with heterogeneous edge nodes.


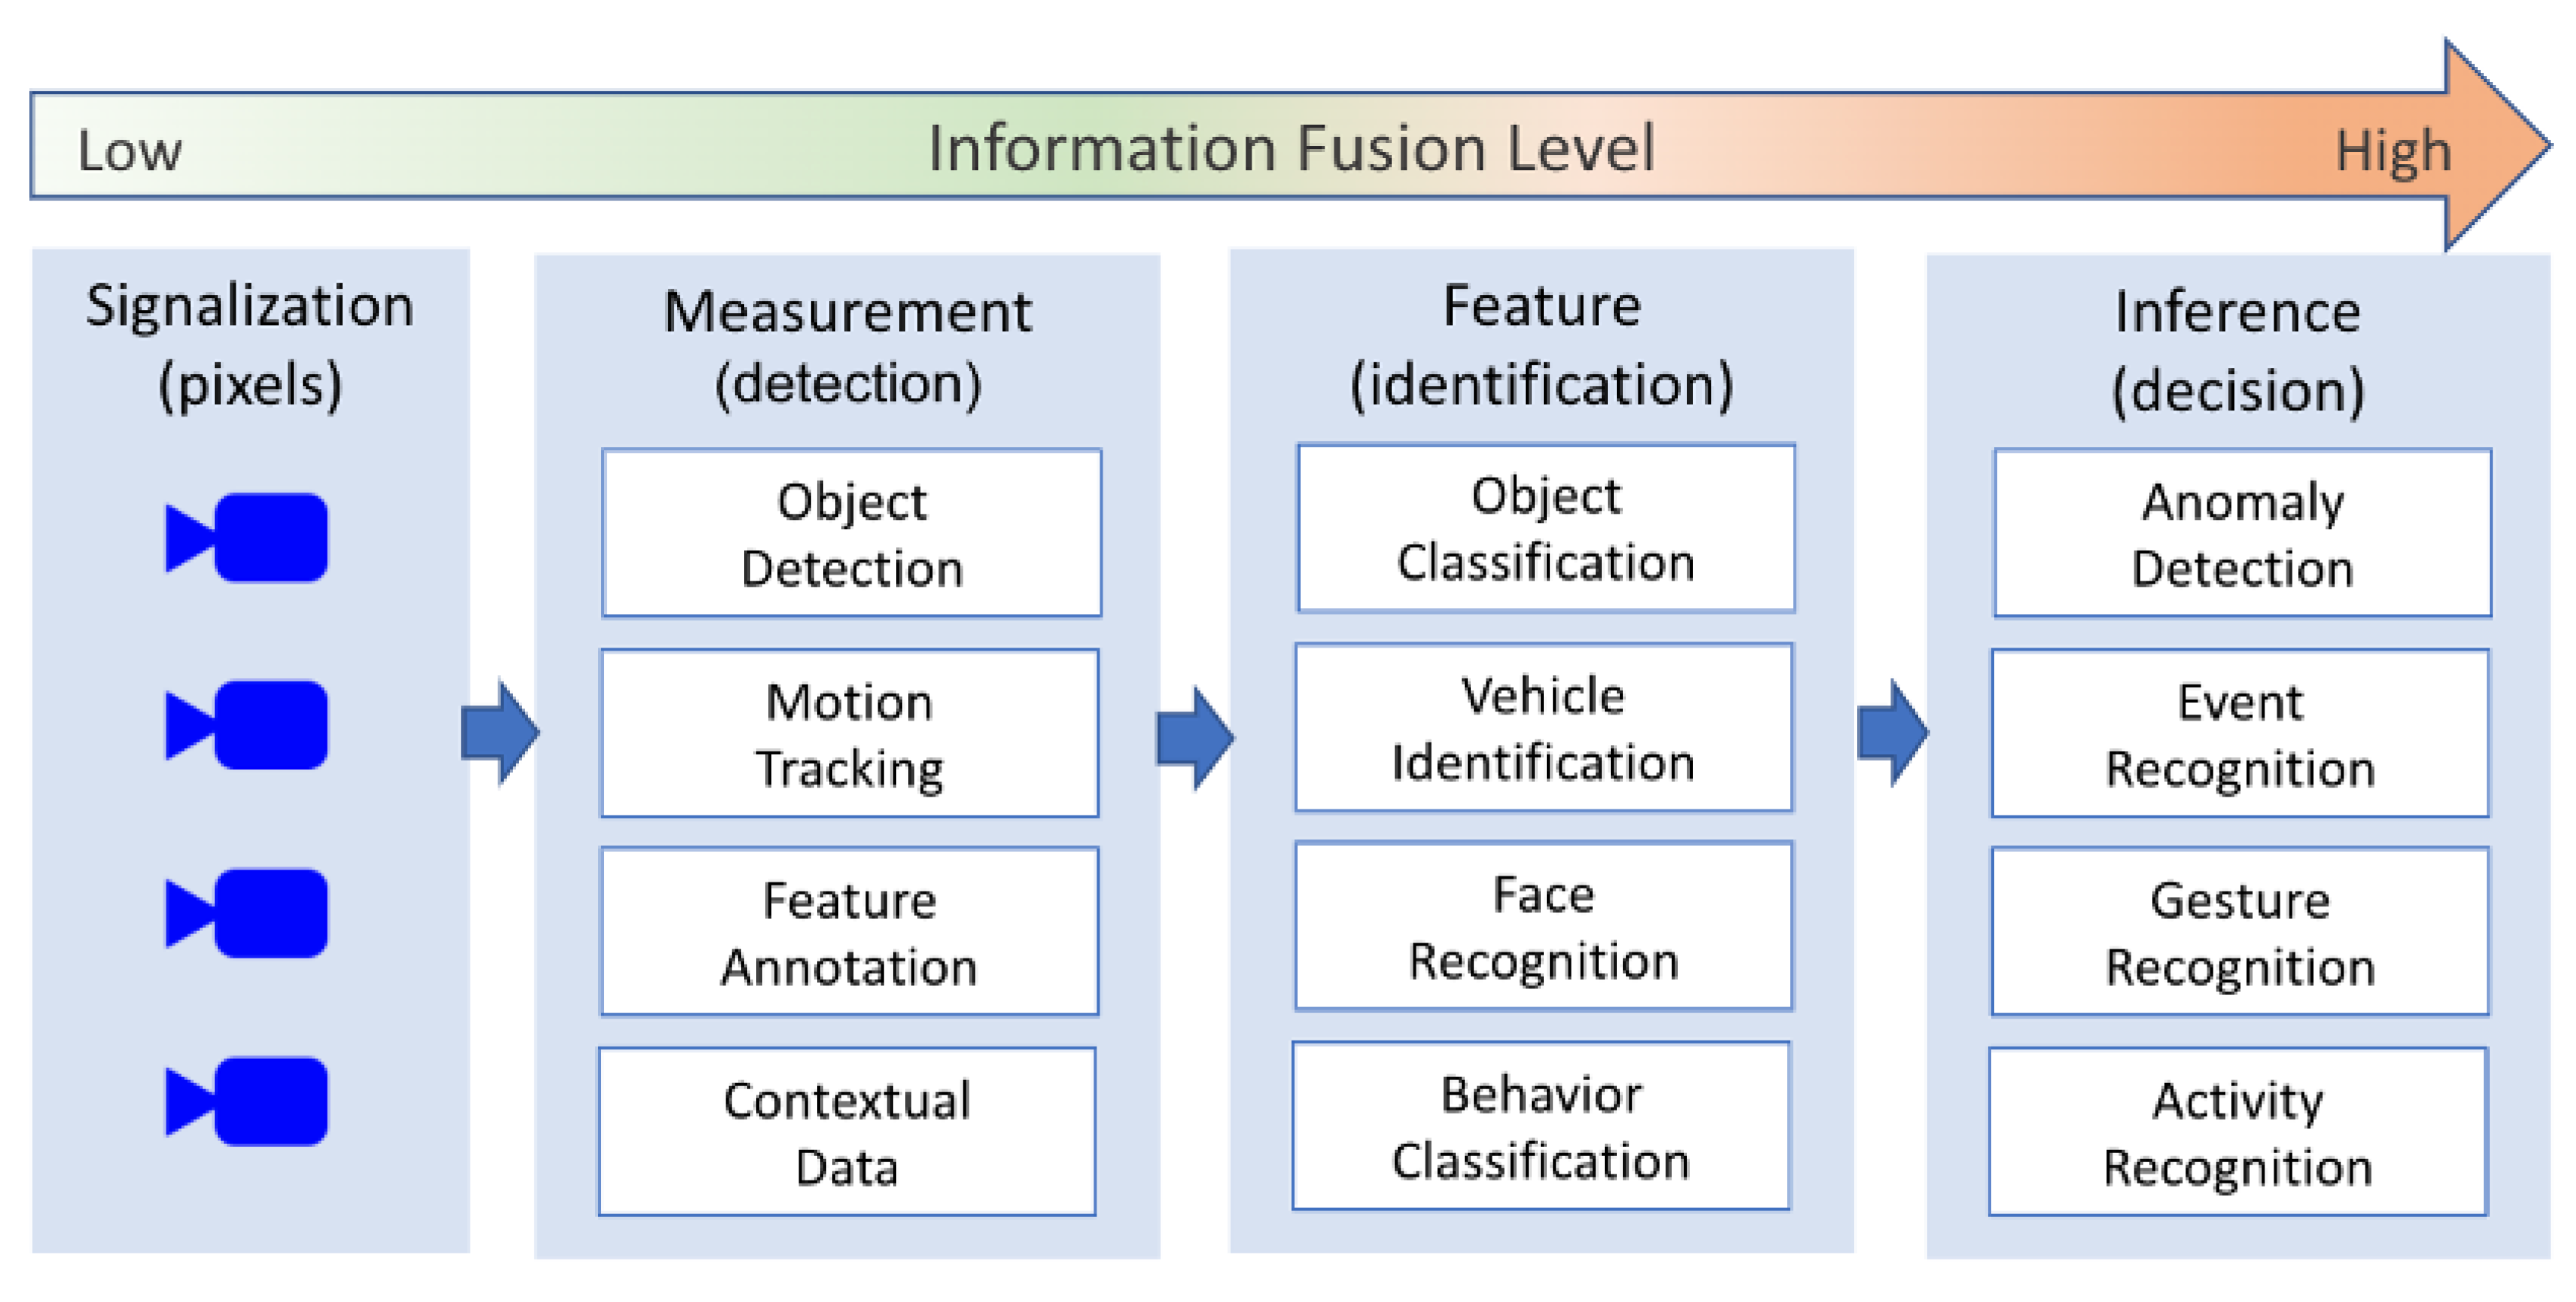
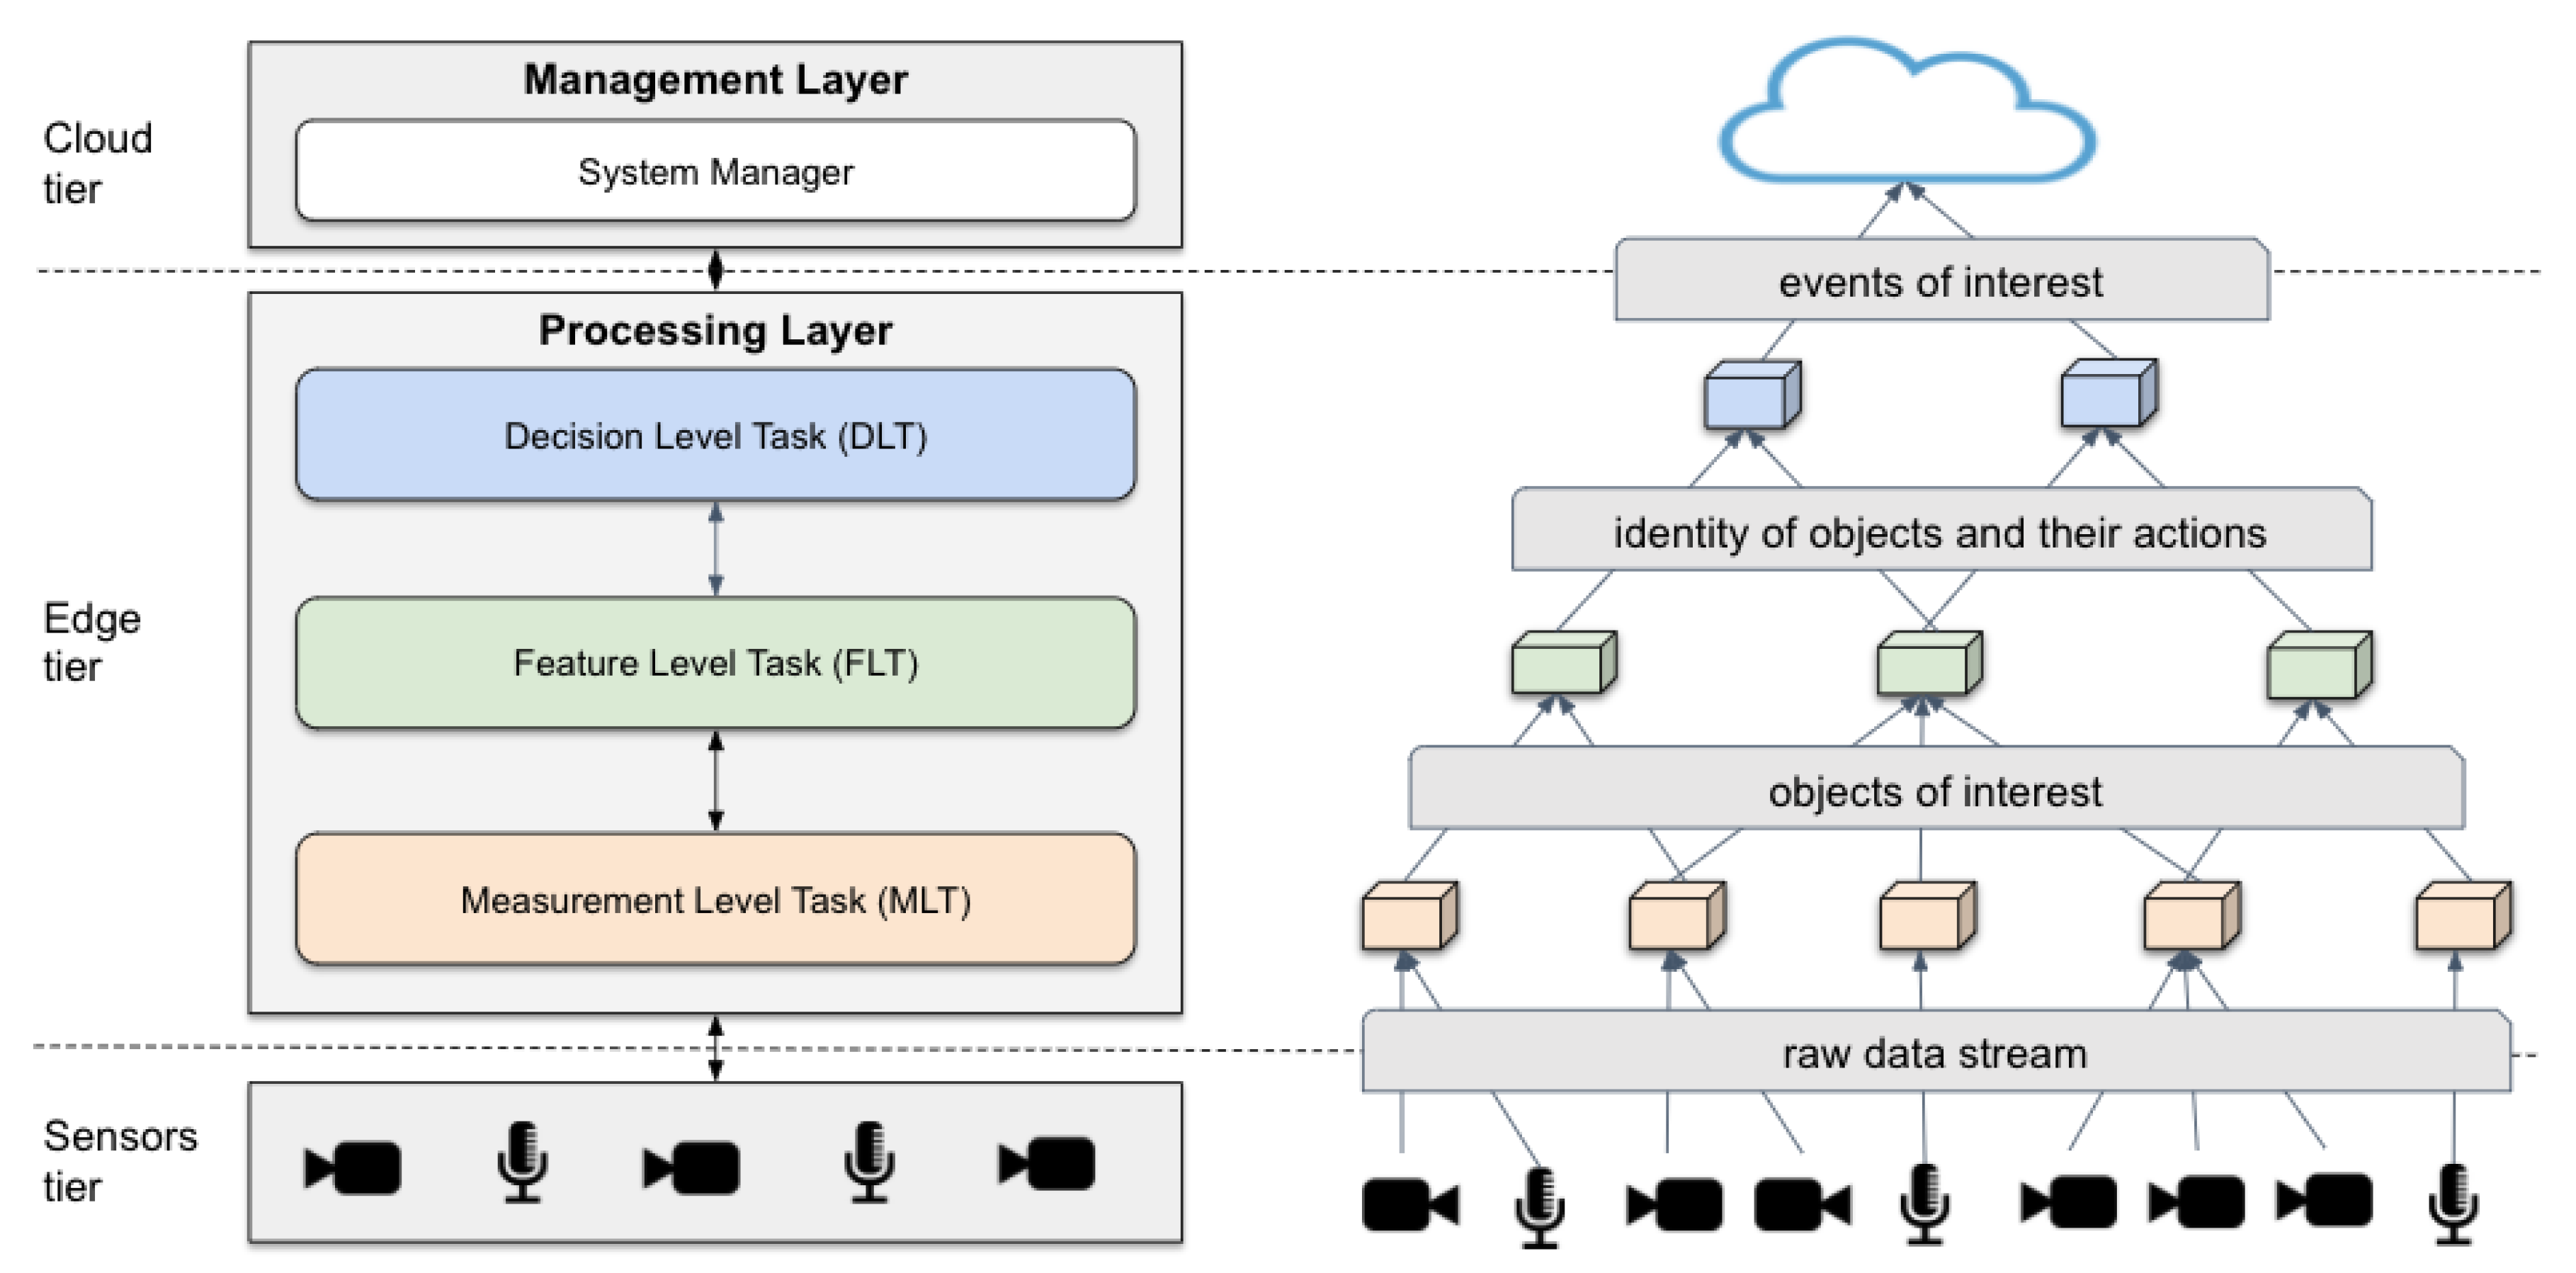
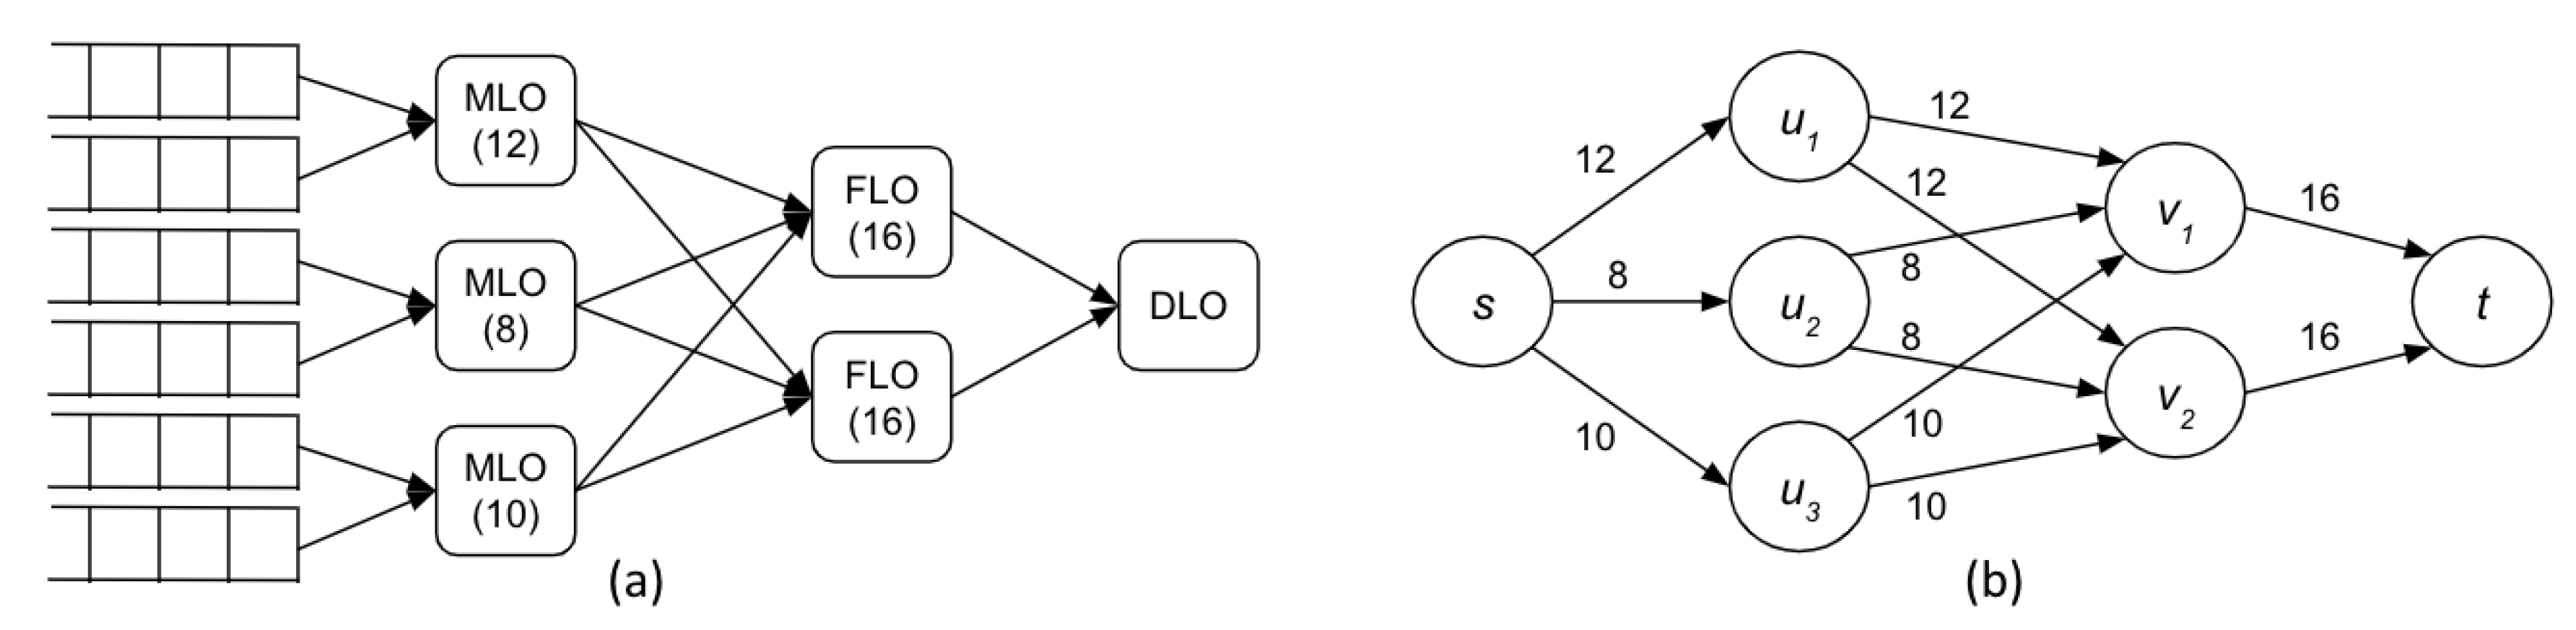
Table 1.
Operators’ processing time in seconds.
| Face Detection * (Raspberry Pi 4 + TPU) | Face Recognition ** (NVIDIA Jetson Nano) | Decision Rule (Raspberry Pi 3) | Total | |
|---|---|---|---|---|
| Average | 0.018 | 0.051 | 0.008 | 0.078 |
| Minimum | 0.014 | 0.047 | 0.008 | 0.068 |
| Maximum | 0.029 | 0.058 | 0.008 | 0.098 |
| Standard Deviation | 0.004 | 0.003 | 0.001 |
Table 2.
Metrics used to evaluate the system.
| Metric | Description |
|---|---|
| MWT | Maximum Workflow Time (MWT): This metric calculates the total processing time of the deployment plan of workflow to process an . |
| DMR | Delayed Messages Ratio (DMR): Given a workflow , a delayed message takes time to be processed higher than its MWT. This metric calculates the ratio of delayed messages processed within a period when different workflows compete for the same FLO (IS) nodes. |
| WB | Workload Balancing (WB): This metric analyzes how fair the distribution of the workload is among the edge nodes, considering their different processing capacities. |
| PT | Processing Throughput (PT): This metric evaluates the number of messages processed per unit of time. |
Table 3.
Simulation parameters.
| Parameter | Value |
|---|---|
| Number of edge nodes available | 15 nodes |
| Types of edge nodes | 5 MLO nodes (1.5 GHz and 4 GB RAM + TPU) with image processing capacity of 40 FPS; 5 FLO nodes (1.43 GHz and 4 GB RAM, GPU) with image processing capacity of 20 FPS; 5 DLO nodes (1 GHz and 1 GB RAM) |
| Type of cameras | 20 FPS, Full HD, using H.264 Base - High Quality as compression method |
| Data sensing interval of cameras | 50 ms |
| Number of cameras per MLO node | 2 |
| Bandwidth | 100 Mbps between cameras and edge nodes; 100 Mbps between edge nodes |
| Delay between cameras and edge nodes | 4 ms |
| Delay between edge nodes | 4 ms |
| Average Message average size | 50 kB |
| Simulation time | 3000 ms |
Publisher’s Note: MDPI stays neutral with regard to jurisdictional claims in published maps and institutional affiliations. |
© 2020 by the authors. Licensee MDPI, Basel, Switzerland. This article is an open access article distributed under the terms and conditions of the Creative Commons Attribution (CC BY) license (http://creativecommons.org/licenses/by/4.0/).
Share and Cite
MDPI and ACS Style
Rocha Neto, A.; Silva, T.P.; Batista, T.; Delicato, F.C.; Pires, P.F.; Lopes, F. Leveraging Edge Intelligence for Video Analytics in Smart City Applications. Information 2021, 12, 14. https://0-doi-org.brum.beds.ac.uk/10.3390/info12010014
AMA Style
Rocha Neto A, Silva TP, Batista T, Delicato FC, Pires PF, Lopes F. Leveraging Edge Intelligence for Video Analytics in Smart City Applications. Information. 2021; 12(1):14. https://0-doi-org.brum.beds.ac.uk/10.3390/info12010014
Chicago/Turabian StyleRocha Neto, Aluizio, Thiago P. Silva, Thais Batista, Flávia C. Delicato, Paulo F. Pires, and Frederico Lopes. 2021. "Leveraging Edge Intelligence for Video Analytics in Smart City Applications" Information 12, no. 1: 14. https://0-doi-org.brum.beds.ac.uk/10.3390/info12010014
Note that from the first issue of 2016, this journal uses article numbers instead of page numbers. See further details here.