
Clustering Optimization of LoRa Networks for Perturbed Ultra-Dense IoT Networks
by
 ,
,
Mohammed Saleh Ali Muthanna
1,2 ,
,
Ping Wang
3,
Min Wei
3,*,
Ahsan Rafiq
1 and
Nteziriza Nkerabahizi Josbert
1 1
School of Computer Science and Technology, Chongqing University of Posts and Telecommunications, Chongqing 400065, China
2
Department of Automation and Control Processes, Saint Petersburg Electrotechnical University “LETI”, 197022 Saint Petersburg, Russia
3
School of Automation, Chongqing University of Posts and Telecommunications, Chongqing 400065, China
*
Author to whom correspondence should be addressed.
Information 2021, 12(2), 76; https://0-doi-org.brum.beds.ac.uk/10.3390/info12020076
Submission received: 25 January 2021
/
Revised: 7 February 2021
/
Accepted: 8 February 2021
/
Published: 10 February 2021
(This article belongs to the Special Issue Distributed Systems and Mobile Computing)
Abstract
:Long Range (LoRa) communication is widely adapted in long-range Internet of Things (IoT) applications. LoRa is one of the powerful technologies of Low Power Wide Area Networking (LPWAN) standards designed for IoT applications. Enormous IoT applications lead to massive traffic results, which affect the entire network’s operation by decreasing the quality of service (QoS) and minimizing the throughput and capacity of the LoRa network. To this end, this paper proposes a novel cluster throughput model of the throughput distribution function in a cluster to estimate the expected value of the throughput capacity. This paper develops two main clustering algorithms using dense LoRa-based IoT networks that allow clustering of end devices according to the criterion of maximum served traffic. The algorithms are built based on two-common methods, K-means and FOREL. In contrast to existing methods, the developed method provides the maximum value of served traffic in a cluster. Results reveal that our proposed cluster throughput model obtained a higher average throughput value by using a normal distribution than a uniform distribution.
1. Introduction
Currently, in the era of the IoT [1], communication technologies have significantly expanded to reach a variety of industries. Consequently, providing low-power and long-distance communication networks has become an essential component of many applications within smart cities, such as waste management [2], supply chain [3], Industrial Internet of Things [4], smart metering [5], and traffic control. Low Power Wide Area Networking (LPWAN) is an effective way for such applications to overcome these cost, energy, and complexity challenges, especially when such applications require covering large geographic areas. One of the attracted extensive attentions for LPWAN technologies today is Long Range (LoRa) [6]. The communication model of LoRa can be considered a better alternative for short-range and cellular communications in different applications and will offer notable features, such as low data rates, long-range, and low power consumption. The LoRa technology provides a high flexibility network by introducing long-range communication at low cost and communication specifications (e.g., bit rate, throughput, and delay). Network flexibility is an important issue that is related to LoRa network design [7].
However, a dense number of deployed devices in a large geographical area lead to a significant increase in subscriber traffic intensity. The demand from large retailers is growing to offer enhanced quality of services (QoS) and channel capacity, which is difficult for network operators [8]. The main trends in the development of LoRa networks consist of the rise of LoRa capacity and the number of users served.
In some cases, these processes lead to a decrease in the QoS requirements. To ensure the required QoS in LoRa networks’ design, it is necessary to resort to various methods to guarantee the sufficiency of the relevant resources, such as reducing the service area of LoRa gateways, increasing their number, and maximizing the throughput and capacity of the LoRa networks [9]. It can be shown that the previous problems are highly related and simultaneously affect QoS in LoRa networks performance. These problems should be solved considering the peculiarities of the placement of end devices in the service area, possibly considering their movements. When organizing LoRa end devices connection, it is required to solve the problem of ensuring QoS traffic within the cluster and between network elements and certain elements of clusters.
The clustering methods consist of selecting a certain number of clusters and selecting a structure that provides the maximum possible traffic QoS. The clustering problem’s solution is similar to the optimization problem’s solution in which a certain metric is minimized (maximized). Such a metric may be throughput and channel capacity.
This paper analyzes the channel capacity between the cluster member (CM) and the cluster head (CH). We develop a cluster throughput model to estimate the expected value of the throughput capacity and develop clustering methods to make a rational choice of the algorithm depending on the distribution of end devices, which allows obtaining a cluster throughput capacity value close to the maximum. The main contributions of this paper are summarized as follows:
- The channel capacity analysis between the CM and the CH showed its dependence on the distribution of end devices. Remarkably, the results have shown that a larger average throughput is achieved with a normal distribution than with a uniform distribution;
- A cluster throughput model has been developed to estimate the throughput capacity’s expected value when forming the cluster of end devices, which allows using it in the end devices’ clustering problems;
- Clustering methods have been developed to make a rational choice of the algorithm depending on the distribution of end nodes, which allows obtaining a cluster throughput capacity value close to the maximum.
The rest of the paper is presented in several sections: Section 2 presents the related work and motivation. The LoRa technology overview is detailed in Section 3. Section 4 illustrates the problem statement. Section 5 presents the system description. Section 6 presents the clustering methods. Evaluation results based on two-common methods, K-means and FOREL, are presented in Section 7. Section 8 offers the discussion, and lastly, in Section 9, we make a conclusion and discuss future work.
2. Related Work and Motivation
Recent works on LoRa and Long Rang Wide Area Networking (LoRaWAN) have mainly dealt with LoRa performance evaluation in terms of capability [10,11], performance [12], lifetime [13], latency [14], and parameter setting [15,16] for industrial monitoring applications. For example, in [7], a temperature monitoring application is proposed. Dynamic Line Rating (DLR) for an Overhead Transmission Line (OTL) system is monitored as it relies on the weather, temperature, and inclination measurements. Here, OTL monitoring is carried by a vision system, which is further transmitted by LoRa communication. Communication is carried between the vision system and supervisory control and data acquisition (SCADA) system. This paper illustrates that QoS has a vital function in the received data reliability.
The paper in [17] aims to determine the scalability of the LoRa technology. For that, a high density of sensors is deployed in IoT environments for smart city applications. When the network scale is increased, the data transmission system has been affected. This paper finalizes that the data transmission system can be improved by focusing on optimal transmission policies, including the spreading factor (SF) allocation. Significantly, SF allocation is affected by distance with gateway and other factors. With an increase in network scale, a single gateway fails to ensure better data transmission efficiency.
The work in [18] constructs an infrastructure that is capable of tracking and monitoring the environmental system. LoRa technology is used for tracking applications to overcome energy-related limitations. As this system is planned to be implemented in coastal applications, multiple gateways are deployed. With the multiple gateways, this work attains the required level of connectivity and coverage in the network. Received signal strength indicator (RSSI) is considered for SF allocation, and the data is encrypted for security reasons.
The paper in [19] proposed an adaptive data rate (ADR) algorithm for improving error performance in rough channels resulting in extending the range of the network, the problem addressed by this paper to enhance the scalability, robustness, and fairness between nodes of the network by reducing the number of the data messages in the up-link direction as well as the medium access control (MAC) command messages in the down-link direction by using ADR algorithm. ADR algorithm in this paper is effective in stable channel conditions with a small-scale network, but the main motive of LoRa is in highly variable conditions. Thus, ADR algorithm in this work does not include in large complex networks.
To improve QoS in LoRa, the authors in [20] first derived the IoT node’s mathematical model. From the mathematical model, the closed-form formula is derived to characterize the node performance. Then, the performance is maximized by optimizing the performance of IoT nodes. For formulating nodes performance, the Markov chain model is utilized. Then, the optimal transmission policy is derived based on the mathematical model of the node. The work in [20] considered both types of data, including normal data and emergency data. For both data, performance is optimized by a genetic algorithm (GA) and simulated annealing (SA) algorithm. Although normal and emergency types are considered, the same fitness function is formulated for both types. However, different types of data require different QoS levels, which is not achieved in this work. GA and SA update the parameters. GA is complex in nature and difficult to handle scalable problems, while SA is very slow and sensitive to even small changes in the input values. Thus, the optimal parameter assignment for all packets by GA and SA is relatively tricky. Parameters are updated by clustering algorithms, which are efficient since it learns the environment continuously.
Complementary to the presented related works, this paper focuses particularly on throughput capacity in LoRa networks and provides a solution to maximize throughput capacity value and build solutions to achieve the QoS requirements by developing clustering algorithms for distributing and managing LoRa gateways for smart city application and IoT dense networks.
3. LoRa Technology Overview
In [21], the proprietary LoRa physical layer (PHY) technique is possessed via Semtech Corporation. In [22], LoRa Alliance has specified LoRaWAN as the medium access control (MAC) layer protocol. This section described more specific details of LoRa technology, LoRaWAN, and the main characteristics in the following subsection.
3.1. LoRa Physical Layer
The LoRa modulation has several parameters: (i) spreading factor (SF); (ii) bandwidth (BW); (iii) chirp spread spectrum (CSS); code rate (CR) [23]. In LoRa modulation, information is transmitted in symbols, the length of which Ts depends on using (SF). Each symbol is a sinusoidal signal, the frequency of which is cyclically shifted within a bandwidth (BW).
In LoRa modulation, the symbol duration Ts and bit rate (Rb) can be calculated as following [24]:
where SF refers to the spreading factor, and BW is bandwidth. The transmitted symbol rate Rs is calculated as . Thus, the chip rate Rc can be defined as , since, as we previously stated, .
LoRa modulation also comprises a variable error correction scheme that enhances the signal transmission robustness at the expense of redundancy. Therefore, the data nominal bit rate, Rb, can be defined as the following [23]:
where CR is for error correction and equal to 4/5, 4/6, 4/7, and 4/8.
Another critical parameter is the receiver sensitivity, which indicates the lowest power level of the received LoRa signal that the receiver can detect and demodulate. Based on the LoRa Semtech designer’s guide, the receiver sensitivity of LoRa can be calculated as .
Where ρ is the receiver sensitivity, NF is the receiver’s noise figure, and SNR is the signal-to-noise ratio of the received signal. Table 1 indicates the nominal bit rate and the receiver sensitivity for the bandwidth of 125 kHz. For the values in Table 1, the maximum communication range of the LoRa is around 10 km.
As a LoRa network operates at a frequency of 868 MHz, bandwidth of 125 kHz, the payload of 8 bytes, and a preamble of 6, the payload of 8 bytes, and a preamble of 6, the number of symbols in the physical layer data block can be specified as following [24]:
where ceil (x) maps to the smallest integer that is greater than the value of x, SF is the spreading factor, CRC is the cyclic redundancy check, H is the header mode, DE is the data rate, CR is the coding rate, and PL is the number of payload bytes of the physical layer block and can be determined based on the payload of the application layer FRM as
where FRM is the payload of the application layer.
CRC denotes the payload’s existence, and it is fixed to either 0 or 1 to refer to the off and on statuses. The header mode is also fixed to either 0 or 1; H = 0, when the explicit header mode is utilized, and H = 1 when the implicit header mode is authorized.
The total duration of the LoRa frame can be calculated of the sum of the transmission time of the preamble and the payload as the following:
The preamble time can be calculated as follows:
where is the programmable length of modem registers.
The payload duration can be calculated as follows:
Summing up, the total frame duration can be calculated by adding both Equations (6) and (7).
3.2. LoRaWAN MAC Layer
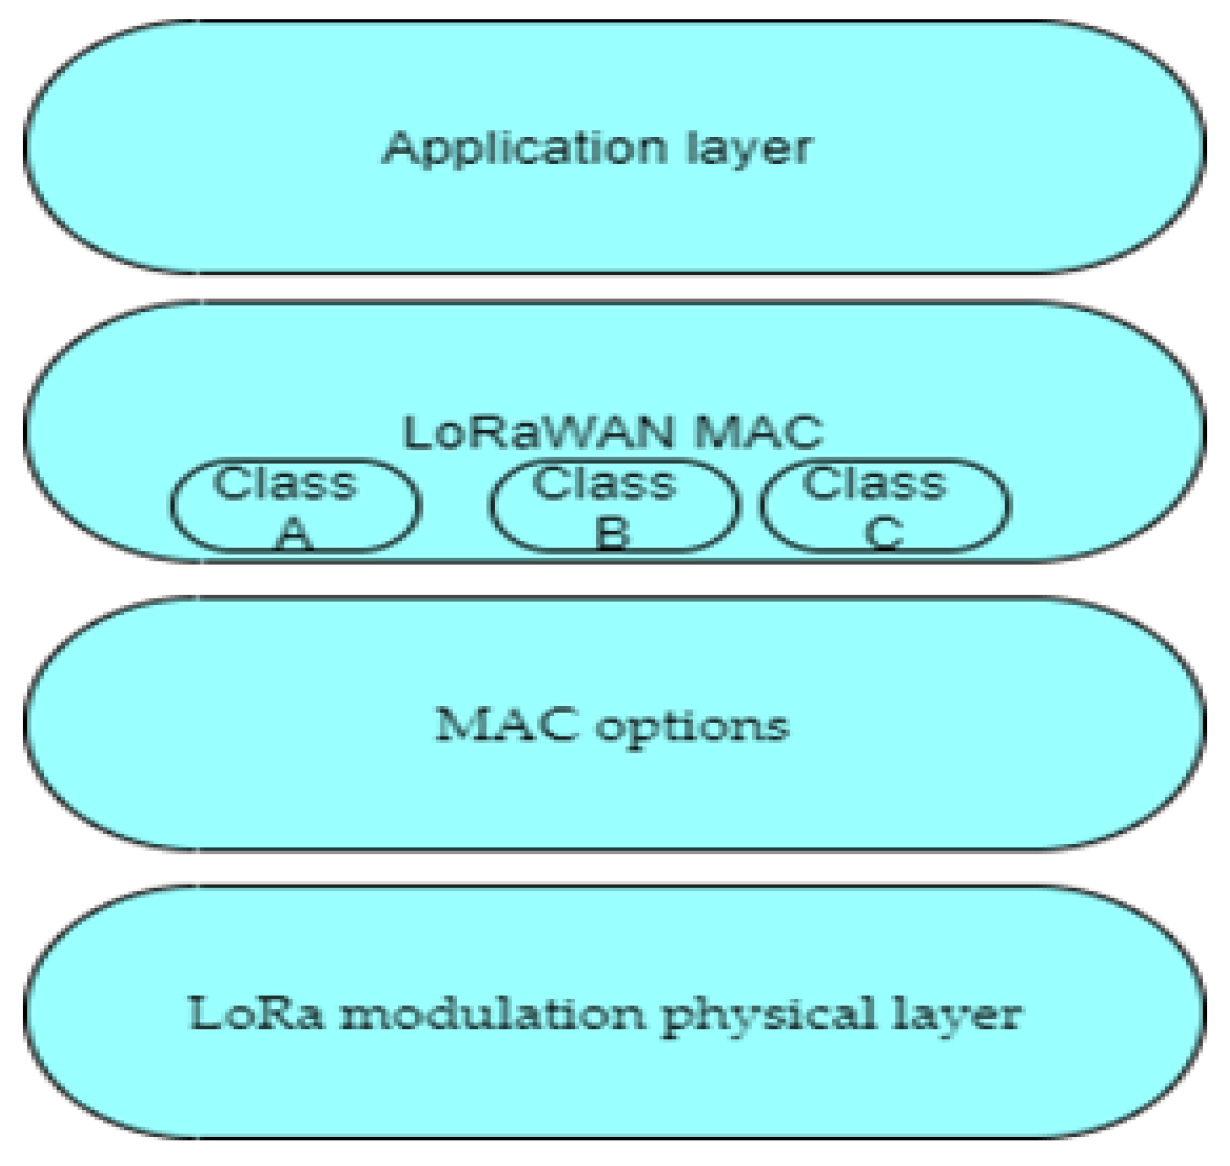
LoRaWAN is a network protocol designed for many LPWAN applications that use unlicensed frequency bands for transmission. Its standard was published in 2015 and describes the data link layer protocol, while the physical layer protocol is proprietary and belongs to the transmitter manufacturer. Figure 1 shows the defined protocol of LoRaWAN via the LoRa Alliance [22].
LoRaWAN devices are categorized into three classes: A, B, and C. Class A is primary, based on the "asynchronous ALOHA" [25] access method, and is required to be supported by all devices. All LoRaWAN sensors, when turned on, work according to class A and can switch to other classes if such a physical possibility is available and upon agreement with the server. Class B is based on the periodic distribution of service information from the server and access to the channel on a schedule. This assumes that devices can consume more power than Class A devices, which will allow them to listen to periodic messages from the server. Class C is based on constant listening of the channel by sensors.
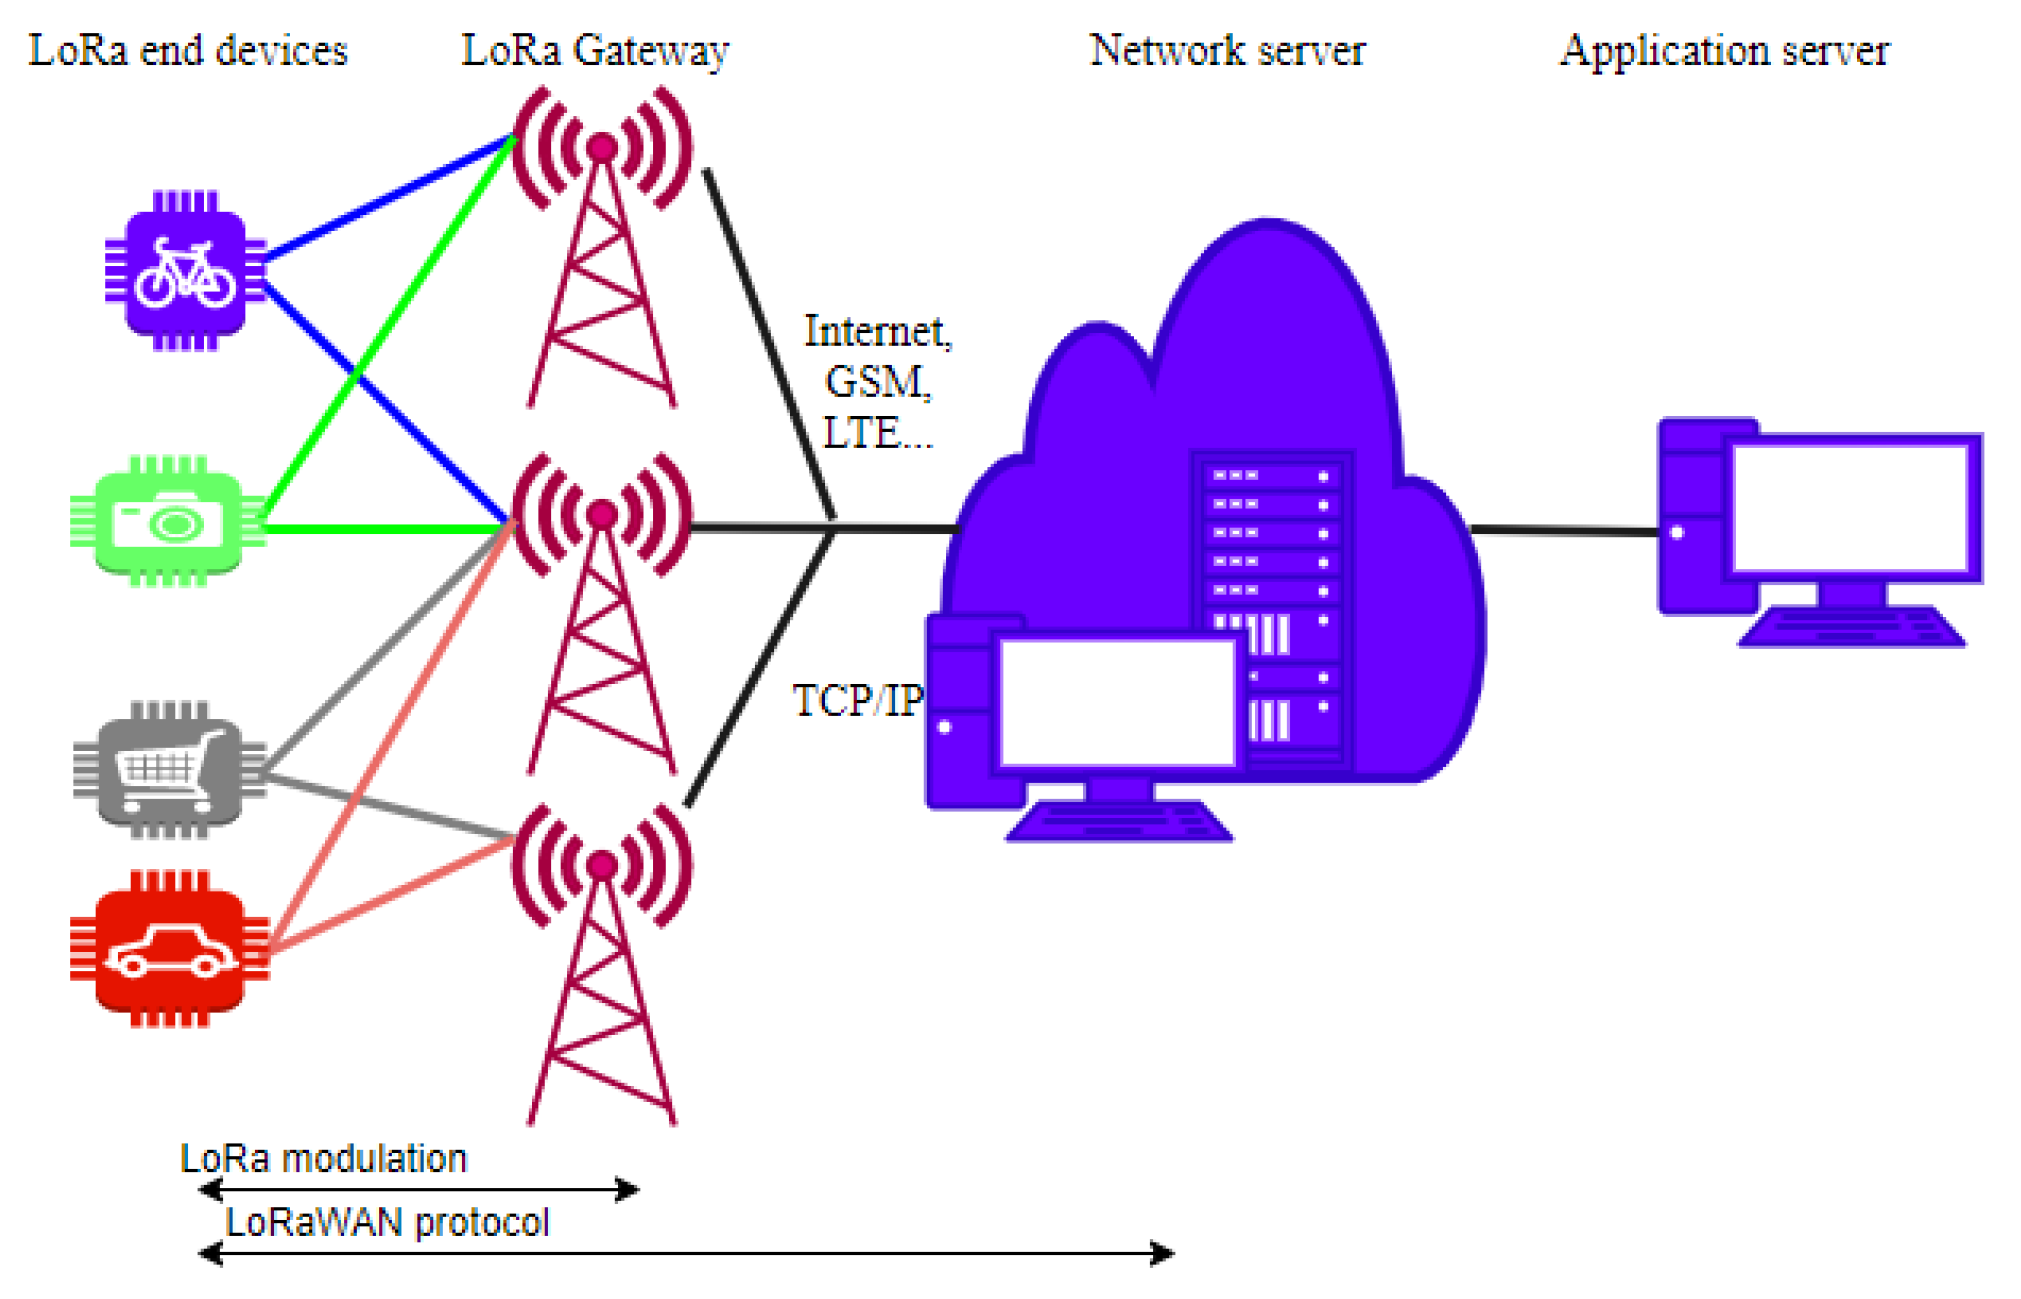
A LoRaWAN network architecture contains end devices, network servers, and LoRa gateways, as shown in Figure 2 [26]. The connection between the gateways and the server is reliable and fast, and the gateways are connected to sensors wirelessly using LoRa technology. The server is the coordinator of the network, and the gateways play the role of repeaters between the sensors and the server—having received a frame via a wireless connection, the gateway encapsulates the frame in an IP packet and transmits it to the server and, similarly, transmits the packets from the server to the sensors.
3.3. Calculation of Packet Arrival Rate
Packets from different end nodes arrive at the gateways in a Poisson process [27]. In turn, the gateway receives the packets and, as a response, transmits a confirmation packet. Unconfirmed packets are re-transmitted, also forming a Poisson stream. Since a huge number of nodes are located in the network, thus the probability that several nodes transmit simultaneously is high. This probability can be calculated as follows:
The probability of the fact that during the transmission of one packet T in the air, there are still k packets from other nodes is determined as
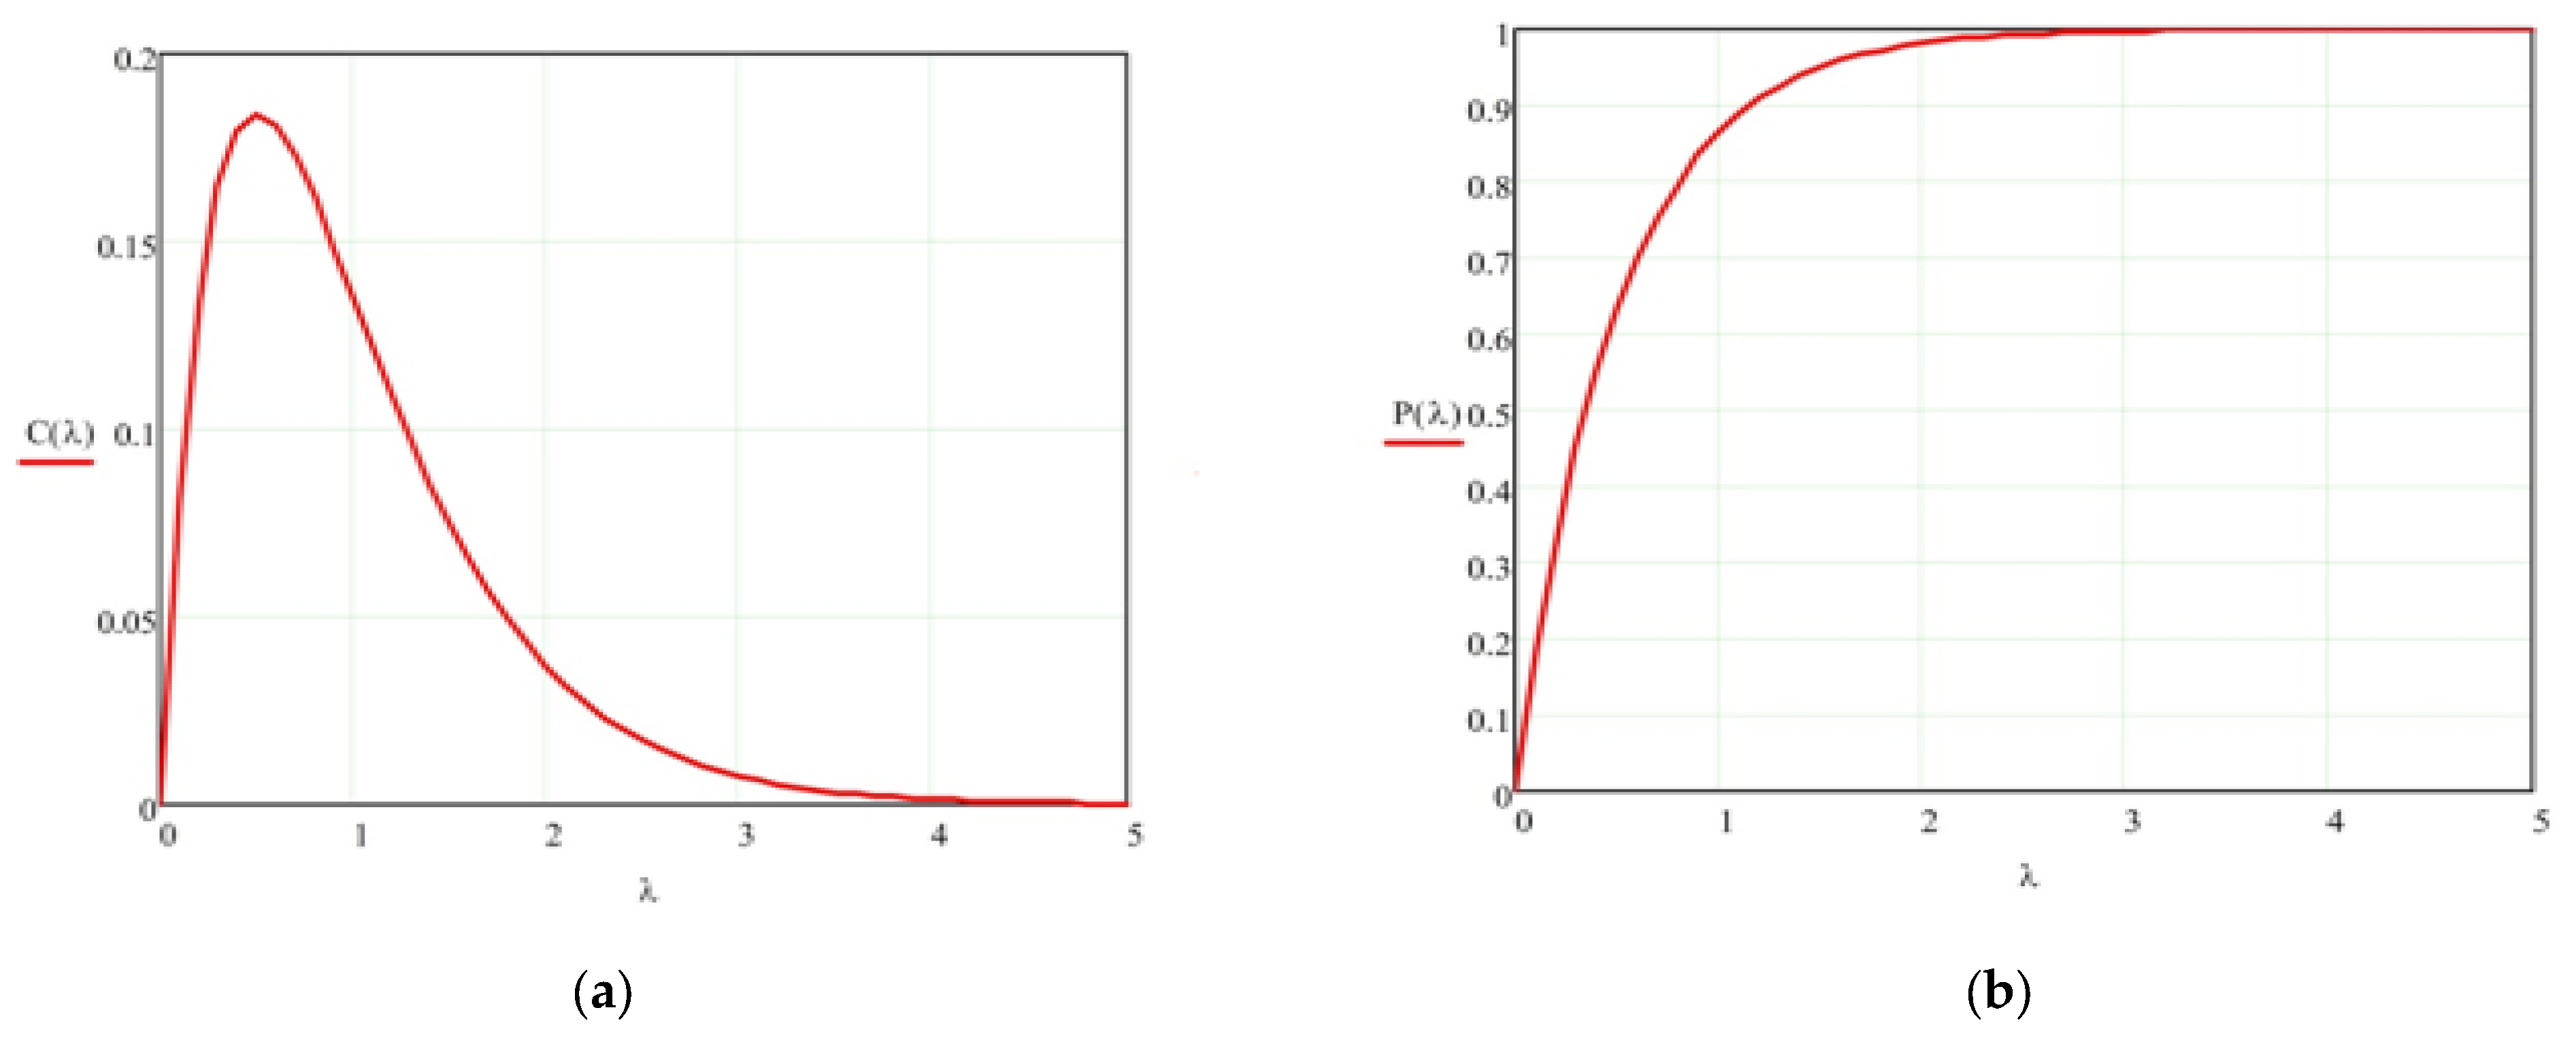
where P (k) is the probability of k packets in the air, transmitted in parallel, and λ is the arrival rate of packets in time T. When the number of parallel packets on the air is zero, i.e., k = 0, there is no collision. The packet is successfully transmitted to the base station or the gateway. In this case, the probability of successful transmission of a packet, Psuccessful, is defined as
Therefore, the probability of unsuccessful transmission, which is indicated as the loss probability, can be calculated as
where Ploss is the loss probability that also indicates the collision probability. The effect of variations of the rate of arrival packets on the collision probability is illustrated in Figure 3.
Thus, the average number of packets that are successfully transmitted during a time T, where the intensity λ can be determined as
where Cpackets refers to the average number of packets that are successfully transmitted. Figure 3 shows the effect of packets’ arrival rate on the average number of successfully transmitted packets.
3.4. Calculation Gateway Capacity
Consider a network LoRa operating at a frequency of 868 MHz and a bandwidth of 125 kHz. The number of radio-frequency channels Nf is equal to 8. It is assumed that the nodes transmit a packet of 8 bytes of payload and a preamble with six symbols with a transmission rate of two packets per hour. The admissible probability of loss due to collisions is 2%. If two nodes or more transmit their packets simultaneously at the same SF spreading factor, a collision is likely to occur.
The total transmission time of one packet can be calculated by adding the total up-link and down-link times. The up-link time is the packet transmission time from the node to the gateway, while the down-link time is the transmission time of the confirmation packet from the gateway to the node. For a certain spreading factor, the total transmission time of a packet, TSF, can be calculated as
where TSF-UL-pack is the total up-link time, and TSF-DL-pack is the total down-link time. The LoRa gateway’s capacity can be defined as the total number of packets that the gateway serves per day. This may be represented by the throughput and can be calculated as
where NENpack is the total number of packets transmitted by one end node per day, λ2% is the rate of arrival of packets at a probability of packet loss Ploss of 2, Nf is the total number of radio channels deployed by the LoRa network, and PSF is the of using certain SF. Based on the results of Figure 3, the value of λ2% is equal to 0.01.
4. Problem Statement
More cluster members should be expected to result in more significant savings in end devices’ network resources. However, the number of end devices in a cluster is limited by the CH throughput and traffic generated and their physical location relative to the CH. Due to the radio channel’s peculiarities, the channel resource between the cluster member and the CH may be different for different members or CH and the characteristic of the expected channel quality for the cluster members.
We assume different scenarios and selection criteria choices, both cluster members and CH. For example, we can follow the maximum throughput, uniform distribution among the cluster members or the maximum cluster members, and consider or predict users’ traffic intensity. To choose one or another scenario, we need to know the resulting solution’s characteristics.
We will characterize the cluster by the throughput between the cluster members and CH and the achievable data transfer rate. We will analyze the throughput of cluster members with different laws of end device distribution. Different clustering methods can provide different solutions in terms of the distribution of end devices within the cluster.
5. System Description
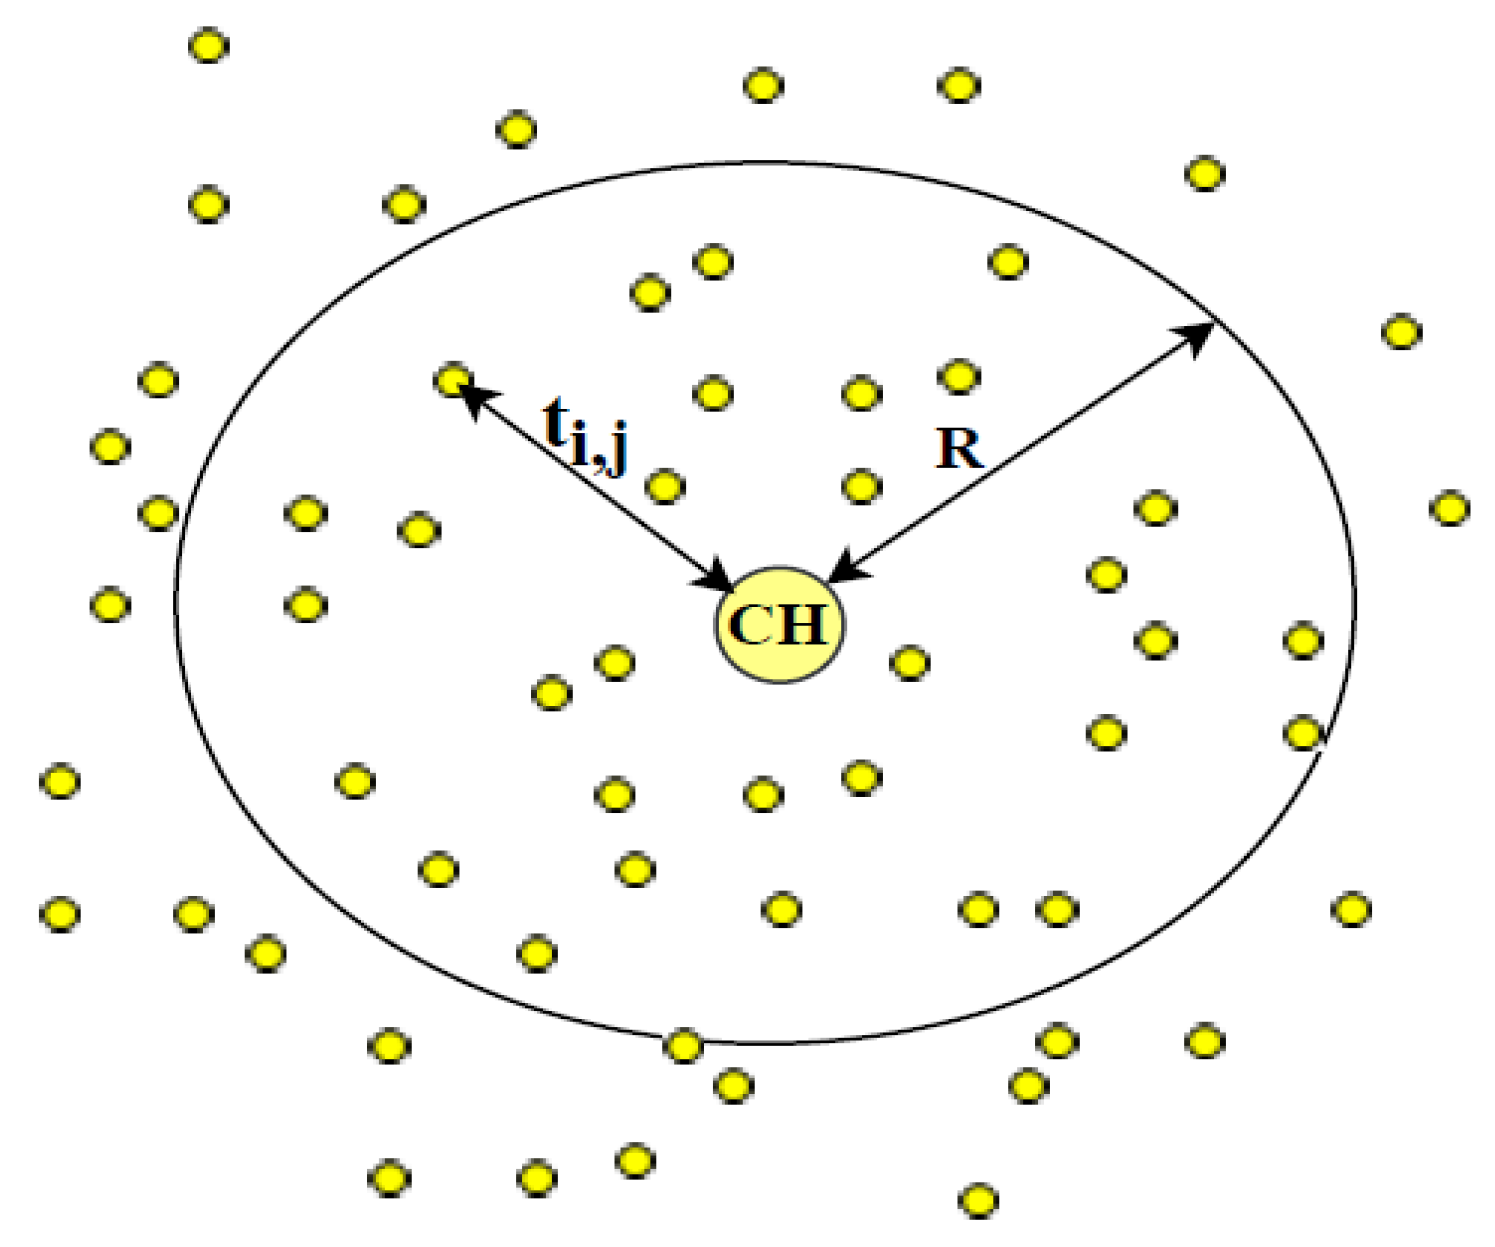
Building IoT applications provide a high-quality environment due to the massive amount of data collected through many sensors. Such sensors installed in monitoring sites will collect and analyze information about the air level, soil and water pollution; noise level, the level of reservoirs and rivers. All the information received from these heterogeneous applications generates a single LoRa network to provide a high QoS for all traffic types within the LoRa network. The QoS is measured as the packet reception ratio (PRR) function and throughput of the LoRa network. Thus, we must characterize the throughput value made in terms of the QoS. We will consider the throughput as an objective metric among the network elements tij. In our study, we also considered the head node (HN) of the cluster has already been determined without considering the clustering methods. We assumed the HN communication zone is a disk with a radius R, centered at the CH location, as shown in Figure 4.
We considered LoRa technology as a communication method among end nodes. We have to specify the nature of dependence tij on the network parameters. On the way of signal propagation to the receiver from the transmitter occurs environmental energy absorption, whereby the output signal at the receiver is significantly reduced, i.e., signal attenuation occurs. There are different attenuation models, taking into account various factors such as distance, carrier frequency, and obstacles in the path of signal propagation. One common attenuation model is described as
The signal strength depends on the power of the transmitter. The majority of LoRa equipment has 25 mW transmitters. To describe the transmitter power, a relative value (power level) is often used, with the power of 1 mW, in decibels, defined as
where P is the transmitter power (W).
The signal power at the receiver input will be determined as follows:
where is the transmitter output signal power, and A(d) is the signal loss from the distance that can be calculated according to the formula (15). Using the data from Table 4 and Formula (17), we can plot a graph of the dependence of the data rate on the distance, as shown in Figure 5. The signal/noise + noise (SINR) and SNR values are the dependent data transmission rate on signal power.
Every parameter determined above impacts the channel throughput and can be chosen as a metric in a clustering task. In this work, we analyze throughput in a cluster.
In Figure 5, the throughput value depends on receiving and, in practice, has considerable dispersion.
In urban conditions for indoor application where there is a dense building, it is possible to apply the decay model ITU-RP.1238-5 for premises:
where d is the distance in (m); n = 33—remote power loss factor; f is the center frequency of the signal (MHz); Lf (n) = 24 is the loss factor due to the passage of the signal through the obstacle (dB).
Considering the attenuation model, we depict the throughput dependency on the distance by the Gaussian function (Figure 5) [29].
where d is the distance (m); is the maximum data transmission rate (bit/s); c is the curve half-width (m); (m) is the radius from CH to HN communication zone.
Since the throughput, according to the given model, depends on the distance, which to an arbitrarily chosen point should be considered as a random variable, then the throughput is a distribution function t can be calculated as
where refers to the users distribution function on a dick with radius R, is the range of t values.
The probability density t is defined as
The mathematical expected value t is
In our clustering model, we consider different types of user distributions, as discussed in Section 5.1 and Section 5.2.
5.1. Uniform Distribution
We will presume that end nodes’ uniform distribution is specified in the service area with a circle S and radius R (S = πR2). Thus, end nodes are distributed over the interval 0 ≤ r ≤ R. The radius of the circle R can be defined as a solution to the following equation:
The probability density function f(r), in this case, is constant and will be close to the uniform distribution for the distribution of end nodes inside the circle S:
For the functional dependence of the throughput t on the distance between gateways has the form (20), that is
We can express from (20) (M).
According to (21), throughput distribution function F(t) on a circle with radius R will be determined as
Based on (22), the probability density function of the throughput can be shown as
Probability density functions and throughput distribution are shown in Figure 6.
For the LoRa standard, the mathematical expectation of the throughput M (t) in the communication zone between end nodes according to (23) will be calculated as
When approximating the throughput function on the distance by using a uniform distribution of end nodes in the communication zone, the mathematical expectation of the throughput for the LoRa standard is 2654 bit/s.
5.2. Normal Distribution
Assuming that end nodes are randomly distributed in the communication area, then the distribution of end nodes over the communicated area is random, and a random value can describe their coordinates in each point on the surface, i.e., such a distribution can be given by a pair of random, independent coordinates x and y. Then the F(t) of the end nodes distribution can be defined as the joint distribution function of the random values x and y. In this case, we will consider the normal distribution of end nodes with a scattering center at the center of the circle representing the communication area. Equation (30) defines the density distribution in both coordinates (x and y):
where σ is the standard deviation (RMS).
For throughput analysis, we will assume that the probability of a point falling inside the circle of radius R is equal to 1, i.e., we will only consider users within the circle. The law of normal distribution is unlimited in both coordinates x and y. This assumption introduces a certain error; this error, a truncated normal distribution was used, which is bounded in both coordinates by the radius R. This distribution cannot be normal since it is bounded. The distribution of users within the communication area described by a circle S can be described by the “truncated normal” distribution [29].
where
Here SR denotes the service area bounded by the circle with radius R.
Based on the obtained expressions, we find the F(t) inside the circle with radius R. For this, from (19) and (20), we obtain .
Then from (20), according to (31) and (32), the throughput distribution function can be determined as
Based on the obtained expression (33), the throughput probability density, according to (34), will be determined as
Figure 7 shows the probability density and throughput distribution function results.
From the expression for the throughput probability density in (34), an expression for the mathematical expectation of the throughput value can be defined as
For the LoRa standard, the value of M (t) at σ of RMS 100, 200, 250 m takes the values of 8520, 6680, and 5750 bps, respectively.
6. Clustering Method Selection
We will consider a network of 20 thousand nodes in a field with 10 km sides. The coordinates of the nodes are distributed randomly according to a uniform distribution law. The maximum range of the lock is 824 m (from Table 4). We use two clustering methods [30] to the specifics of the projected communication network described by radio signal attenuation models and the distribution of subscriber traffic on the served area the previous section. The formation of a cluster consists of choosing a group of end devices and distributing their functionality within the cluster. The solution of the clustering problem is similar to the solution of the optimization problem in which some metric d(m, pm) is minimized (maximized), which characterizes the "distance" between a cluster member and the cluster center . Throughput, distance, and energy efficiency can act as such a metric. A dynamic programming method is used for the solution, which minimizes across all clusters.
For the formation, it is necessary to determine the method for finding an optimal solution. The QoS for traffic within the cluster between the CH and the network depends on the throughput of the channels between the cluster members and between the CH and LoRa Gateway and the traffic intensity generated by end devices.
Clustering algorithms K-means Algorithm 1 and FOREL Algorithm 2 are used to optimize communication network capacity.
where is the distance between the center of mass of the j-th cluster and the r-th element of the j-th cluster ;
When interpreting K-means algorithm as an optimization problem, its objective function can be expressed as follows:
where k is the number of clusters;
—defines a set of objects (elements) of the i-th cluster;
—point of the center of mass of the i-th cluster (coordinates of the point of the center of mass);
—object of the j-th cluster (object coordinates).
| Algorithm 1. K-means |
| Require: The k is a number of clusters, C1, C2,….CK points that corresponds to the devices, CMJ j = 1,...,k—centers of clusters (mass centers). Input: Set K random points Output: Centers (C1, ….CK) Clist List of Clusters. Procedure: Mode selection and K-Means clustering Algorithm. Choose K initial centers CM J =. For: CJ < = CMJ do Set new centers of mass /*using Equations (39) or (40) */ If = Then Set m1 is new centers of mass /*using Equations (39) or (40) */ Each object Xi is assigned to the nearest Ci; for the resulting groups, the centers of mass are calculated. Transition CM (CI = CM). End for fix Cj as the centers of the masses of the clusters, and Xi as the elements of the J cluster End procedure. |
| Algorithm 2. FOREL |
| Require: The R is a communication rage (radius of the service area), the cluster number i = 1. C1, C2,….CK points that corresponds to the devices, CMJ j = 1, ..., k—centers of clusters (mass centers). Input: Set K random points . Output: Centers (C1, … CK) Clist List of Clusters. Procedure: Mode selection and FOREL clustering Algorithm. Choose K initial centers CM J = . For: True do for all Xi points at a distance of CI < = R calculate the center of mass (CM)/*using equations (39) or (40) */ while: Ci = CM Transition CM (CI = CM). End while fix Cj as the centers of the masses of the clusters, and Xi as the elements of the J cluster End for End procedure |
The difference is the Euclidean distance between the cluster object and the center of the given cluster’s mass.
When using K-means algorithm for two-dimensional space, i.e., when each of the objects has two characteristics (x and y) coordinates, each object can be considered a point on the flatness, characterized by its two coordinates (, ).
The coordinates of the center mass of the j-th cluster is defined as the average value for each of the coordinates:
where nj is the number of elements in the j-th cluster , are the coordinates of the r-th element of the j-th cluster.
Along with coordinates, each object can be characterized by a certain numerical parameter . Taking into account the last coordinates of the center mass of the cluster will be defined as the coordinates of the center of mass of a flat figure as
The fundamental difference between the FOREL method and the K-means method is that the FOREL algorithm does not specify the number of clusters but assumes specifying the cluster size R.
When using this algorithm, expression (37) is minimized. The coordinates of the centers of mass of clusters are determined, which can be taken as positions for placing gateways.
7. Evaluation Results
Using the FOREL and K-means clustering methods, a network consisting of 25 clusters was obtained as a result of modeling. The simulation results for both clustering methods are illustrated in Figure 8a FOREL and Figure 8b K-means.
To compare the two considered clustering methods for LoRa networks, we consider the distribution of cluster members relative to the cluster’s center as the comparison metric. Distribution is obtained by simulation modeling. For center-of-mass, we used the following expression:
where , is the center-of-mass coordinate of cluster ; is the coordinate of element of cluster; is the cluster; is the element of cluster; is the number of elements within the cluster, and is the number of clusters.
It can be seen from the above results that the resulting clusters differ significantly in shape and size. This solution is quite obvious since the clustering problem with a high density of users was close to covering the service area with several circles (the minimum number of circles). Naturally, suppose the circles have the same radius. In that case, it is impossible to avoid their intersections, which ultimately leads to the formation of clusters of different shapes with different numbers of elements.
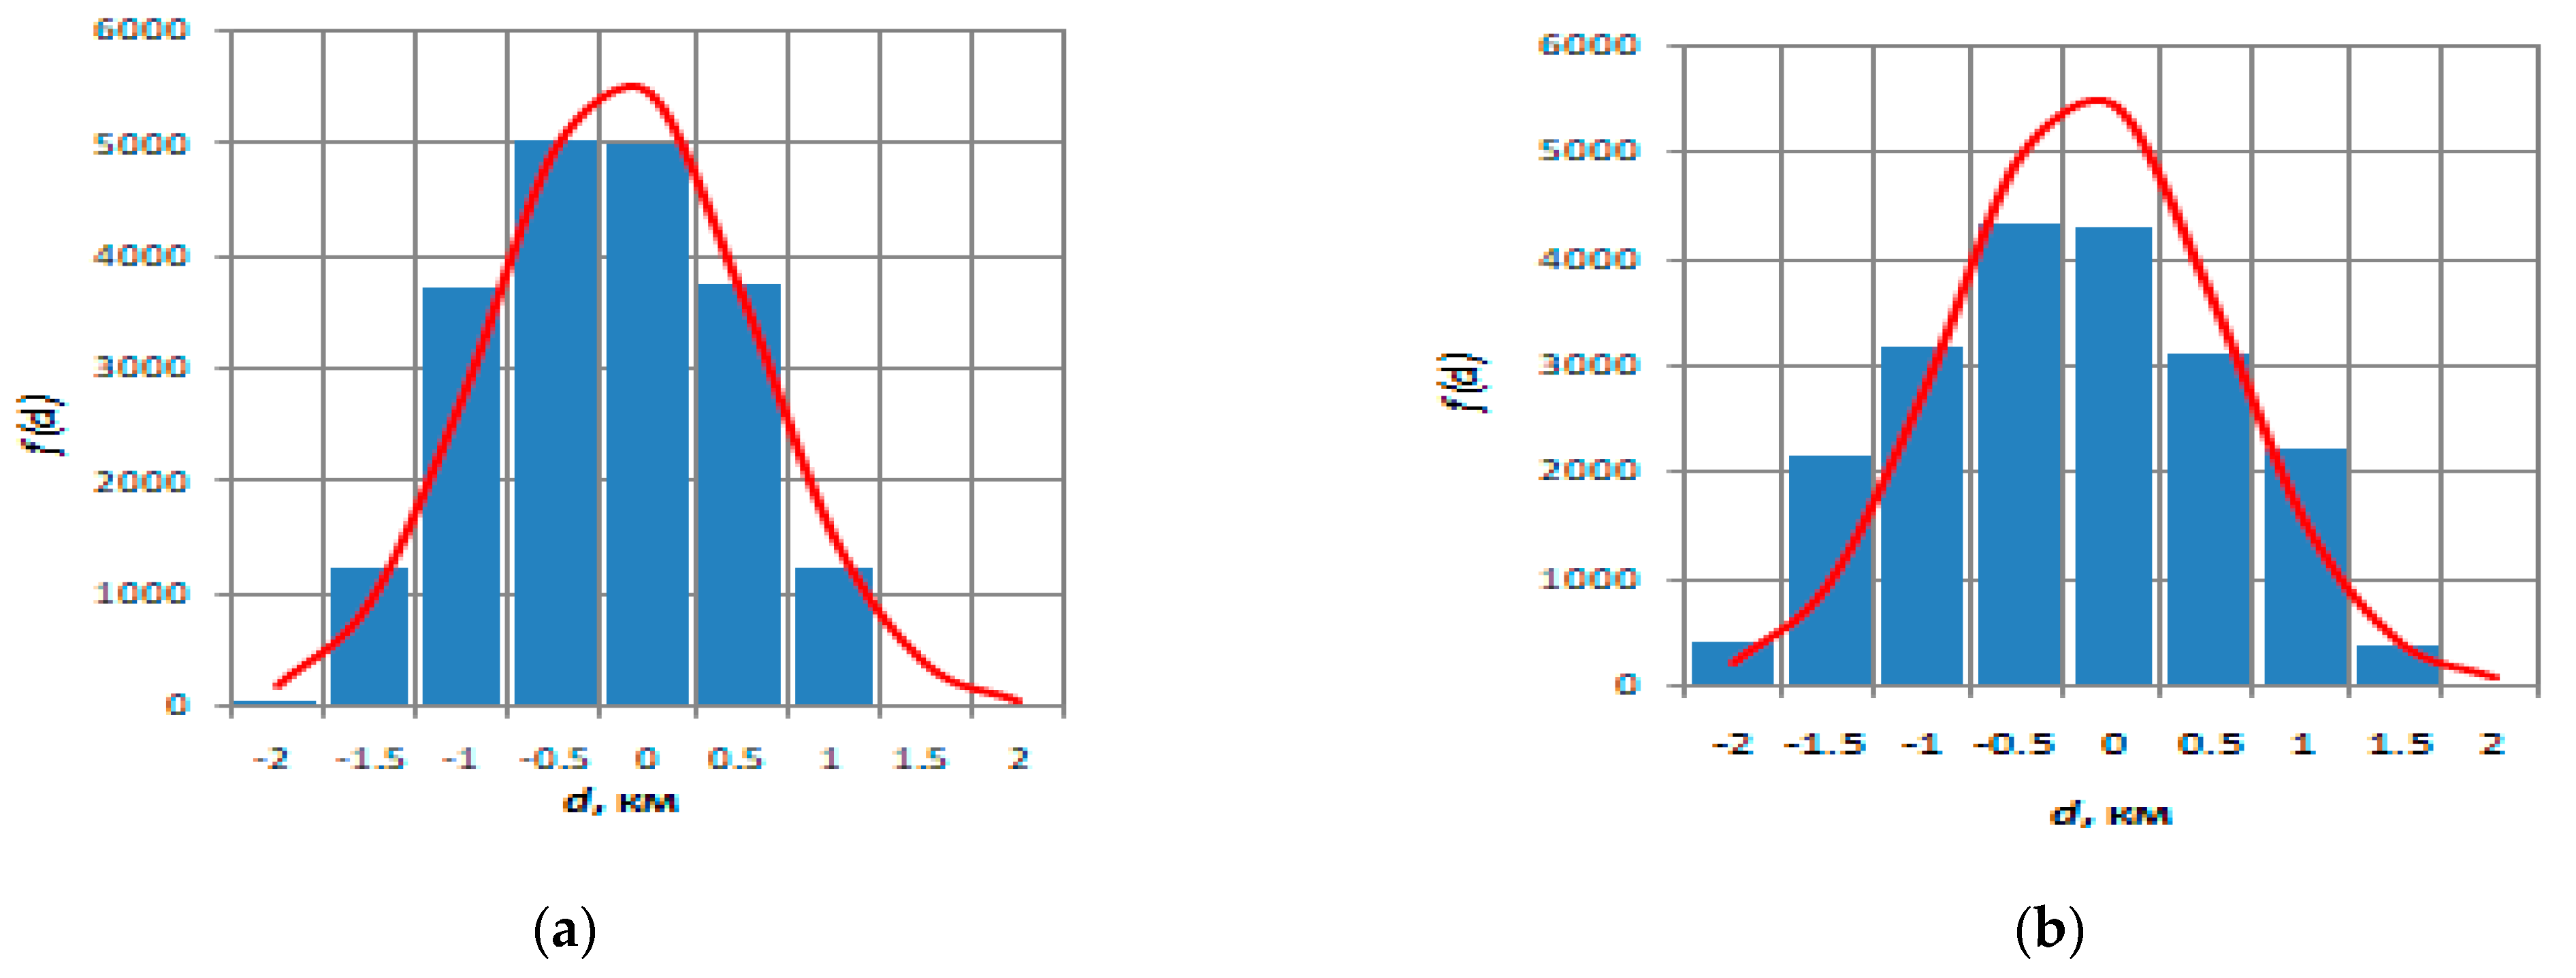
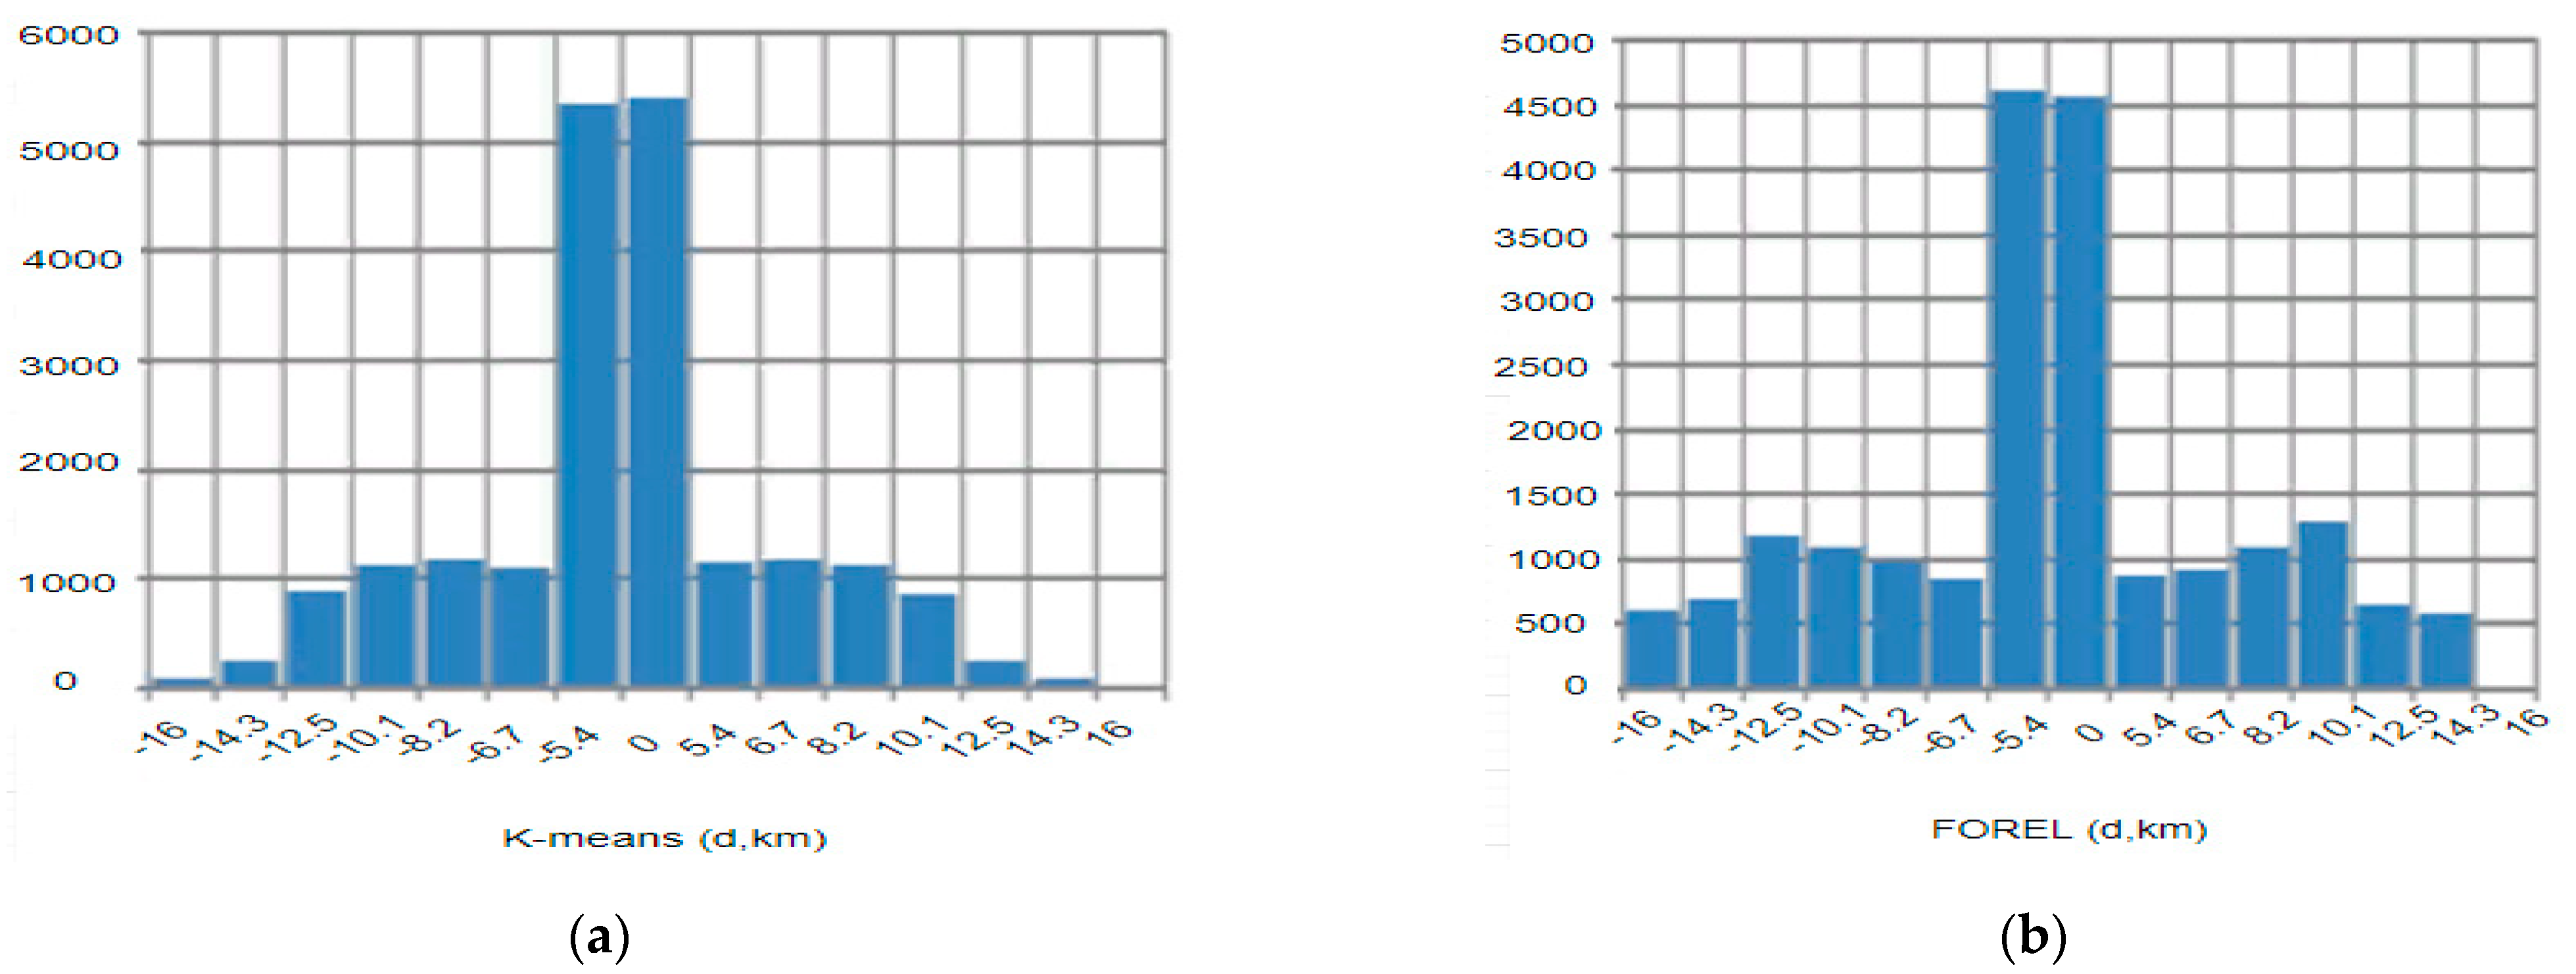
Figure 9 shows the relative distribution of nodes in the considered cluster for both considered clustering algorithms. The vertical axis in Figure 9 represents the number of nodes, while the horizontal axis indicates the relative distance between nodes and the cluster center. The negative value of the relative distance in Figure 9 shows that the nodes are located at the right side of the cluster center. As indicated in Figure 9, the main distribution of the nodes is located around the cluster center for both clustering methods.
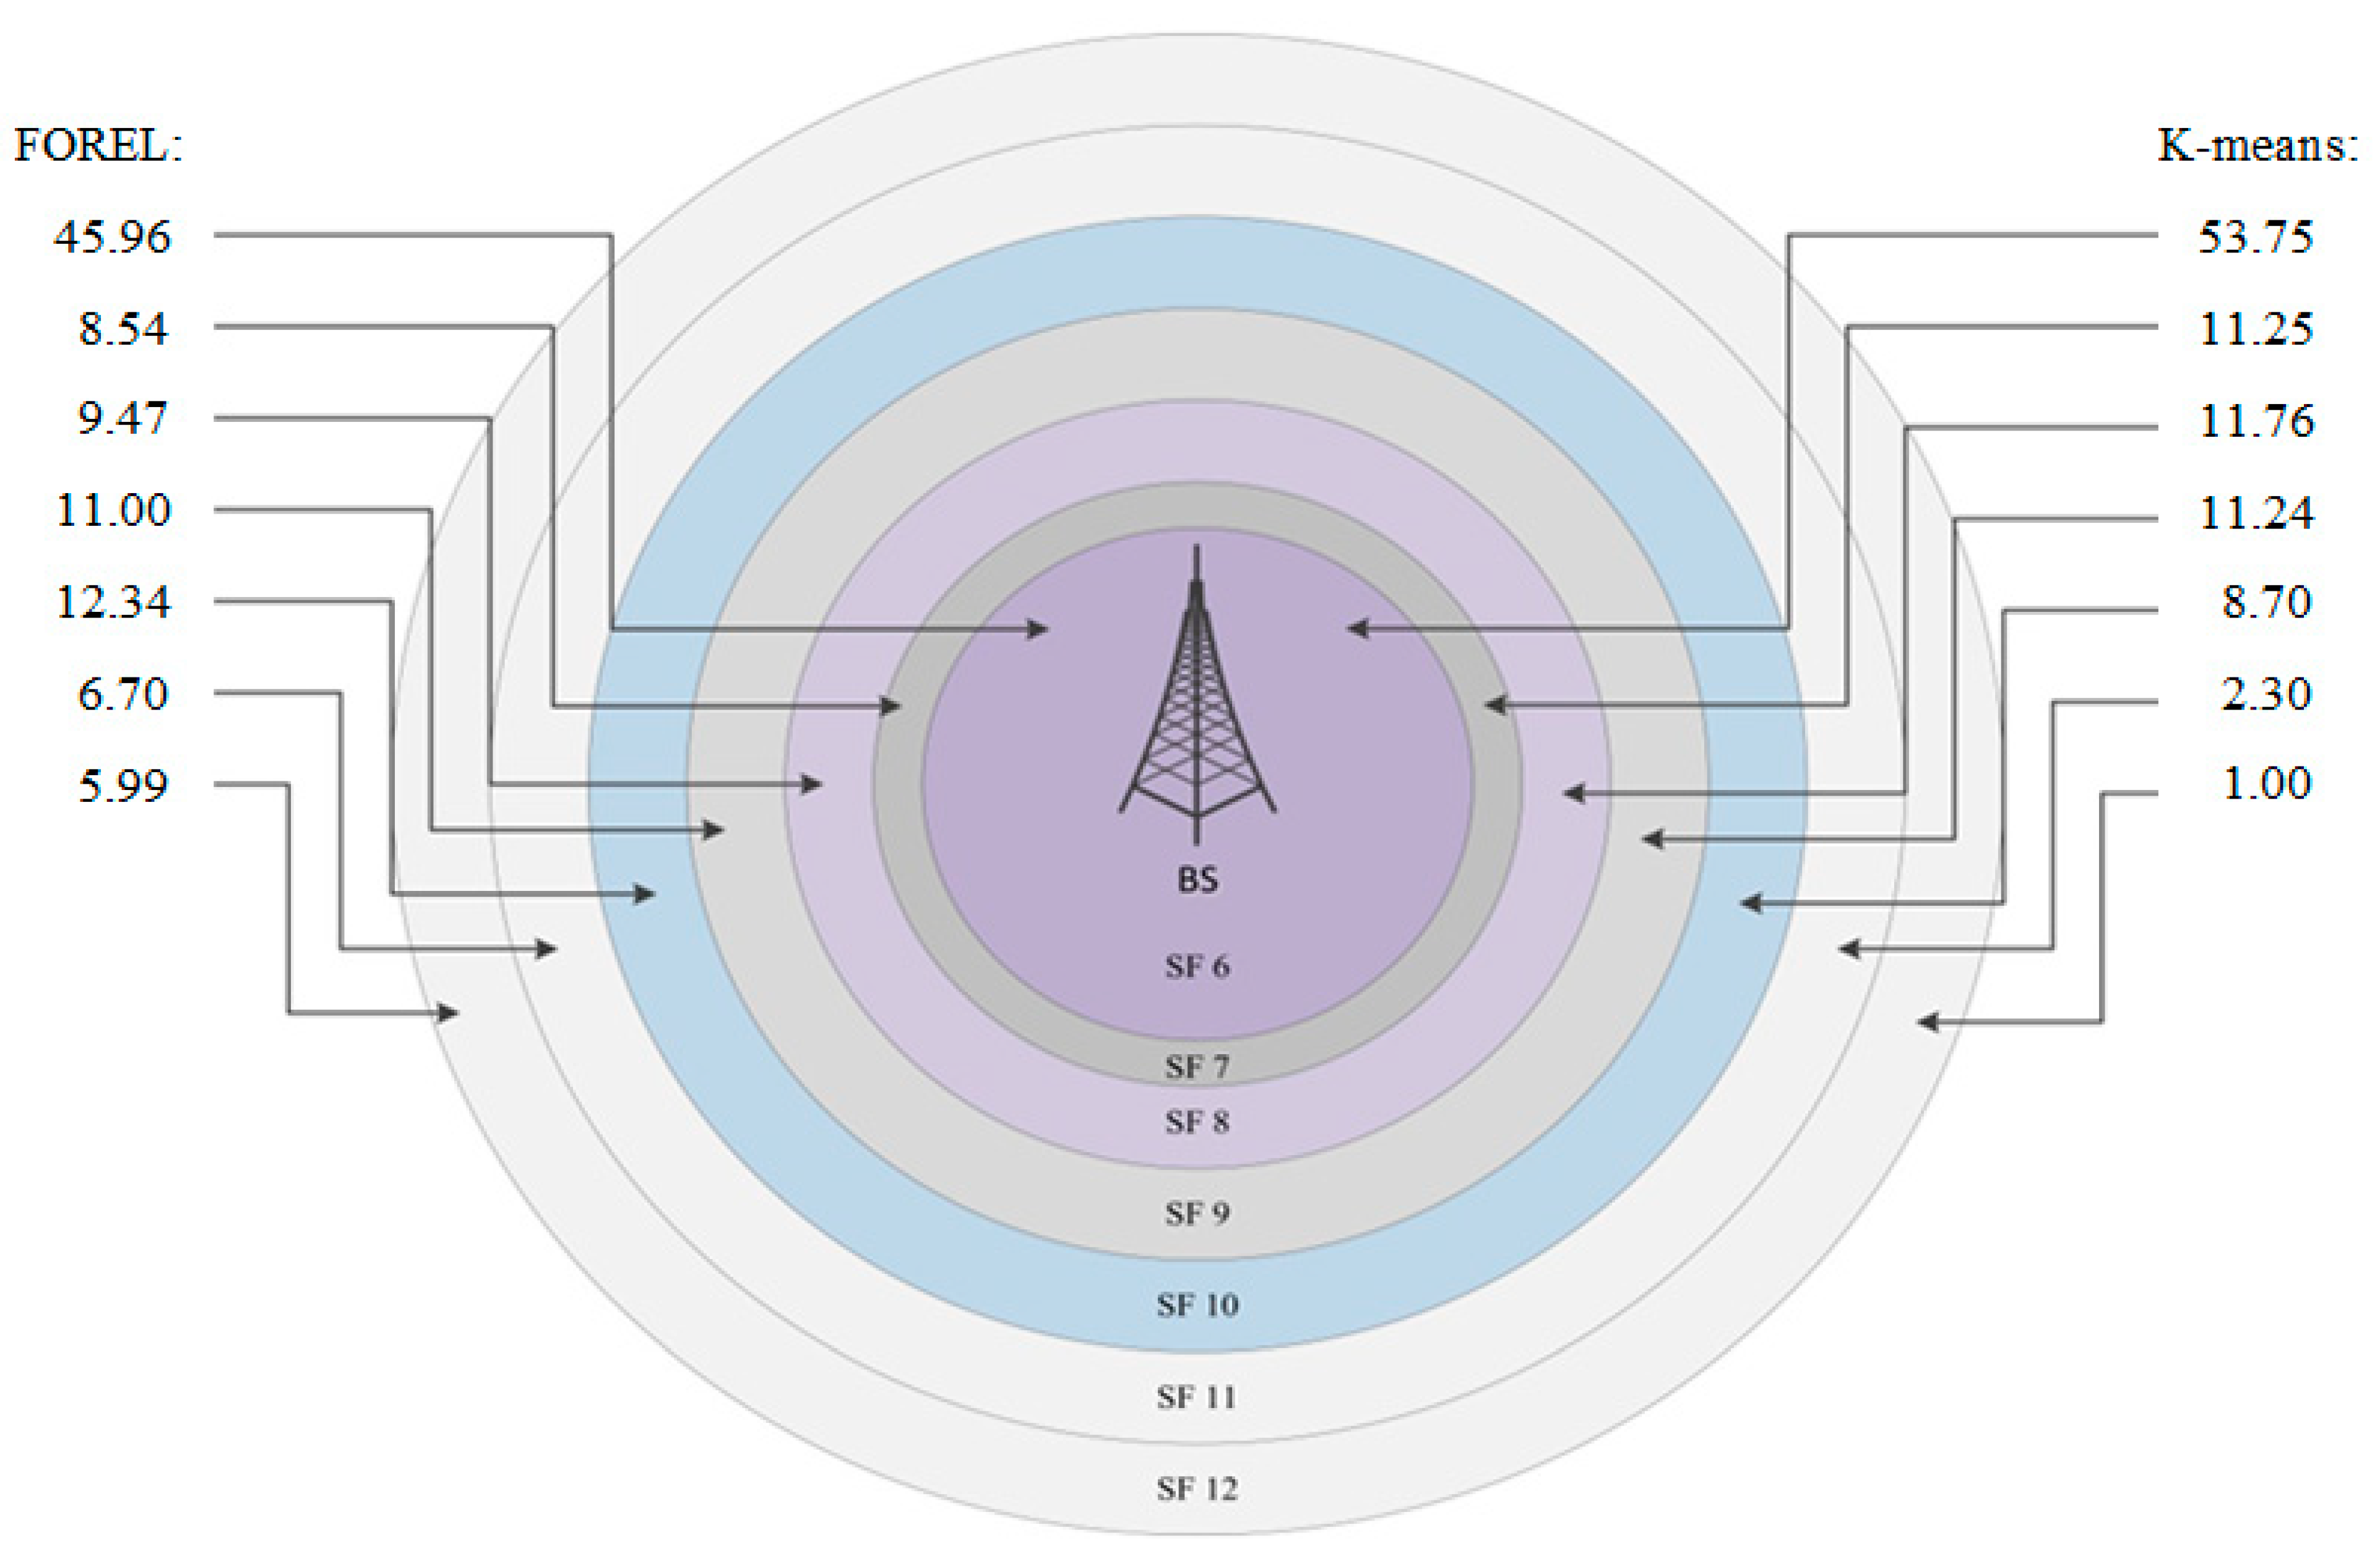
Thus, it is possible to determine the average number of nodes in each SF zone; according to Table 4, Figure 10 indicates the average number of nodes in each SF zone for various clustering methods.
We calculate the capacity of the LoRa gateway for the two clustering methods discussed above, where the nodes are distributed differently by the area of the radio coverage zones. For FOREL = {45.96%; 8.54%; 9.47%; 11%; 12.34%; 6.7%; 5.99%} and for K-means {53.75%; 11.25%; 11.76%; 11.24%; 8.7%; 2.3%; 1.0%} as shown in Figure 11.
The LoRa gateway’s capacity can be calculated for FOREL and K-means clustering methods as shown in using Equation (14). Table 5 indicates this value and the total number of nodes.
Thus, to build a LoRa network that handles 20,000 end devices with the above-introduced characteristics, five to six gateways are needed to deploy the clustering algorithm, either FOREL or K-means.
The experiments showed that with a huge number of clusters, the K-means method allows obtaining results with a normal distribution of nodes across clusters and a higher throughput than the FOREL method. The network nodes are uniformly distributed in the service area.
By applying the above-proposed model, the average throughput value with a normal distribution is 8520 bit/s and with a uniform distribution is 2654 bit/s. Thus, to further assess the effectiveness of our solution, we compare our model with the literature. Table 6 describes a comparison of our proposed model with the literature for throughput values.
8. Discussion
Before obtaining the results achieved, clustering is to save network resources and improve the QoS. In both cases, the criterion for forming the cluster should take into account the available resources, transfer traffic from end nods, and QoS requirements.
The results presented in the previous section analysis of the channel capacity between the CM and the CH showed its dependence on the distribution of end nodes. In particular, the results showed that a larger average throughput value is achieved with a normal distribution than with a uniform distribution.
Cluster analysis algorithms can be applied to find partial solutions to selecting the coordinates of access points, considering the nature of the distribution of traffic sources over the served territory and CH nodes’ choice.
Applying the algorithms of cluster analysis, necessary to the specifics of the projected communication network, which is described by models of radio signal attenuation and the model of distribution of subscriber traffic on the served area, thus the solutions, which are obtained in the previous section as a result of cluster analysis application, are the partial solutions of the optimization problem in communication network capacity.
Simulation of network clustering based on FOREL and K-means algorithm in the above section showed that these algorithms allow forming clusters from local groups of end nodes. The cluster size is given by the parameter R and the number of clusters selected, taking into account the availability and quality of communication.
To form clusters of LoRa end devices based on the bandwidth of the channels between the HN and CM can be used known methods of clustering objects. It is possible to use clustering methods based on finding the centroid, evaluating connectivity, density.
Our simulation results of two centroid clustering methods showed that the law of elements distribution in clusters depends on the number of clusters. With a relatively huge number of clusters, the service area’s distribution elements are close to the normal law and relatively small to the uniform law.
The clustering method and parameters’ choice is reflected in the distribution of cluster elements and the throughput between cluster elements and HN.
9. Conclusions and Future Work
This paper proposed a novel cluster throughput model to estimate the expected throughput value in clusters of end devices built using LoRa networks. In contrast to known models, it allows for the description of the throughput distribution function in a cluster of end devices.
We developed clustering algorithms using dense LoRa-based IoT networks that allow clustering of end devices according to the criterion of maximum served traffic. The algorithms are built based on two-common methods, K-means and Forel. In contrast to existing methods, the developed method provides the maximum value of served traffic in a cluster.
Results highlight our solution’s effectiveness that our proposed model achieved a larger average throughput value with a normal distribution than with a uniform distribution.
Future work shall consider a novel clustering algorithm for achieving a higher level of flexibility so that the network will support the insertion and cutting of network devices and shall consider more QoS metrics. Furthermore, the LoRa network will have the flexibility level that enables the set-up of new applications.
Author Contributions
Conceptualization, M.S.A.M.; methodology, M.S.A.M., P.W. and M.W.; software, P.W., M.W. and A.R.; validation, M.S.A.M.; formal analysis, A.R.; investigation, M.S.A.M.; resources, P.W., M.W. and N.N.J.; data curation, M.S.A.M.; writing—original draft preparation, M.S.A.M.; writing—review and editing, A.R. and N.N.J.; visualization, M.S.A.M.; supervision, P.W. and M.W.; project administration, P.W. and M.W.; funding acquisition, P.W. and M.W. All authors have read and agreed to the published version of the manuscript.
Funding
This research was funded by The National Key Research and Development Program of China (2017YFE0123000).
Institutional Review Board Statement
Not applicable.
Informed Consent Statement
Not applicable.
Data Availability Statement
Data available on request due to restrictions–privacy. The data presented in this study are available on request from the corresponding author.
Acknowledgments
Many thanks are due to Ammar Muthanna and Min Wei for the assistance in the methodological work.
Conflicts of Interest
The authors declare no conflict of interest.
References
- Rghioui, A.; Oumnad, A. Internet of things: Surveys for measuring human activities from everywhere. Int. J. Electr. Comput. Eng. 2017, 7, 2474–2482. [Google Scholar] [CrossRef]
- Semtech, “Smart cities transformed using semtech’s LoRa technology,” July 2017, White Paper. Available online: https://info.semtech.com/smart_city_white_paper_download (accessed on 22 December 2020).
- Khan, P.W.; Byun, Y.C.; Park, N. IoT-Blockchain Enabled Optimized Provenance System for Food Industry 4.0 Using Advanced Deep Learning. Sensors 2020, 20, 2990. [Google Scholar] [CrossRef] [PubMed]
- Khan, P.W.; Byun, Y.A. Blockchain-Based Secure Image Encryption Scheme for the Industrial Internet of Things. Entropy 2020, 22, 175. [Google Scholar] [CrossRef] [PubMed] [Green Version]
- Muthanna, M.S.A.; Lyachek, Y.T.; Musaeed, A.M.O.; Esmail, Y.A.H.; Adam, A.B.M. Smart system of a real-time pedestrian detection for smart city. In Proceedings of the IEEE Conference of Russian Young Researchers in Electrical and Electronic Engineering, Saint Petersburg and Moscow, Russia, 27–30 January 2020; pp. 45–50. [Google Scholar]
- Semtech, LoRa Modulation Basics, AN1200.22 Revision 2. Semtech. 17 May 2015. Available online: https://www.semtech.com/uploads/documents/an1200.22.pdf (accessed on 22 December 2020).
- Wydra, M.; Kubaczynski, P.; Mazur, K.; Ksiezopolski, B. Time-Aware Monitoring of Overhead Transmission Line Sag and Temperature with LoRa Communication. Energies 2019, 12, 505. [Google Scholar] [CrossRef] [Green Version]
- Adil, N.; Khan, P.W.; Byun, Y.C. Performance Enhancement through Communication Offloading for Energy Efficiency on Mobile Cloud Computation. Int. J. Sci. Technol.Res. 2020, 9, 186–194. [Google Scholar]
- Muthanna, M.S.A.; Wang, P.; Wei, M.; Abuarqoubet, A.; Alzu’bi, A.; Gull, H. Cognitive control models of multiple access IoT networks using LoRa technology. Cognitive Syst. Res. 2021, 65, 62–73. [Google Scholar] [CrossRef]
- Adelantado, F.; Vilajosana, X.; Tuset-Peiro, P.; Martinez, B.; MeliaSegui, J.; Watteyne, T. Understanding the Limits of LoRaWAN. IEEE Commun. Mag. 2017, 55, 34–40. [Google Scholar] [CrossRef] [Green Version]
- Bor, M.C.; Roedig, U.; Voigt, T.; Alonso, J.M. Do LoRa Low-Power Wide-Area Networks Scale? In Proceedings of the 19th ACM International Conference on Modeling, Analysis and Simulation of Wireless and Mobile Systems, New York, NY, USA, 13–17 November 2016; pp. 59–67. [Google Scholar]
- Augustin, A.; Yi, J.; Clausen, T.; Townsley, W.M. A Study of LoRa: Long Range: Low Power Networks for the Internet of Things. Sensors 2016, 16, 1466. [Google Scholar] [CrossRef] [PubMed]
- Liando, J.C.; Gamage, A.; Tengourtius, A.W.; Li, M. Known and unknown facts of lora: Experiences from a large-scale measurement study. ACM Transactions Sens. Netw. (TOSN) 2019, 15, 16. [Google Scholar] [CrossRef]
- Muthanna, M.S.A.; Wang, P.; Wei, M.; Ateya, A.A.; Muthanna, A. Toward an Ultra-Low Latency and Energy Efficient LoRaWAN; Galinina, O., Andreev, S., Balandin, S., Koucheryavy, Y., Eds.; NEW2AN/ruSMART-2019. LNCS; Springer: Cham, Switzerland, 2019; Volume 11660, pp. 233–242. [Google Scholar] [CrossRef]
- Luvisotto, M.; Tramarin, F.; Vangelista, L.; Vitturi, S. On the Use of LoRaWAN for Indoor Industrial IoT Applications. Wirel. Commun. Mob. Comput. 2018, 2018, 1–11. [Google Scholar] [CrossRef] [Green Version]
- Bor, M.; Roedig, U. LoRa Transmission Parameter Selection. In Proceedings of the 2017 13th International Conference on Distributed Computing in Sensor Systems (DCOSS), Ottawa, ON, Canada, 5–7 June 2017; pp. 27–34. [Google Scholar]
- Lavric, A. LoRa (Long-Range) High-Density Sensors for Internet of Things. Sensors 2019. [Google Scholar] [CrossRef]
- Sanchez-Iborra, R.; Liaño, I.G.; Simões, C.; Couñago, E.; Skarmeta, A. Tracking and Monitoring System Based on LoRa Technology for Lightweight Boats. Electronics 2018, 8, 15. [Google Scholar] [CrossRef] [Green Version]
- Hauser, V.; Hégr, T. Proposal of Adaptive Data Rate Algorithm for LoRaWAN-Based Infrastructure. In Proceedings of the 2017 IEEE 5th International Conference on Future Internet of Things and Cloud (FiCloud), Prague, Czech Republic, 21–23 August 2017; pp. 85–90. [Google Scholar] [CrossRef]
- Martinez-Sandoval, R.; García-Sánchez, A.; García-Haro, J. Performance optimization of LoRa nodes for the future smart city/industry. EURASIP J. Wirel. Commun. Netw. 2019, 1–13. Available online: https://0-doi-org.brum.beds.ac.uk/10.1186/s13638-019-1522-1 (accessed on 22 December 2020).
- AN1200.22 LoRaTM Modulation Basics, Revision 2, Semtech Corporation. May 2015. Available online: http://www.semtech.com/images/datasheet/an1200.22.pdf (accessed on 15 August 2020).
- LoRa Alliance. LoRaWAN Specification, V. 1.1; LoRa Alliance: Fremont, CA, USA, 2017; Available online: https://lora-alliance.org/resource-hub/lorawanr-specification-v11 (accessed on 15 September 2019).
- Vangelista, L. Frequency Shift Chirp Modulation: The LoRa Modulation. IEEE Signal Process. Let. 2017, 24, 1818–1821. [Google Scholar] [CrossRef]
- Semtech, SX1272/73 Low Power Long Range Transceive. Available online: https://www.semtech.com/uploads/documents/sx1272.pdf (accessed on 22 December 2020).
- Baccelli, F.; Blaszczyszyn, B.; Muhlethaler, P. An Aloha protocol for multihop mobile wireless networks. IEEE Trans. Inf. Theory 2006, 52, 421–436. [Google Scholar] [CrossRef] [Green Version]
- Yasmin, R.; Petäjäjärvi, J.; Mikhaylov, K.; Pouttu, A. On the integration of LoRaWAN with the 5G test network. In Proceedings of the 2017 IEEE 28th Annual International Symposium on Personal, Indoor, and Mobile Radio Communications (PIMRC), Montreal, QC, Canada, 8–13 October 2017; pp. 1–6. [Google Scholar]
- Blaszczyszyn, B.; Muhlethaler, P. Stochastic analysis of nonslotted Aloha in wireless ad-hoc networks. In Proceedings of the IEEE INFOCOM, San Diego, CA, USA, 14–19 March 2010; pp. 1–9. [Google Scholar]
- ITU-R Recommendations. Propagation Data and Prediction Methods for the Planning of Indoor Radio Communication Systems and Radio Local Area Networks in the Frequency Range 900MHz to 100GHz, ITU-R P.1238-5; International Telecommunication Union: Geneva, Switzerland, 2007. [Google Scholar]
- Weisstein, E.W. Gaussian Function. Available online: https://mathworld.wolfram.com/ (accessed on 27 November 2002).
- Boyinbode, O.; Le, H.; Mbogho, A.; Takizawa, M.; Poliah, R. A Survey on Clustering Algorithms for Wireless Sensor Networks. In Proceedings of the 2010 13th International Conference on Network-Based Information Systems, Takayama, Japan, 14–16 September 2010; pp. 358–364. [Google Scholar] [CrossRef]
Figure 1.
LoRaWAN (Long Range Wide Area Network) stack.

Figure 2.
LoRaWAN network architecture.

Figure 3.
Dependence of (a) the average number of packets C that is successfully transmitted and (b) the probability of losses from collisions P from the intensity λ.
Figure 3.
Dependence of (a) the average number of packets C that is successfully transmitted and (b) the probability of losses from collisions P from the intensity λ.

Figure 4.
Considered cluster model.

Figure 5.
The dependence between the data transmission rate and distance.

Figure 6.
Probability of throughput distribution function F(t) (a) and throughput probability density function f(t) (b) for uniform distribution of nodes.
Figure 6.
Probability of throughput distribution function F(t) (a) and throughput probability density function f(t) (b) for uniform distribution of nodes.

Figure 7.
Probability distribution function F(t) (a) and probability density function f(t) (b) of the throughput (normal distribution of users).
Figure 7.
Probability distribution function F(t) (a) and probability density function f(t) (b) of the throughput (normal distribution of users).

Figure 8.
Simulation results for (a) FOREL and (b) K-means clustering methods.

Figure 9.
Relative distribution of nodes in the clusters for (a) FOREL clustering method and (b) K-mean clustering method.
Figure 9.
Relative distribution of nodes in the clusters for (a) FOREL clustering method and (b) K-mean clustering method.

Figure 10.
The average number of nodes in different SF zones (in percent, %) for (a) K-mean clustering method and (b) FOREL clustering method.
Figure 10.
The average number of nodes in different SF zones (in percent, %) for (a) K-mean clustering method and (b) FOREL clustering method.

Figure 11.
The average number of nodes in different SF zones for FOREL and K-means clustering methods (in percent, %).
Figure 11.
The average number of nodes in different SF zones for FOREL and K-means clustering methods (in percent, %).


Table 1.
Transmission speed and receiver sensitivity from spreading factor (SF).
| Bandwidth (kHz) | SF | Nominal Bit Rate Rb (bps) | Sensitivity (ρ)(dBm) |
|---|---|---|---|
| 125 | 6 | 9375 | −118 |
| 125 | 7 | 5469 | −123 |
| 125 | 8 | 3125 | −126 |
| 125 | 9 | 1758 | −129 |
| 125 | 10 | 977 | −132 |
| 125 | 11 | 537 | −134 |
| 125 | 12 | 293 | −137 |
Table 2.
Values of up-link frame duration at various values of SF used by Long Range (LoRa).
| SF | bw (kHz) | Ts (ms) | npreamble | FRM (byte) | PL (byte) | H | CRC | DE | CR | Payload-SymNb | Tpreamble (ms) | Tpayload (ms) | TULframe (ms) |
|---|---|---|---|---|---|---|---|---|---|---|---|---|---|
| 6 | 125 | 0.51 | 6 | 8 | 20 | 0 | 1 | 0 | 1 | 48 | 5.25 | 24.48 | 29.73 |
| 7 | 125 | 1.02 | 6 | 8 | 20 | 0 | 1 | 0 | 1 | 43 | 10.5 | 43.86 | 54.36 |
| 8 | 125 | 2.05 | 6 | 8 | 20 | 0 | 1 | 0 | 1 | 38 | 20.99 | 77.9 | 98.89 |
| 9 | 125 | 4.1 | 6 | 8 | 20 | 0 | 1 | 0 | 1 | 33 | 41.98 | 135.3 | 177.28 |
| 10 | 125 | 8.19 | 6 | 8 | 20 | 0 | 1 | 0 | 1 | 33 | 83.97 | 270.27 | 354.24 |
| 11 | 125 | 16.38 | 6 | 8 | 20 | 0 | 1 | 0 | 1 | 28 | 167.94 | 458.64 | 626.58 |
| 12 | 125 | 32.77 | 6 | 8 | 20 | 0 | 1 | 0 | 1 | 28 | 335.87 | 917.56 | 1253.43 |
Table 3.
Calculation of the transmission time of one confirmatory frame.
| SF | bw (kHz) | Ts (ms) | npreamble | FRM (byte) | PL (byte) | H | CRC | DE | CR | Payload-SymNb | Tpreamble (ms) | Tpay-load (ms) | TULframe(ms) |
|---|---|---|---|---|---|---|---|---|---|---|---|---|---|
| 6 | 125 | 0.51 | 6 | 0 | 12 | 1 | 1 | 0 | 1 | 28 | 5.25 | 14.28 | 19.53 |
| 7 | 125 | 1.02 | 6 | 0 | 12 | 1 | 1 | 0 | 1 | 28 | 10.5 | 28.56 | 39.06 |
| 8 | 125 | 2.05 | 6 | 0 | 12 | 1 | 1 | 0 | 1 | 23 | 20.99 | 47.15 | 68.14 |
| 9 | 125 | 4.1 | 6 | 0 | 12 | 1 | 1 | 0 | 1 | 23 | 41.98 | 94.3 | 136.28 |
| 10 | 125 | 8.19 | 6 | 0 | 12 | 1 | 1 | 0 | 1 | 18 | 83.97 | 147.42 | 231.39 |
| 11 | 125 | 16.38 | 6 | 0 | 12 | 1 | 1 | 0 | 1 | 18 | 167.94 | 294.84 | 462.78 |
| 12 | 125 | 32.77 | 6 | 0 | 12 | 1 | 1 | 0 | 1 | 18 | 335.87 | 589.86 | 925.73 |
Table 4.
Dependence LoRa gateway’s range on the receiver’s sensitivity when using the ITU-RP.1238-5 attenuation model [28].
Table 4.
Dependence LoRa gateway’s range on the receiver’s sensitivity when using the ITU-RP.1238-5 attenuation model [28].
| SF | 6 | 7 | 8 | 9 | 10 | 11 | 12 |
|---|---|---|---|---|---|---|---|
| RSSI (dBm) | −118 | −123 | −126 | −129 | −132 | −134 | −137 |
| Bitrate (bit/s) | 9375 | 5469 | 3125 | 1758 | 977 | 537 | 293 |
| Distances (m) | 270 | 333 | 410 | 506 | 623 | 716 | 824 |
Table 5.
Calculation of the capacity of the LoRa gateway.
| Clustering Method | NENpack (Per Day) | λ2% | Throughput | Number of Connected Devices to a Gateway |
|---|---|---|---|---|
| FOREL | 24 | 0.01 | 79.223 | 3300 |
| K-means | 24 | 0.01 | 92.292 | 3845 |
Publisher’s Note: MDPI stays neutral with regard to jurisdictional claims in published maps and institutional affiliations. |
© 2021 by the authors. Licensee MDPI, Basel, Switzerland. This article is an open access article distributed under the terms and conditions of the Creative Commons Attribution (CC BY) license (http://creativecommons.org/licenses/by/4.0/).
Share and Cite
MDPI and ACS Style
Muthanna, M.S.A.; Wang, P.; Wei, M.; Rafiq, A.; Josbert, N.N. Clustering Optimization of LoRa Networks for Perturbed Ultra-Dense IoT Networks. Information 2021, 12, 76. https://0-doi-org.brum.beds.ac.uk/10.3390/info12020076
AMA Style
Muthanna MSA, Wang P, Wei M, Rafiq A, Josbert NN. Clustering Optimization of LoRa Networks for Perturbed Ultra-Dense IoT Networks. Information. 2021; 12(2):76. https://0-doi-org.brum.beds.ac.uk/10.3390/info12020076
Chicago/Turabian StyleMuthanna, Mohammed Saleh Ali, Ping Wang, Min Wei, Ahsan Rafiq, and Nteziriza Nkerabahizi Josbert. 2021. "Clustering Optimization of LoRa Networks for Perturbed Ultra-Dense IoT Networks" Information 12, no. 2: 76. https://0-doi-org.brum.beds.ac.uk/10.3390/info12020076
Note that from the first issue of 2016, this journal uses article numbers instead of page numbers. See further details here.