
MNCF: Prediction Method for Reliable Blockchain Services under a BaaS Environment


Colleage of Engineering, Shantou University, Shantou 515041, China
*
Author to whom correspondence should be addressed.
Information 2021, 12(6), 242; https://0-doi-org.brum.beds.ac.uk/10.3390/info12060242
Submission received: 1 May 2021
/
Revised: 6 June 2021
/
Accepted: 6 June 2021
/
Published: 10 June 2021
(This article belongs to the Special Issue Recent Advances in IoT and Cyber/Physical Security)
Abstract
:Blockchain is an innovative distributed ledger technology that is widely used to build next-generation applications without the support of a trusted third party. With the ceaseless evolution of the service-oriented computing (SOC) paradigm, Blockchain-as-a-Service (BaaS) has emerged, which facilitates development of blockchain-based applications. To develop a high-quality blockchain-based system, users must select highly reliable blockchain services (peers) that offer excellent quality-of-service (QoS). Since the vast number of blockchain services leading to sparse QoS data, selecting the optimal personalized services is challenging. Hence, we improve neural collaborative filtering and propose a QoS-based blockchain service reliability prediction algorithm under BaaS, named modified neural collaborative filtering (MNCF). In this model, we combine a neural network with matrix factorization to perform collaborative filtering for the latent feature vectors of users. Furthermore, multi-task learning for sharing different parameters is introduced to improve the performance of the model. Experiments based on a large-scale real-world dataset validate its superior performance compared to baselines.
1. Introduction
In recent years, the dispersion, irreversibility, and traceability of blockchain [1] have been a growing concern. Consequently, numerous enterprises, governments, and scientific institutions have leveraged blockchain-based applications in various fields, such as smart contracts [2,3], Internet of Things [4,5] and security services [6,7]. As a component in the software system development process, blockchain can offer communication, data storage, data mining, and computation services. uBaaS (a unified blockchain as a service platform) [8], proposed by Microsoft and IBM [8], emerged based on the idea of service-oriented computing paradigms. Under the BaaS paradigms, blockchain-based applications can be built by invoking numerous blockchain services (we use blockchain services and peers alternatively in this paper) through the Internet. Developers (users) can quickly validate their models and concepts under BaaS.
Offered by various application platforms, several candidate services have similar functions, which different users on the internet can select. However, selecting the best blockchain service among functionally similar blockchain services to build highly reliable blockchain-based applications has been challenging. In this case, it applies nonfunctional properties of services to rank the services and select the reliable ones. The QoS is regarded as the essential nonfunctional feature for service selection [9]. With QoS, users can select an optimal service from a large scale of candidate services. However, most QoS features may be dynamic, and their values depend on various factors such as network infrastructure [10], time of invocation [11], and user location [12]. Therefore, the values of these QoS features should be determined for each personalized user [13,14] at runtime. However, we cannot invoke each candidate service and observe the corresponding QoS value due to resource restriction. Hence, the method to obtain the unknown QoS values of candidate blockchain services without invoking them remains a challenging issue. In previous studies, QoS values of each service for each user were expressed in the form of a matrix, and the empty entries were predicted using the existing values and similarities between the users and services. To obtain accurate QoS predicted values, scholars have performed significant research and proposed a series of new ideas. According to these studies, collaborative filtering (CF)-based methods are popular and can be categorized into neighborhood- and model-based CF. Among them, as a model-based method, matrix factorization (MF)-based methods have been widely used for QoS prediction in web and cloud services [15]. They have provided acceptable accuracy with a shorter computational time. Recently, machine learning and deep learning have progressed rapidly and resulted in significant achievements in several fields, such as natural language processing [16], computer vision [17], and recommendation systems [18]. Since deep neural networks can effectively learn complex data representation, studies regarding neural networks can be applied to construct complex relationships among users and services.
Inspired by the accomplishment of CF and the development of deep learning, we herein propose a personalized QoS prediction model under BaaS, known as the modified neural collaborative filtering (MNCF). The main contributions of our study are as follows:
- Reliability Prediction. We herein propose a general framework for predicting the reliability of blockchain peers. By predicting unknown QoS values, we can calculate the reliability of each peer.
- Global and Local Information Introduction. In the prediction part of the framework, we propose a context-sensitive collaborative model that supports various side information, including country, autonomous systems, IP address, and time zone. Experimental result shows that the model implicitly identifies specific context from inputs to improve the prediction accuracy.
- Multi-Task Learning. We endow our model with a multi-task learning technique. Since our predicted target (Success Rate, SR) is calculated using three other QoS values, the model can enrich the training samples and average out the noise on the main task by introducing three other tasks related to the main task. Furthermore, the experimental result shows that multi-task learning can improve the performance of our model.
- Extensive experiments conducted on a public blockchain dataset shows that our model performs better than the other methods, thereby proving the effectiveness of our method.
2. Related Work
This section introduces studies related to blockchain reliability prediction, including traditional reliability prediction and blockchain-related studies.
2.1. Traditional Reliability Prediction Research
In service selection [19], as the QoS values are affected by the network environment, true and reliable published services cannot be guaranteed. For this reason, the reliability evaluation of services based on user feedback is important. Generally, we calculate the reliability of a service based on the consistency between the observed and predicted values of the user’s rating to the service [20]. Among them, QoS is a critical factor for reliability prediction. Hence, it is crucial to predict unknown QoS values accurately. QoS prediction has been widely investigated in the past decade. As a typical technique, CF has been widely applied in QoS prediction. CF-based QoS prediction models can be classified into two categories, neighborhood- and model-based CF. Most neighborhood-based CF methods utilize the historical call invocation information of similar neighbors for prediction [21]. Neighborhood-based CF can be further classified into user- [22] and item-based CF [23]. Zheng et al. [24] presented a neighborhood-based hybrid model that integrates user- and item-based CF approaches.
With the rapid increase in the number of services on the Internet, users can only obtain a small number of QoS values [25]; therefore, it is crucial to address the sparsity of service call records. Even though it is challenging to select similar neighbors with high-sparsity data in neighborhood-based CF, this problem can be solved effectively using model-based CF. As a model-based CF technology, MF is one of the most well-known technologies for QoS prediction owing to its excellent scalability and high precision [25,26]. To acquire accurate prediction results, scholars have studied MF extensively. Lo et al. [27] proposed an extended MF model based on relational regularization for unknown QoS prediction to avoid expensive and costly Web service invocations. Zheng et al. [25] proposed a neighborhood-integrated MF model named NIMF, which combines neighborhood- and model-based CF approaches to obtain a higher prediction accuracy. To achieve a higher QoS prediction accuracy, scholars have focused on integrating MF with context information, such as geographical location and time, which implies similar services or users in the same network environment. Hence, researchers have combined context information with historical QoS information to build a prediction model. Zhang et al. [28] suggested collective matrix factorization, which enhances the performances of MF models based on user-service quality pairs. Tang et al. [29] proposed location-aware CF for recommending Web services by incorporating the location information of both users and services. He et al. [30] presented hierarchical MF, which categorizes users into multiple groups by geographic information and combines local and global information for QoS value prediction. Yu et al. [31] proposed BiasMF, in which an offset term was introduced as a bias into the geographic location information to improve the prediction accuracy of the model. The methods discussed above are conventional MF-based, but one of the disadvantages is that they cannot learn more complex interactions between users and services.
In recent years, researchers have been performing QoS prediction through deep learning. Wu et al. [32] proposed a collaborative denoising autoencoder based on the feature learning capabilities of deep learning. The model learns the potential representation of missing user/service preferences and considers the interaction between context information, i.e., an approach that can best reconstruct the complete input. He et al. [33] proposed neural collaborative filtering, which combines a neural network and MF. In this model, they use a neural network to replace the inner product of MF such that any function can be learned from the data to improve the prediction accuracy.
2.2. Blockchain Reliability Research
Regarding blockchain reliability, Wang et al. [3] proposed an algorithm based on smart contracts for constructing service-based systems through the composition of existing services, thereby ensuring automatic and reliable transactions. Liang et al. [34] proposed a homomorphic encryption-based blockchain for circuit copyright protection through the correct execution of the smart contract in the blockchain, thereby improving the security and scalability of circuit copyright protection. Lei et al. [35] presented a reputation-based byzantine fault tolerance (RBFT) algorithm that uses a reputation model to evaluate the operation of each peer in a consensus process. Inspired by CF in QoS prediction, Zheng et al. [36] proposed a hybrid blockchain reliability prediction (HBRP) model to extract blockchain reliability factors and then generate personalized predictions for each user. In recent years, BaaS has progressed rapidly. For example, Lu et al. [8] proposed a unified BaaS platform to support both the design and deployment of blockchain-based applications. Zheng et al. [37] presented a BaaS platform named NutBaaS for providing blockchain services in cloud computing environments, such as smart contract analysis, data mining, and system monitoring. IBM proposed IBM Hyperledger (https://www.ibm.com/blockchain/platform/) (accessed on: 8 June 2021) for BaaS deployment solutions. However, the previous blockchain research rarely provides reliability prediction methods for blockchain systems, and always focuses on a few blockchain peers. Moreover, the previous reliability prediction research has not achieved good performance in blockchain systems since merely a simple collaborative filtering algorithm is used. Since CF and neural networks have achieved state-of-the-art performance in many other fields, we investigate their applications in blockchain services.
3. The Model
In this section, the framework for blockchain service reliability prediction under BaaS is introduced, including the overall architecture of the framework and the details of MNCF.
3.1. Reliability Prediction Framework for Blockchain Services
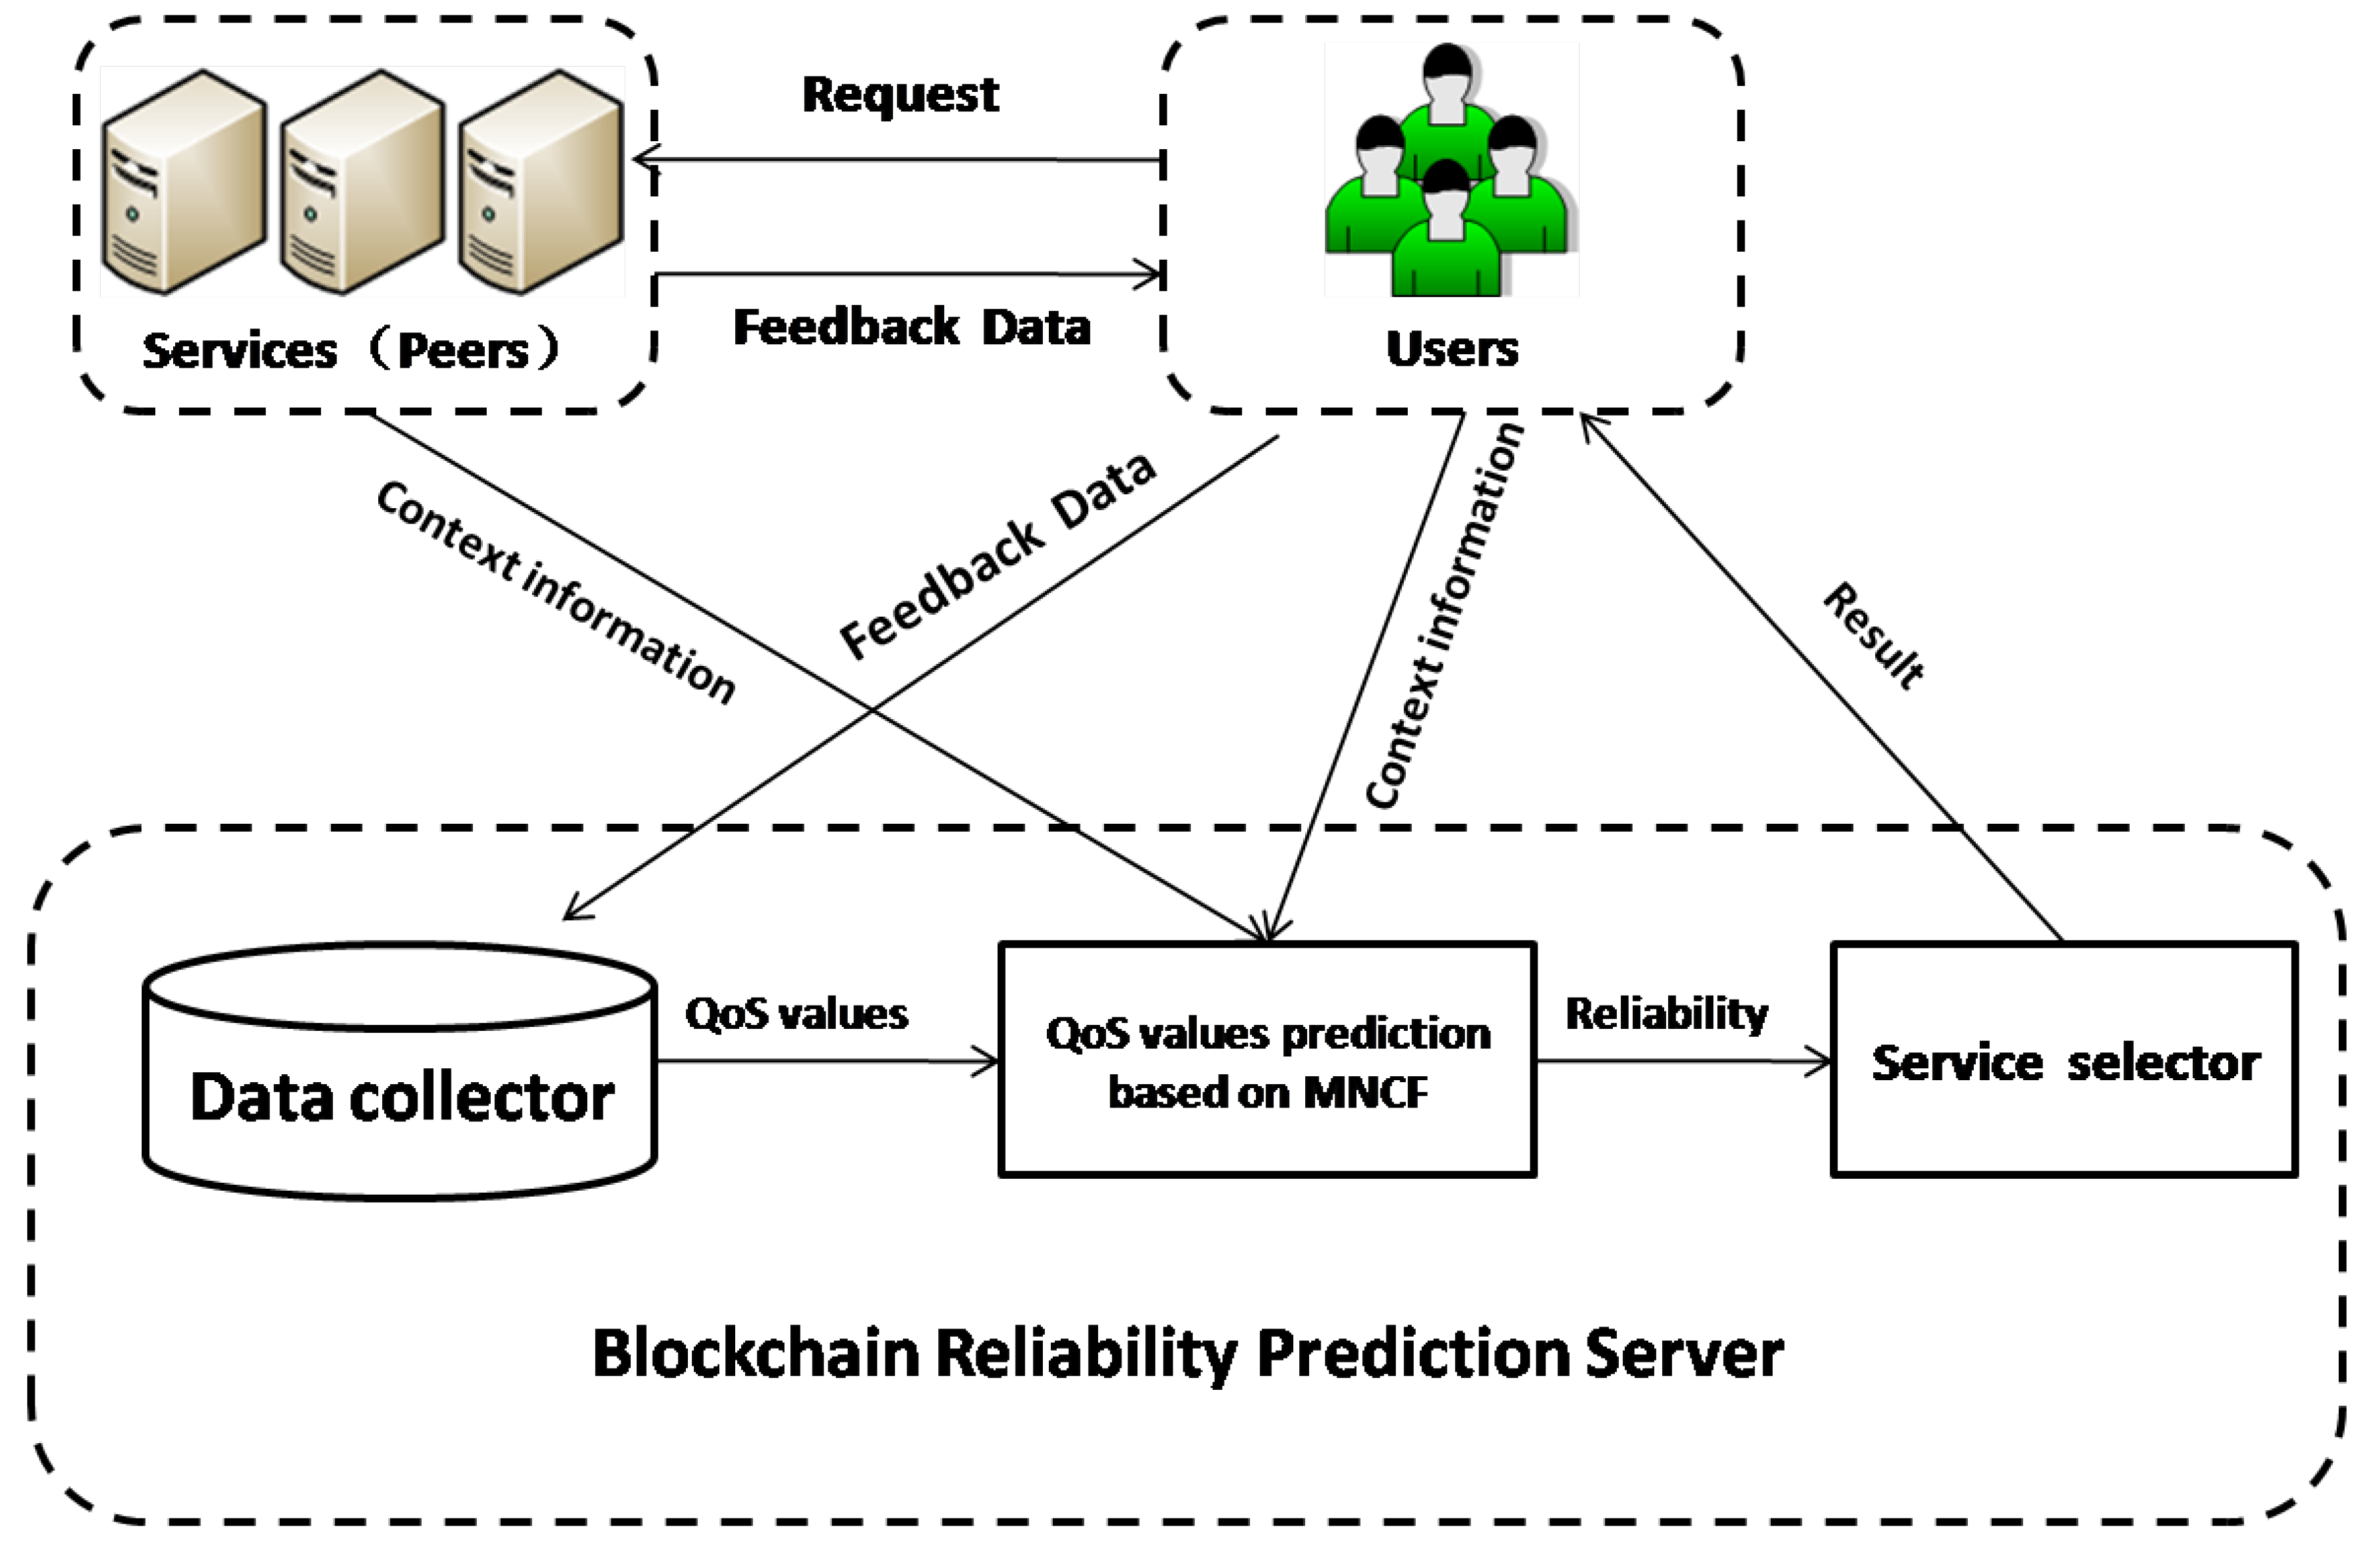
Herein, we propose a QoS-based blockchain service reliability prediction framework for blockchain services under BaaS. As shown in Figure 1, our framework comprises three components: QoS value collection, unknown value prediction based on MNCF, and service selection. The framework includes the following main steps:
- Users send requests to the peers; subsequently, the blockchain services (peers) respond to the requests and return the feedback QoS data. The complete feedback data contain seven items: the peer IP, user IP, request time cost, response time cost, bulk request time cost, block height, and block hash.
- In the prediction server, after feedback data are received, the success rate based on the submitted data is calculated. The calculation results are used to form the user–service matrix of the success rate for MNCF.
- The matrix will be extremely sparse as users cannot request all services. With these known values, we can predict the unknown values with the input context information based on MNCF.
- After MNCF is performed, the request success rates of all the users for all the services are obtained, and the reliability of each blockchain service can be calculated using the service selector.
3.2. QoS Values Calculation
We illustrate that blockchain services are blockchain peers composed of blockchain applications, whereas blockchain users are blockchain application developers who invoke the blockchain services. Each user in a group can send a request to each blockchain service (peer), and the result of the request is considered as the success rate. Since many blockchain peers exist in the real world, users cannot send requests to every peer. Therefore, the success rate of users without requests should be predicted.
First, we set a parameter “MaxBlockBack” to indicate the extreme value for the block backwardness of the peer in the blockchain. Subsequently, we set a parameter “MaxRTT” to represent the maximum round-trip time of the peer [36]. The successful request rate can be calculated as follows: For each user and peer , we set the counter for successful requests as , and the failure counter as . As per [36], each batch of users sends requests to the peer, and the peer will respond successfully if and only if the correct block and the recent block height are returned in time. Therefore, before we calculate the success rate for the request, we obtain three QoS data. These data are the basis for calculating the success rate and are described as follows:
- RightBlock (RB): The block hash is at the corresponding block height on the blockchain.
- RecentHeight (RH): The block height subtracted from the highest one in the batch.
- RoundTripTime (RTT): The round trip time from the request to the peer.
If peer responds successfully, then it is counted into , otherwise, it is counted into . The successful request rate of and are calculated using Equation (1).
where denotes the SuccessRate of to .
3.3. The Overall Architecture of MNCF
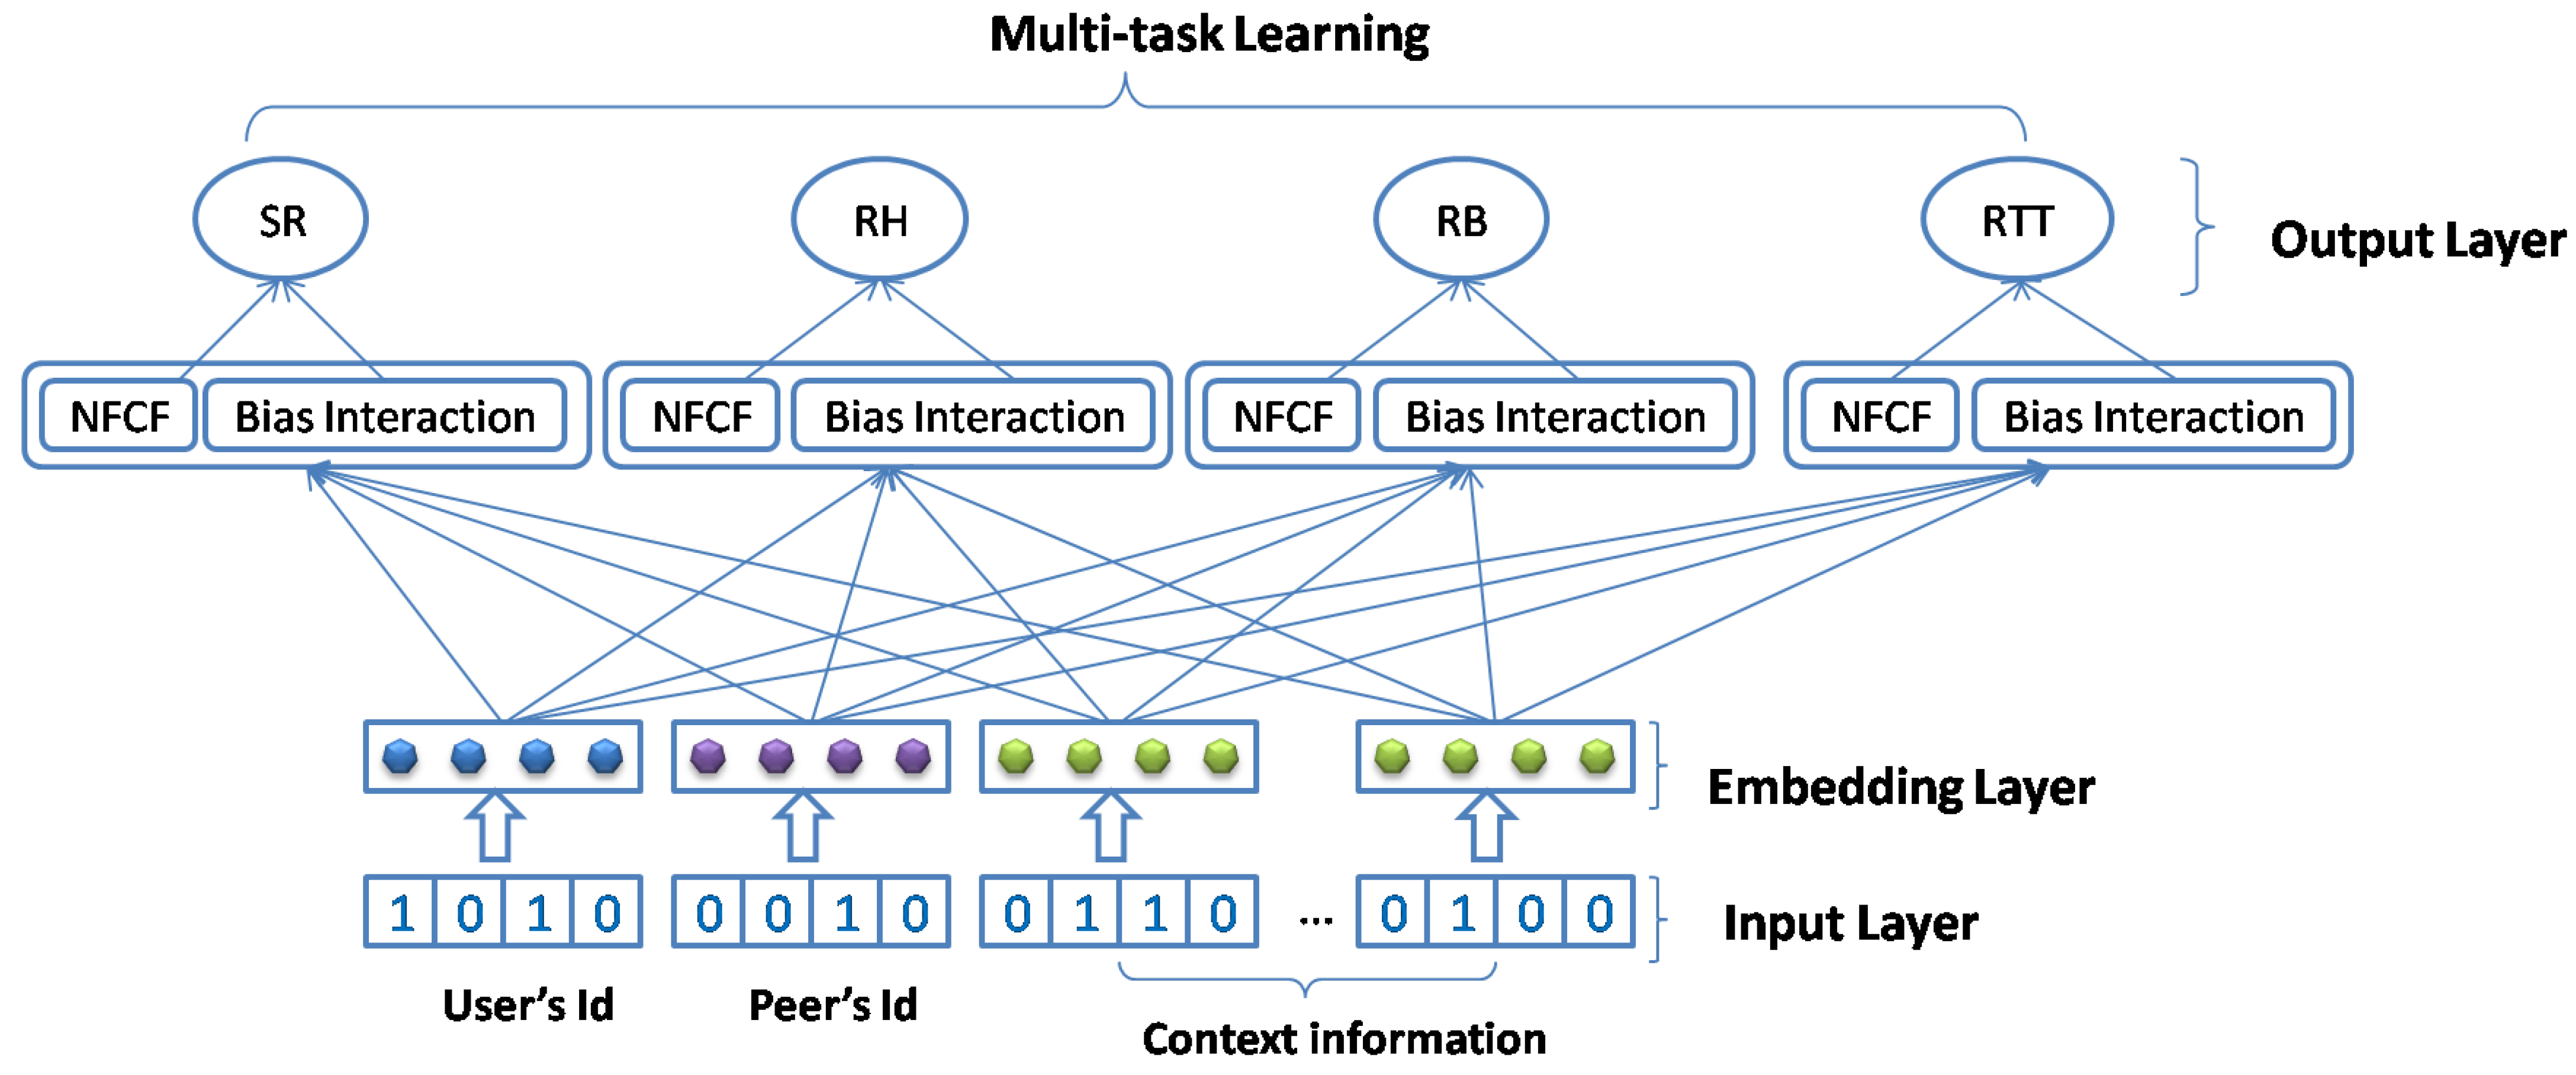
In this section, we introduce the MNCF model for blockchain QoS prediction, including the overall architecture and the details of each layer. As shown in Figure 2, it comprises three components: an input layer, an embedding layer, and task-specific layers. UserID, PeerID, and context information (country, autonomous systems, IP address, and time zone) appear in vector form for the input layer. In the embedding layer, we set the embedding for the users, peers, and context information to capture the implicated semantics. The input and embedding layers synergistically form shared layers, sharing users, services, and context information and preparing for task-specific layers in multi-task learning. In the task-specific layers, we calculate the user bias term in the context and predict the QoS values, such as the RB, RH, RTT, and SR. In particular, we accomplish multi-task learning in different task-specific layers, which can share the parameters for each layer to obtain better performances.
3.4. Input Layer
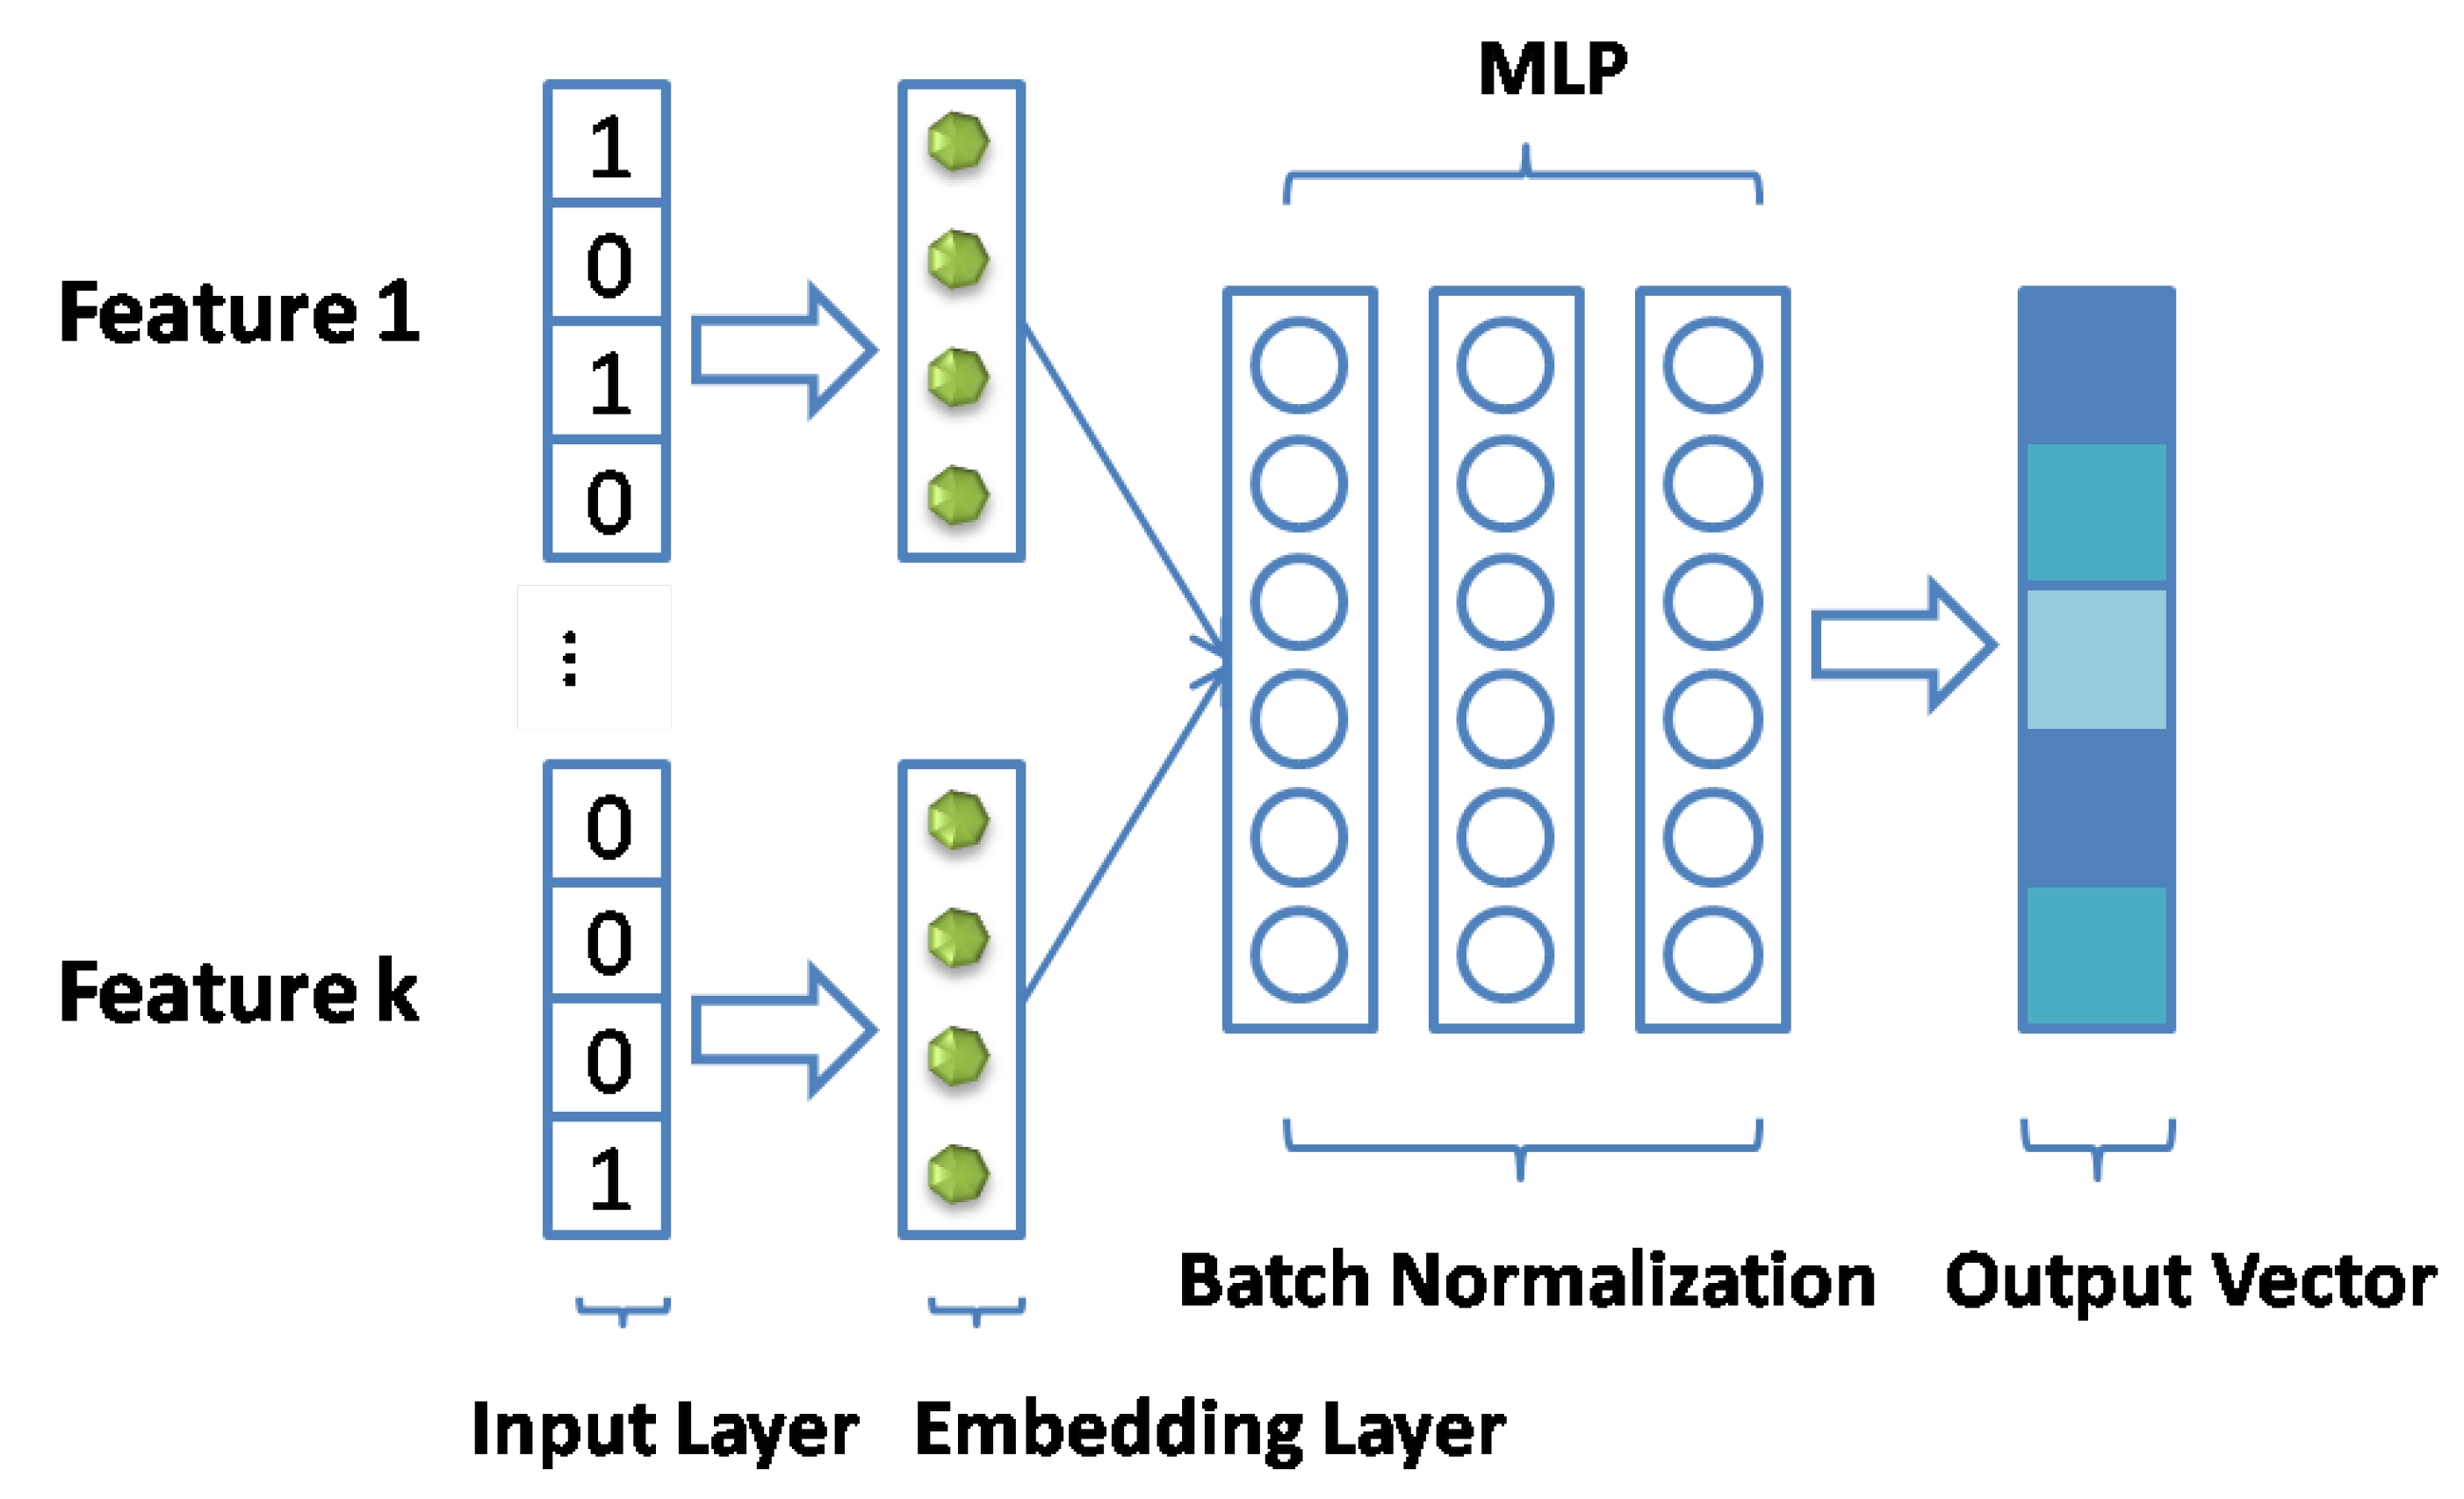
In the input layer, we used UserID and PeerID as identity features and then transformed them to binarized sparse vectors with one-hot encoding. In addition, we presented a context encoder network for the feature interaction of context information. As shown in Figure 3, the feature interaction of our context information was realized through this module. It is important to fully utilize all features for learning fusion to obtain the context information vector, which can express all features. We stacked multiple fully connected layers to enable different features to learn to fuse. However, merely a vector concatenation cannot fully represent the potential features between users and peers. Therefore, we adopted a multilayer perceptron (MLP) [33] to learn the features. The MLP model under this layer is defined as follows:
where , and denote the activation function, weight, and bias vector of the x-th(x ∈[1,n]) layer perceptron, respectively. We selected the ReLU function [38] as the activation function which is more biologically plausible and proven to be non-saturated [39]. Furthermore, it is well suited for sparse data and prevents the model from being overfitted.
Using this context encoder network, we can reduce the dimension of multiple high-dimensional sparse features, thereby reducing all the network parameters and accelerating the entire network.
3.5. Embedding Layer
The layer above the input layer is the embedding layer; it is a fully connected layer that transforms sparse vectors into a dense vector. The context information is hot coded into a sparse vector and may require a large space for the large-scale data owing to its sparsity; therefore, sparse vectors are mapped to dense representations in the embedding layer. For example, in MF, matrix R∈ can be calculated as R = UP, where M and Ndenote the numbers of users and peers, respectively. Both matrices U and P can be considered as embeddings.
3.6. Task-Specific Layers
Task-specific layers contain neural fusion CF and bias interactions.
3.6.1. Neural Fusion Collaborative Filtering
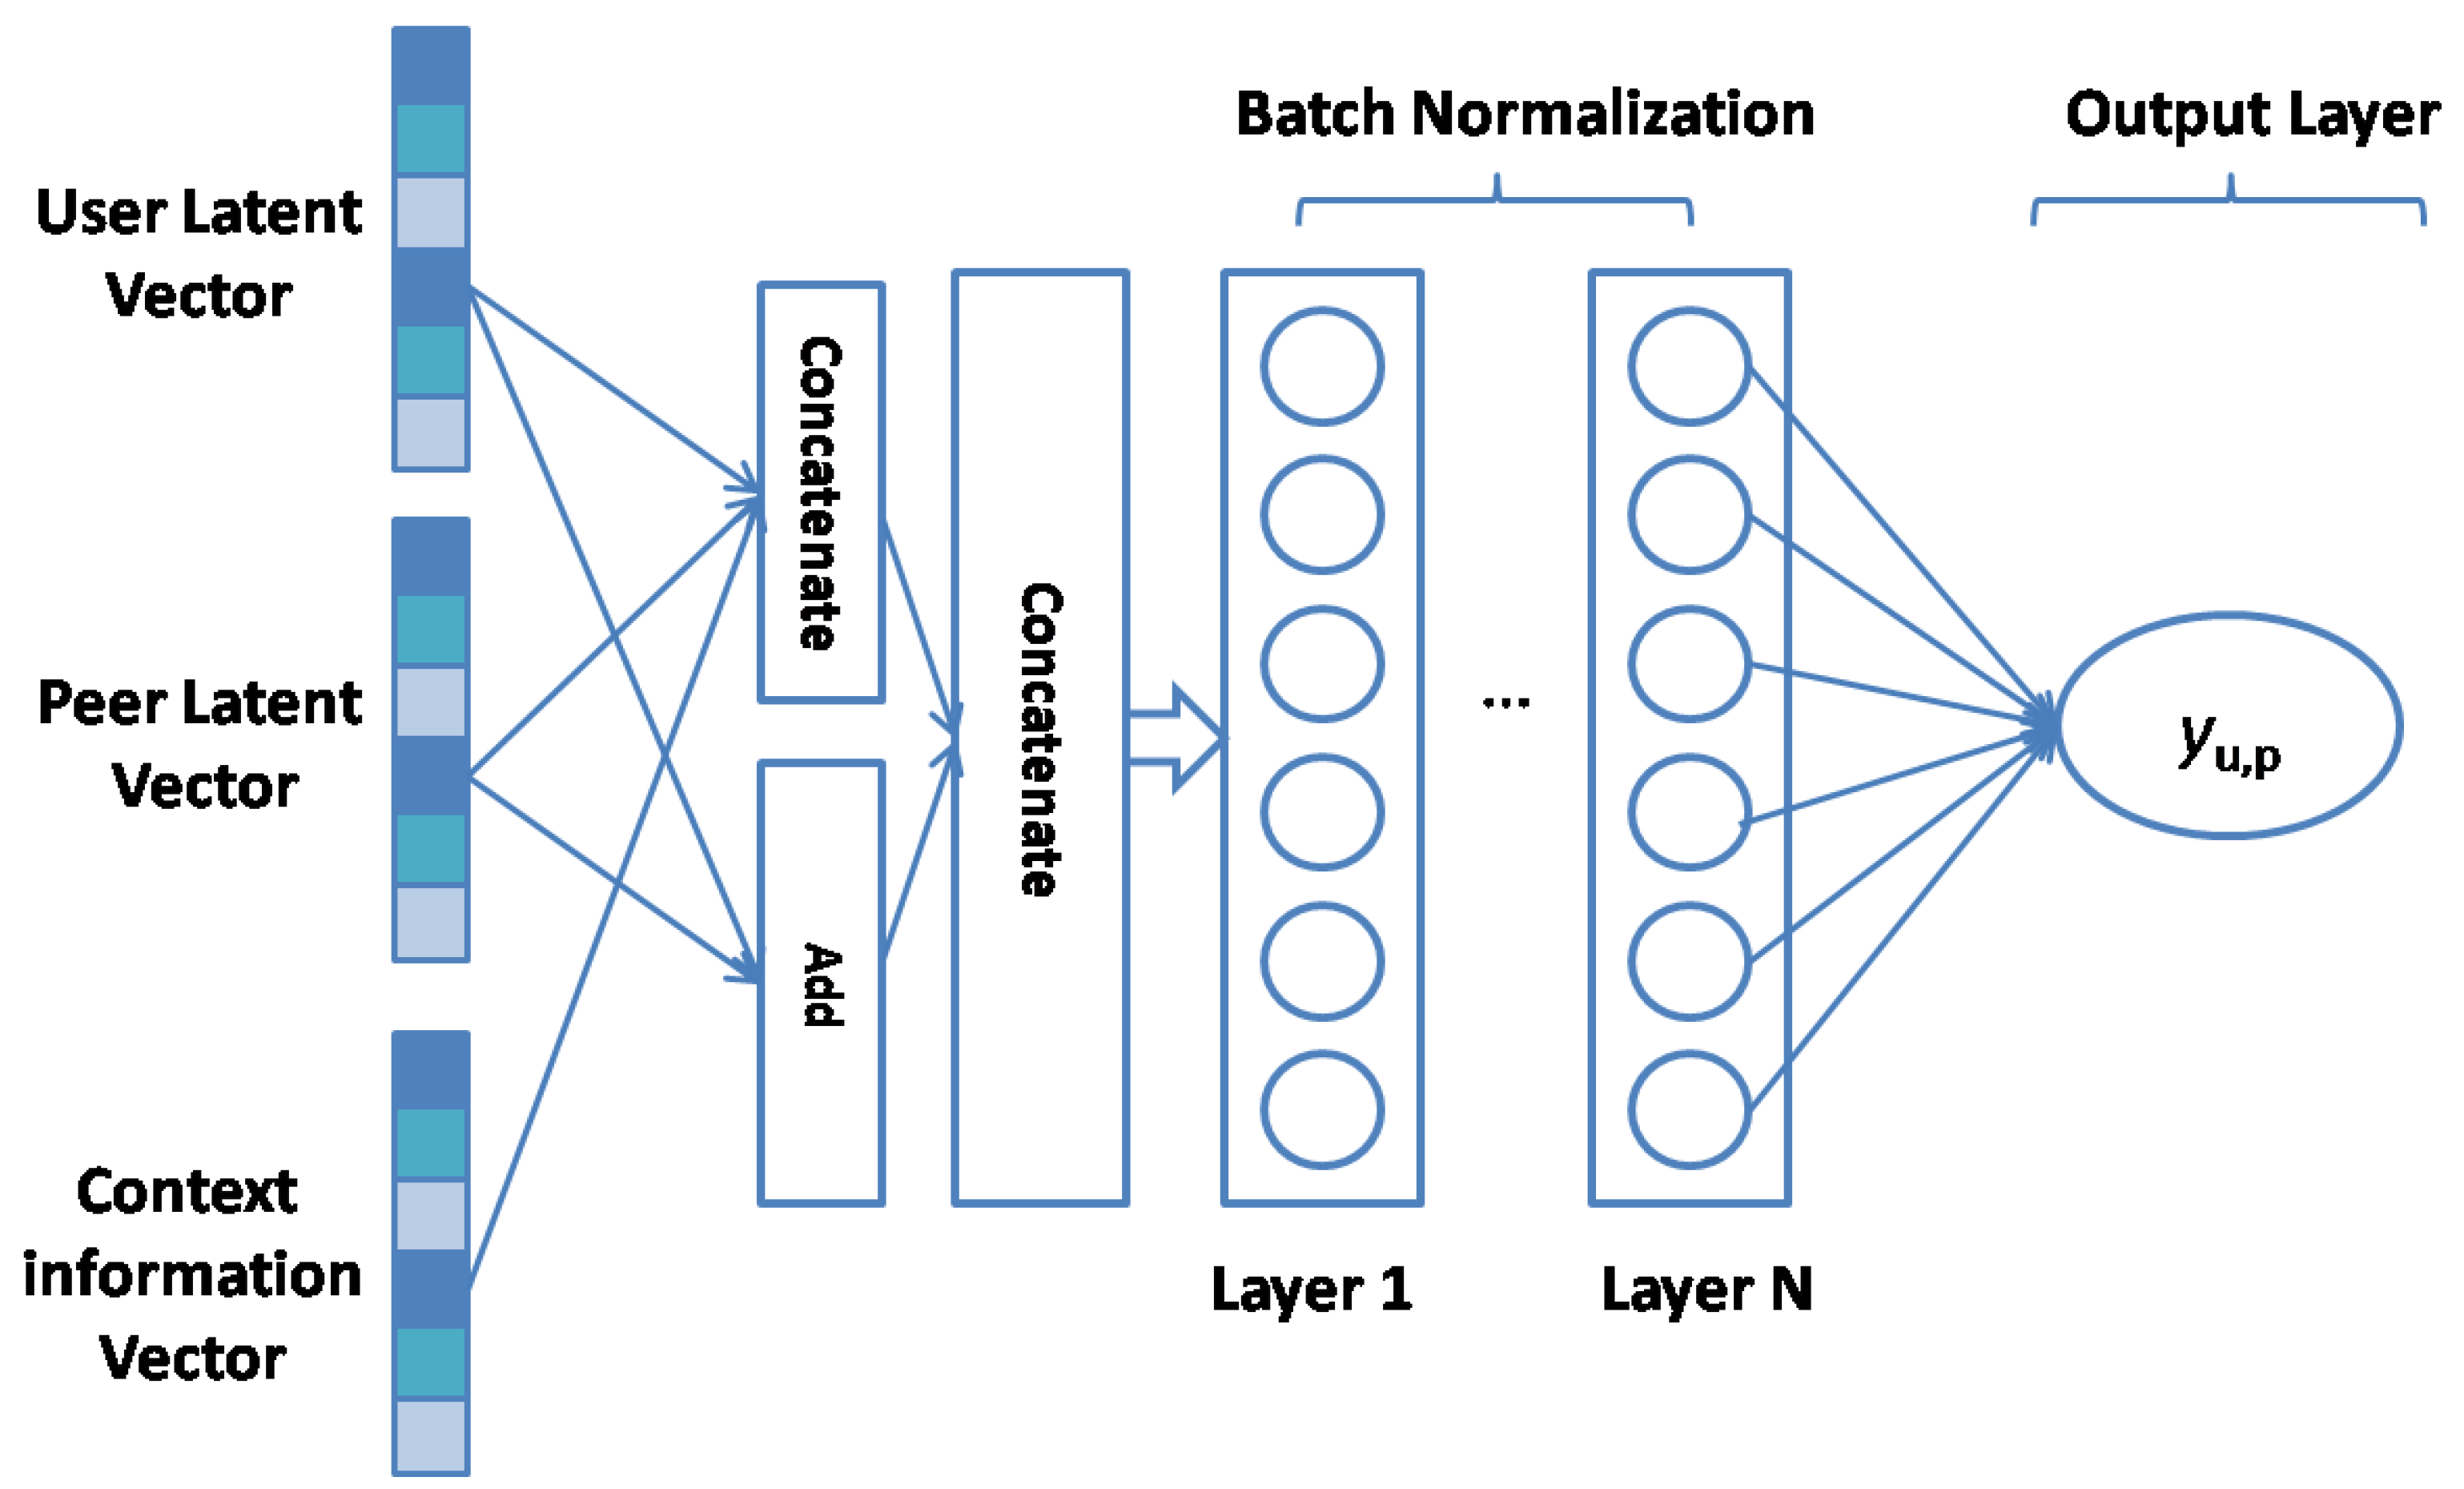
The conventional matrix factorization associates each user and peer with a score vector of latent features. Let U and P denote the latent vectors for user i and peer j, respectively. MF predicts the values using the inner product as follows:
where K denotes the dimension of the latent space. MF can be regarded as a linear model of latent factors, and it cannot learn more complex interactions between the user and peer’s hidden vectors. Hence, He et al. [33] presented a method known as neural fusion CF that uses a neural network instead of the inner product in MF. Furthermore, the input of this neural network can be well utilized to directly target user, peer, and context information vectors, thereby addressing the difficulty in constructing a CF model using context information. In addition, to increase the diversity of input features, we adopted addition operations on the user and peer vectors, as shown in Figure 4.
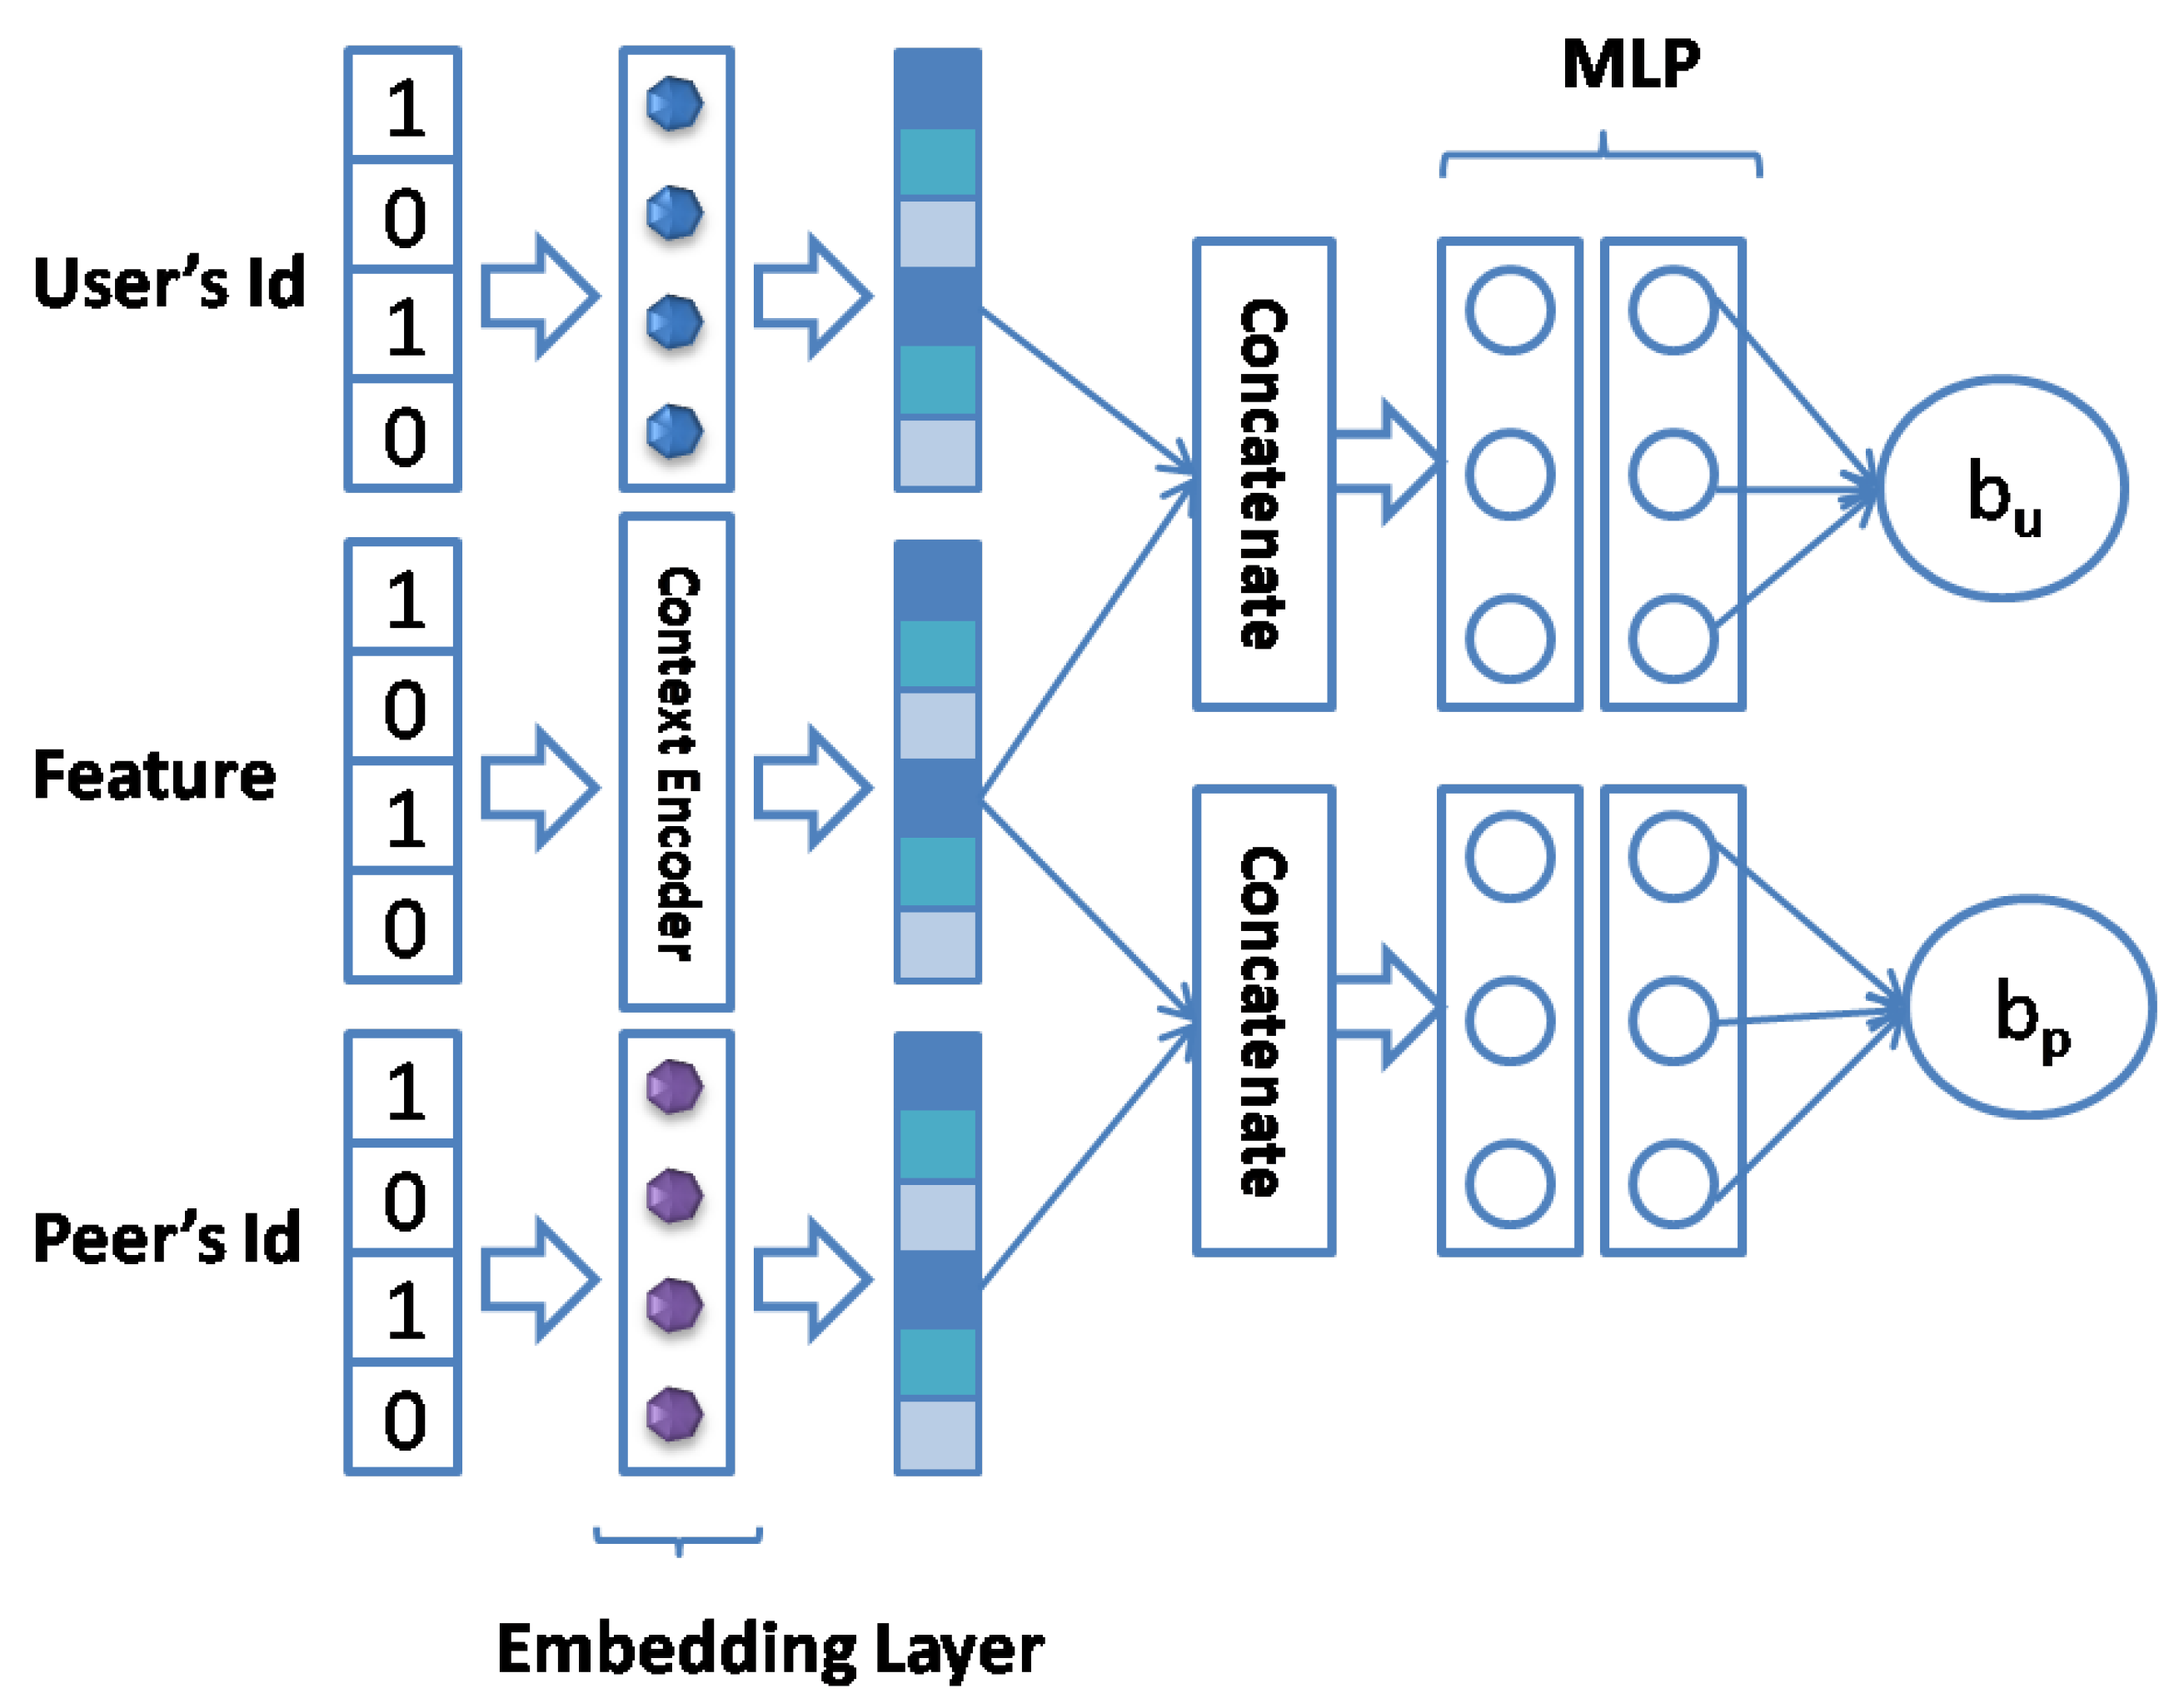
3.6.2. Bias Interaction Module
Figure 5 shows the structure of the bias interaction module in the task-specific layers. First, we calculated the embeddings of the users and peers; subsequently, we interacted with the corresponding context vectors. Finally, we obtained the bias values through the MLP. Based on [31], similar users have inconsistent criteria for some items. For example, a user may assign an extremely low or high rating to an item, but his ratings on other items may be similar to similar users. In Web services, may assign an extremely low or high rating to , but users similar to him may not. This results in biases in the model. Using these biases can improve the performance of the model. In conventional MF, we typically disregard these biases, which will degrade the model performance. Yu et al. [31] proposed a model named BiasedMF, which uses bias terms to improve the model performance. The model calculates the observed value of MF as follows:
where is the estimation of observed matrix R. indicates the latent vector of and indicates the latent vector of . and are the bias values of and , respectively. represents the overall average of R.
We adopted a neural network instead of the inner product. Therefore, our estimation of observed matrix R can be expressed as follows:
where F denotes the neural fusion CF function. represents the context information after combining with and . indicates the weight assigned to both biases that can avoid overfitting problems. Subsequently, user bias and service bias can be calculated using the context-sensitive neural network as follows:
3.6.3. Multi-Task Learning
Owing to the similarity between prediction models of neural networks and the main difference being the learning of neural networks by data distribution, for the prediction model with different QoS data, the neural network structure need not be adjusted. Therefore, we employed multi-task learning to share the parameters of each QoS prediction model. By introducing other tasks related to the main task, the number of training examples is increased, and the noise on the main task is averaged to the auxiliary tasks, thereby improving the generalization ability of the network and enhancing the performance of the main task.
In this study, we regarded SR as our main task and RB, RH, and RTT as the auxiliary tasks. SR was calculated using RB, RH, and RTT. As reported in [36], mapping exists between SR and the three factors mentioned above.
Therefore, the main task SR can learn the characteristics of the auxiliary tasks effectively to improve the prediction accuracy.
3.6.4. Batch Normalization
Generally, a neural network can effectively learn the distribution of training data and obtain good results from the test data. However, the distribution of the inputs of each layer changes during the training of a neural network. During this process, adapting each layer to the input distribution complicates the learning process. This phenomenon is known as the internal covariate shift [40]. Although the learning rates are reduced and the parameters appropriately initialized, the problem cannot be resolved completely. However, this problem can now be effectively owing to the emergence of batch normalization [40]. By normalizing activations throughout the network, it can be ensured that the network input is at the maximum distance from the derivative saturation region, thereby accelerating the training speed of the network. The formulae for batch normalization are defined as follows:
where and denote the input and output of the batch normalization layer, respectively. B denotes the mini-batch of size m. and are the mean and variance of the mini-batch. and are two parameters in the network that can scale and shift the distribution. is a small float number to avoid division by zero.
3.7. MNCF Algorithm
Algorithm 1 summarizes the whole process of model prediction based on MNCF. First, we randomly remove users’ IDs and peers’ IDs to make the density of data reach the target density and map the sparse context information vectors into dense vectors. Then, in each training round, we calculate the predicted target values by NFCF and bias module. In addition, We use the loss of each target value for the total loss. Finally, we adopt the predicted target values and loss of each training round to update the model parameters of the new round so that the model can obtain better performance.
| Algorithm 1 MNCF Algorithm |
| Require: User ID, Peer ID, Context Information, model parameters Ensure: Prediction Result: 1: Randomly remove entries to make the density reach the required density. 2: 3: while in the training round do 4: = , = 5: = , = 6: 7: 8: 9: 10: 11: 12: 13: 14: 15: 16: 17: 18: 19: 20: Update by 21: Loss Back Propagation 22: end while |
4. Experiment
In this section, we describe our experiments to answer the following questions:
- : Can deep learning improve blockchain reliability prediction performance?
- : What are the effects of the selected parameters on the blockchain reliability prediction?
- : How important is selecting contextual information?
- : How important is the Bias Interaction Module?
4.1. Dataset
In our experiment, we used a real-world dataset that was proposed in [36]; this dataset includes 100 blockchain users and 200 blockchain peers. This dataset is collected from a framework [1], which contains a data collector from its log parser. In this framework, the developers can store the data in their database rather than store it in Blockchain. The blockchain peers were from 21 countries in this dataset, whereas the users are from 15 countries. This dataset comprises more than 2,000,000 test cases.
4.2. Evaluation Metrics
We calculated the root mean square error (RMSE) to ascertain the difference between the predicted and measured values. The RMSE represents the degree of dispersion of the sample and is expressed as follows:
where and are the observed and the predicted values, respectively. N denotes the size of the test values. The smaller the RMSE value, the higher the prediction accuracy is.
4.3. Data Preprocessing
By modifying the values of MaxBlockBack and MaxRTT, we can simulate the blockchain system in a real-world scenario. We set MaxBlockBack = 12 and MaxRTT = 1000 to evaluate the accuracy for situations with high requirements for confirming blockchain data. We set MaxBlockBack = 100 and MaxRTT = 5000 to evaluate the accuracy for daily usages involving high tolerances for block backwardness and latency.
Before the context information is given as input to the embedding layer, it is encoded into a one-hot representation. Notably, country, user autonomous system, IP address, and time zone are selected as the context information.
4.4. Parameter Settings
To verify the effect of data sparsity, we randomly remove the entries in the matrix to stimulate data sparsity in the real world. We treat removed entries as the test set. We set the density from to with intervals of . We also set the number of iterations for each experiment with different parameters to thirty. For the model, the hidden size (dimensionality) was set to 64. The optimizer used was Adam [41], the learning rate was set to 0.001, and the weight decay was 0.001. For training, we adopted a batch size of 256 and used the L1 Loss as our loss function. All loss functions had the same weight.
The experiments were conducted on a PC with Intel(R) Core(TM) i7-4790 CPU @ 3.40 GHz, with 4GB RAM, using CentOS 7 and Python 3.6.
4.5. Performance Comparison (RQ1)
This section mainly focuses on RQ1. To evaluate the performance of our proposed method, we compared our method with other approaches, including the following:
- UPCC [42] is a memory-based CF approach which uses the similars users’ information.
- IPCC [43] is a memory-based CF approach which uses the similars peers’ information.
- UIPCC [44] is a memory-based CF approach which combines UPCC and IPCC.
- PMF [26] employs a user-item matrix for the service selecion based on probabilistic matrix factorization method
- HBRP [36] employs the relationship between similar users and peers to do the collaborative prediction with hybrid linear regression.
As presented in Table 1 and Table 2, MNCF yielded lower RMSE values than the other methods under different matrix densities, regardless of the type of learning used, i.e., single- or multi-task learning. This indicates that the deep-neural-network-based model offers significant advantages over non-deep-learning models. The multi-task model performed better than the single-task model, i.e., 7.52% vs. 9.30% (Table 1) and 3.17% vs. 5.52% (Table 2). Therefore, it was concluded that by introducing multi-task learning, the model generally achieves superior performances. The operating time increases with the increase in density for different densities, which is about 52, 55, 57, 58, and 60 s.
4.6. Impact of Dimensionality and Density (RQ2)
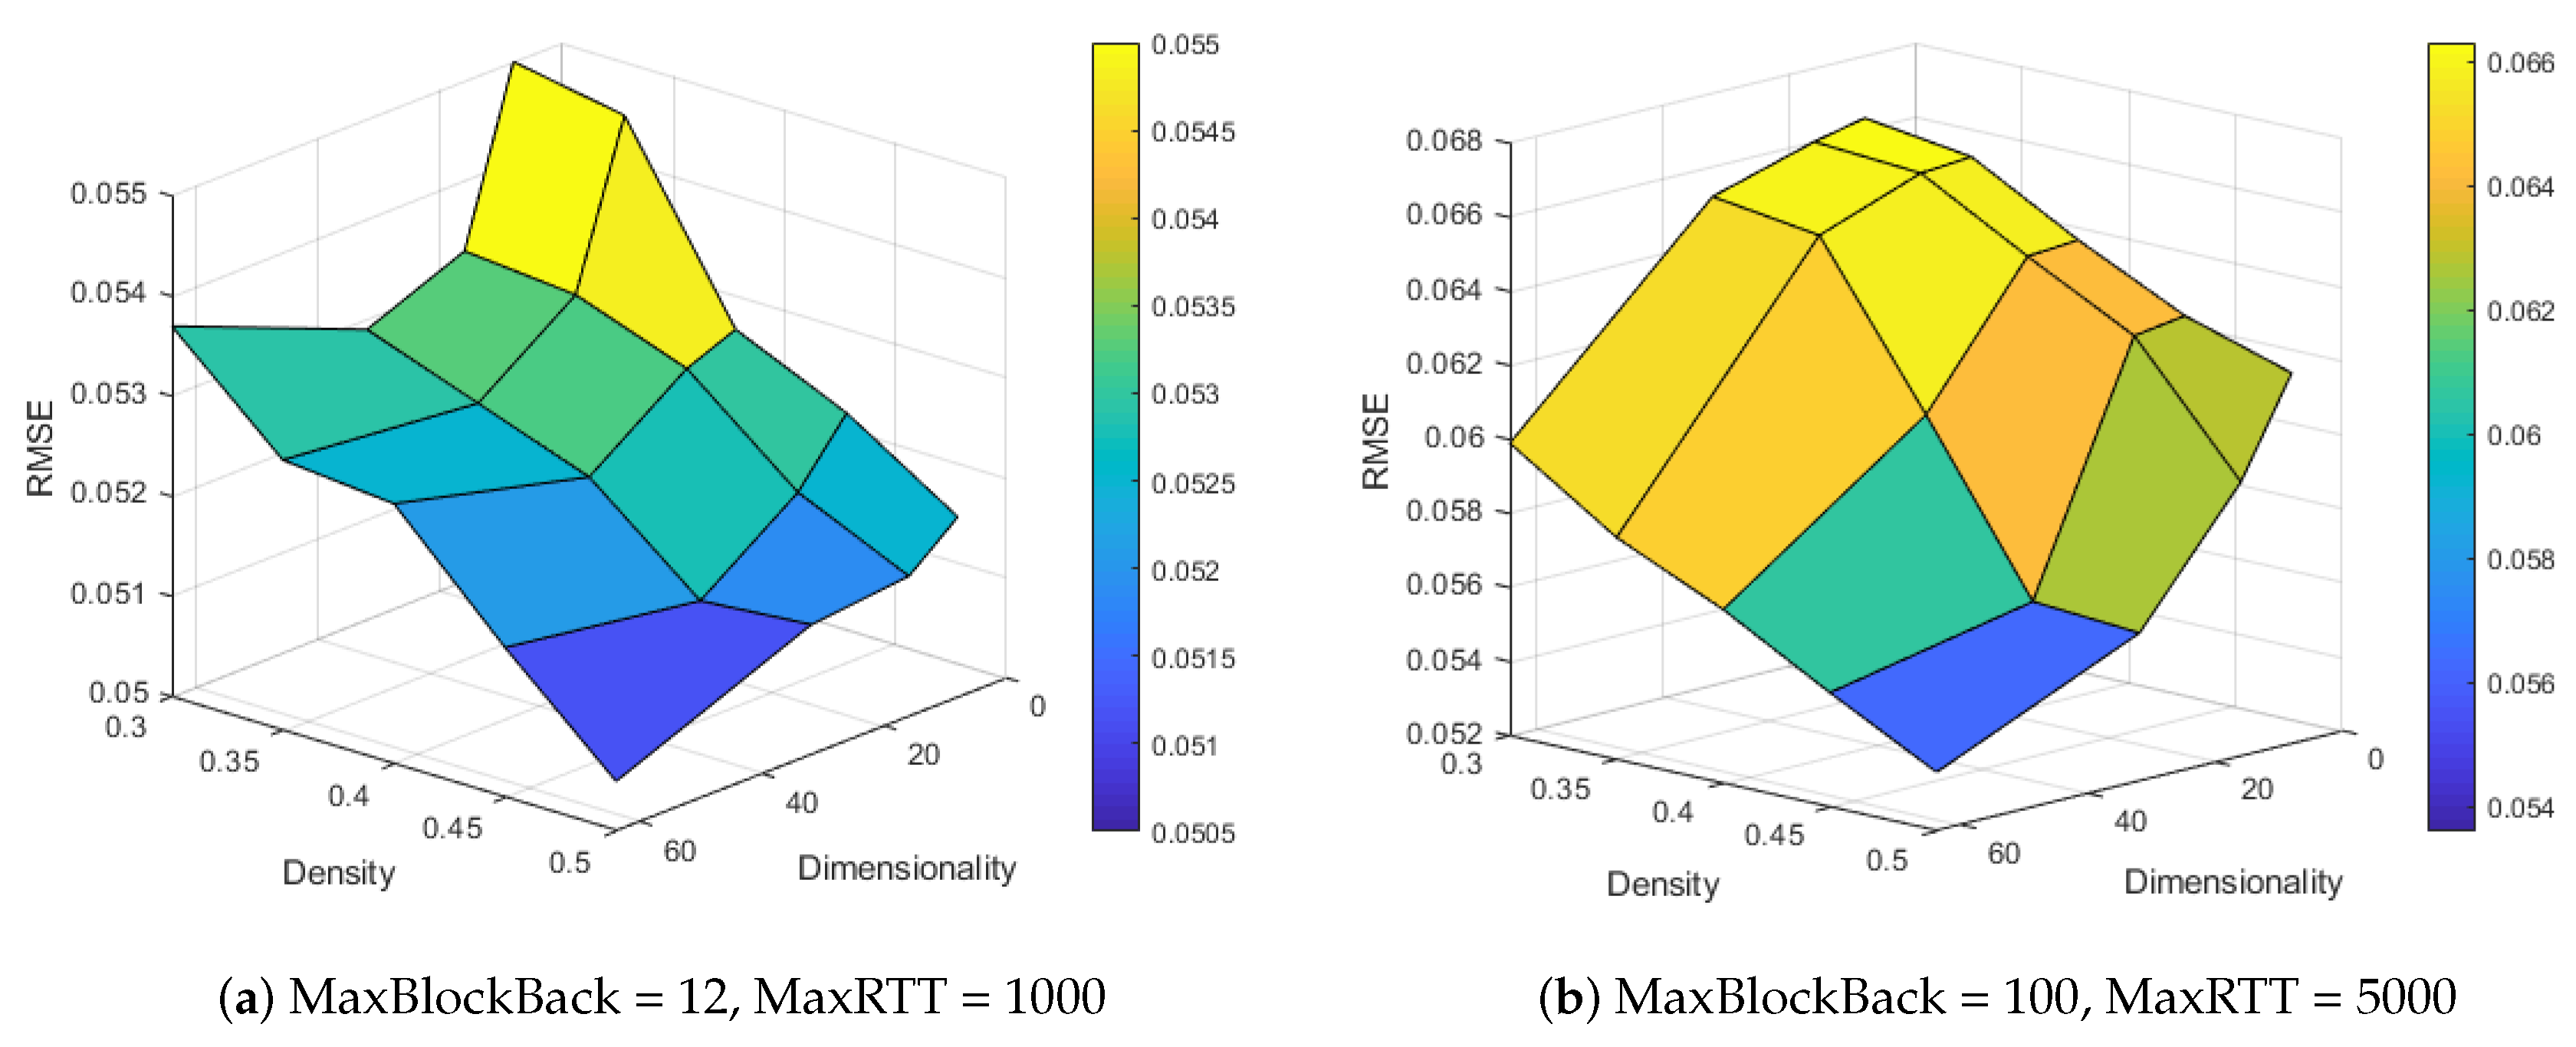
Dimensionality refers to the number of latent factors in the embedding layer used to represent the context features. Matrix Density (MD) is the percentage of unknown entries in the matrix and indicates the amount of information available for performing predictions. To investigate the effect of dimensionality and density, we varied the value of dimensionality from 8 to 64 multiplied by 2 and let the density range from 30% to 50% at intervals of 5% in each round. Figure 6 shows the prediction performance of MNCF with different dimensionalities and densities.
As shown in Figure 6a, when we set MaxBlockBack = 12 and MaxRTT = 1000, the effects differed when dimensionality was increased with different densities. Notably, the performance improved in most cases when the dimensionality increased. As the dimensionality approached 64, the values of RMSE began to increase when the MD ranged from 30% to 45%, whereas the values were the smallest when the MD was set to 50%.
As shown in Figure 6b, when MaxBlockBack = 100 and MaxRTT = 5000, the prediction error reduced with the increment in dimensionality. When MD ranged from 30% to 50%, increasing the dimensionality was beneficial to obtain a better prediction accuracy. According to Figure 6, we have the following summary:
- Generally, model performance increases with dimensionality and density rise.
- When dimensionality is set to 32 or 64, model get optimum performance with MaxBlockBack set to 12 and MaxRTT set to 1000 while when Max
- When the number of training samples is insufficient, increasing the dimensionality will reduce the prediction accuracy in some cases. This phenomenon is primarily caused by overfitting. Compared with the number of training samples, MNCF has a significantly high number of parameters [45], which will overreact to small fluctuations in the training data.
4.7. Impact of Context Information (RQ3)
We explored the influence of different context information on the model to determine their contribution to accuracy. The context information investigates in this section are country (CT), autonomous system (AS), IP address (IP), and timezone (TZ). For each factor, we delete others, and the results are presented in Table 3 and Table 4.
As shown in Table 3 and Table 4, the model’s performance drops dramatically without introducing any context information(MNCF-Without Context). It is worth noting that different factors are of varied importance. Among them, AS brings highest performance improvement. For instance, the performance is improved by 8.0% in Table 3 and 13.6% in Table 4 at 50% density. This indicates that the blockchain peers in the same AS have a higher similarity. In addition, TZ also plays a good part because the same TZ has a higher similarity in geographical location.
4.8. Impact of the Bias Interaction Module (RQ4)
In this section, we focus on the impact of the Bias Interaction Module. The output of this module enables personalized and context-sensitive prediction. We investigate its influence on prediction accuracy via an ablation study. The results are shown in Table 5 and Table 6.
As shown in Table 5 and Table 6, the model’s performance decreases without the Bias Interaction Module. After introducing the Bias Interaction Module, performance improved to different degrees. It is worth mentioning that the model’s performance gains better improvement when introducing only the peers’ bias compared with the users’ bias.
5. Conclusions
In the BaaS environment, selecting reliable blockchain services is critical for developing blockchain-based applications. We herein presented MNCF that can perform blockchain service reliability prediction to obtain highly reliable blockchain services. The proposed model employs a neural network to extract cross features while performing collaborative prediction. Additionally, we proposed a bias interaction module that can introduce personalized biases to improve prediction accuracy. Finally, we introduced multi-task learning to improve our model performance. Our model is able to effectively achieve more accurate results compared with those of other methods. In future work, we plan to investigate blockchain reliability prediction further and explore other methods that can yield better accuracy.
Author Contributions
J.X. and Z.Z. put forward the main idea and wrote the initial draft. Z.Z. and Y.L. designed the algorithm and performed the experiment. Z.X. maintained the data and visualized the data. All authors have read and agreed to the published version of the manuscript.
Funding
This research was financially supported by the National Natural Science Foundation of China (No. 61702318), 2020 Li Ka Shing Foundation Cross-Disciplinary Research Grant (No. 2020LKSFG08D), the Shantou University Scientific Research Start-up Fund Project (No. NTF18024), and in part by 2019 Guangdong province special fund for science and technology (“major special projects + task list”) project (No. 2019ST043).
Institutional Review Board Statement
Not applicable.
Informed Consent Statement
Not applicable.
Data Availability Statement
Not applicable.
Conflicts of Interest
The authors declare no conflict of interest.
References
- Zheng, P.; Zheng, Z.; Luo, X.; Chen, X.; Liu, X. A Detailed and Real-Time Performance Monitoring Framework for Blockchain Systems. In Proceedings of the 2018 IEEE/ACM 40th International Conference on Software Engineering: Software Engineering in Practice Track (ICSE-SEIP), Gothenburg, Sweden, 30 May–1 June 2018; pp. 134–143. [Google Scholar] [CrossRef]
- Zhang, Y.; Kasahara, S.; Shen, Y.; Jiang, X.; Wan, J. Smart Contract-Based Access Control for the Internet of Things. IEEE Internet Things J. 2019, 6, 1594–1605. [Google Scholar] [CrossRef] [Green Version]
- Wang, S.; Ouyang, L.; Yuan, Y.; Ni, X.; Han, X.; Wang, F. Blockchain-Enabled Smart Contracts: Architecture, Applications, and Future Trends. IEEE Trans. Syst. Man Cybern. Syst. 2019, 49, 2266–2277. [Google Scholar] [CrossRef]
- Liu, Y.; Wang, K.; Qian, K.; Du, M.; Guo, S. Tornado: Enabling Blockchain in Heterogeneous Internet of Things Through a Space-Structured Approach. IEEE Internet Things J. 2020, 7, 1273–1286. [Google Scholar] [CrossRef]
- Liang, W.; Huang, W.; Long, J.; Zhang, K.; Li, K.; Zhang, D. Deep Reinforcement Learning for Resource Protection and Real-Time Detection in IoT Environment. IEEE Internet Things J. 2020, 7, 6392–6401. [Google Scholar] [CrossRef]
- White, B.S.; King, C.G.; Holladay, J. Blockchain security risk assessment and the auditor. J. Corp. Account. Financ. 2020, 31, 47–53. [Google Scholar] [CrossRef]
- Liang, W.; Fan, Y.; Li, K.; Zhang, D.; Gaudiot, J. Secure Data Storage and Recovery in Industrial Blockchain Network Environments. IEEE Trans. Ind. Inform. 2020, 16, 6543–6552. [Google Scholar] [CrossRef]
- Lu, Q.; Xu, X.; Liu, Y.; Weber, I.; Zhu, L.; Zhang, W. uBaaS: A unified blockchain as a service platform. Future Gener. Comput. Syst. 2019, 101, 564–575. [Google Scholar] [CrossRef] [Green Version]
- Liu, J.; Chen, Y. HAP: A Hybrid QoS Prediction Approach in Cloud Manufacturing combining Local Collaborative Filtering and Global Case-based Reasoning. IEEE Trans. Serv. Comput. 2019. [Google Scholar] [CrossRef]
- Zhong, W.; Yin, X.; Zhang, X.; Li, S.; Dou, W.; Wang, R.; Qi, L. Multi-dimensional quality-driven service recommendation with privacy-preservation in mobile edge environment. Comput. Commun. 2020, 157, 116–123. [Google Scholar] [CrossRef]
- Yakubu, I.Z.; Malathy, C. Priority Based Delay Time Scheduling for Quality of Service in Cloud Computing Networks. In Proceedings of the 2020 International Conference on Emerging Trends in Information Technology and Engineering (ic-ETITE), Vellore, India, 24–25 February 2020; pp. 1–5. [Google Scholar] [CrossRef]
- Syu, Y.; Kuo, J.Y.; Fanjiang, Y.Y. Time series forecasting for dynamic quality of web services: An empirical study. J. Syst. Softw. 2017, 134, 279–303. [Google Scholar] [CrossRef]
- Guo, L.; Mu, D.; Cai, X.; Tian, G.; Hao, F. Personalized QoS Prediction for Service Recommendation With a Service-Oriented Tensor Model. IEEE Access 2019, 7, 55721–55731. [Google Scholar] [CrossRef]
- Yang, Y.; Zheng, Z.; Niu, X.; Tang, M.; Lu, Y.; Liao, X. A Location-Based Factorization Machine Model for Web Service QoS Prediction. IEEE Trans. Serv. Comput. 2018. [Google Scholar] [CrossRef]
- Meiappane, A.; Prabavadhi, J.; Dharani, R.; Kaviya, R.; Malathy, R. Web Service Recommendation and QoS Prediction via Matrix Factorization. In Proceedings of the 2020 International Conference on System, Computation, Automation and Networking (ICSCAN), Pondicherry, India, 3–4 July 2020; pp. 1–6. [Google Scholar] [CrossRef]
- Manju, K.; David Peter, S.; Idicula, S.M. A Framework for Generating Extractive Summary from Multiple Malayalam Documents. Information 2021, 12, 41. [Google Scholar] [CrossRef]
- Semenkov, A.; Bragin, D.; Usoltsev, Y.; Konev, A.; Kostuchenko, E. Generation of an EDS Key Based on a Graphic Image of a Subject’s Face Using the RC4 Algorithm. Information 2021, 12, 19. [Google Scholar] [CrossRef]
- Chen, J.; Wu, Y.; Fan, L.; Lin, X.; Zheng, H.; Yu, S.; Xuan, Q. N2VSCDNNR: A Local Recommender System Based on Node2vec and Rich Information Network. IEEE Trans. Comput. Soc. Syst. 2019, 6, 456–466. [Google Scholar] [CrossRef] [Green Version]
- Hassan, H.; El-Desouky, A.I.; Ibrahim, A.; El-Kenawy, E.S.M.; Arnous, R. Enhanced QoS-Based Model for Trust Assessment in Cloud Computing Environment. IEEE Access 2020, 8, 43752–43763. [Google Scholar] [CrossRef]
- Ling, G.; King, I.; Lyu, M.R. A Unified Framework for Reputation Estimation in Online Rating Systems. In Proceedings of the IJCAI ’13, 23th International Joint Conference on Artificial Intelligence, Beijing, China, 3–9 August 2013. [Google Scholar]
- Jayapriya, K.; Mary, N.A.; Rajesh, R.S. Cloud Service Recommendation Based on a Correlated QoS Ranking Prediction. J. Netw. Syst. Manag. 2016, 24, 916–943. [Google Scholar] [CrossRef]
- Mei, H.; Xie, B.; Zhao, J.; Shao, L.; Wei, Y.; Zhang, J. Personalized QoS Prediction forWeb Services via Collaborative Filtering. In Proceedings of the 2007 IEEE International Conference on Web Services, Salt Lake City, UT, USA, 9–13 July 2007. [Google Scholar]
- Linden, G.; Smith, B.; York, J. Amazon.Com Recommendations: Item-to-Item Collaborative Filtering. IEEE Internet Comput. 2003, 7, 76–80. [Google Scholar] [CrossRef] [Green Version]
- Zheng, Z.; Ma, H.; Lyu, M.R.; King, I. WSRec: A Collaborative Filtering Based Web Service Recommender System. In Proceedings of the ICWS ’09, 2009 IEEE International Conference on Web Services, Los Angeles, CA, USA, 6–10 July 2009. [Google Scholar]
- Chen, Z.; Sun, Y.; You, D.; Li, F.; Shen, L. An accurate and efficient web service QoS prediction model with wide-range awareness. Future Gener. Comput. Syst. 2020, 109, 275–292. [Google Scholar] [CrossRef]
- Mnih, A.; Salakhutdinov, R. Probabilistic Matrix Factorization. Adv. Neural. Inf. Process. Syst. 2007, 20, 1257–1264. [Google Scholar]
- Lo, W.; Yin, J.; Deng, S.; Li, Y.; Wu, Z. An Extended Matrix Factorization Approach for QoS Prediction in Service Selection. In Proceedings of the SCC ’12. 2012 IEEE Ninth International Conference on Services Computing, Honolulu, HI, USA, 24–29 June 2012. [Google Scholar]
- Zhang, R.; Li, C.; Sun, H.; Wang, Y.; Huai, J. Quality of Web Service Prediction by Collective Matrix Factorization. In Proceedings of the 2014 IEEE International Conference on Services Computing (SCC), Anchorage, AK, USA, 27 June–2 July 2014. [Google Scholar]
- Tang, M.; Jiang, Y.; Liu, J.; Liu, X.F. Location-Aware Collaborative Filtering for QoS-Based Service Recommendation. In Proceedings of the 2012, ICWS ’12, 2012 IEEE 19th International Conference on Web Services, Honolulu, HI, USA, 24–29 June 2012. [Google Scholar]
- He, P.; Zhu, J.; Zheng, Z.; Xu, J.; Lyu, M.R. Location-Based Hierarchical Matrix Factorization for Web Service Recommendation. In Proceedings of the ICWS ’14, 2014 IEEE International Conference on Web Services, Anchorage, AK, USA, 27 June–2 July 2014. [Google Scholar]
- Yu, D.; Liu, Y.; Xu, Y.; Yin, Y. Personalized QoS Prediction for Web Services Using Latent Factor Models. In Proceedings of the SCC ’14, 2014 IEEE International Conference on Services Computing, Anchorage, AK, USA, 27 June–2 July 2014. [Google Scholar]
- Wu, Y.; DuBois, C.; Zheng, A.X.; Ester, M. Collaborative Denoising Auto-Encoders for Top-N Recommender Systems. In Proceedings of the WSDM ’16, Ninth ACM International Conference on Web Search and Data Mining, San Francisco, CA, USA, 22–25 February 2016. [Google Scholar]
- He, X.; Liao, L.; Zhang, H.; Nie, L.; Hu, X.; Chua, T.S. Neural Collaborative Filtering. In Proceedings of the WWW ’17, 26th International Conference on World Wide Web, Perth, Australia, 3–7 May 2017; pp. 173–182. [Google Scholar] [CrossRef] [Green Version]
- Liang, W.; Zhang, D.; Lei, X.; Tang, M.; Li, K.C.; Zomaya, A. Circuit Copyright Blockchain: Blockchain-based Homomorphic Encryption for IP Circuit Protection. IEEE Trans. Emerg. Top. Comput. 2020. [Google Scholar] [CrossRef]
- Lei, K.; Zhang, Q.; Xu, L.; Qi, Z. Reputation-Based Byzantine Fault-Tolerance for Consortium Blockchain. In Proceedings of the 2018 IEEE 24th International Conference on Parallel and Distributed Systems (ICPADS), Singapore, 11–13 December 2018. [Google Scholar]
- Zheng, P.; Zheng, Z.; Chen, L. Selecting Reliable Blockchain Peers via Hybrid Blockchain Reliability Prediction. arXiv 2019, arXiv:1910.14614. [Google Scholar]
- Zheng, W.; Zheng, Z.; Chen, X.; Dai, K.; Li, P.; Chen, R. NutBaaS: A Blockchain-as-a-Service Platform. IEEE Access 2019, 7, 134422–134433. [Google Scholar] [CrossRef]
- Krizhevsky, A.; Sutskever, I.; Hinton, G.E. ImageNet Classification with Deep Convolutional Neural Networks. Commun. ACM 2017, 60, 84–90. [Google Scholar] [CrossRef]
- Glorot, X.; Bordes, A.; Bengio, Y. Deep Sparse Rectifier Neural Networks. In Proceedings of the Fourteenth International Conference on Artificial Intelligence and Statistics, Lauderdale, FL, USA, 11–13 April 2011; pp. 315–323. [Google Scholar]
- Ioffe, S.; Szegedy, C. Batch Normalization: Accelerating Deep Network Training by Reducing Internal Covariate Shift. arXiv 2015, arXiv:1502.03167. [Google Scholar]
- Kingma, D.P.; Ba, J. Adam: A Method for Stochastic Optimization. arXiv 2014, arXiv:1412.6980. [Google Scholar]
- Resnick, P.; Iacovou, N.; Suchak, M.; Bergstrom, P.; Riedl, J. GroupLens: An Open Architecture for Collaborative Filtering of Netnews. In Proceedings of the CSCW ’94, 1994 ACM Conference on Computer Supported Cooperative Work, Chapel Hill, NC, USA, 22–26 October 1994. [Google Scholar]
- Sarwar, B.; Karypis, G.; Konstan, J.; Riedl, J. Item-Based Collaborative Filtering Recommendation Algorithms. In Proceedings of the WWW ’01, 10th International Conference on World Wide Web, Hong Kong, 1–5 May 2001. [Google Scholar]
- Zheng, Z.; Lyu, M.R. Collaborative Reliability Prediction of Service-Oriented Systems. In Proceedings of the ICSE ’10, 32nd ACM/IEEE International Conference on Software Engineering, Cape Town, South Africa, 1–8 May 2010. [Google Scholar]
- Wu, H.; Zhang, Z.; Luo, J.; Yue, K.; Hsu, C. Multiple Attributes QoS Prediction via Deep Neural Model with Contexts. IEEE Trans. Serv. Comput. 2018. [Google Scholar] [CrossRef]
Figure 1.
Reliability Prediction Framework for Blockchain Services.

Figure 2.
The Overall Architecture of MNCF.

Figure 3.
The Context Encoder Network.

Figure 4.
The Neural Fusion Collaborative Filtering.

Figure 5.
The Architecture of Bias Interaction Module.

Figure 6.
Performance of Different Dimensionality and Matrix Density.


Table 1.
Performance Comparison of RMSE of Prediction Models (MaxBlockBack = 12, MaxRTT = 1000).
| Method | Density = 30% | Density = 35% | Density = 40% | Density = 45% | Density = 50% |
|---|---|---|---|---|---|
| UPCC | 0.3646 | 0.3613 | 0.3601 | 0.3618 | 0.3623 |
| IPCC | 0.1022 | 0.1014 | 0.1001 | 0.0961 | 0.0963 |
| UIPCC | 0.1069 | 0.1059 | 0.1045 | 0.1011 | 0.1011 |
| PMF | 0.0946 | 0.0914 | 0.0894 | 0.0870 | 0.0867 |
| HBRP | 0.1017 | 0.0985 | 0.0954 | 0.0945 | 0.0908 |
| MNCF (Single-Task) | 0.0585 | 0.0576 | 0.0570 | 0.0564 | 0.0543 |
| MNCF (Muti-Task) | 0.0537 | 0.0527 | 0.0526 | 0.0515 | 0.0505 |
| Improve (Multi-Task vs. single-task) | 8.93% | 9.30% | 8.37% | 9.51% | 7.52% |
Table 2.
Performance Comparison of RMSE of Prediction Models (MaxBlockBack = 100, MaxRTT = 5000).
| Method | Density = 30% | Density = 35% | Density = 40% | Density = 45% | Density = 50% |
|---|---|---|---|---|---|
| UPCC | 0.4597 | 0.4576 | 0.4566 | 0.4586 | 0.4591 |
| IPCC | 0.0898 | 0.0877 | 0.0858 | 0.0857 | 0.0861 |
| UIPCC | 0.1003 | 0.0983 | 0.0967 | 0.0966 | 0.0969 |
| PMF | 0.0890 | 0.0880 | 0.0857 | 0.0847 | 0.0852 |
| HBRP | 0.0635 | 0.0624 | 0.0599 | 0.0587 | 0.0565 |
| MNCF (Single-Task) | 0.0618 | 0.0612 | 0.0593 | 0.0572 | 0.0558 |
| MNCF (Multi-Task) | 0.0599 | 0.0580 | 0.0567 | 0.0551 | 0.0536 |
| Improve (Multi-Task vs. single-task) | 3.17% | 5.52% | 4.59% | 3.81% | 4.10% |
Table 3.
Performance of RMSE with Different Contexts (MaxBlockBack = 12, MaxRTT = 1000).
| Method | Density = 30% | Density = 40% | Density = 50% |
|---|---|---|---|
| MNCF-ALL | 0.0537 | 0.0526 | 0.0505 |
| MNCF-Without Context | 0.0597 | 0.0572 | 0.0563 |
| MNCF-CT | 0.0569 | 0.0543 | 0.0523 |
| MNCF-AS | 0.0543 | 0.0530 | 0.0518 |
| MNCF-IP | 0.0566 | 0.0559 | 0.0529 |
| MNCF-TZ | 0.0542 | 0.0535 | 0.0524 |
Table 4.
Performance of RMSE with Different Contexts (MaxBlockBack = 100, MaxRTT = 5000).
| Method | Density = 30% | Density = 40% | Density = 50% |
|---|---|---|---|
| MNCF-ALL | 0.0599 | 0.0567 | 0.0536 |
| MNCF-Without Context | 0.0671 | 0.0656 | 0.0624 |
| MNCF-CT | 0.0613 | 0.0592 | 0.0563 |
| MNCF-AS | 0.0604 | 0.0589 | 0.0539 |
| MNCF-IP | 0.0650 | 0.0606 | 0.0545 |
| MNCF-TZ | 0.0655 | 0.0587 | 0.0558 |
Table 5.
Performance of RMSE with Different Contexts (MaxBlockBack = 12, MaxRTT = 1000).
| Method | Density = 30% | Density = 40% | Density = 50% |
|---|---|---|---|
| MNCF-ALL | 0.0537 | 0.0526 | 0.0505 |
| MNCF-With user’s bias | 0.0567 | 0.0554 | 0.0524 |
| MNCF-With peer’s bias | 0.0571 | 0.0559 | 0.0532 |
| MNCF-Without user’s and peer’s biases | 0.0591 | 0.0586 | 0.0564 |
Table 6.
Performance of RMSE with Different Context (MaxBlockBack = 100, MaxRTT = 5000).
| Method | Density = 30% | Density = 40% | Density = 50% |
|---|---|---|---|
| MNCF-ALL | 0.0599 | 0.0567 | 0.0536 |
| MNCF-With user’s bias | 0.0611 | 0.0582 | 0.0553 |
| MNCF-With peer’s bias | 0.0618 | 0.0591 | 0.0567 |
| MNCF-Without user’s and peer’s biases | 0.0635 | 0.0621 | 0.0615 |
Publisher’s Note: MDPI stays neutral with regard to jurisdictional claims in published maps and institutional affiliations. |
© 2021 by the authors. Licensee MDPI, Basel, Switzerland. This article is an open access article distributed under the terms and conditions of the Creative Commons Attribution (CC BY) license (https://creativecommons.org/licenses/by/4.0/).
Share and Cite
MDPI and ACS Style
Xu, J.; Zhuang, Z.; Xia, Z.; Li, Y. MNCF: Prediction Method for Reliable Blockchain Services under a BaaS Environment. Information 2021, 12, 242. https://0-doi-org.brum.beds.ac.uk/10.3390/info12060242
AMA Style
Xu J, Zhuang Z, Xia Z, Li Y. MNCF: Prediction Method for Reliable Blockchain Services under a BaaS Environment. Information. 2021; 12(6):242. https://0-doi-org.brum.beds.ac.uk/10.3390/info12060242
Chicago/Turabian StyleXu, Jianlong, Zicong Zhuang, Zhiyu Xia, and Yuhui Li. 2021. "MNCF: Prediction Method for Reliable Blockchain Services under a BaaS Environment" Information 12, no. 6: 242. https://0-doi-org.brum.beds.ac.uk/10.3390/info12060242
Note that from the first issue of 2016, this journal uses article numbers instead of page numbers. See further details here.