
CFM-RFM: A Cascading Failure Model for Inter-Domain Routing Systems with the Recovery Feedback Mechanism


College of Electronic Engineering, National University of Defense Technology, Hefei 230031, China
*
Authors to whom correspondence should be addressed.
Information 2021, 12(6), 247; https://0-doi-org.brum.beds.ac.uk/10.3390/info12060247
Submission received: 20 May 2021
/
Revised: 8 June 2021
/
Accepted: 12 June 2021
/
Published: 14 June 2021
(This article belongs to the Special Issue Secure and Trustworthy Cyber–Physical Systems)
Abstract
:With the increase and diversification of network users, the scale of the inter-domain routing system is becoming larger and larger. Cascading failure analysis and modeling are of great significance to improve the security of inter-domain routing networks. To solve the problem that the propagation principle of cascading failure does not conform to reality, a Cascading Failure Model for inter-domain routing systems with the Recovery Feedback Mechanism (CFM-RFM) is proposed in this paper. CFM-RFM comprehensively considers the main factors that cause cascading failure. Based on two types of update message propagation mechanism and traffic redistribution, it simulates the cascading failure process. We found that under the action of the recovery feedback mechanism, the cascading failure process was accelerated, and the network did not quickly return to normal, but was rather quickly and extensively paralyzed. The average attack cost can be reduced by 38.1% when the network suffers the same damage.
1. Introduction
With the rapid development of the information age, the network environment changes with each passing day. Border Gateway Protocol (BGP) is the postal service of the Internet. When someone submits data across the Internet, BGP is responsible for looking at all of the available paths that data could travel, and it picks the best route, which usually means hopping between autonomous systems. This process is BGP routing. Due to the security defect of the BGP protocol, the inter-domain routing system faces many security threats [1,2,3,4,5]. The local failure caused by an intentional attack or self-failure in the network may continue to spread and spread rapidly, and eventually cause the whole network to be paralyzed on a large scale. This phenomenon is called cascading failure, and it acts as a disaster amplifier in the network.
The widespread CodeRedII and Nimda worms in 2001 caused continuous shocks in the routing system of the global Internet [6]. In 2017, a configuration error by Google engineers forced eight million users in Japan to disconnect for an hour [7]. In 2020, due to a BGP routing error of CenturyLink, the whole Internet cascading reaction occurred, causing many services connected to the Internet to go down, such as Steam, AWS, and Discord. As can be seen from the above security events, cascading failures occur from time to time in inter-domain routing systems, and such security risks cannot be ignored. Some researchers have proposed a series of attacks that can cause the cascading failure of inter-domain routing systems, such as CXPST (Coordinated Cross Plane Session Termination) [8] attacks, BGP stress attacks [9], and DNP (Distributed Network Paralyzing) attacks [10]. Once these kinds of attacks are achieved, the inter-domain routing system will suffer huge losses. Therefore, cascading failure analysis and modeling are very necessary to maintain the security of inter-domain routing systems.
In recent years, some researchers have done some work on modeling for cascading failure. Motter et al. [11] first introduced the linear relationship between capacity and initial load of node and proposed a classic Motter Lai (ML) model. ML model believes that each node in the network has a rated capacity, and the network is in the state of free-flow operation under normal circumstances. When some nodes are attacked and fail, the load will be distributed to neighbor nodes. When the neighboring node receives this additional load, the total load exceeds the rated capacity and will fail, thus forming a chain reaction. The ML model lays a foundation for the future study of cascading failure.
For inter-domain routing networks, the model differences proposed by researchers are mainly reflected in the way the initial load is defined and the failure propagation strategy. The CFM model proposed by Guo et al. [12] defines the initial load of the node according to the degree of the node, and the failure propagation strategy is closely related to the degree. Liu et al. [13] improved the CFM model and set the betweenness as a measure of node load, which is more accurate than the definition of the CFM model but did not consider the business relationships [14] of the inter-domain routing system. LU et al. [15] found that there is a business relationship between nodes in the inter-domain routing network but may not necessarily be able to communicate, which is caused by a business relationship. Based on the business relationship, they proposed the Inter-domain Routing System Betweenness (IRS) and added the recovery mechanism into the model. However, there is no distinction between the traffic of control plane and data plane, and the IRS only defines the initial load. The failure propagation strategy in the model still uses priority allocation, which does not reflect the role of IRS. ZHU et al. [16] deeply analyzed the failure mechanism and believed that the reasons for node failures and link failures are different. Node failures are caused by control plane traffic overload. Link failures are caused by data plane traffic overload. Compared with other models, it restores the real situation better. However, the model still uses betweenness and has no recovery mechanism, which is not reasonable.
In summary, the current model does not consider the impact of the recovery process on cascading failure. BGP UPDATE messages are generated when a node or link is restored from a failed state to a normal working state. The UPDATE message generated by occasional recovery does not affect. A large number of UPDATE messages are generated when some important nodes or links are repeatedly switched between the failed and normal states (the BGP session is continuously reset). This will cause the inter-domain routing system to fall into an oscillating process. Aiming at the above problems, this paper deeply studies the working mechanism of autonomous domain routers, focusing on analyzing the inter-domain routing system business relations and routing strategies. Based on previous research, a cascading failure model of inter-domain routing system with the recovery feedback mechanism is proposed.
The remainder of this paper is arranged as follows: The related works are described in Section 2. In Section 3, we analyze the cascading failure principle for the inter-domain routing system. Section 4 describes the operating mechanism of CFM-RFM. Section 5 introduces experiments and analysis. Section 6 summarizes the study and provides our conclusions.
2. Related Work
2.1. Optimal Valid Path Prediction Method for Inter-Domain Networks
The key to traffic reallocation is how to redistribute traffic after link failures. To simplify the model, most current studies usually assume that the load will be distributed to the neighbors after link failures. This assumption is not consistent with the fact in the inter-domain routing system. During routing, all traffic passing through a failed link is rerouted and reasonably allocated to other links. The key here is how to find the routing path between the two routers. Some studies [8] believe that the shortest path between two points is the routing path. The inter-domain routing network is a network that considers business relationships. Some connected paths are invalid because they cannot communicate. Zhang et al. [17] proposed Optimal Valid path Prediction method (OVP) for inter-domain networks. Based on the shortest path algorithm, this algorithm considers the business relationship between networks, which is more practical. This paper will calculate IRS based on OVP to implement the traffic redistribution process.
2.2. Types of Attacks and Costs
Degree [18], IRS [15], and link IRS attack strategies are mentioned in this paper. The of degree importance refers to the number of neighbors around node o. The of IRS importance refers to the number of optimal valid paths through node k. The of link IRS importance refers to the number of optimal valid paths through link mn. Usually, the attack cost is positively correlated with the importance value [19], which can be defined as:
where, is the correlation coefficient, and this paper . N is the set of nodes or links that were initially attacked. P is a collection of three attack strategies.
3. Analysis of the Cascading Failure Principle for the Inter-Domain Routing System
Most current studies of cascading failure do not distinguish data plane flow from control plane flow. In the inter-domain routing system, data plane traffic and control plane traffic cannot be confused. Data plane traffic refers to the data traffic forwarded by the routing nodes. Control plane traffic refers to the traffic used to maintain connections between routes between domains, including UPDATE messages, KEEPALIVE messages, OPEN messages, NOTIFICATION messages, etc. Usually, the data plane and control plane has limited resources. Data plane traffic mainly consumes link bandwidth resources, while control plane traffic mainly consumes CPU and memory resources of the router [20]. A large number of UPDATE messages on the control plane arrive at the node at the same time, which causes the node to fail because the CPU and memory resources of the node are exhausted. The failure of the link is caused by the surge of traffic overload of the data plane service that needs to be forwarded in a short time.
After analyzing BGP behavior under the influence of worms [21], it is found that a small number of BGP session resets produce many UPDATE messages. This is a recovery feedback mechanism. BGP session reset is the process of session recovery. The UPDATE generated in this process will feedback to the whole network and have a huge impact. Therefore, according to the different stages of failure propagation, this paper believes that cascading failure is caused by three factors. One is that the failure of the node causes the propagation process of the UPDATE message (FP), which leads to the exhaustion of more node resources. The other is the traffic redistribution (TR) caused by link failure, which leads to more link failure due to overload. Thirdly, the re-triggered UPDATE message propagation (RP) can have a greater impact on the network in the process of the node or link recovery. FP and TR are completed in the failure phase, while the RP is completed in the recovery phase.
4. CFM-RFM
4.1. Notations
All parameters mentioned in this article are defined in Table 1. Some important parameters will be analyzed and explained later.
4.1.1. The Load and Capacity of Nodes
Nodes represent autonomous domains of inter-domain routing networks. The number of UPDATE messages currently received by the node is used as the load of the node. The number of UPDATE messages that the node can process in a short time is abstracted into the capacity R of the node. R can be set to a fixed value [22]. This paper assumes that when the number of UPDATE messages received by a node in a short time is less than R, the node can process these UPDATE messages. If the number of UPDATE messages exceeds R, the node is considered invalid.
4.1.2. The Load and Capacity of Links
The load of a link is the product of the optimal number of valid paths through the link and the corresponding traffic. To simplify the model, it is assumed that the traffic passing through each optimal and valid path is , the load can be defined as:
where represents the optimal number of effective paths through between and . When , it is EIRS. The formula is as follows:
Motter et al. [11] believe that the capacity is proportional to the initial load, and this paper uses the same definition. is as follows:
where represents the initial load of .
4.2. Propagation Mechanism of UPDATE Messages
4.2.1. Failure of the Node Causes the Propagation Process of the UPDATE Message
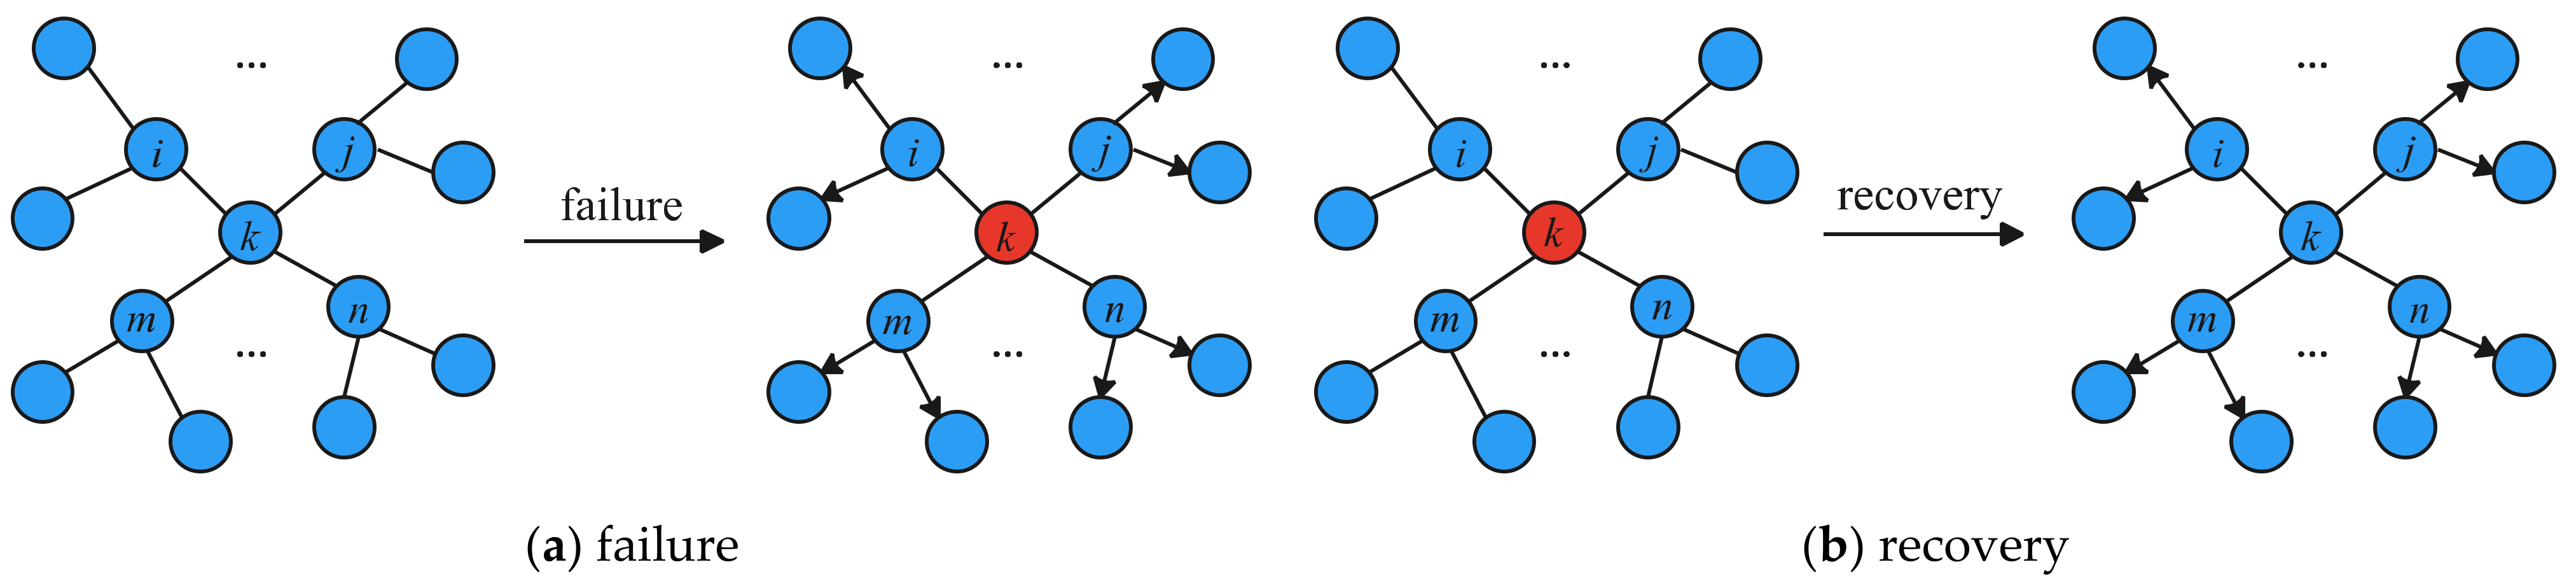
Both failures of node and link failure may cause neighbors to generate UPDATE messages. As shown in Figure 1a, the blue node is the normal working node and the red node is the failure node. When fails, the neighbors will send UPDATE messages to . Each node that receives the UPDATE will parse the message. The forward continues until have received the UPDATE message.
4.2.2. Re-Triggered UPDATE Message Propagation
Both recoveries of node and link failure may cause neighbors to generate UPDATE messages. As shown in Figure 1b, the blue node is the normal working node and the red node is the node to be restored. When is restored, the neighbors will send UPDATE messages to . Each node that receives the UPDATE will parse the message. The forward continues until have received the UPDATE message.
4.2.3. Pseudocode
Algorithm 1 shows the steps for the propagation mechanism of UPDATE messages. It can be written down as .
| Algorithm 1. The propagation algorithm. |
| Input:G, LoadNode, InvalidNodeSet, RecoverNodeSet |
| Output: The updated state of the node |
| 1: While InvalidNodeSet do |
| 2: Find all the neighbors (NeighborSet) of the node in the InvalidNode; |
| 3: NeighborSet sends UPDATE messages to reachable ,; |
| 4: LoadNode [] ← LoadNode [] + 1; |
| 5: IF LoadNode [] > R, InvalidNodeSet.add (), RecoverNodeSet.add (); |
| 6: End while |
| 7: While RecoverNodeSet and do |
| 8: Find all the neighbors (NeighborSet) of the node in the RecoverNodeSet; |
| 9: NeighborSet sends UPDATE messages to reachable ,; |
| 10: LoadNode [] ← LoadNode [] + 1; |
| 11: IF LoadNode [] > R, InvalidNodeSet.add (), RecoverNodeSet.add (); |
| 12: End while |
4.3. Traffic Redistribution
At the beginning of the model operation, the and can be calculated according to the network topology. During the operation of the model, will change dynamically after the failure of the node or link, which will lead to the change of . Algorithm 2 shows the steps for the traffic redistribution algorithm. It can be written down as .
| Algorithm 2. Traffic redistribution algorithm. |
| Input: G, LoadLink, InvalidLinkSet, OptimalValidPaths, |
| Output: The updated state of the link |
| 1: Check p in OptimalValidPaths; |
| 2: While do |
| 3: For do |
| 4: LoadLink [] ← LoadLink [] − ; |
| 5: End for |
| 6: OptimalValidPaths.delete (p); |
| 7: End while |
| 8: Find the new optimal valid path ; |
| 9: OptimalValidPaths.add (); |
| 10: For do |
| 11: LoadLink [] ← LoadLink [] + ; |
| 12: IF LoadLink [] > , InvalidLinkSet.add (); |
| 13: End for |
4.4. Modeling the Process of Cascading Failure
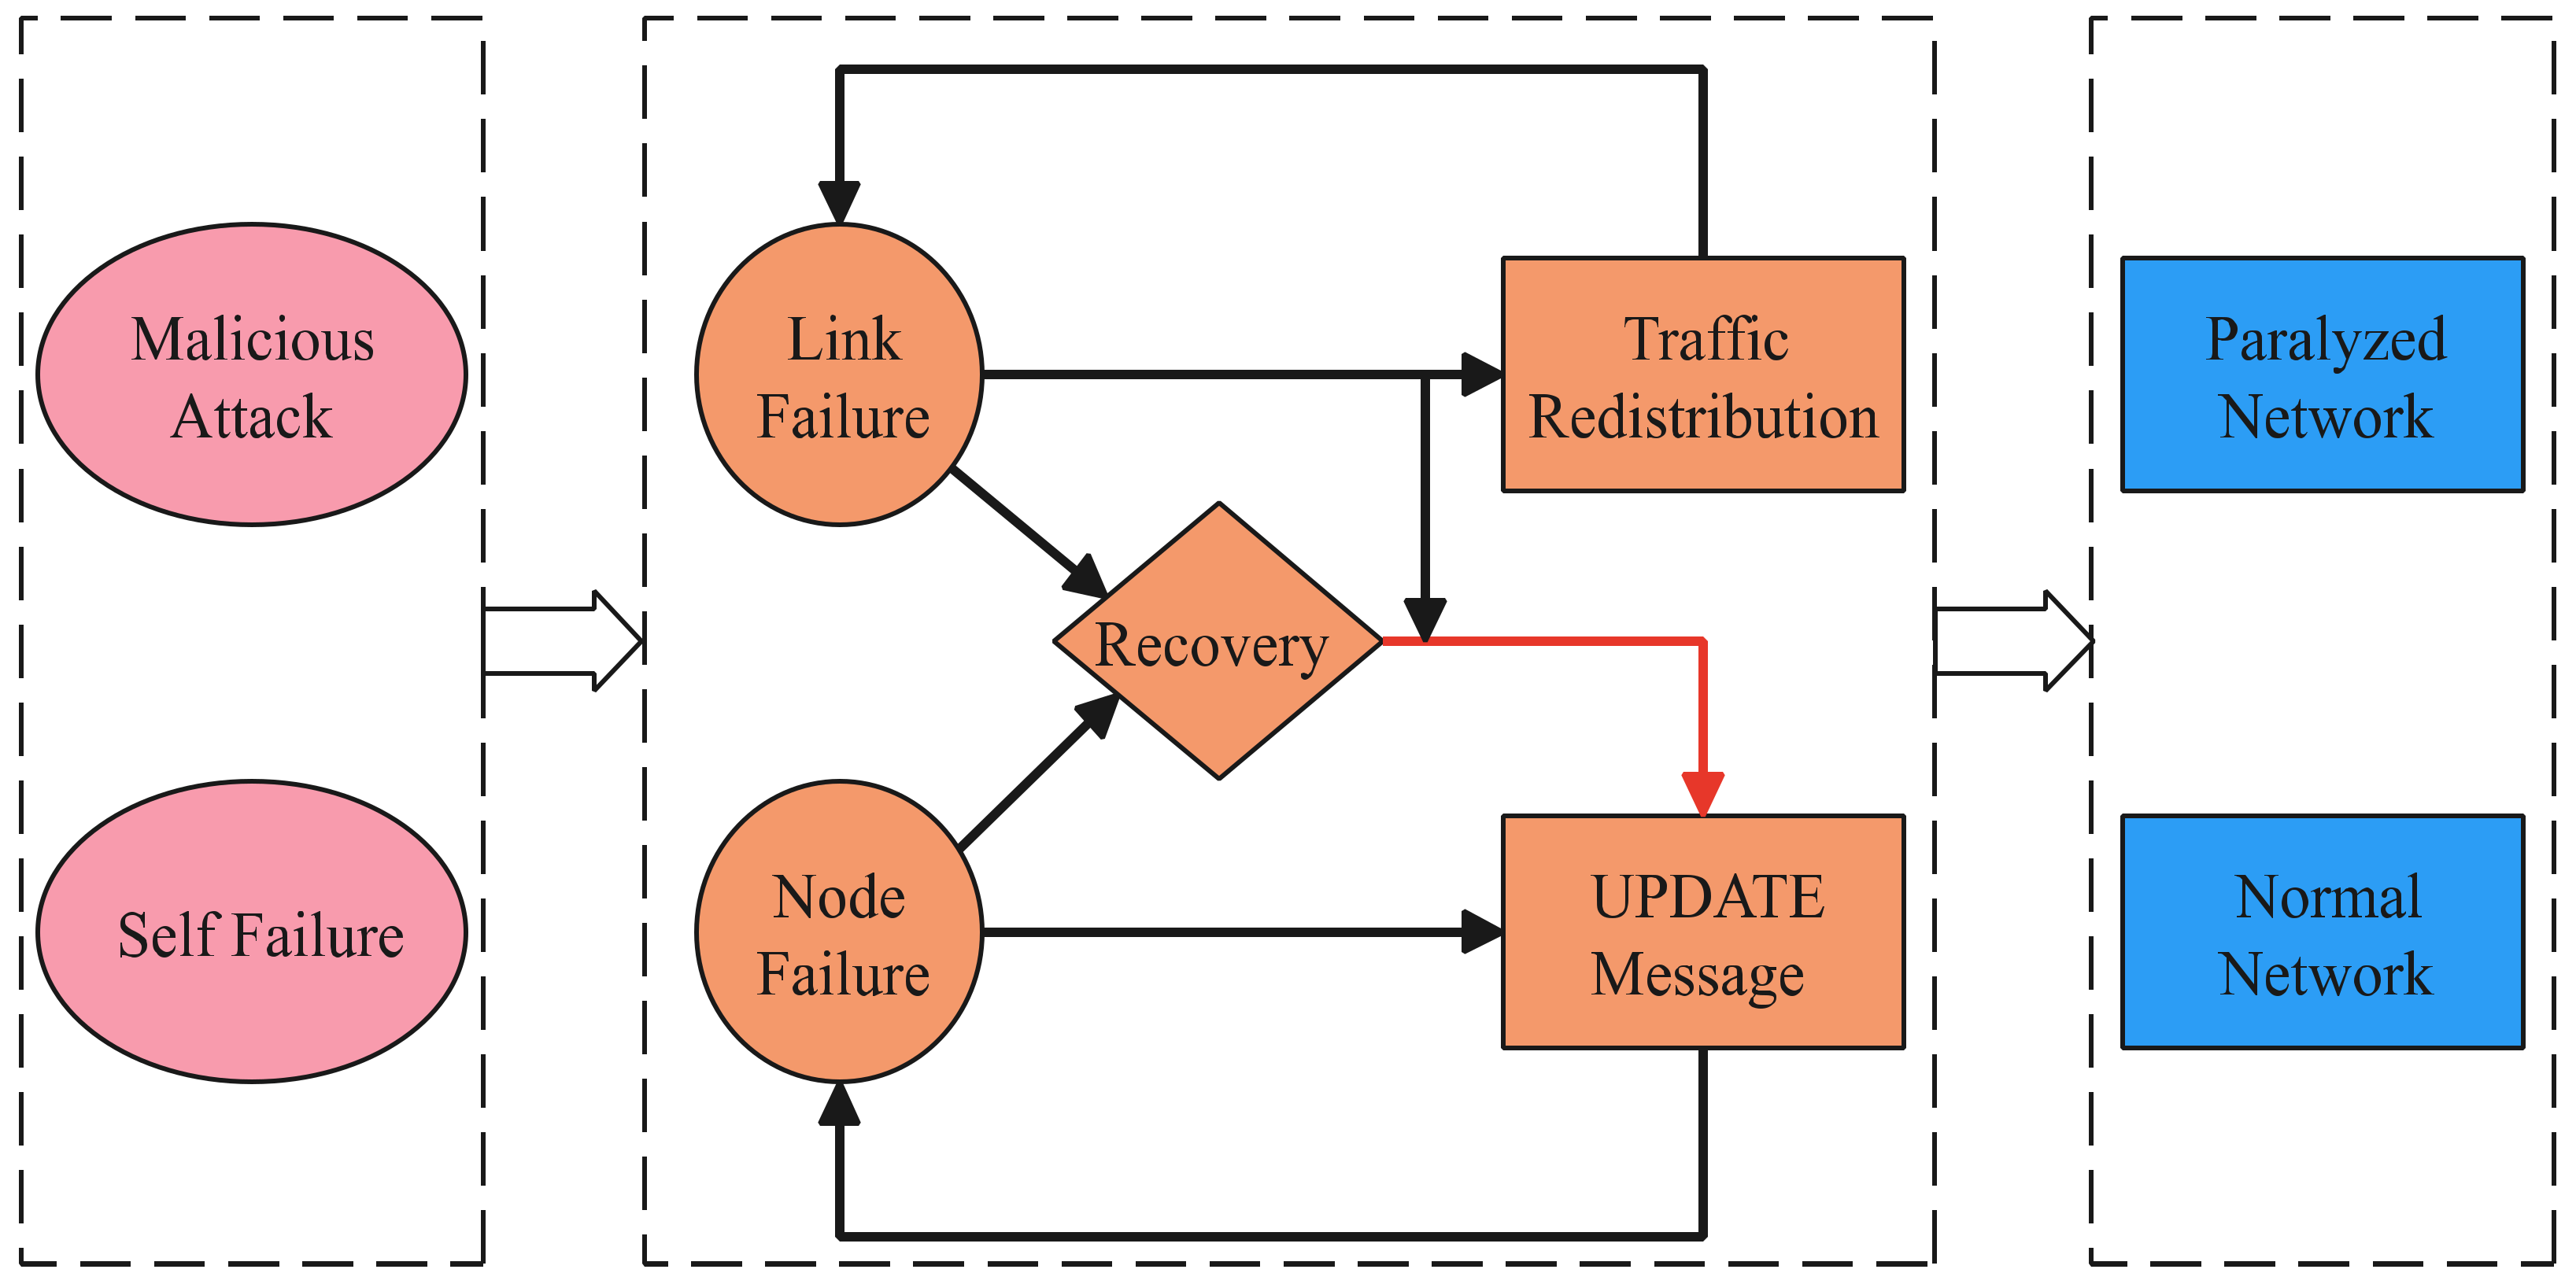
As shown in Figure 2, the evolution process of cascading failure is mainly divided into three stages: the initial stage of cascading failure, the propagation stage of cascading failure, and the equilibrium stage of the system.
• Failure
When there is no external influence, the inter-domain routing system runs stably. A node or link is affected at a certain moment, the state will change. It can be expressed as follows:
where is the state of the node and link, W is the state of normal working and F is the state of failure. is malicious attack and is self-failure. is the judgment of failure, can be expressed as follows:
• Propagation
This stage mainly includes three processes. The first is the update message flooding process caused by node failure and link failure, which can be expressed as follows:
The second is the traffic redistribution process after a link failure, which can be expressed as follows:
The third is the update message flooding process caused by recovery of failed nodes and links, which can be expressed as follows:
• Equilibrium
Since there are factors and recovery mechanisms that cause node or link failure in the model, there are two balanced states in the final model. One is that all nodes in the network fail and the entire network is paralyzed. The other is that the network returns to normal working after shaking.
5. Experiments and Analysis
5.1. Data and Parameter Setup
Considering the difference between the network scale and the rate of the number of nodes to the number of links, Canada and India were selected from the as-relationships data of the CAIDA [23] project in March 2021 to form the network topology, including the autonomous domain relationship and business relationship of nodes and links. The information for India and Canada is shown in Table 2. It includes parameters related to the model operation.
5.2. Metric of Evaluation for Cascading Failure
To quantify the extent of cascading failure effects, the calculation method of the failure rate is defined as follows:
where represents the number of failed nodes. represents the number of failed links. represents the number of all failures in the network. W represents the total number of initial nodes and links.
5.3. Impact of Recovery Feedback Mechanism
To verify the recovery feedback mechanism, a Cascading Failure Model based on Double Damage Factor (CFM-DDF) without RP was introduced for comparison. Under the three attack strategies, the top 1% nodes or links of the two networks were removed to observe the failure situations simulated by different models.
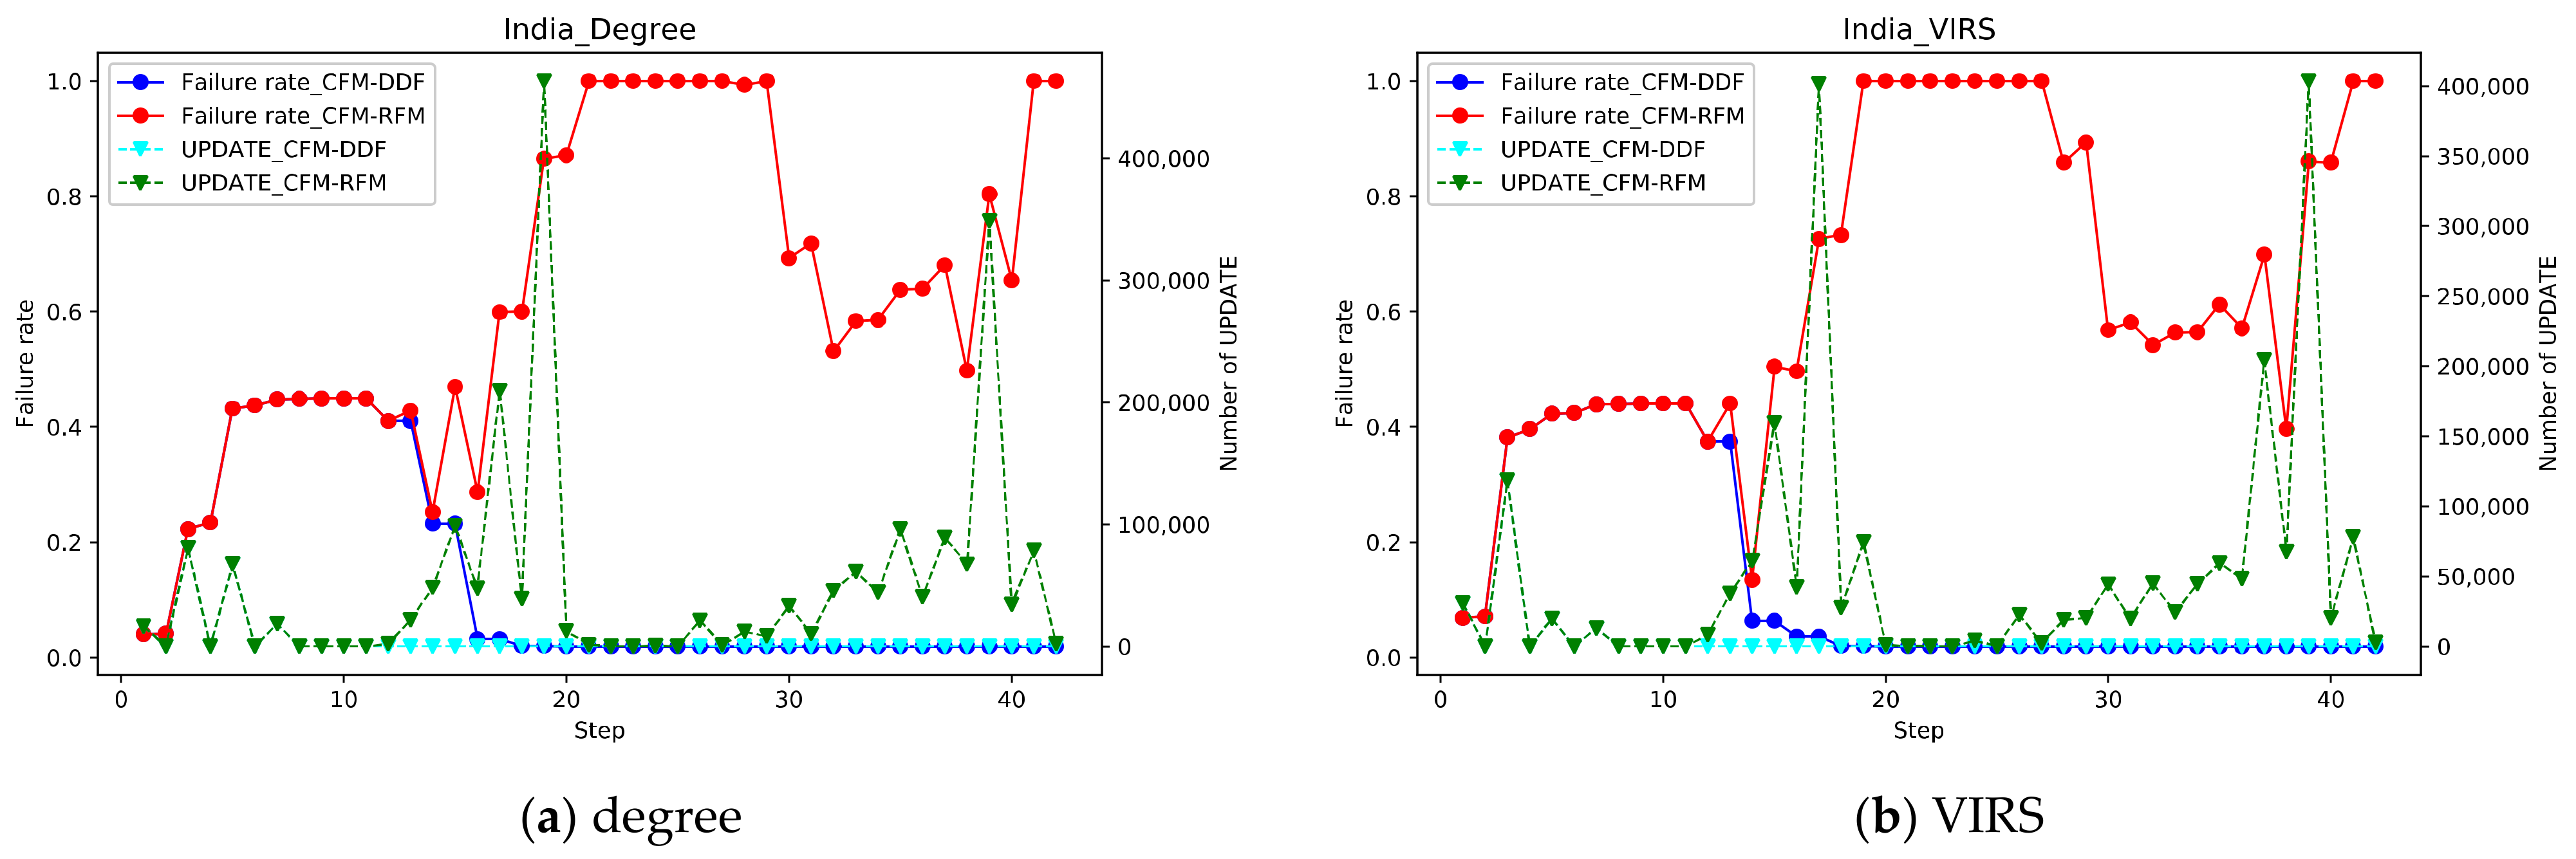
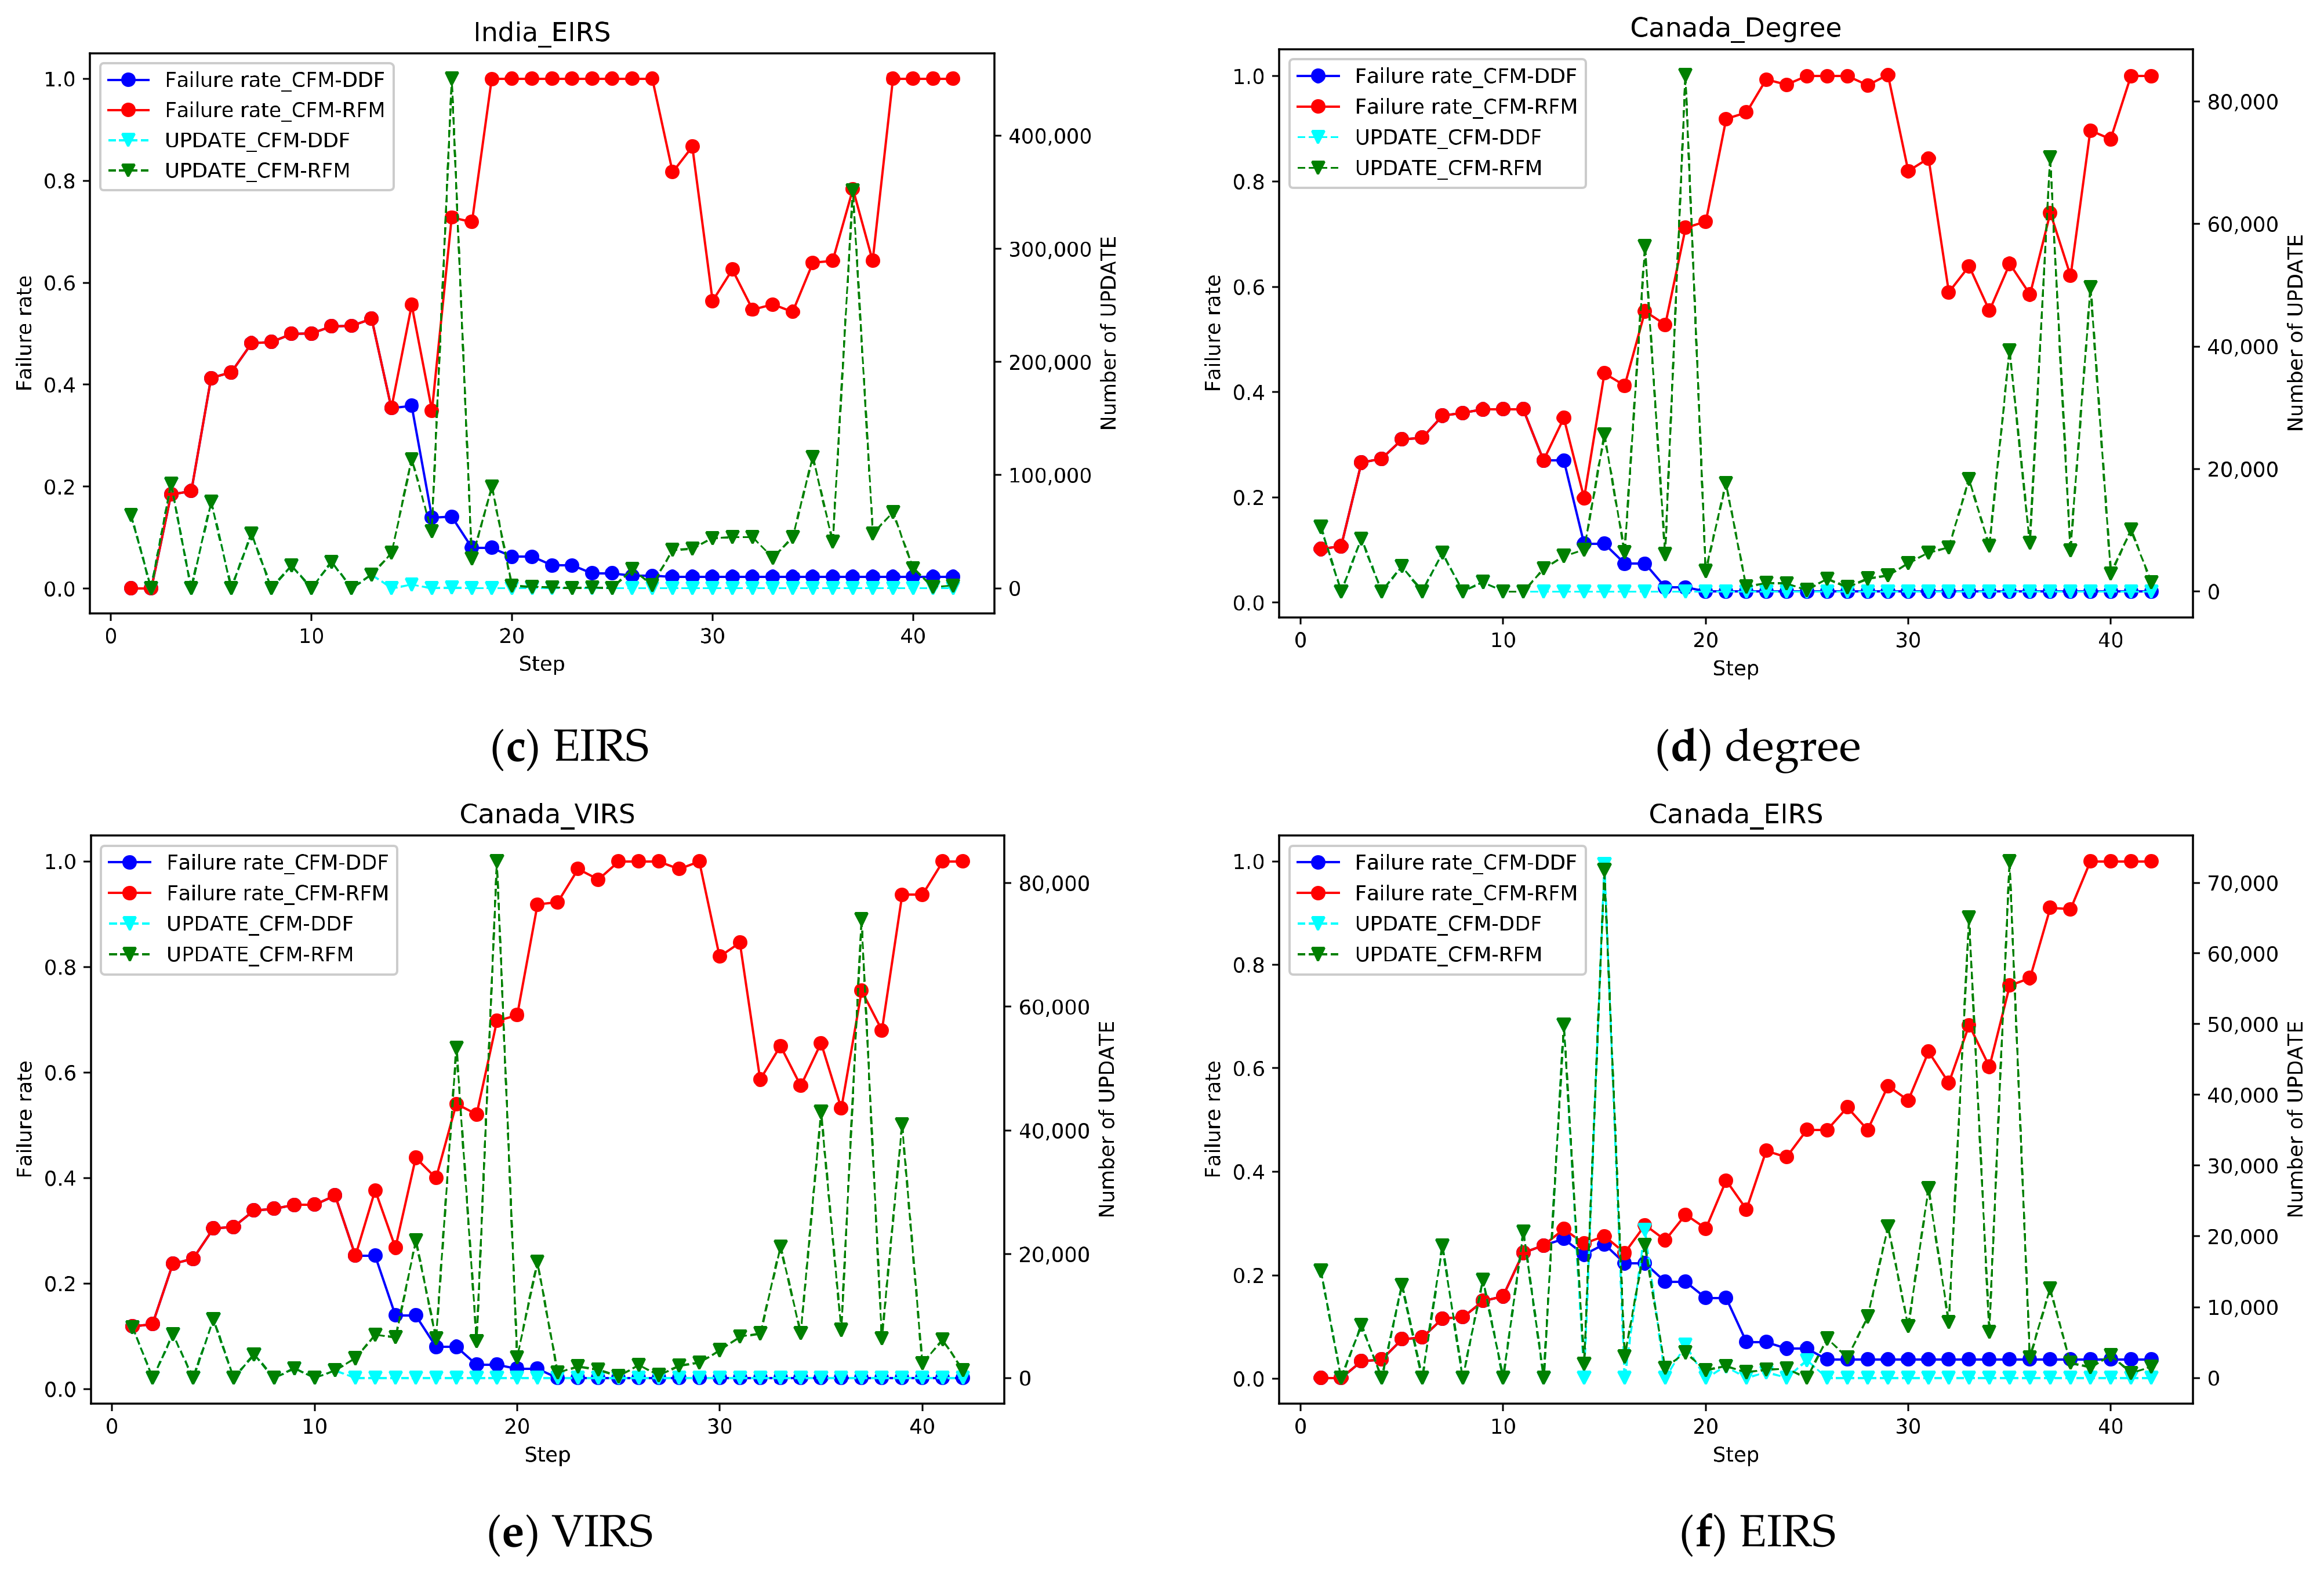
As shown in Figure 3, the recovery feedback mechanism is a facilitator to cascading failure. When the step is at 18–20 and 30–40, the CFM-RFM considering the RP produces a large number of UPDATE messages due to the recovery mechanism, which accelerates the cascading failure process and causes the improved network to collapse more quickly. It reflects that the increase in the number of UPDATE messages is positively correlated with the degree of network failure, which is also in line with the actual situation. In the CFM-DDF without RP, the network quickly returns to normal under the recovery mechanism. The number of UPDATE messages goes to 0.
In CFM-RFM, the VIRS attack is the most efficient for the Indian system. At step = 18, the network is completely down for the first time. Under the ERIS attack, the network is completely paralyzed for the first time when step = 20. Under the degree of attack strategy, the network is paralyzed at step = 22. In Canada, the effect of the degree attack strategy and the VIRS attack strategy is roughly the same, due to the attack nodes selected by the two strategies are relatively similar. The EIRS attack strategy is the worst, with step = 40 causing the network to crash completely.
Comparing the inter-domain routing systems of the two countries, the change in the number of updates in Canada was larger than that in India after the attack. It may be caused by differences in network structure. In Figure 3f, under the ERIS attack, failure and recovery are closely linked and alternate. The failure rate changes at a little speed and the failure scale of the network gradually expands until the network collapses completely.
5.4. Analysis of Attack Costs
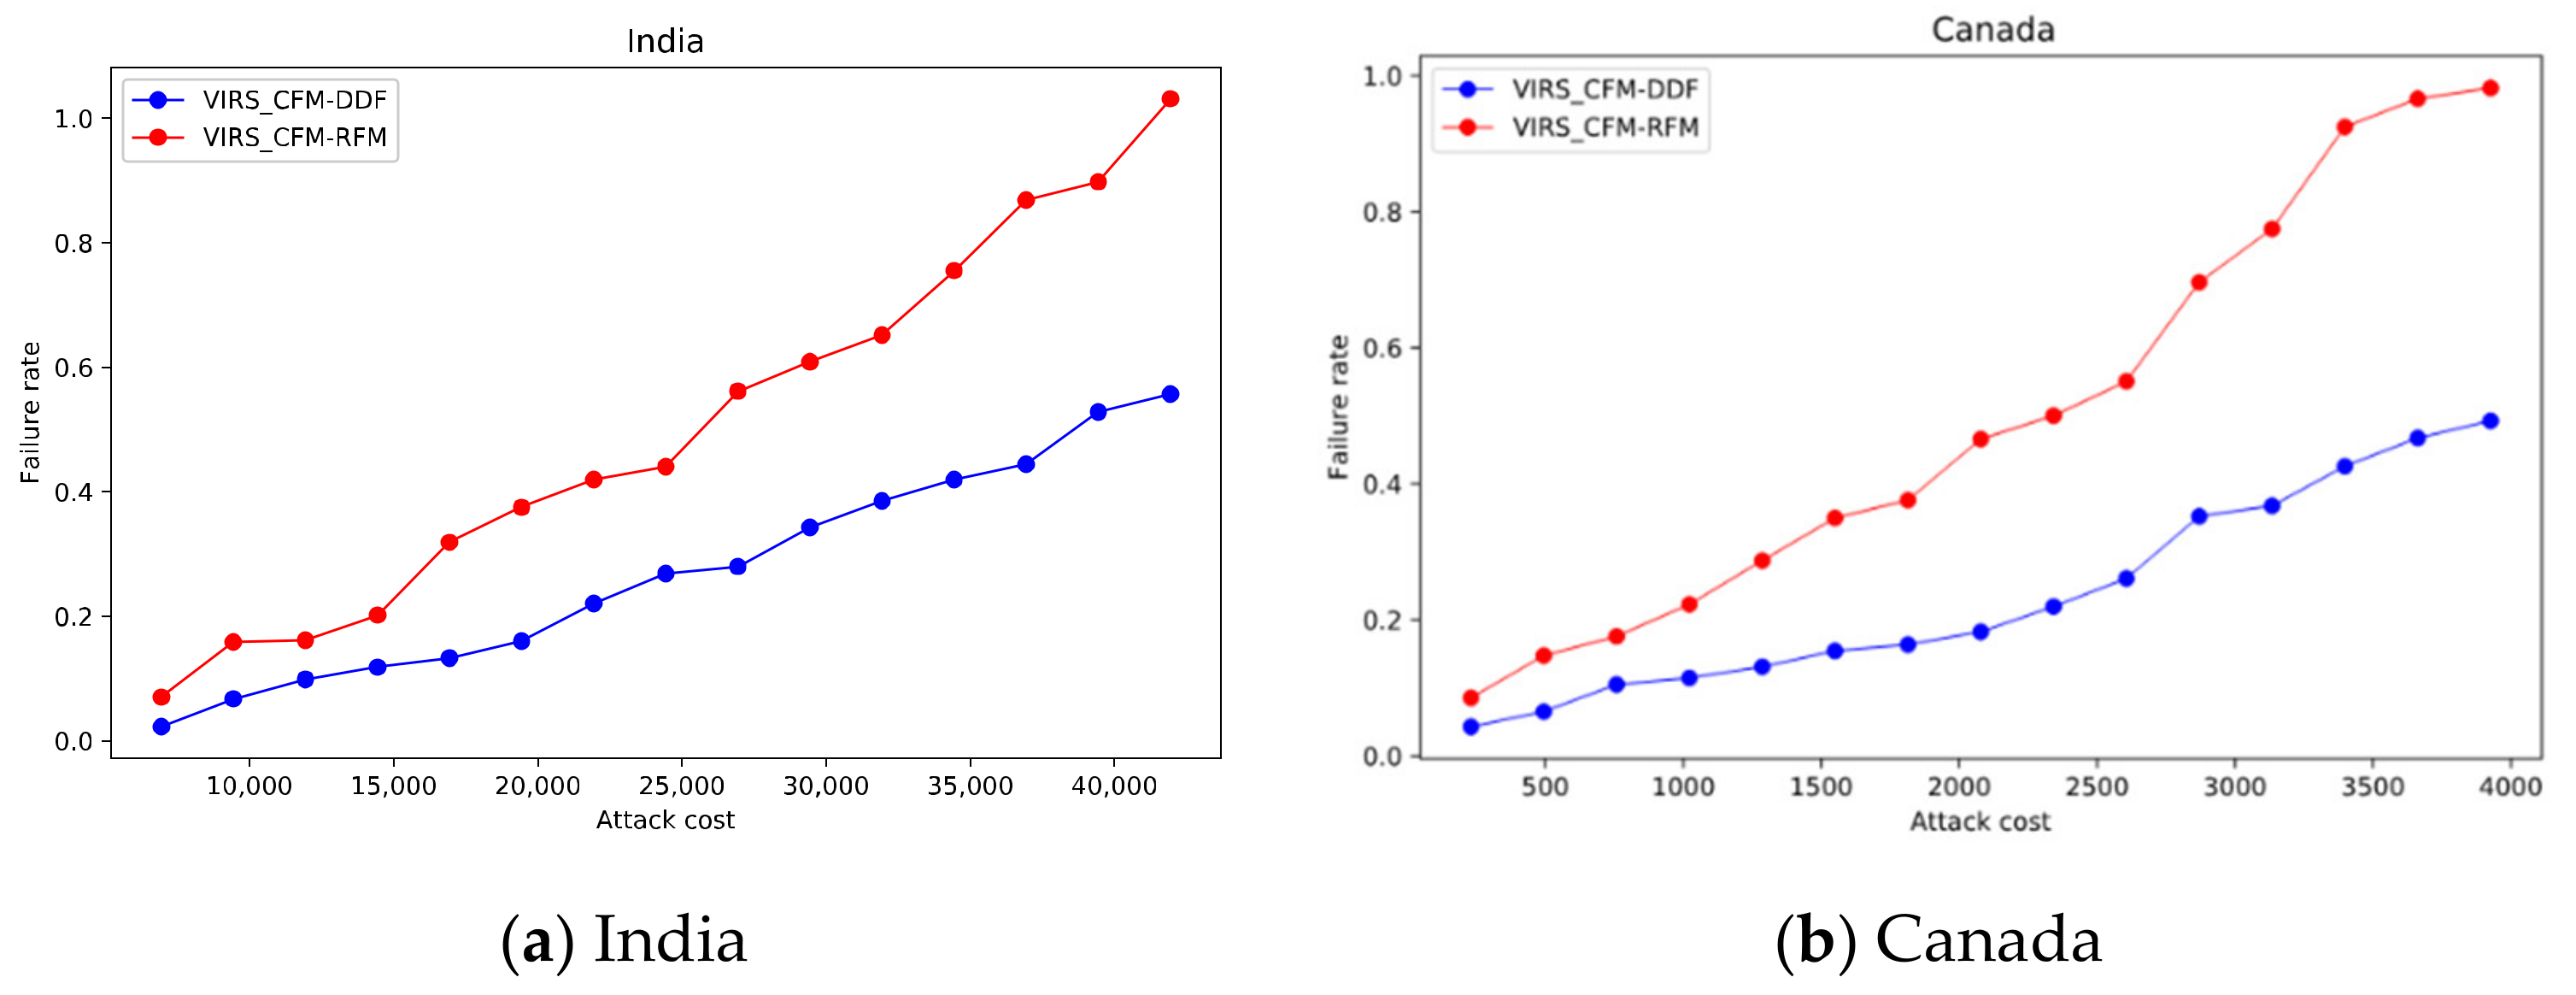
As shown in Figure 4, in the inter-domain routing system of two countries, the failure rate in CFM-RFM is larger when the attack cost is the same. In India, when the failure rate of CFM-RFM is 1, the failure rate of CFM-DDF is only 55.7%. Attack costs can be reduced by 35.8% in CFM-RFM. In Canada, when the failure rate of CFM-RFM is 1, the failure rate of CFM-DDF is only 49.3%. Attack costs can be reduced by 40.4% in CFM-RFM.
5.5. Validity of CFM-RFM
To verify the validity of the model, security events supported by data sets in recent years are analyzed. The most typical one is the cascading failure of the inter-domain routing network caused by the outbreak of the Code Red II worm on 19 July 2001. Because of its huge impact, there is much richer public data on the Internet monitored by various institutions. The relevant data of the inter-domain routing system in Code Red II is selected to verify the validity of the model. Taking the rrc00 data set of the RIPE [24] project as an example, the UPDATE messages data of 19 July 2001 can be statistically extracted from the data and used as the update changes in the real network for comparison with the update changes generated by the model simulation.
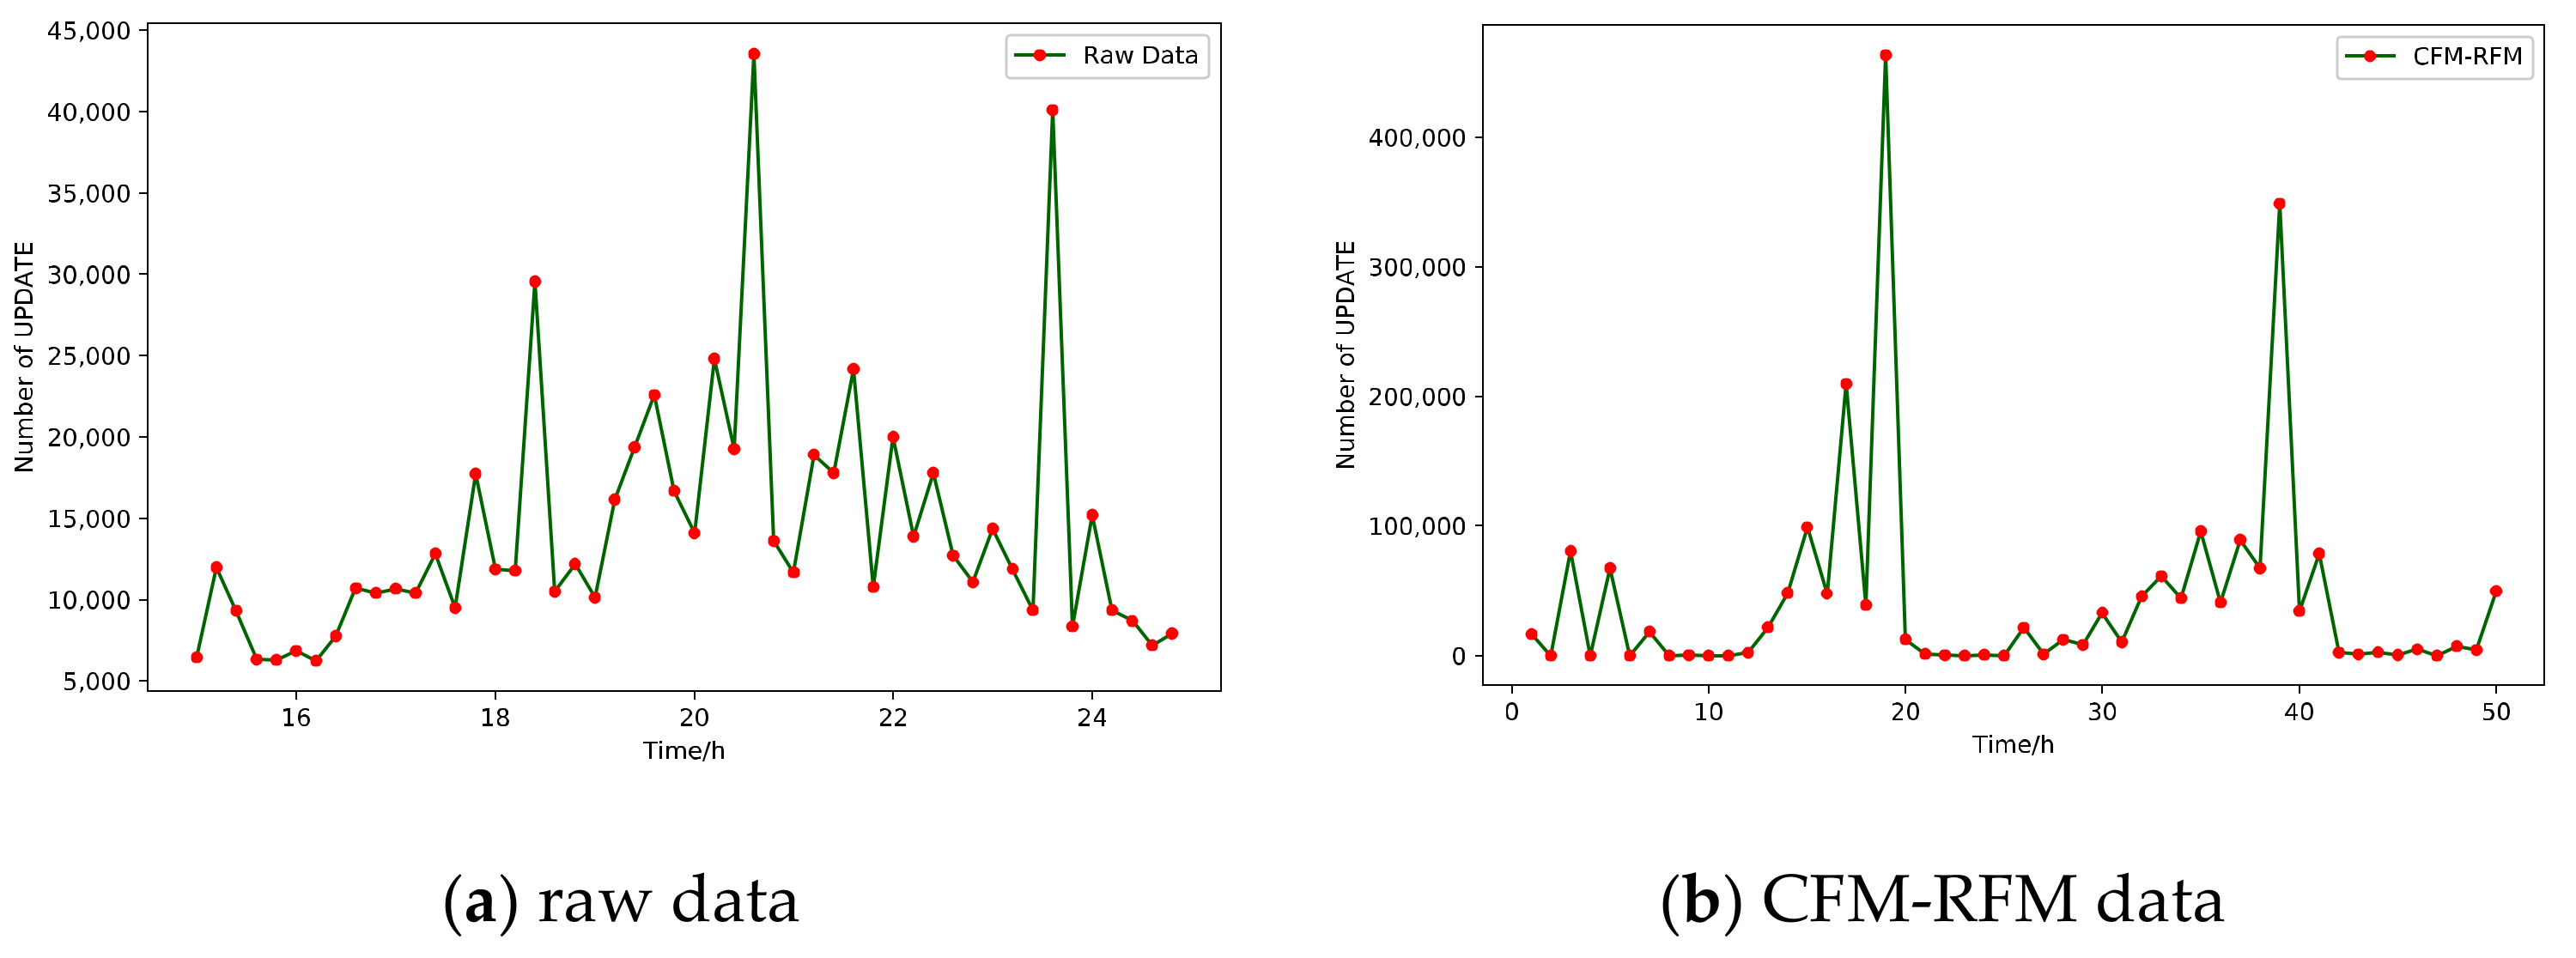
As shown in Figure 5a, the UPDATE changes after Code Red II attacks at 15:00. It can be seen that after the outbreak of the worm, there are roughly three peaks in the UPDATE message changes. The first spike was due to a worm attack that caused the BGP session connection to drop and some routers to overload or crash, which in turn caused a large number of withdrawal notifications from their peers. When the router restarts and begins to re-establish the BGP session, the status update information from the peer is required. This is the reason for the second peak. After the router has obtained all the status updates from its peers, it will propagate all the updated statuses to its peers. This caused the third peak of message changes [25].
As shown in Figure 5b, CFM-RFM simulates the change of the UPDATE message during the cascading failure after the attack. Since real-time cannot be simulated, it is represented by a logical time step. It can be seen that the main change trend and the interval between the three peaks are roughly similar to the real UPDATE message changes after the attack. It reflects the general law of the trend of the real UPDATE message. Therefore, it is considered that CFM-RFM can better describe the cascading failure process of the inter-domain routing system.
6. Conclusions
To construct a reasonable cascading failure model for inter-domain routing systems, CFM-RFM with recovery feedback mechanism is proposed in this paper. We apply three attack strategies, using CFM-DDF and CFM-DDF respectively to simulate the cascading failure process of two real inter-domain routing systems. The simulation results show that the UPDATE generated during the process of restoring the BGP session can promote the cascading failure and verify the recovery feedback mechanism. In addition, Compared with CFM-DDF, CFM-RFM can reduce the cost of attack while achieving the same damage effect. Completely disabling the Indian network can reduce the attack cost by 35.8%, while in Canada, it can reduce the attack cost by 40.4%. We also compared the UPDATE change data generated by the CFM-RFM simulation during the cascading failure with the UPDATE change data generated by the real cascading failure events. The results are similar, which proves the rationality of the model. In future work, we plan to find the important nodes in the inter-domain routing system. This is of great significance to the protection of inter-domain routing systems and the formulation of attack strategies.
Author Contributions
Conceptualization, W.Z. and Y.W.; methodology, W.Z. and Y.L.; validation, W.Z. and X.X.; writing—original draft preparation, W.Z.; writing—review and editing, Y.W. and X.X. All authors have read and agreed to the published version of the manuscript.
Funding
This research received no external funding.
Institutional Review Board Statement
Not applicable.
Informed Consent Statement
Not applicable.
Data Availability Statement
The data used in this paper are from https://publicdata.caida.org/datatasets/as-relationships/ and https://www.ripe.net/analyse/internet-measurements/routing-information-service-ris/ris-raw-data (accessed on 17 May 2021).
Acknowledgments
Thanks for the experimental environment provided by the School of Electronic Engineering, National University of Defense Technology.
Conflicts of Interest
The authors declare no conflict of interest.
References
- Butler, K.; Farley, T.R.; Mcdaniel, P.; Rexford, J. A Survey of BGP Security Issues and Solutions. Proc. IEEE 2009, 98, 100–122. [Google Scholar] [CrossRef]
- Li, S.; Zhuge, J.W.; Li, X. Study on BGP Security. J. Softw. 2013, 24, 121–138. [Google Scholar] [CrossRef]
- Goldberg, S. Why is it taking so long to secure internet routing? Queue 2014, 12, 20–33. [Google Scholar] [CrossRef]
- Vervier, P.A.; Thonnard, O.; Dacier, M. Mind Your Blocks: On the Stealthiness of Malicious BGP Hijacks. In Proceedings of the Network & Distributed System Security Symposium, San Diego, CA, USA, 8–11 February 2015. [Google Scholar]
- Murphy, S. BGP Security Vulnerabilities Analysis. 2006. Available online: https://datatracker.ietf.org/doc/rfc4272 (accessed on 17 May 2021).
- Zou, C.; Gong, W.; Towsley, D. Code red worm propagation modeling and analysis. In Proceedings of the 9th ACM Conference on Computer and Communications Security, CCS 2002, Washington, DC, USA, 18–22 November 2002; pp. 138–147. [Google Scholar] [CrossRef] [Green Version]
- Hakimi, R.; Saputra, Y.M.; Nugraha, B. Case Studies Analysis on BGP: Prefix Hijacking and Transit AS. In Proceedings of the IEEE International Conference on Telecommunication Systems Services and Applications (TSSA’16), Denpasar, Indonesia, 6–7 October 2016; pp. 1–8. [Google Scholar] [CrossRef]
- Schuchard, M.; Mohaisen, A.; Foo Kune, D.; Hopper, N.; Kim, Y.; Vasserman, E.Y. Losing control of the internet: Using the data plane to attack the control plane. In Proceedings of the 17th ACM Conference on Computer and Communications Security, Chicago, IL, USA, 4–18 October 2010; pp. 726–728. [Google Scholar]
- Deng, W.; Zhu, P.; Lu, X.; Plattner, B. On Evaluating BGP Routing Stress Attack. J. Commun. 2010, 5, 13–22. [Google Scholar] [CrossRef] [Green Version]
- Li, H.; Zhu, J.; Qiu, H.; Wang, Q.; Zhou, T.; Li, H. The new threat to internet: DNP attack with the attacking flows strategizing technology. Int. J. Commun. Syst. 2015, 28, 1126–1139. [Google Scholar] [CrossRef]
- Motter, A.E.; Lai, Y.C. Cascade-based Attacks on Complex Networks. Phys. Rev. E 2003, 66, 065102. [Google Scholar] [CrossRef] [Green Version]
- Guo, Y.; Wang, Z.; Luo, S.; Wang, Y. A cascading failure model for interdomain routing system. Int. J. Commun. Syst. 2012, 25, 1068–1076. [Google Scholar] [CrossRef]
- Liu, Y.; Wei, P.; Su, J.; Wang, Z. Assessing the Impact of Cascading Failures on the Interdomain Routing System of the Internet. New Gener. Comput. 2014, 32, 237–255. [Google Scholar] [CrossRef]
- Gao, L. On inferring autonomous system relationships in the Internet. IEEE/ACM Trans. Netw. 2001, 9, 733–745. [Google Scholar] [CrossRef]
- Lu, Y.; Yang, B. Analyzing and modeling cascading failures for inter-domain routing system. J. Syst. Eng. Electron. 2016, 38, 172–178. [Google Scholar]
- Zhu, H.; Qiu, H.; Wang, Q. Double Damage Factor Based Inter-Domain Routing System Cascading Failure Model. Comput. Eng. Appl. 2019, 55, 92–99. [Google Scholar]
- Zhang, J.; Zhang, J.; Xiong, X.; Wang, Y. Optimal valid path prediction method for inter-domain networks considering commercial relationships. J. Phys. Conf. Ser. 2020, 1693, 012023. [Google Scholar] [CrossRef]
- Bonacich, P.F. Factoring and weighting approaches to status scores and clique identification. J. Math. Sociol. 1972, 2, 113–120. [Google Scholar] [CrossRef]
- Zhang, L.; Xia, J.; Cheng, F.; Qiu, J.; Zhang, X. Multi-Objective Optimization of Critical Node Detection Based on Cascade Model in Complex Networks. IEEE Trans. Netw. Sci. Eng. 2020, 7, 2052–2066. [Google Scholar] [CrossRef]
- Zhang, Y.; Mao, Z.M.; Wang, J. Low-Rate TCP-Targeted DoS Attack Disrupts Internet Routing. In Proceedings of the NDSS, San Diego, CA, USA, 28 February–2 March 2007. [Google Scholar] [CrossRef]
- Wang, L.; Zhao, X.; Pei, D.; Bush, R.; Massey, D.; Mankin, A.; Wu, S.F.; Zhang, L. Observation and analysis of BGP behavior under stress. In Proceedings of the 2nd ACM SIGCOMM Workshop on Internet Measurement, Marseille, France, 6–8 November 2002; pp. 183–195. [Google Scholar]
- Chang, D.F.; Govindan, R.; Heidemann, J. An empirical study of router response to large BGP routing table load. In Proceedings of the 2nd ACM SIGCOMM Workshop on Internet Measurement, Marseille, France, 6–8 November 2002; pp. 203–208. [Google Scholar] [CrossRef] [Green Version]
- CAIDA. Available online: https://www.caida.org (accessed on 17 May 2021).
- RIPE’s Routing Information Service. Available online: https://www.ripe.net (accessed on 17 May 2021).
- Coffman, E.G.; Ge, Z.; Misra, V.; Towsley, D. Network Resilience: Exploring Cascading Failures within BGP. In Proceedings of the 40th Annual Allerton Conference on Communications, Computing and Control, Allerton House, IL, USA, 27–29 September 2002. [Google Scholar]
Figure 1.
Propagation process of UPDATE messages.

Figure 2.
Process of cascading failure.

Figure 3.
Under the three attack strategies, the top 1% nodes or links of the two networks were removed to observe the change in failure rate and number of UPDATE as step increases by different models. The solid blue line refers to the CFM-DDF, and the solid red line refers to the CFM-RFM. The dotted line indicates the number of UPDATE. The types of attacks and countries have been indicated in the figure.


Figure 4.
The change process of failure rate with the increase of attack cost.

Figure 5.
Raw data and CFM-RFM data.


Table 1.
Commonly used notations.
| Notations | Descriptions |
|---|---|
| Topology of inter-domain routing network. | |
| V | The set of nodes. |
| E | The set of links. |
| A node . | |
| A link . | |
| / | The load of or . |
| The capacity of . | |
| The capacity of . | |
| Tolerance parameter. | |
| Recovery delay of . | |
| Recovery delay of . | |
| Basic unit flow. | |
| VIRS | Betweenness. |
| EIRS | Betweenness of links. |
| The set of reachable nodes of . |
Table 2.
Parameter setup.
| Parameter | Value_India | Value_Canada |
|---|---|---|
| Num_V | 2406 | 1523 |
| Num_E | 4052 | 2508 |
| Step | 50 | 50 |
| 1 | 1 | |
| 0.3 | 0.3 | |
| 250 | 150 | |
| 5 | 5 | |
| 5 | 5 |
Publisher’s Note: MDPI stays neutral with regard to jurisdictional claims in published maps and institutional affiliations. |
© 2021 by the authors. Licensee MDPI, Basel, Switzerland. This article is an open access article distributed under the terms and conditions of the Creative Commons Attribution (CC BY) license (https://creativecommons.org/licenses/by/4.0/).
Share and Cite
MDPI and ACS Style
Zhao, W.; Wang, Y.; Xiong, X.; Li, Y. CFM-RFM: A Cascading Failure Model for Inter-Domain Routing Systems with the Recovery Feedback Mechanism. Information 2021, 12, 247. https://0-doi-org.brum.beds.ac.uk/10.3390/info12060247
AMA Style
Zhao W, Wang Y, Xiong X, Li Y. CFM-RFM: A Cascading Failure Model for Inter-Domain Routing Systems with the Recovery Feedback Mechanism. Information. 2021; 12(6):247. https://0-doi-org.brum.beds.ac.uk/10.3390/info12060247
Chicago/Turabian StyleZhao, Wendian, Yongjie Wang, Xinli Xiong, and Yang Li. 2021. "CFM-RFM: A Cascading Failure Model for Inter-Domain Routing Systems with the Recovery Feedback Mechanism" Information 12, no. 6: 247. https://0-doi-org.brum.beds.ac.uk/10.3390/info12060247
Note that from the first issue of 2016, this journal uses article numbers instead of page numbers. See further details here.