
A Proposal of the Fingerprint Optimization Method for the Fingerprint-Based Indoor Localization System with IEEE 802.15.4 Devices

 , and
, and
Abstract
:1. Introduction
2. Comparison of Indoor Localization Techniques
3. Review of FILS15.4 and the Fluctuation Problem
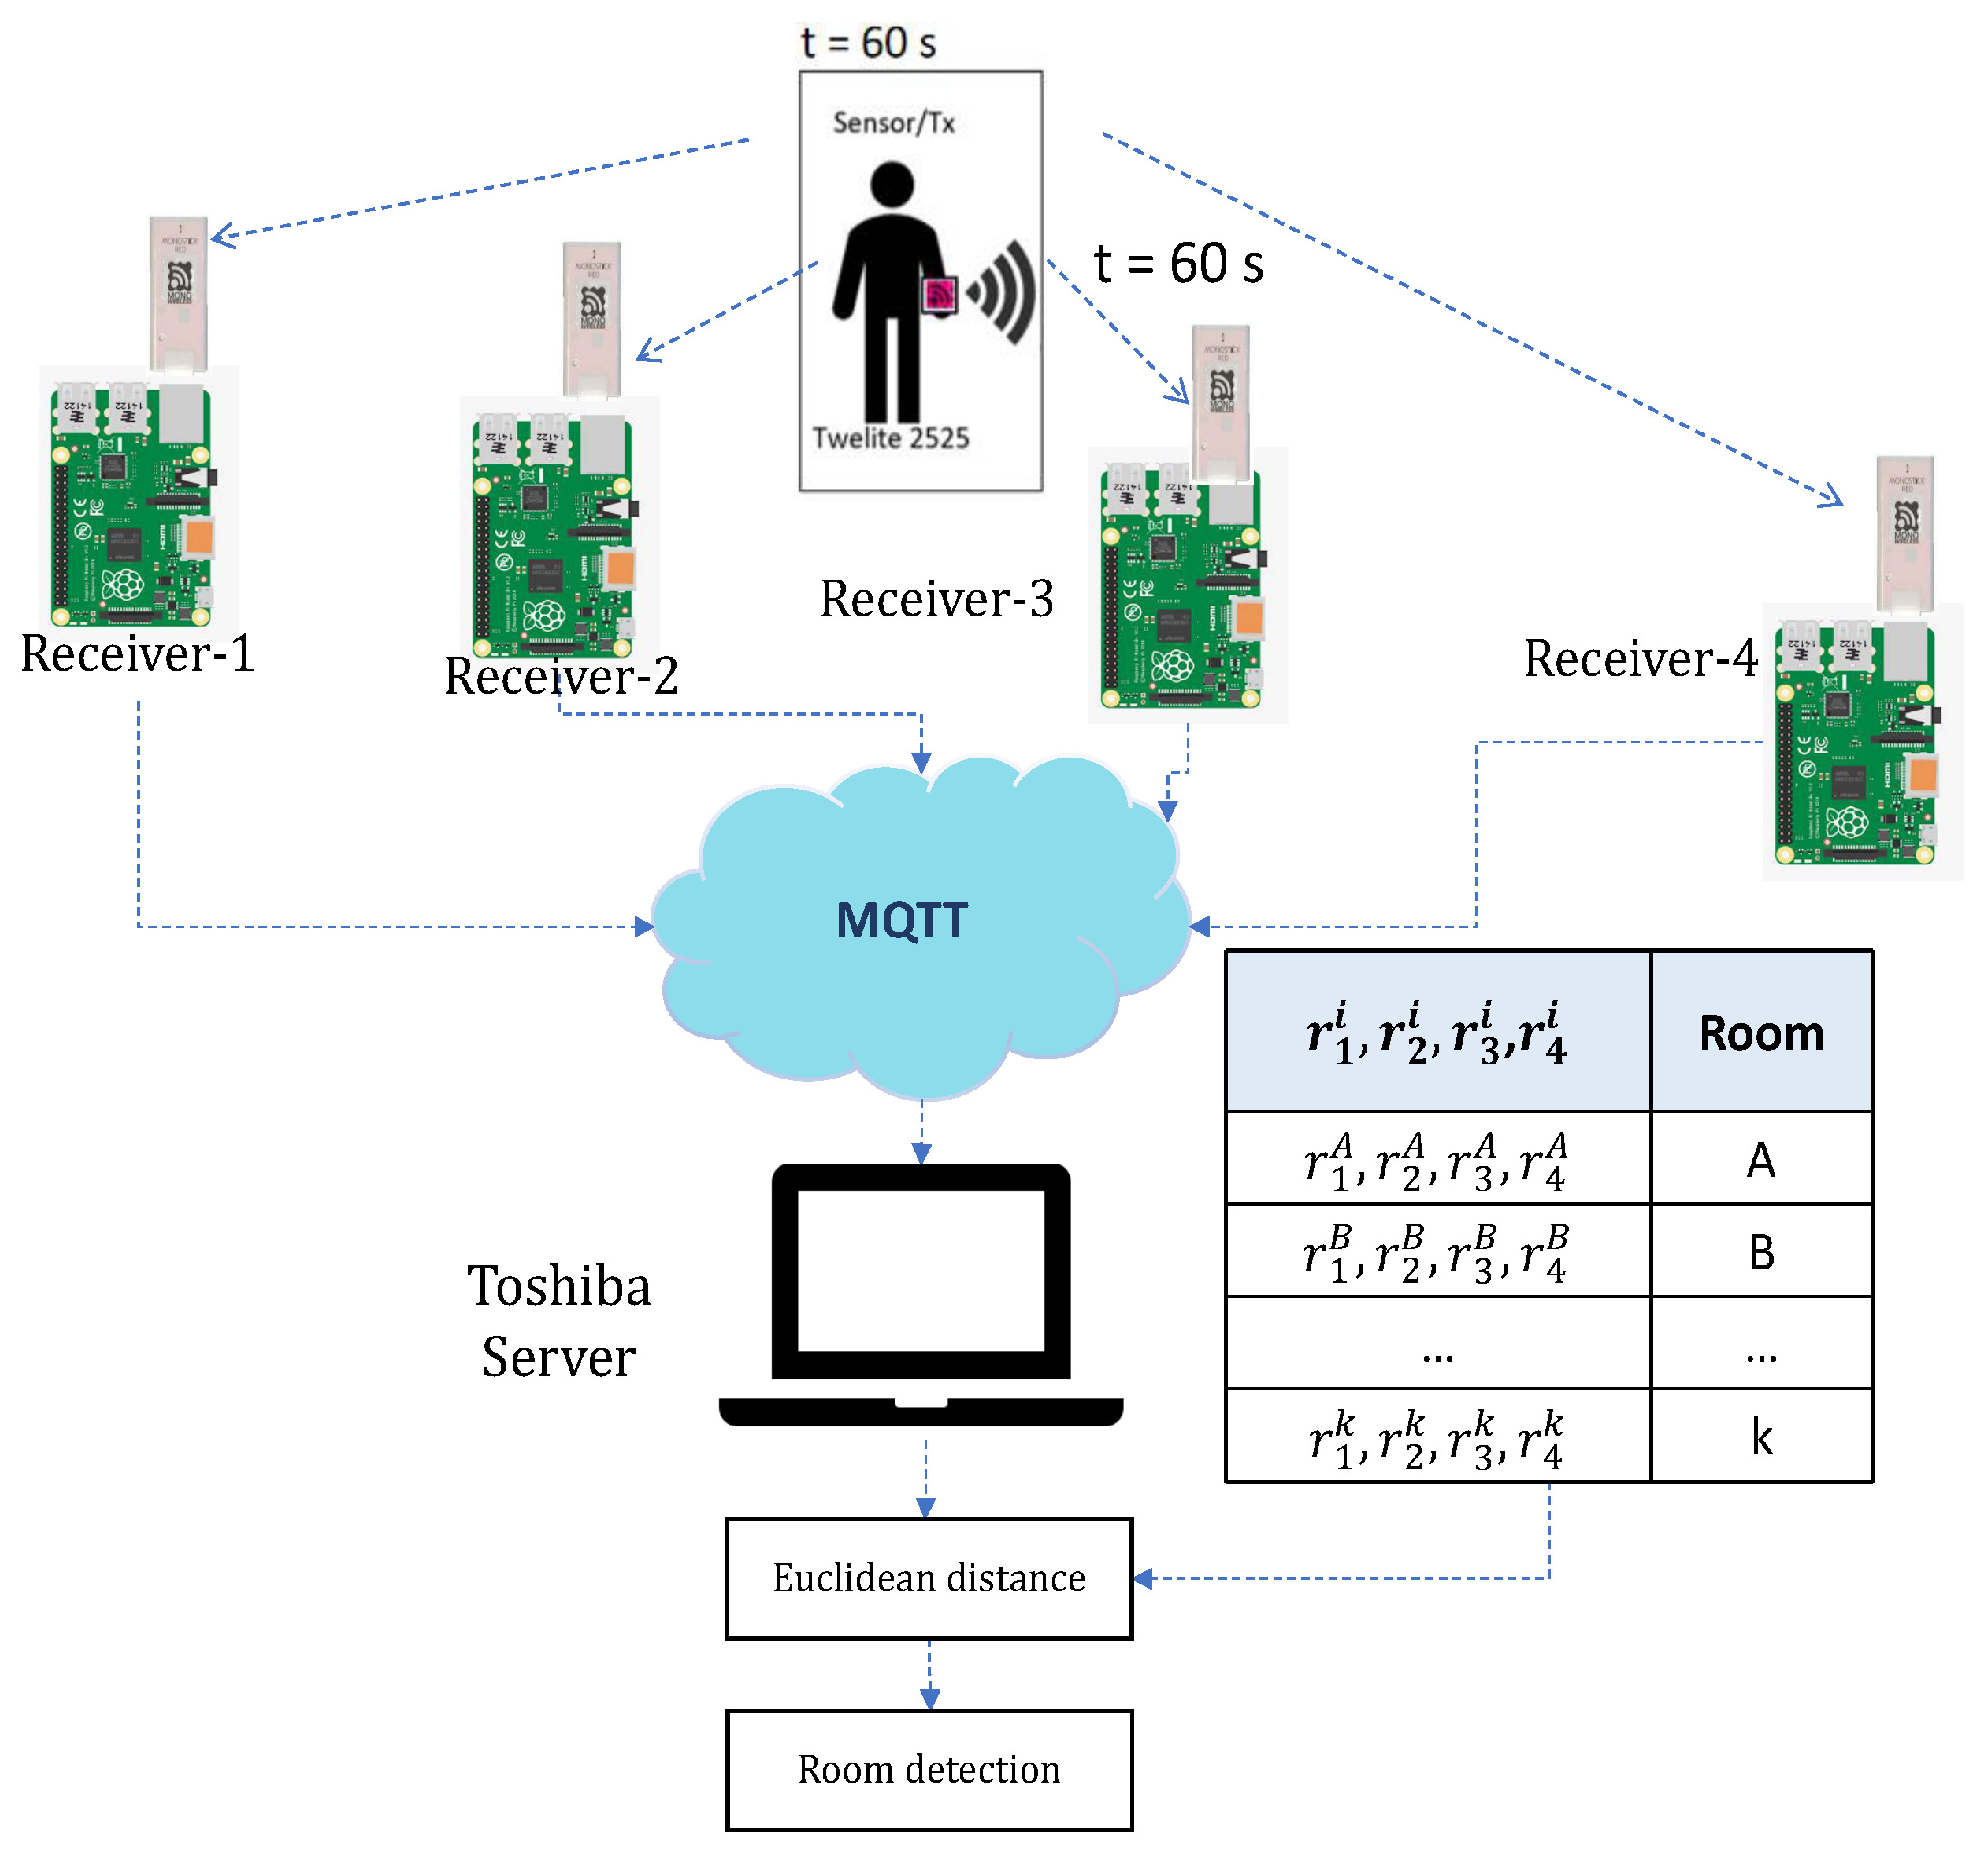
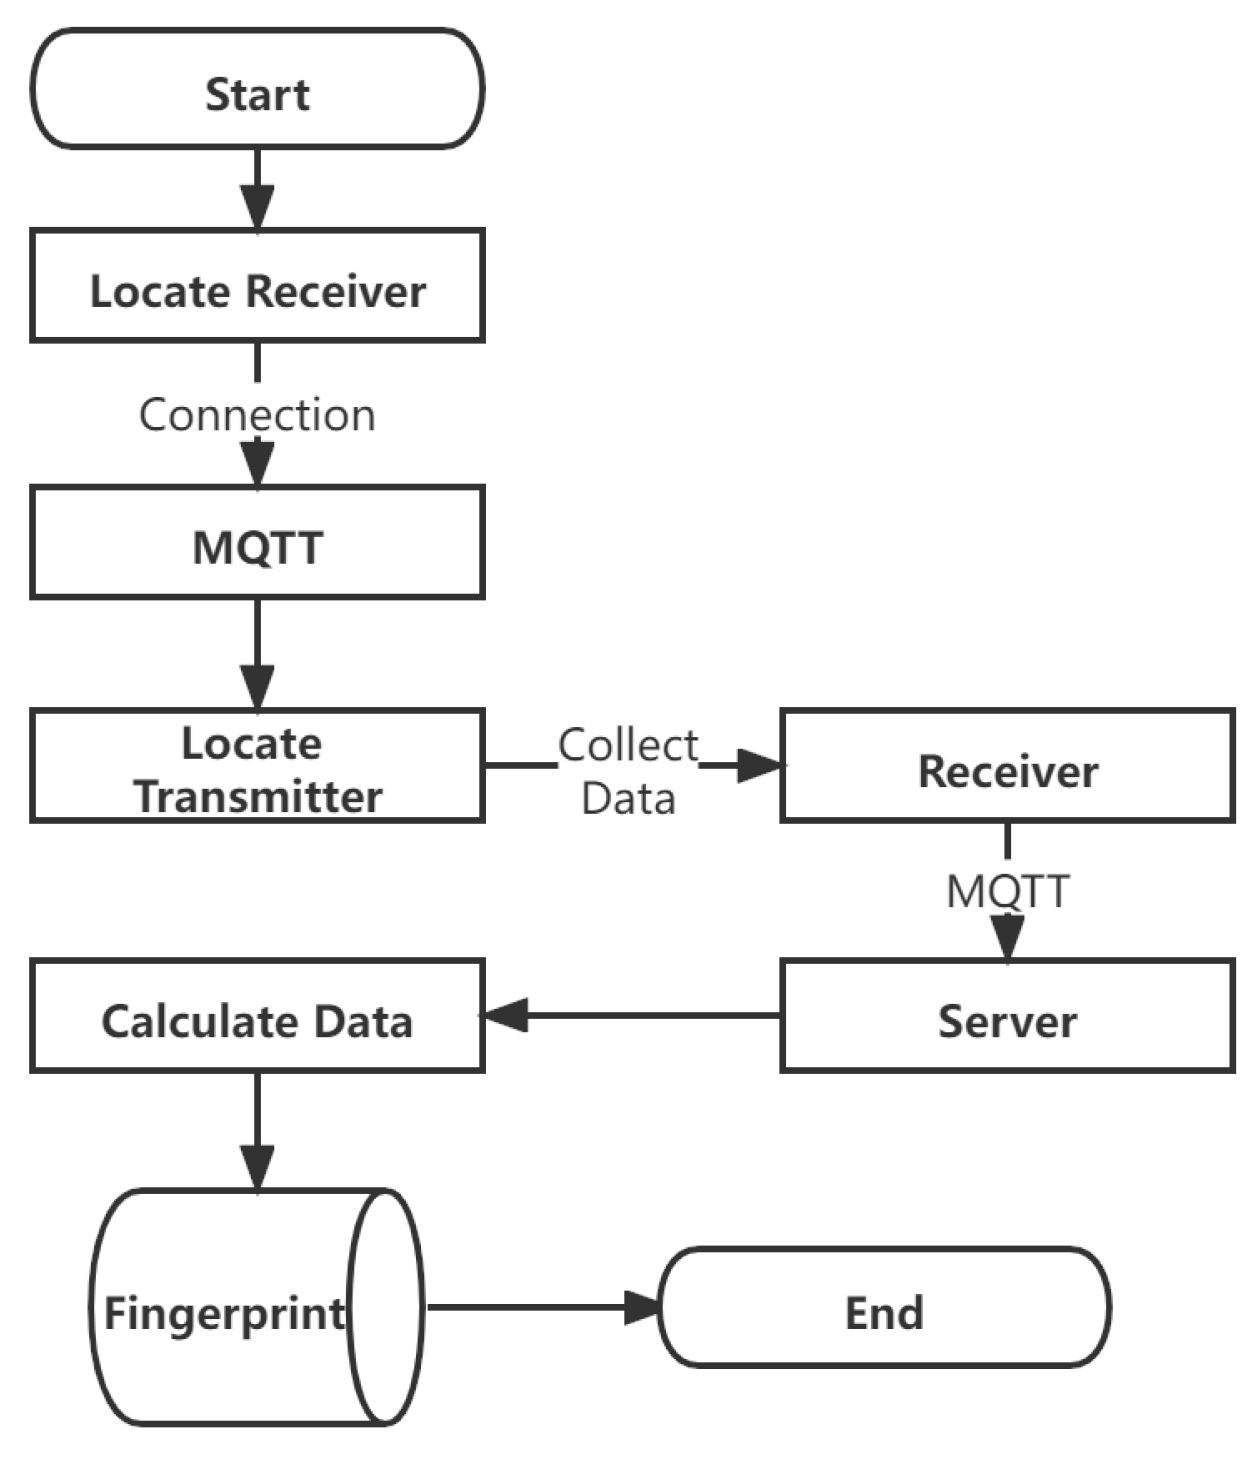
3.1. System Overview
3.2. IEEE 802.15.4 Devices
3.3. Calibration Phase
- (1)
- Properly locate the Raspberry Pi devices with the receivers in the target field.
- (2)
- Run the programs and create the connection to the MQTT broker.
- (3)
- Locate the transmitter at the specified location in the field. In our experiments, we selected 18 locations where we moved the transmitter from one place to another after measuring LQI for one minute by transmitting packets every 500 ms.
- (4)
- Receive and collect the packets from the transmitter at the Raspberry Pi device for one minute.
- (5)
- Forward the collected data from the Raspberry Pi device to the server through the MQTT broker.
- (6)
- For each receiver, calculate the average LQI using the forwarded data from it after the last average LQI calculation.
- (7)
- Make the fingerprint at the server, and store them in the SQLite database.
3.4. Detection Phase
- represents the Euclidean distance between the i-th measured average LQI and the fingerprint for room k;
- does the i-th measured average LQI at receiver j; and
- does a fingerprint for room k at receiver j.
3.5. Signal Fluctuation Problem
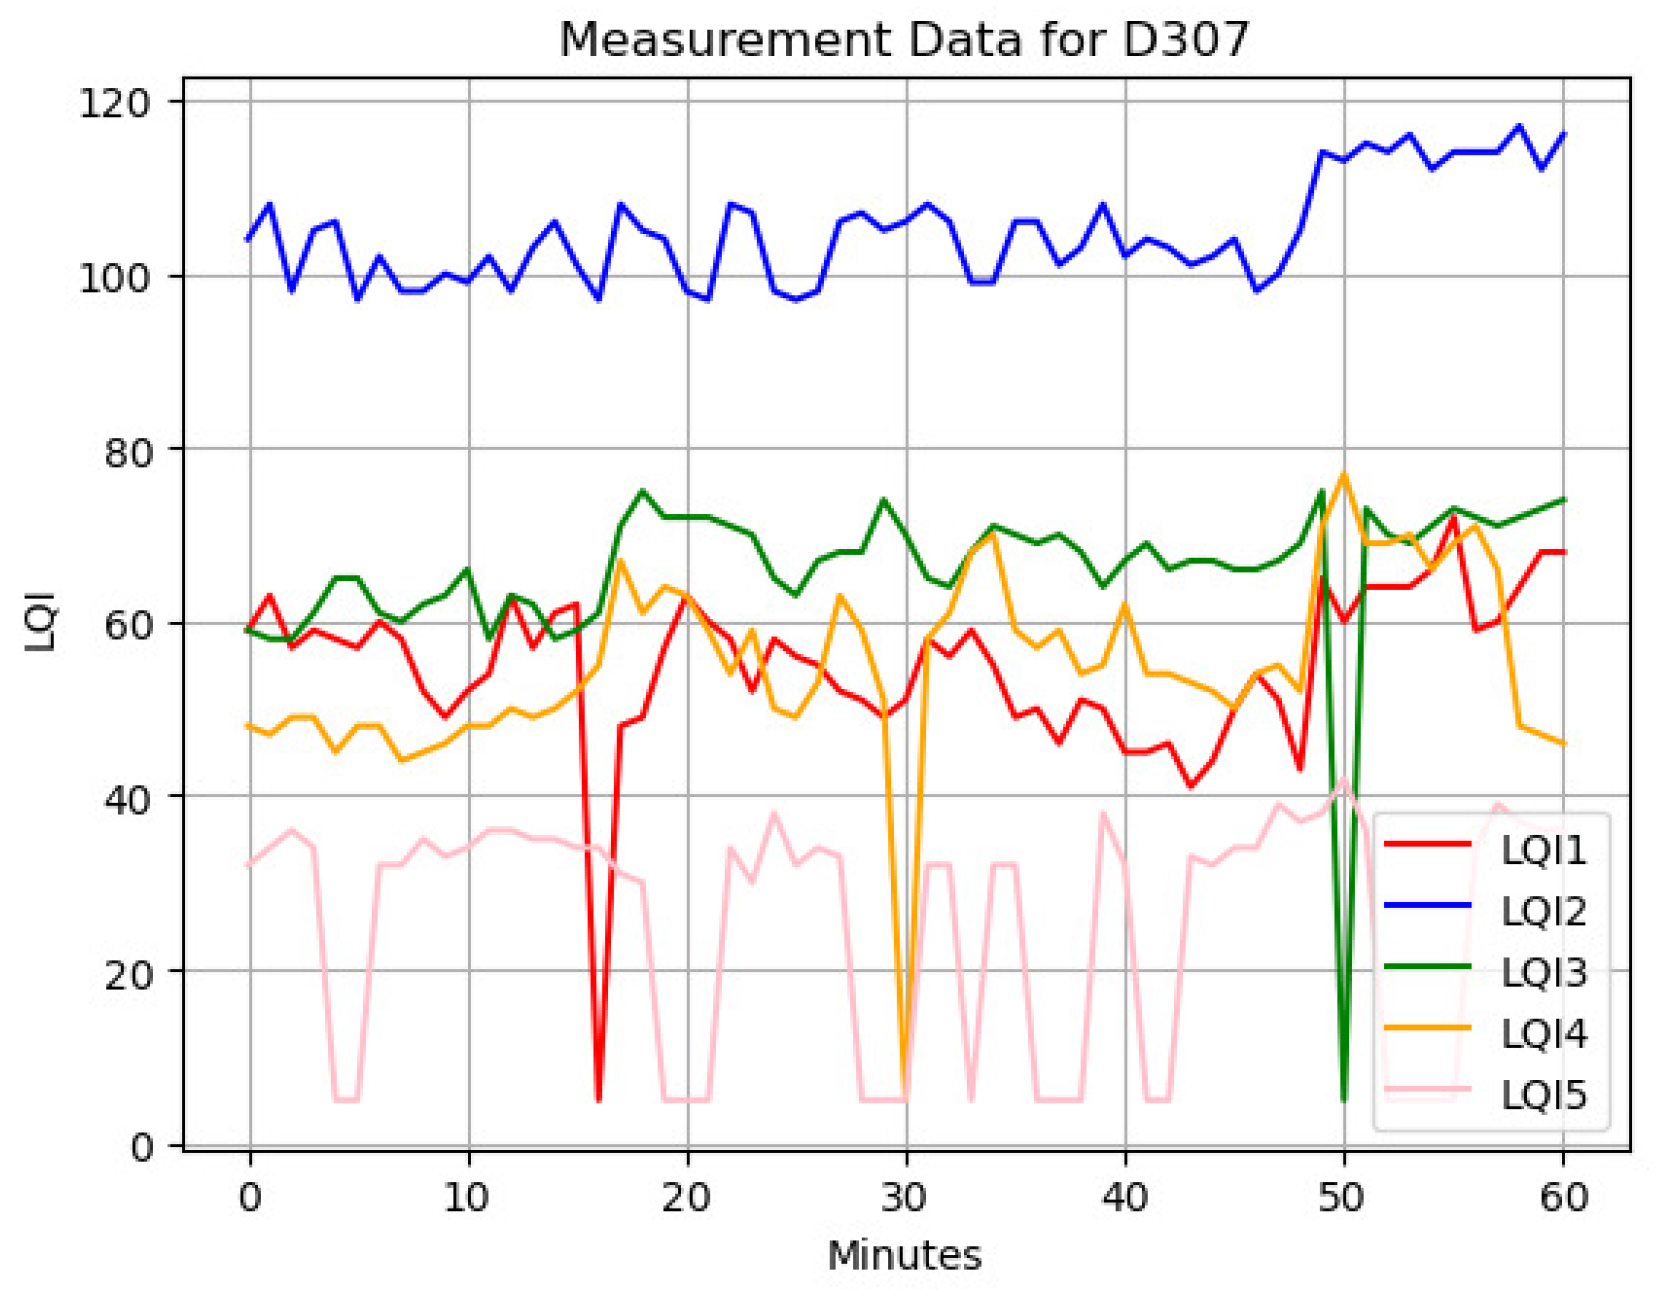
3.6. LQI Observations
- At LQ2, which comes from the nearest receiver from the transmitter, no connection loss appeared, and two different LQI levels can be observed.
- At LQ1, LQ3, and LQ4, one connection loss appeared, and two-three different LQI levels can be observed.
- At LQ5, connection loss often appeared, whereas the LQI level is almost constant.
4. Fingerprint Optimization Method for FILS15.4
4.1. Parameter Symbols
- P: the set of the n parameters for the algorithm/logic in the logic program whose values should be optimized. In this paper, each parameter represents one fingerprint value.
- : the value of the ith parameter (fingerprint) in P ().
- : the initial value of the ith parameter in P ().
- : the change step for .
- : the tabu period for in the tabu table.
- : the score of the algorithm/logic using P.
- : the best set of the parameters.
- : the score of the algorithm/logic where is used.
- L: the log of the generated parameter values and their scores.
- M: the number of rooms in the field.
- R: the number of receivers.
- :the j-th fingerprint vector for the k-th room ().
- : the number of trials for fingerprint number optimization for the k-th room ().
- : the maximum number of trials for fingerprint number optimization.
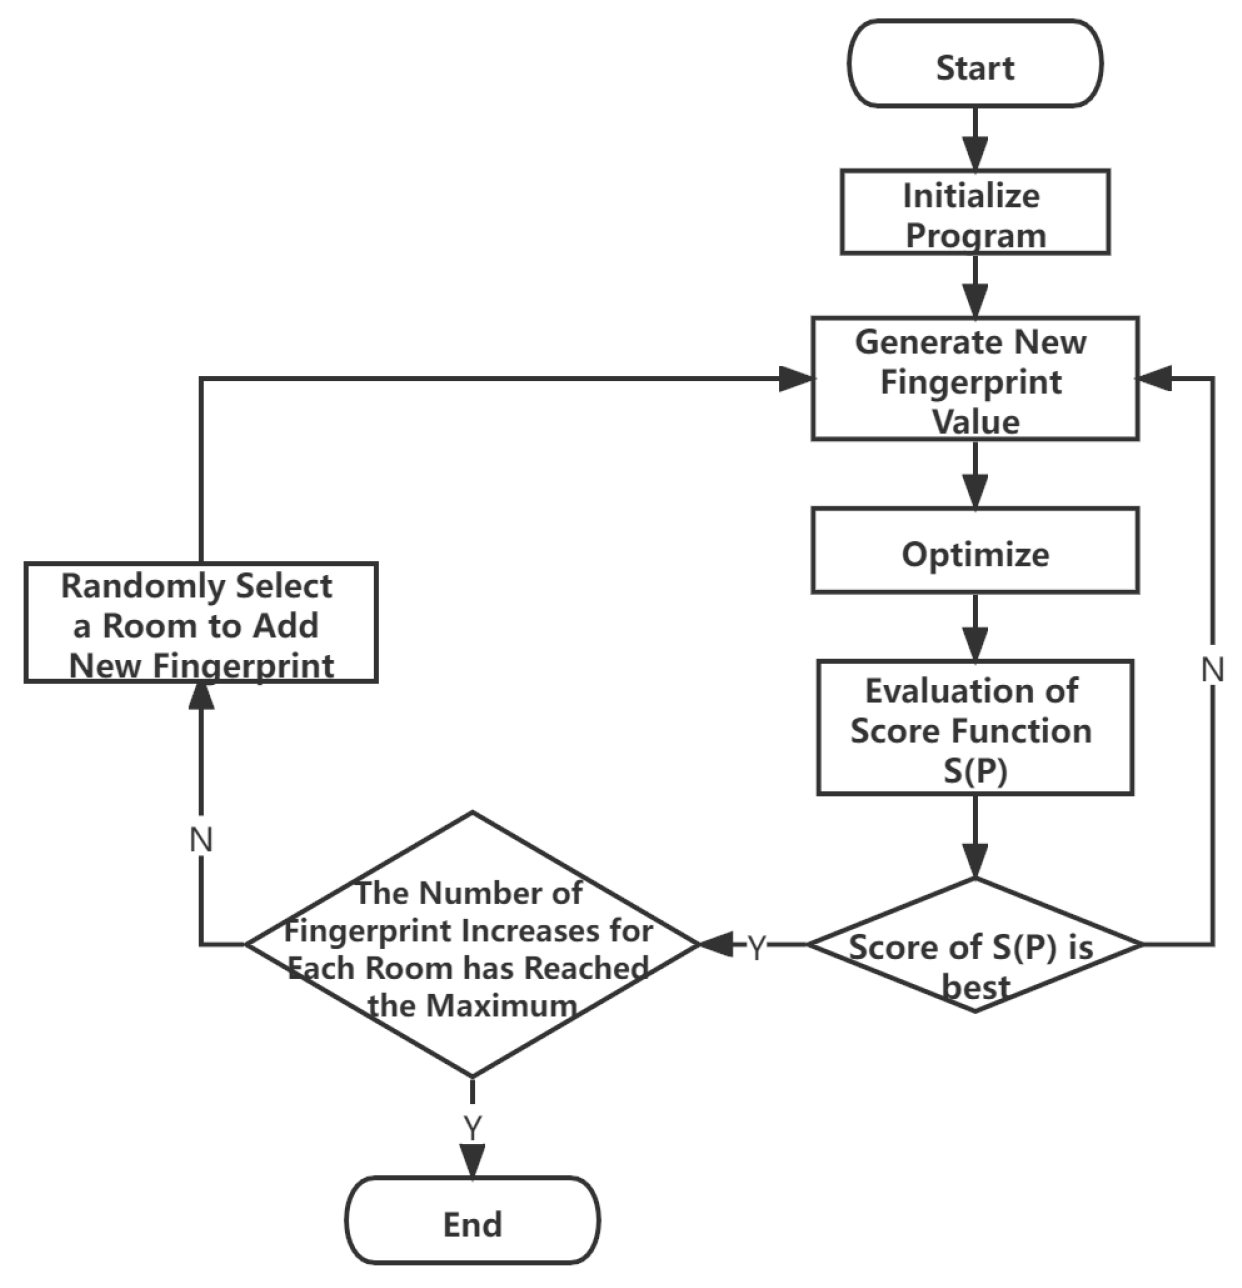
4.2. Algorithm Procedure
- (1)
- Clear the generated parameter log L.
- (2)
- Initialize the number of fingerprint increase trials for the k-th room by: = 0 ().
- (3)
- Set the initial value in the parameter file for any in P, set 0 for any tabu period , and set a large value for .
- (4)
- Generate the neighborhood parameter value sets for P by:
- (a)
- Randomly selecting one parameter for .
- (b)
- Calculate the parameter values of and by:
- (c)
- Generate the neighborhood parameter value sets and by replacing by or :
- (5)
- When P (, ) exists in L, obtain (, ) from L. Otherwise, execute the logic program using P (, ) to obtain (, ), and write P and ( and , and ) into L.
- (6)
- Compare , , and , and select the parameter value set that has the largest one among them.
- (7)
- Update the tabu period by:
- (a)
- Decrement by if .
- (b)
- Set the given constant tabu period for if is the largest at (6) and is selected at (4)(a).
- (8)
- When is continuously largest at (6) for the given constant times, go to (9). Otherwise, go to (4).
- (9)
- When the hill-climbing procedure in (10) is applied for the given constant times , go to (11) as the state is converged. Otherwise, go to (10).
- (10)
- Apply the hill-climbing procedure:
- (a)
- If , update and by P and .
- (b)
- Reset P by .
- (c)
- Randomly select in P, and randomly change the value of within its range and go to (4).
- (11)
- Terminate the algorithm and output the current fingerprint parameter values if the number of fingerprint increase trials for every room become the maximum: = .
- (12)
- If the last fingerprint increase (the k-th room) cannot improve the score function , increment by 1, and rollback the previous fingerprint parameter values before this last fingerprint increase.
- (13)
- Save and keep the current fingerprint parameter values for the rollback procedure.
- (14)
- Randomly select one room (let the k-th room) that has < (which does not reach the maximum trials).
- (15)
- Generate a new fingerprint for the k-th room by increasing n to n+R and by copying the parameter value of a randomly selected fingerprint for the same k-th room. Here, each of the R parameter values for the new fingerprint is copied from the corresponding parameter value of the randomly selected fingerprint for the same room.
- (16)
- Set 0 for the tabu period of any fingerprint parameter, and set a large value for .
- (17)
- Go to (4).
4.3. Score Calculation Procedure
- (1)
- Calculate the Euclidean distance between the i-th average measured LQI and the k-th current fingerprint.
- (2)
- Find that represents the minimum Euclidean distance against a fingerprint representing the correct room.
- (3)
- Find that represents the minimum Euclidean distance against a fingerprint representing the incorrect room.
- (4)
- Calculate by:
5. Evaluation of Detection Accuracy
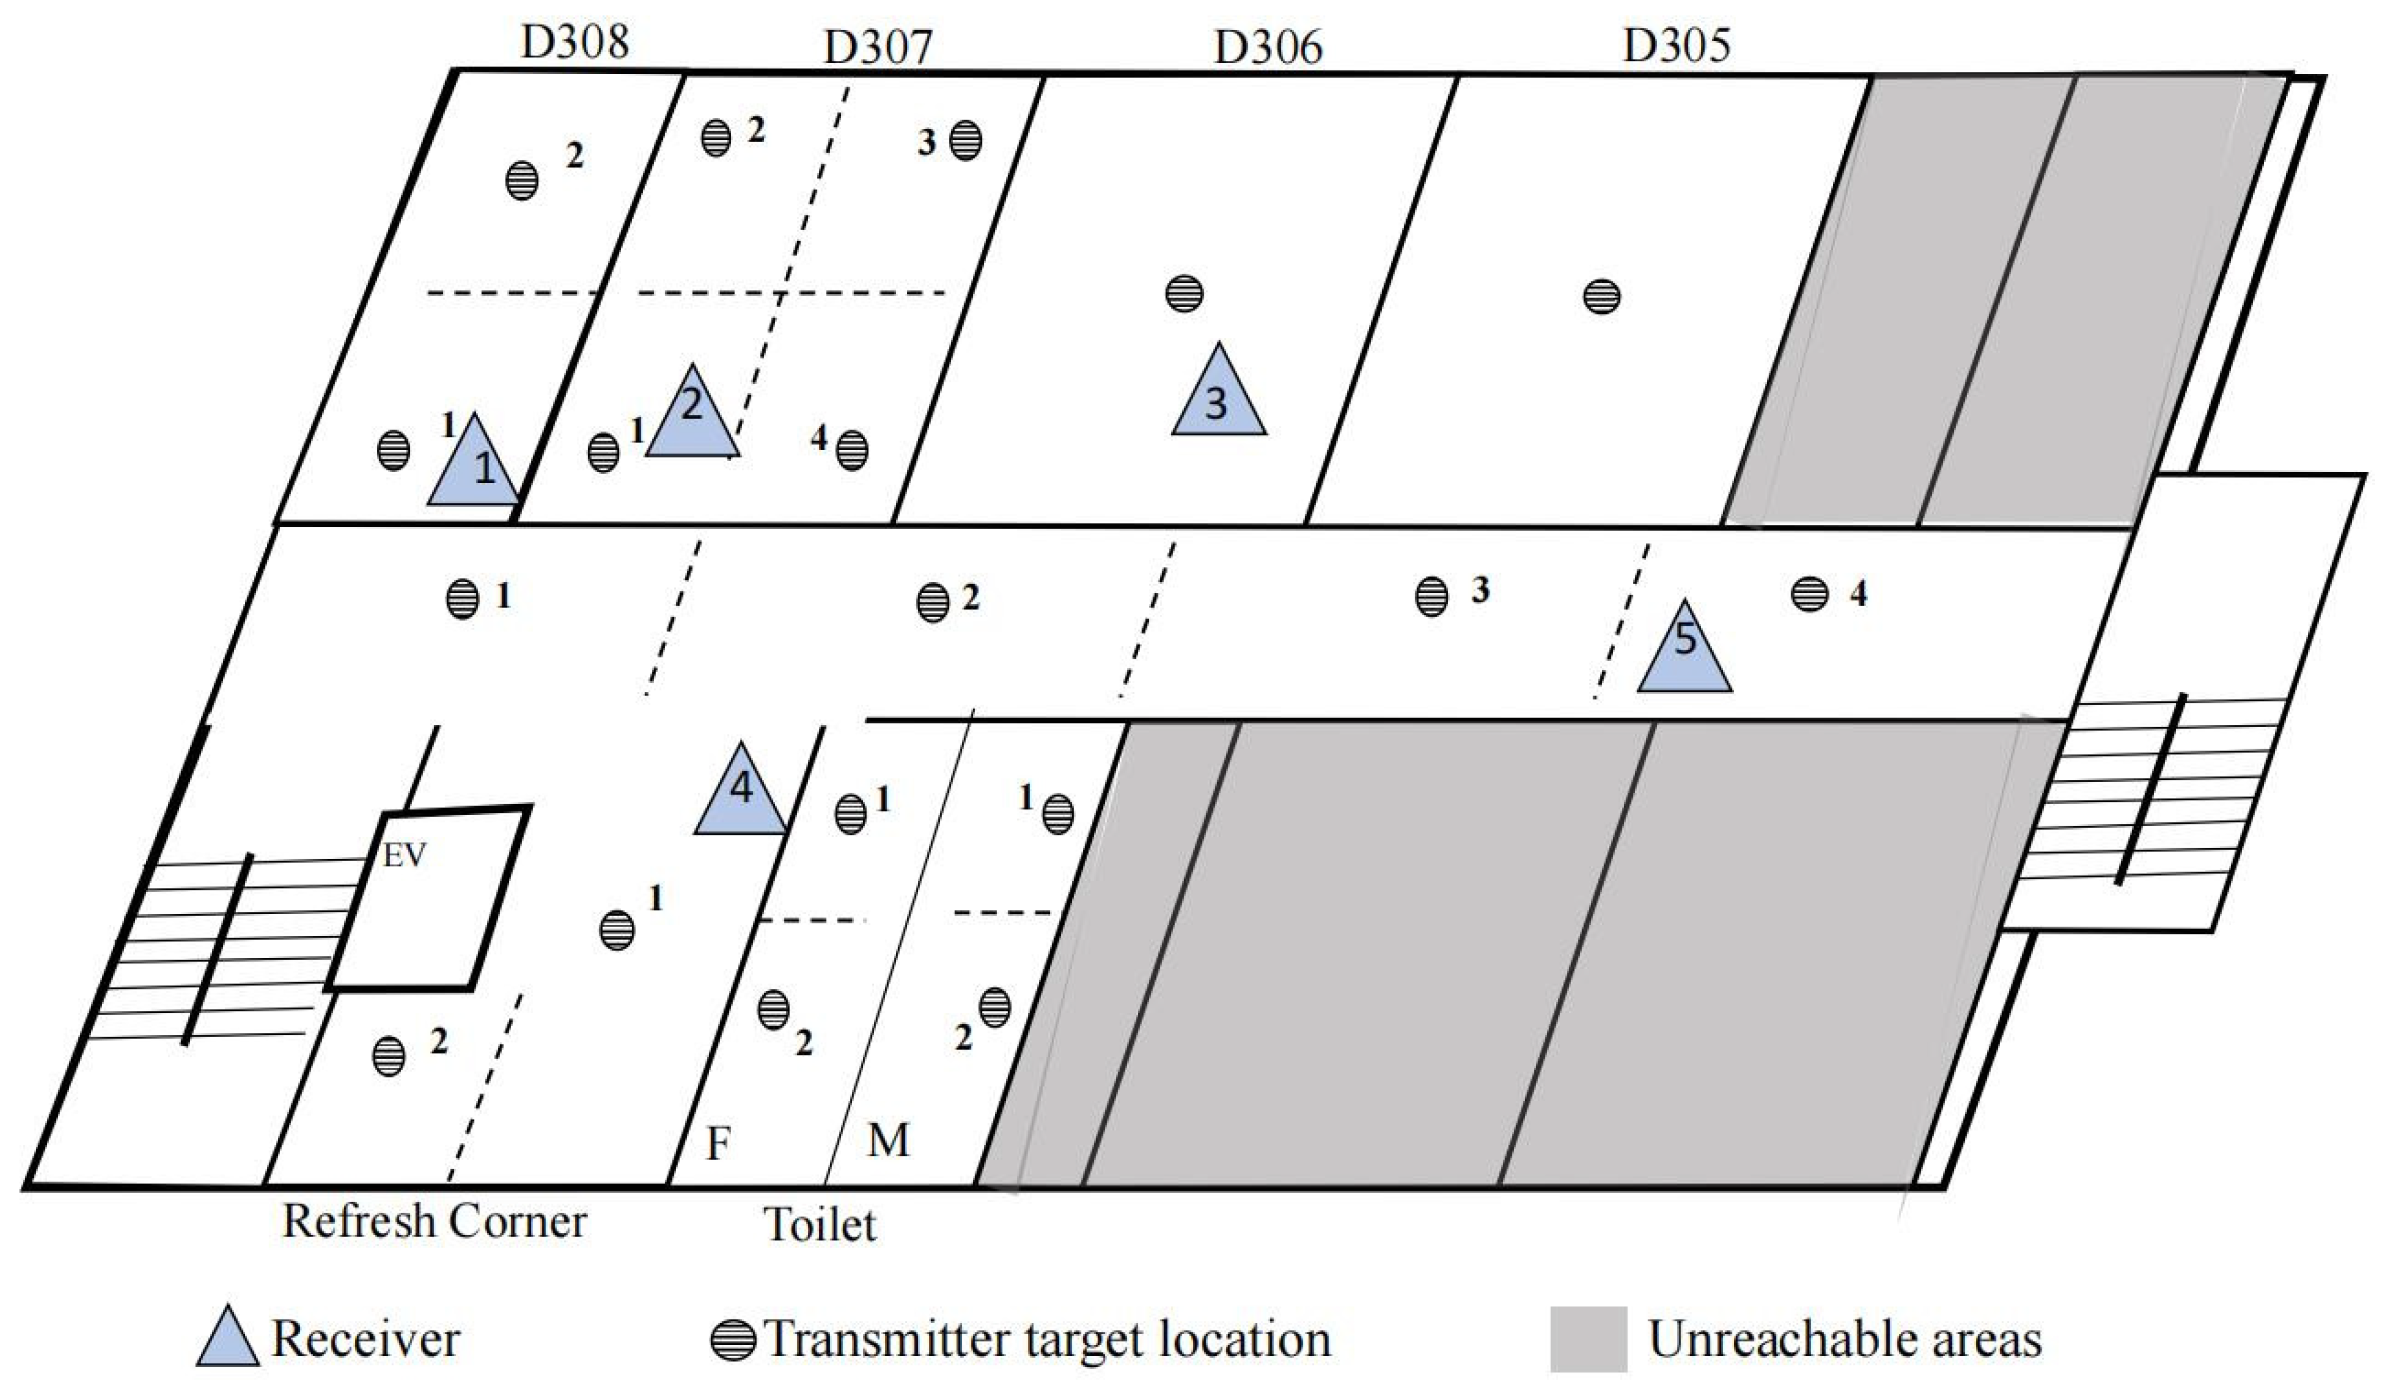
5.1. Field Layout
5.2. Detection Result before Proposal
5.2.1. Fingerprints
5.2.2. Detection Results
5.3. Detection Result after Proposal
5.3.1. Fingerprints
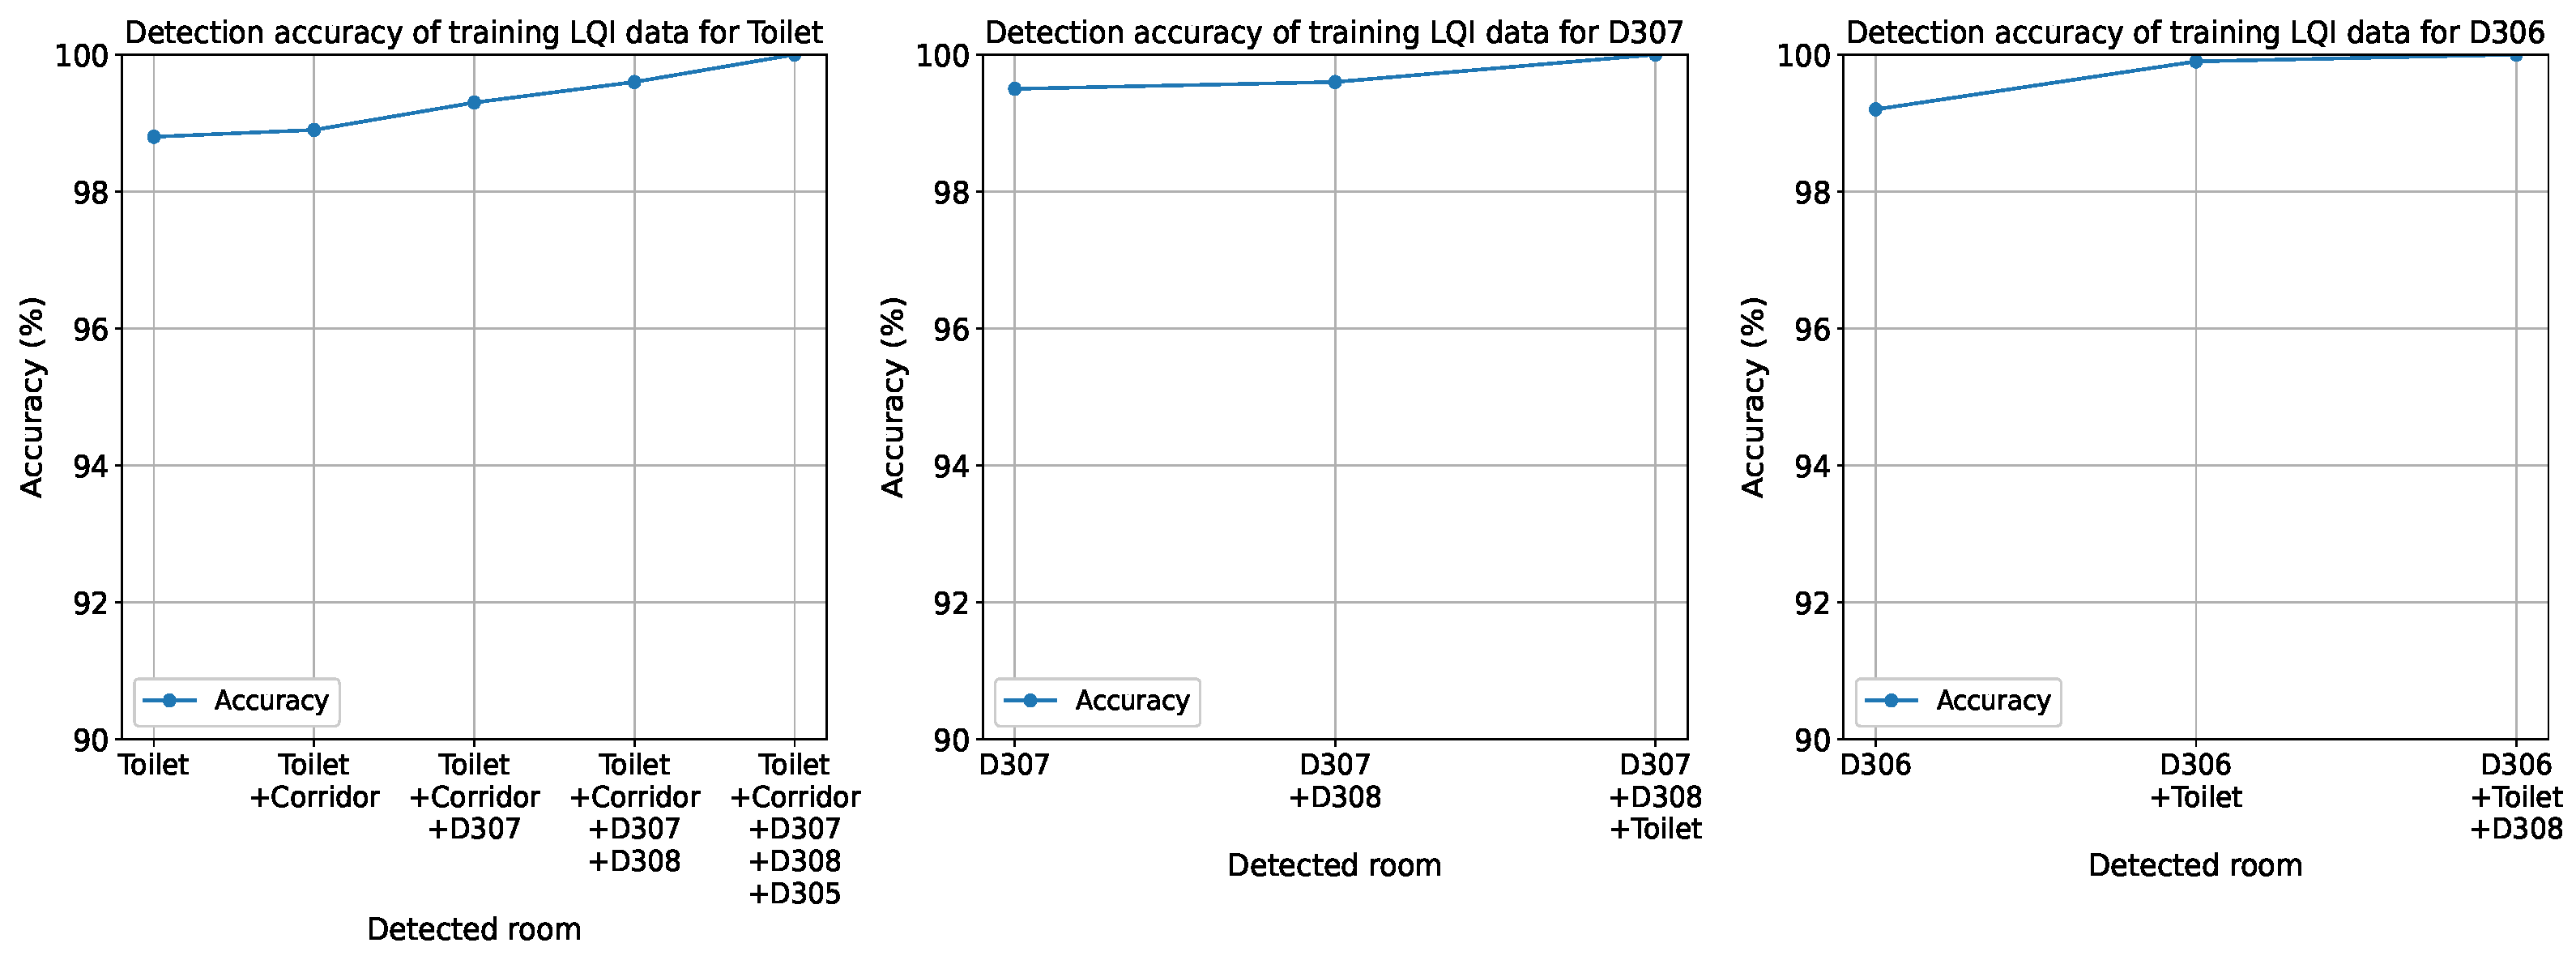
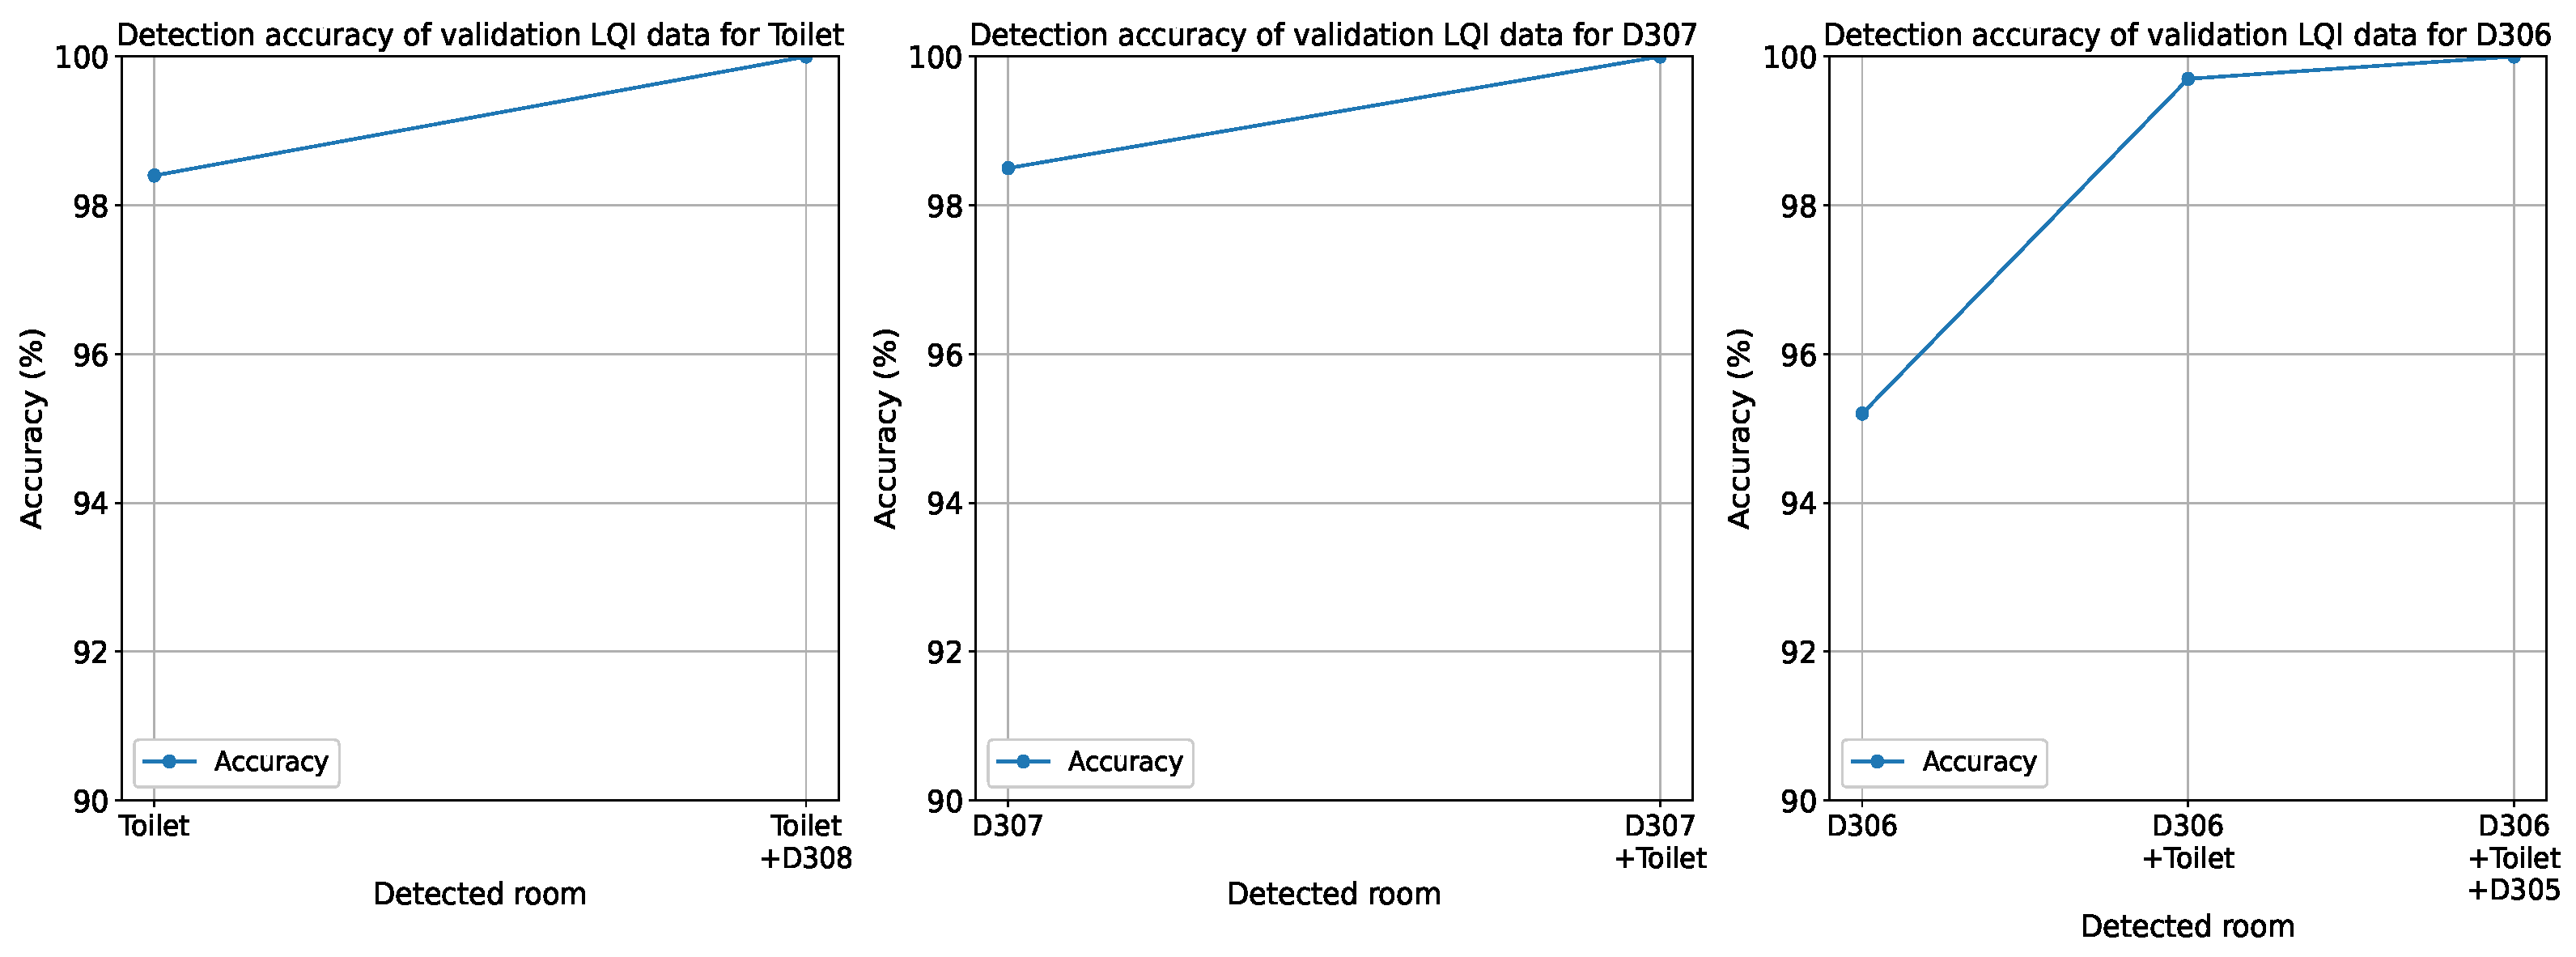
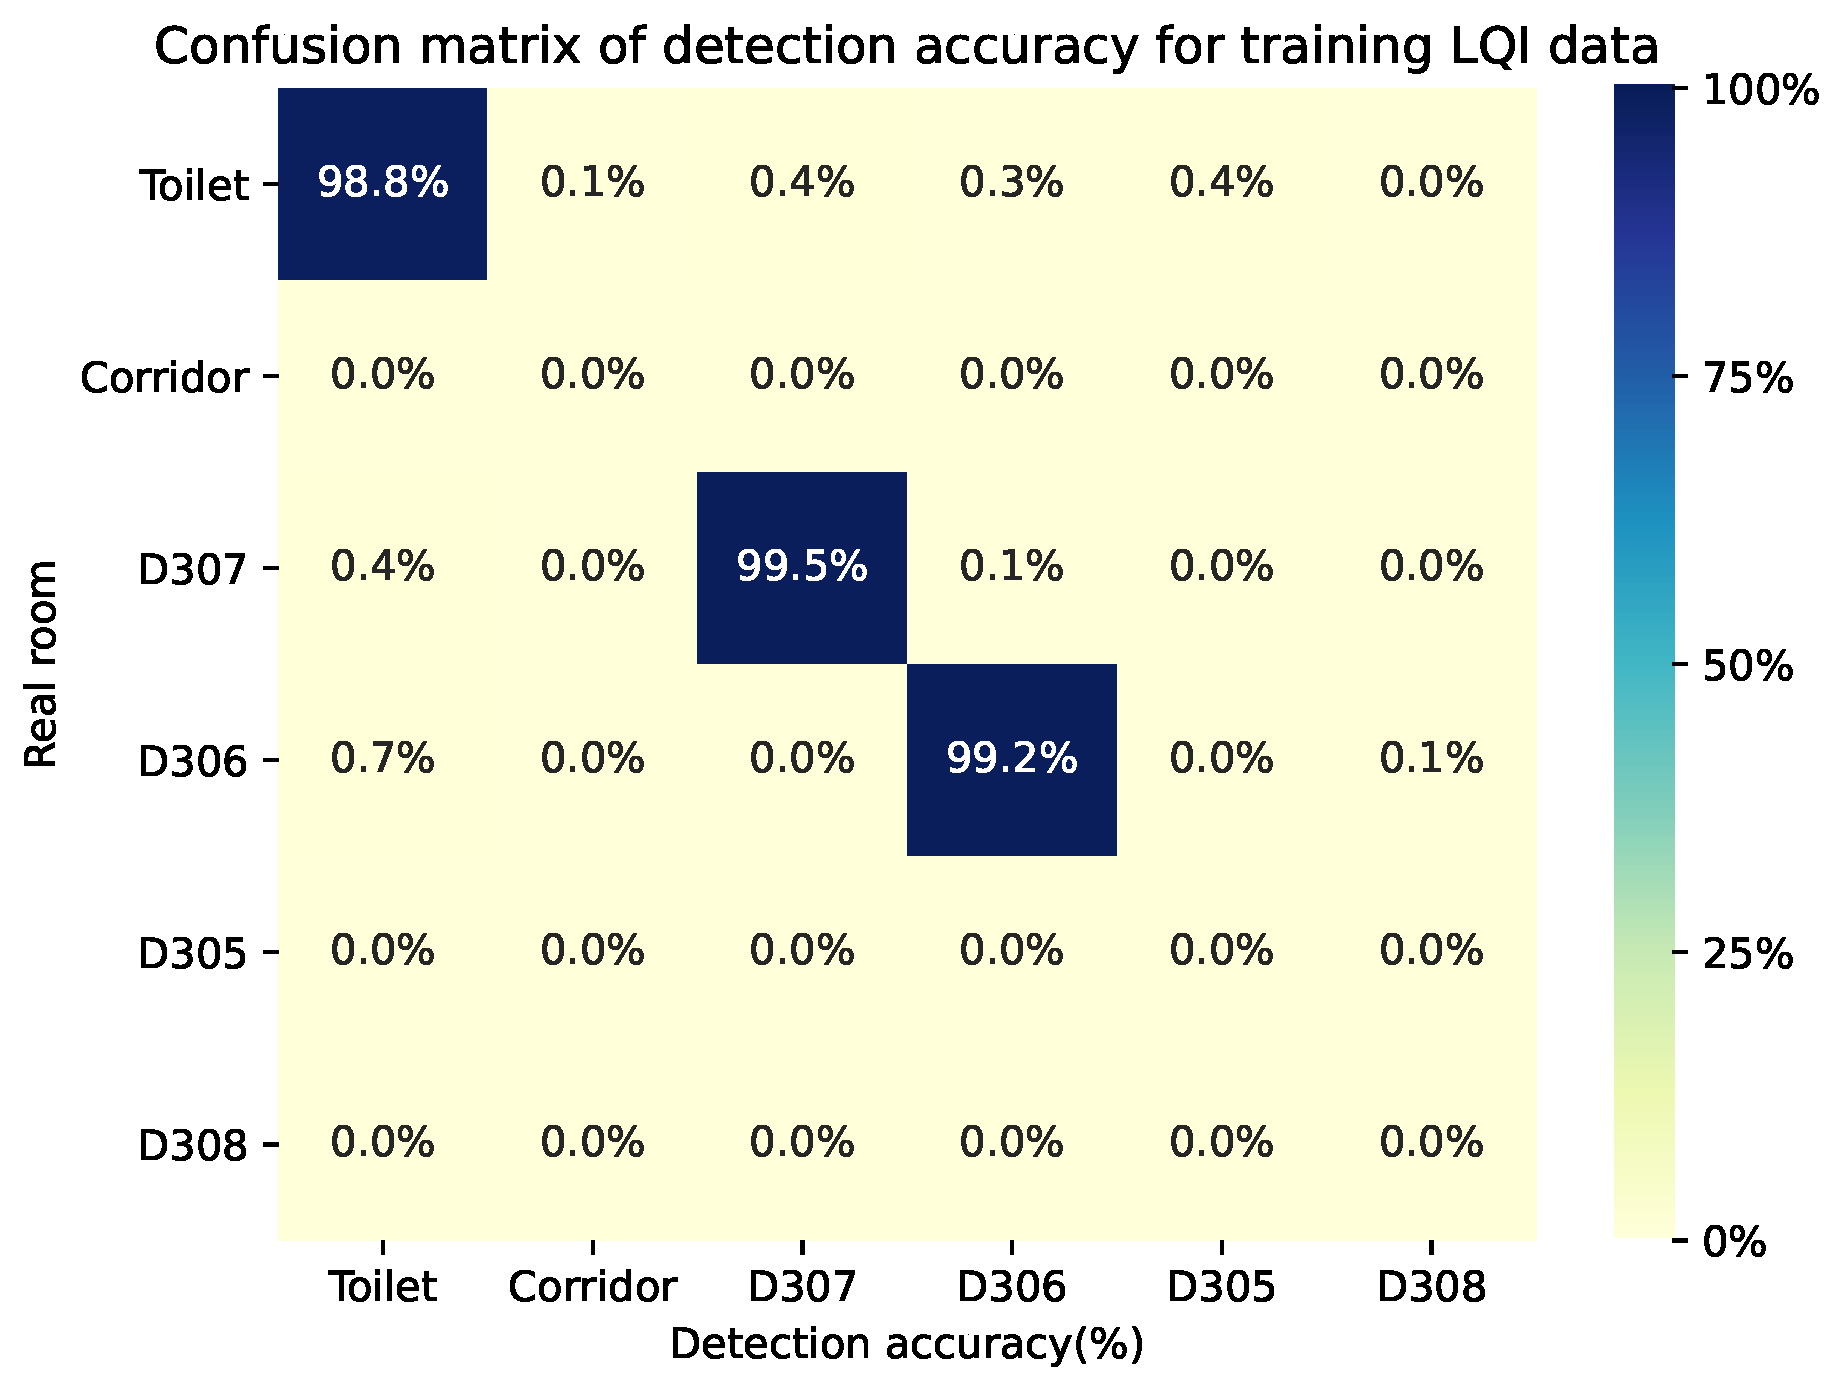
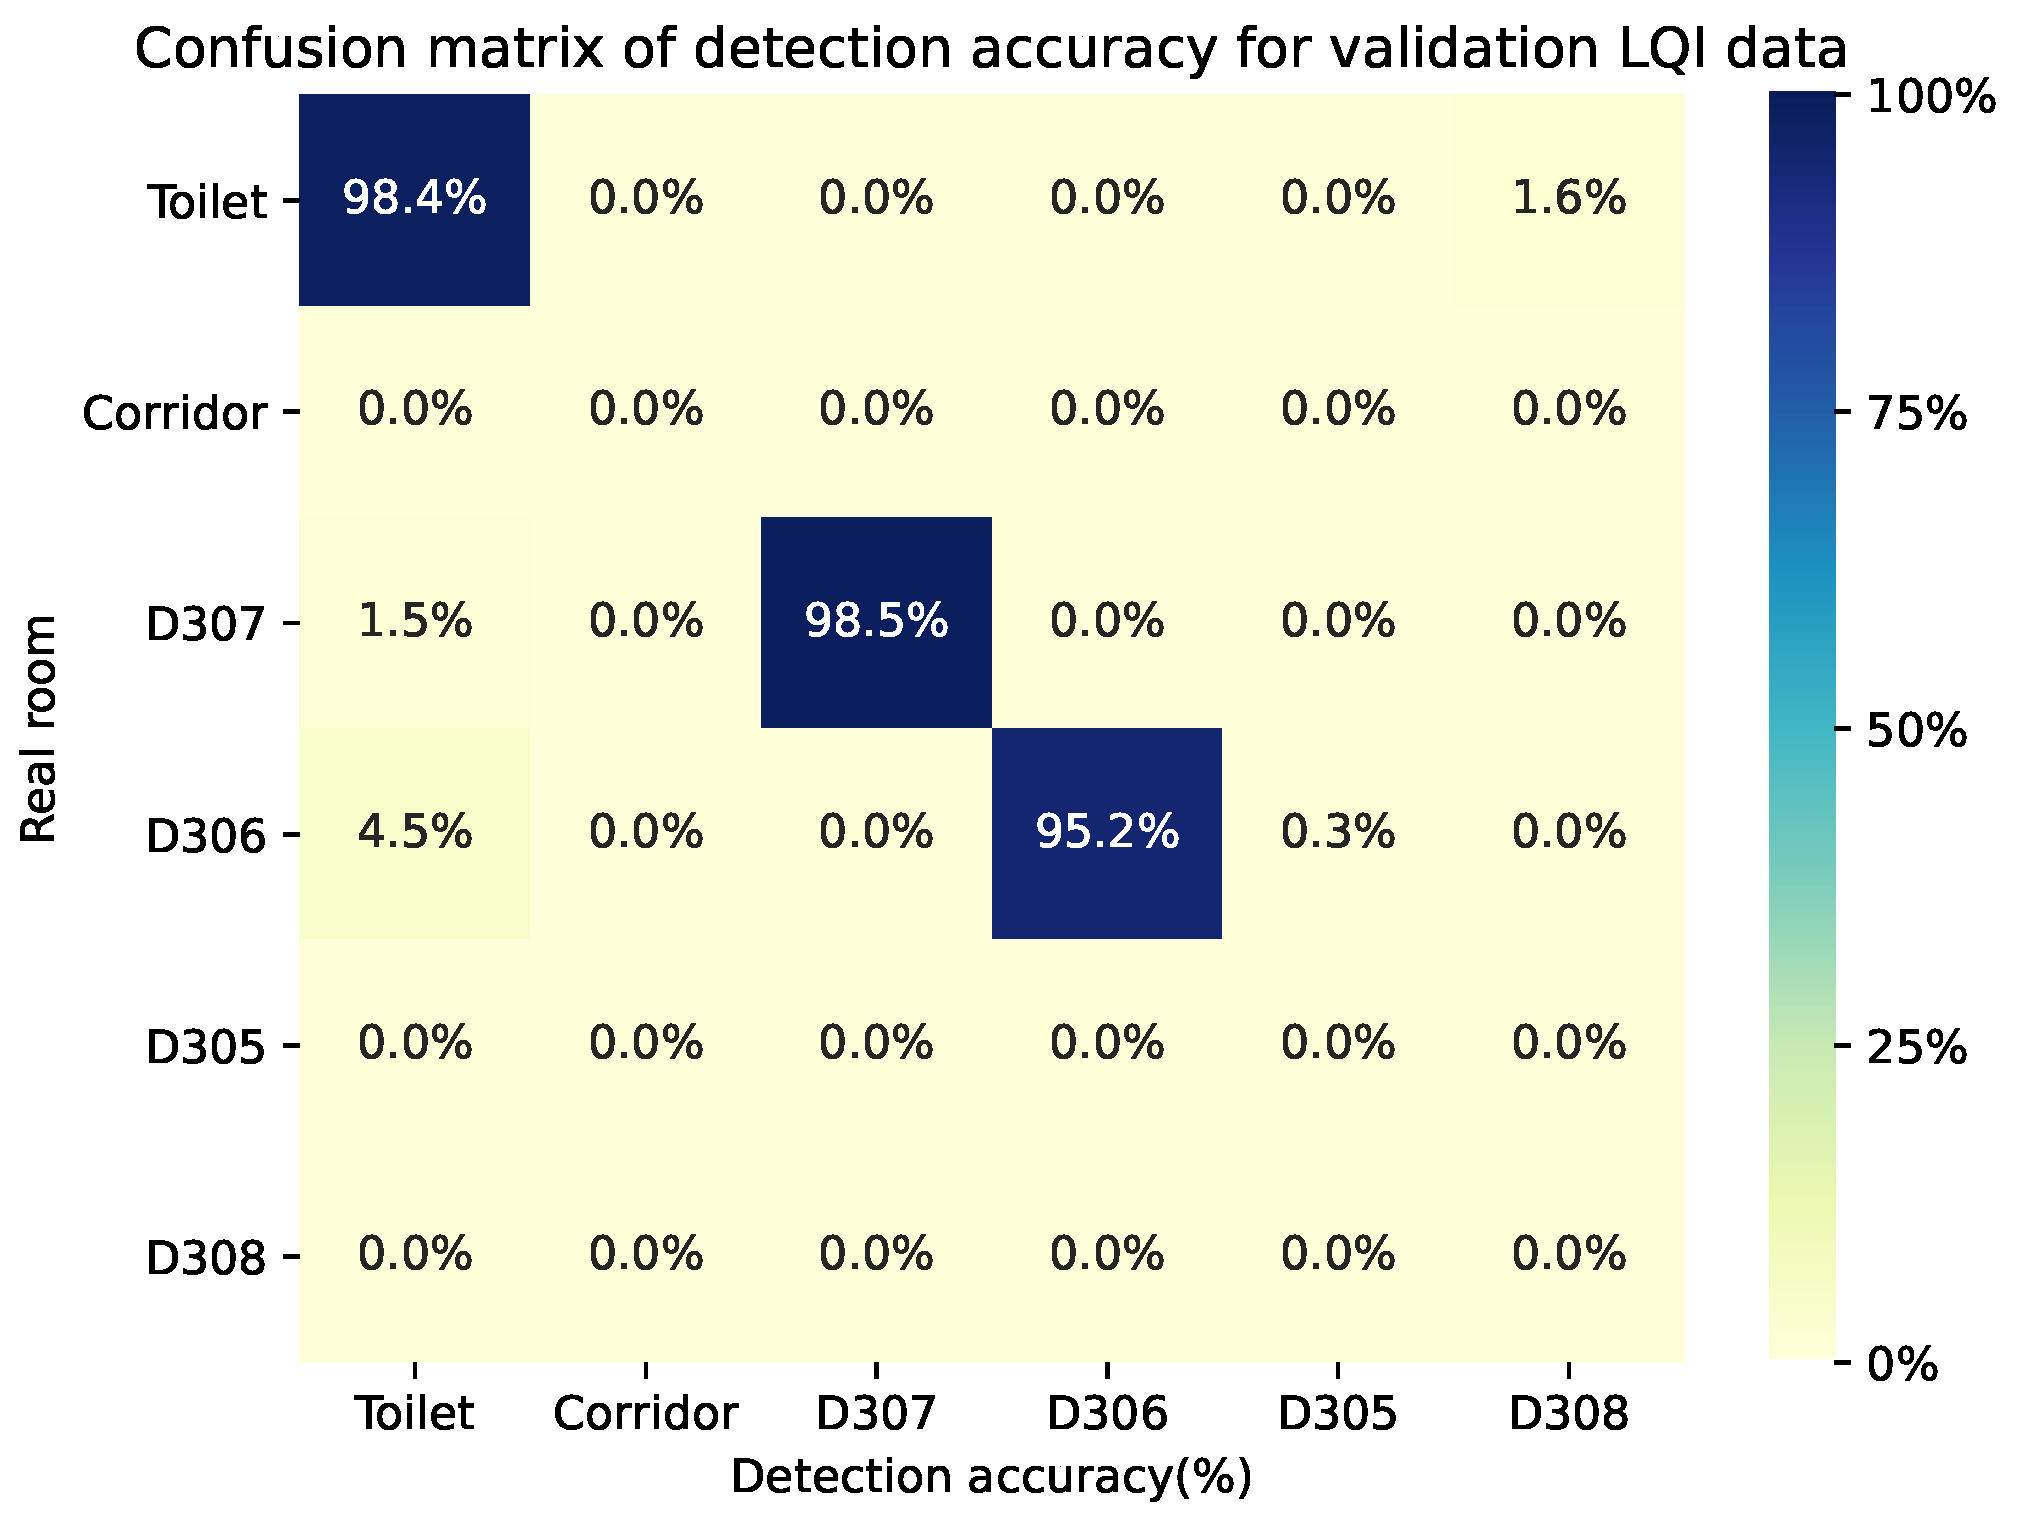
5.3.2. Detection Results
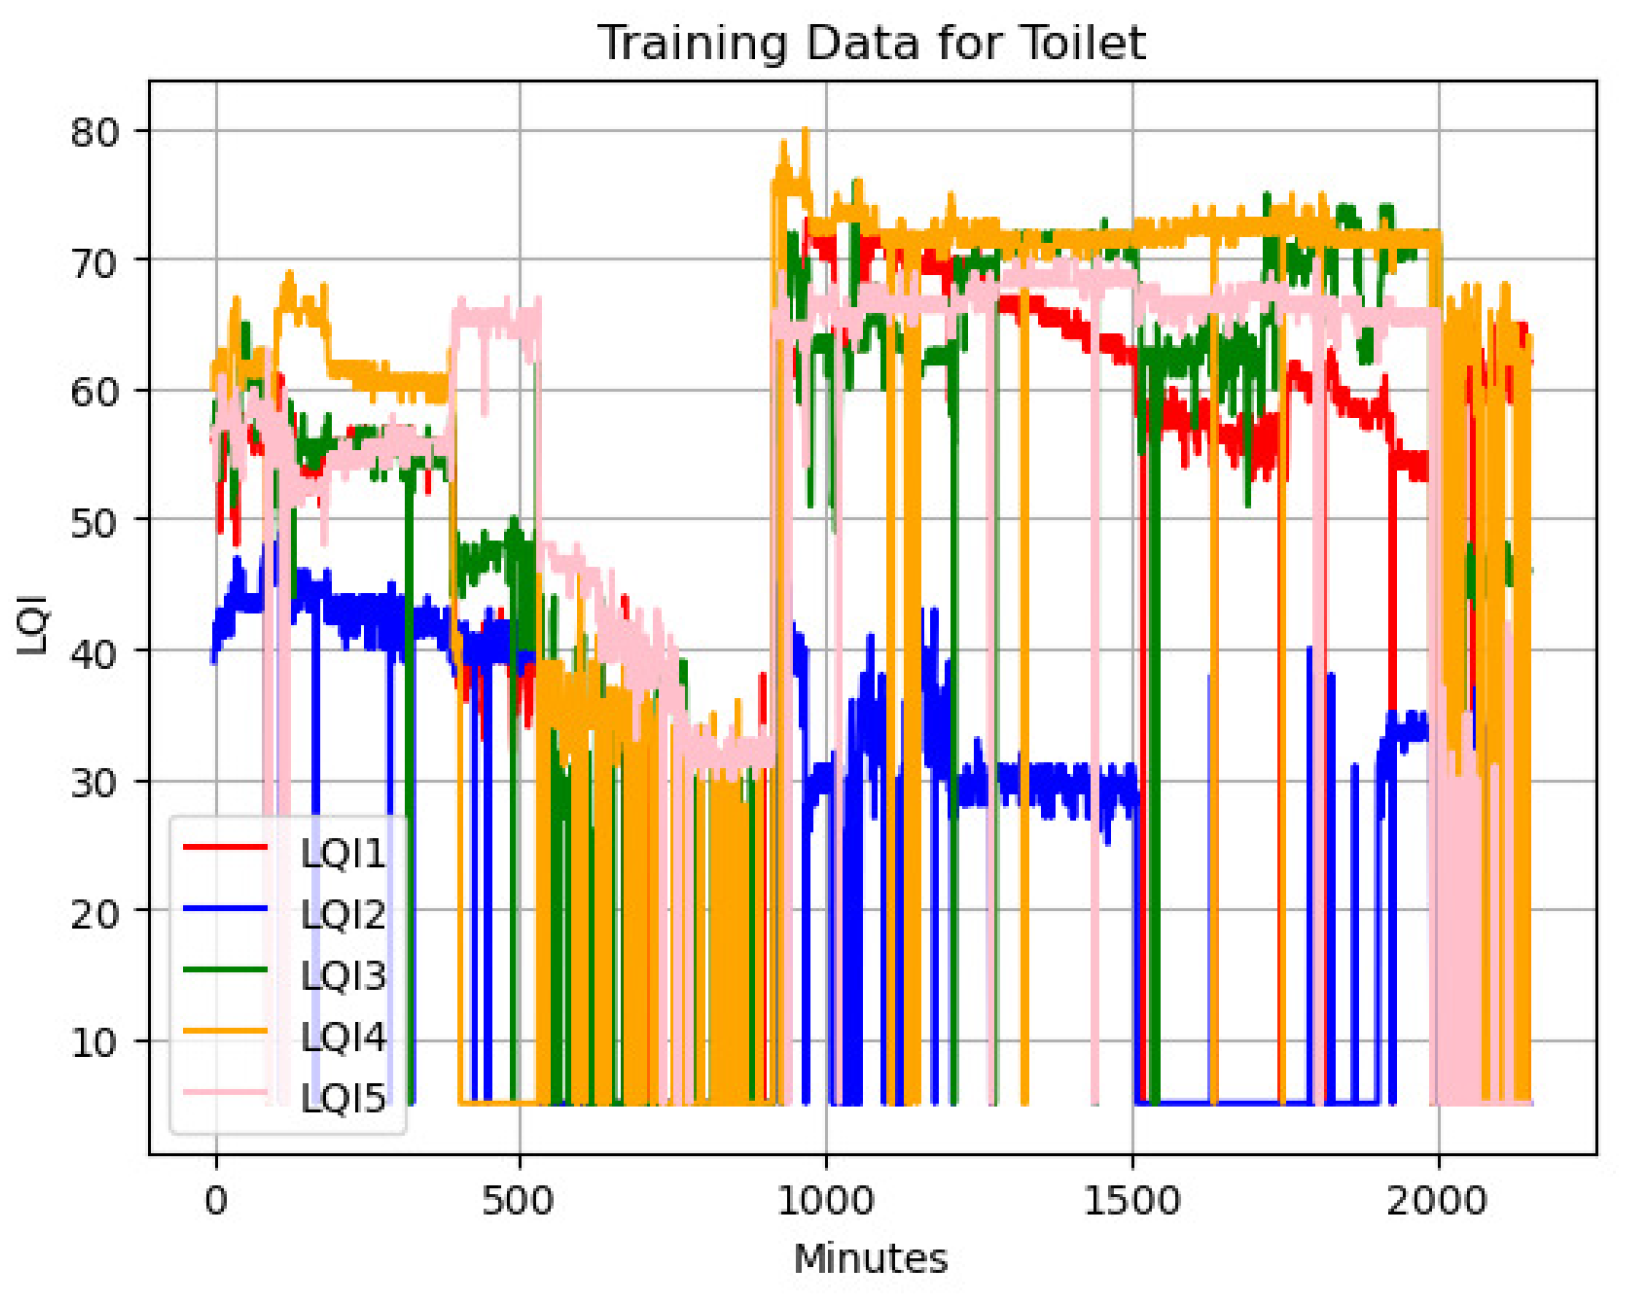
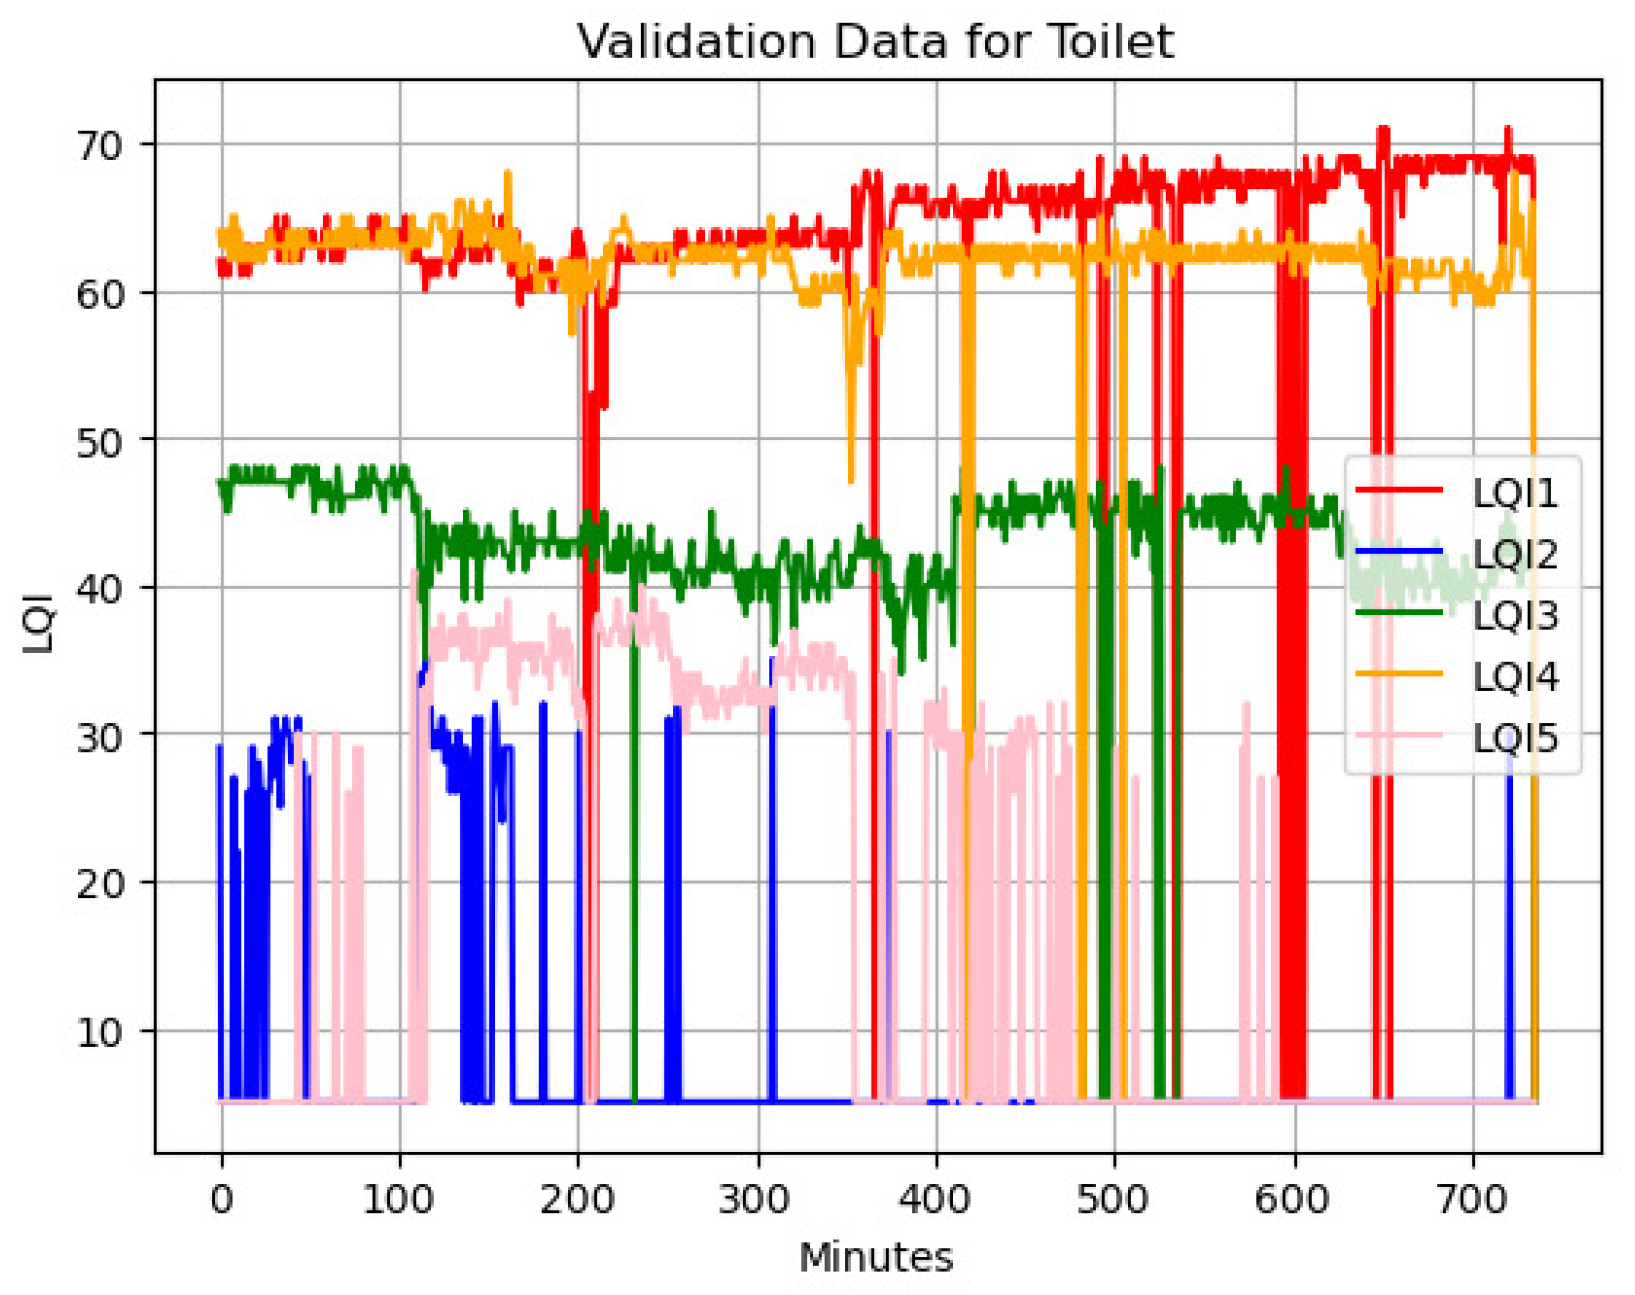
5.4. Measured LQI Data and Detection Result for Toilet
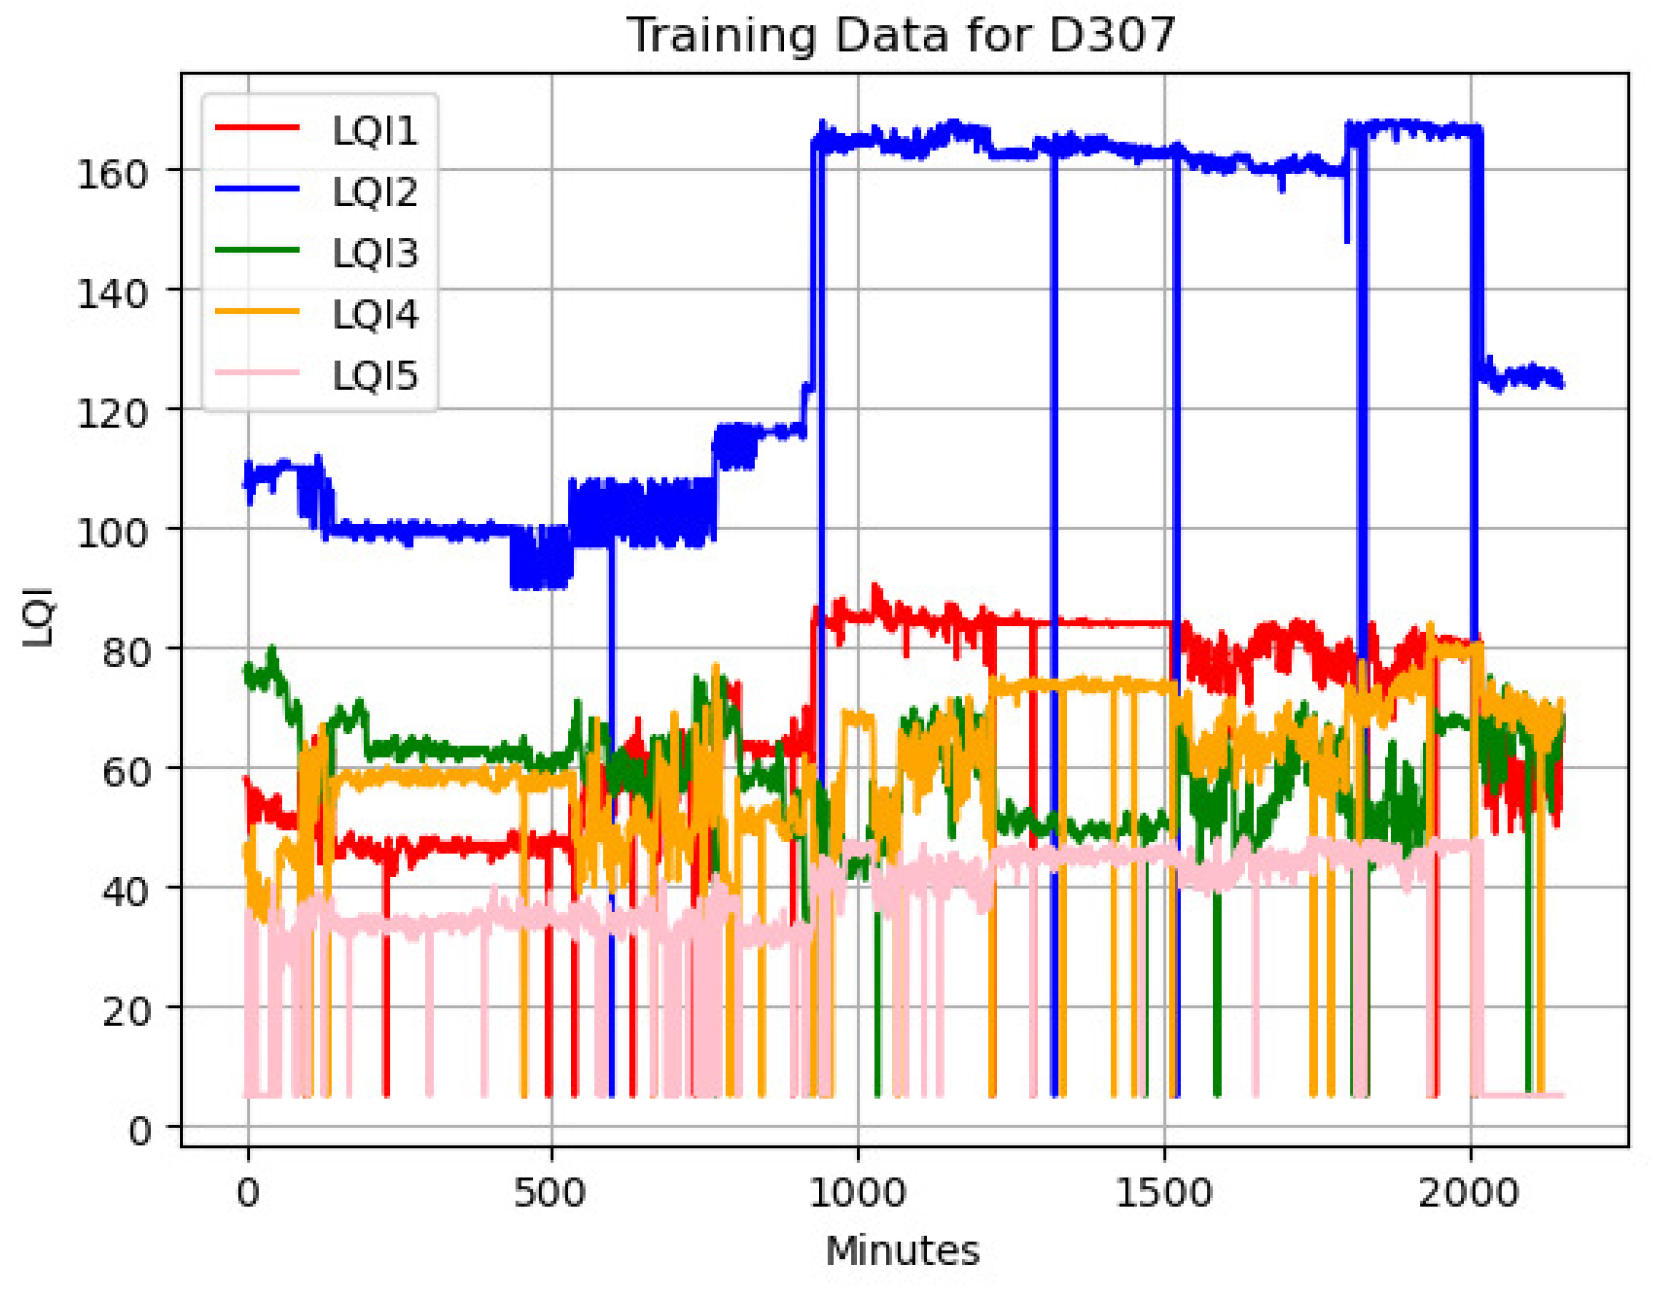
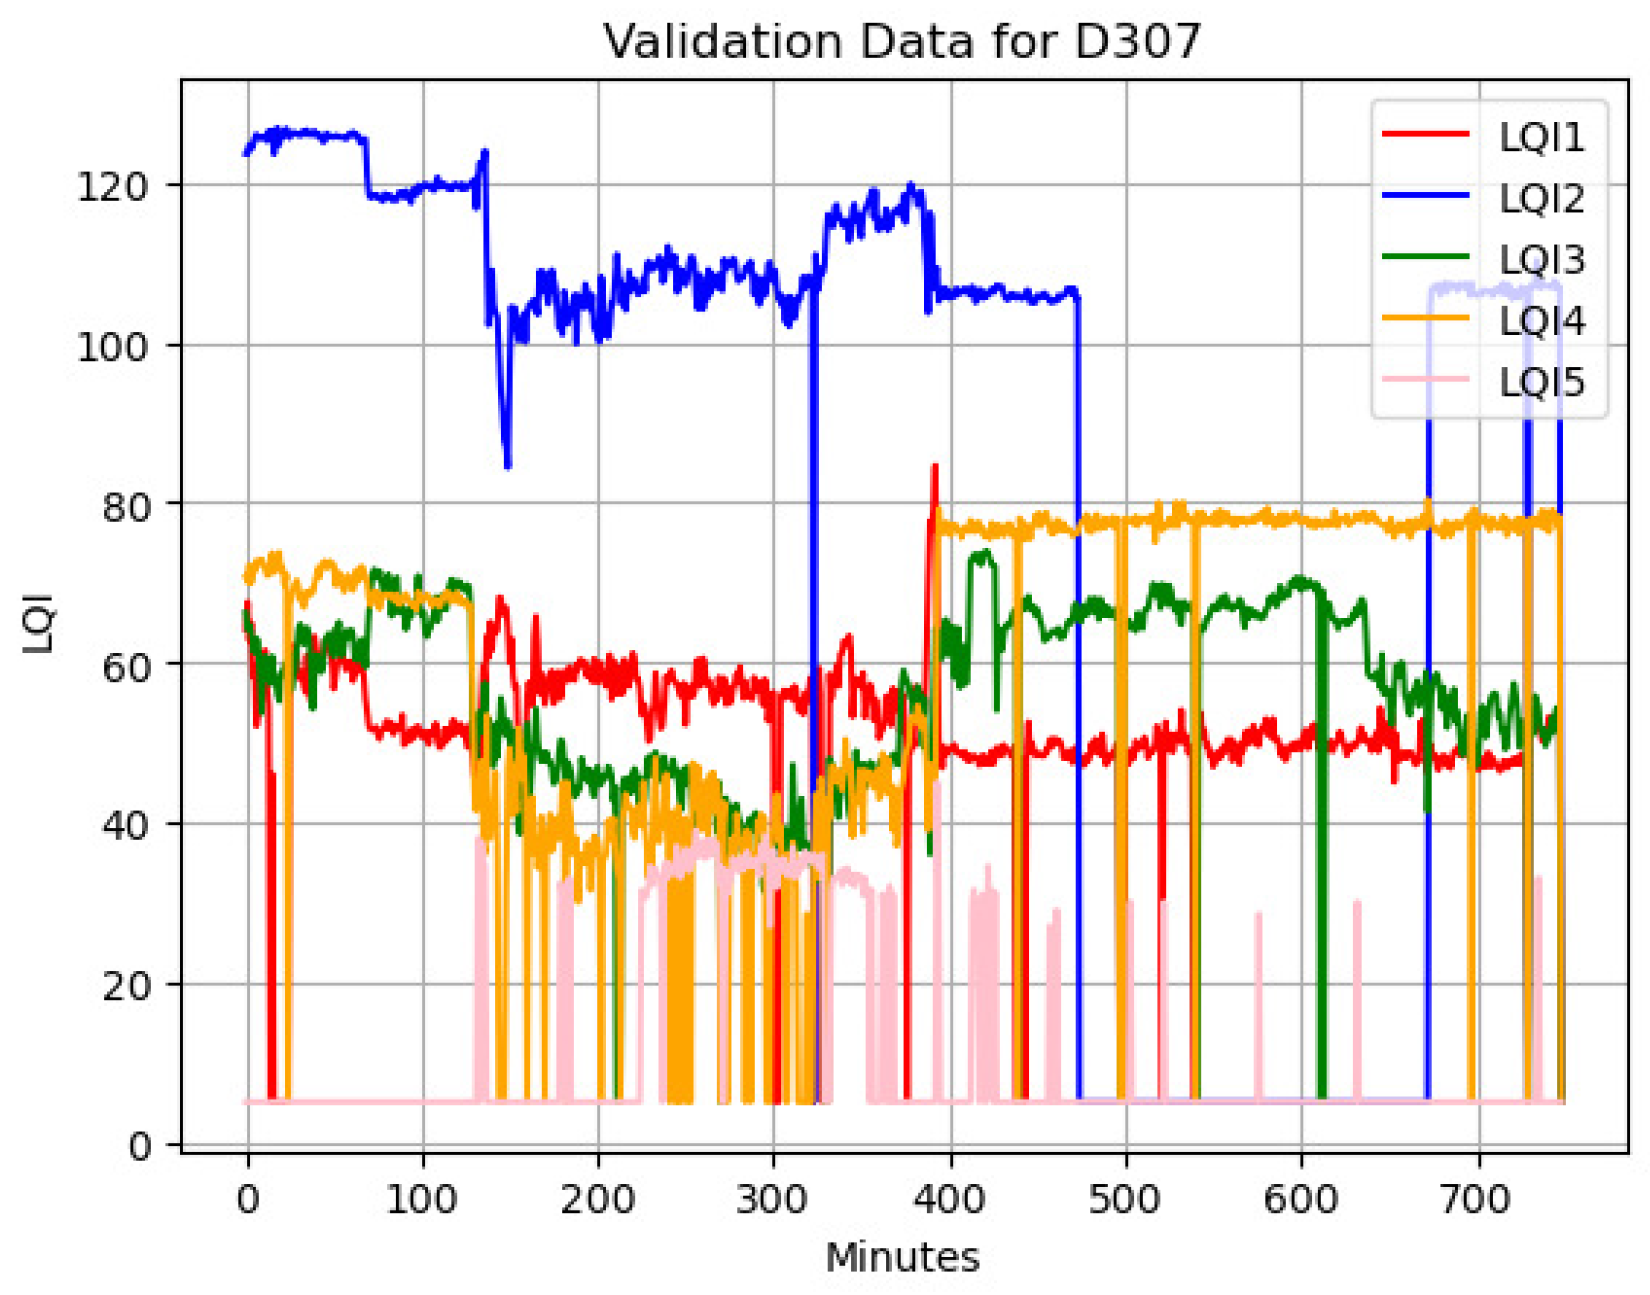
5.5. Measured LQI Data and Detection Result for D307
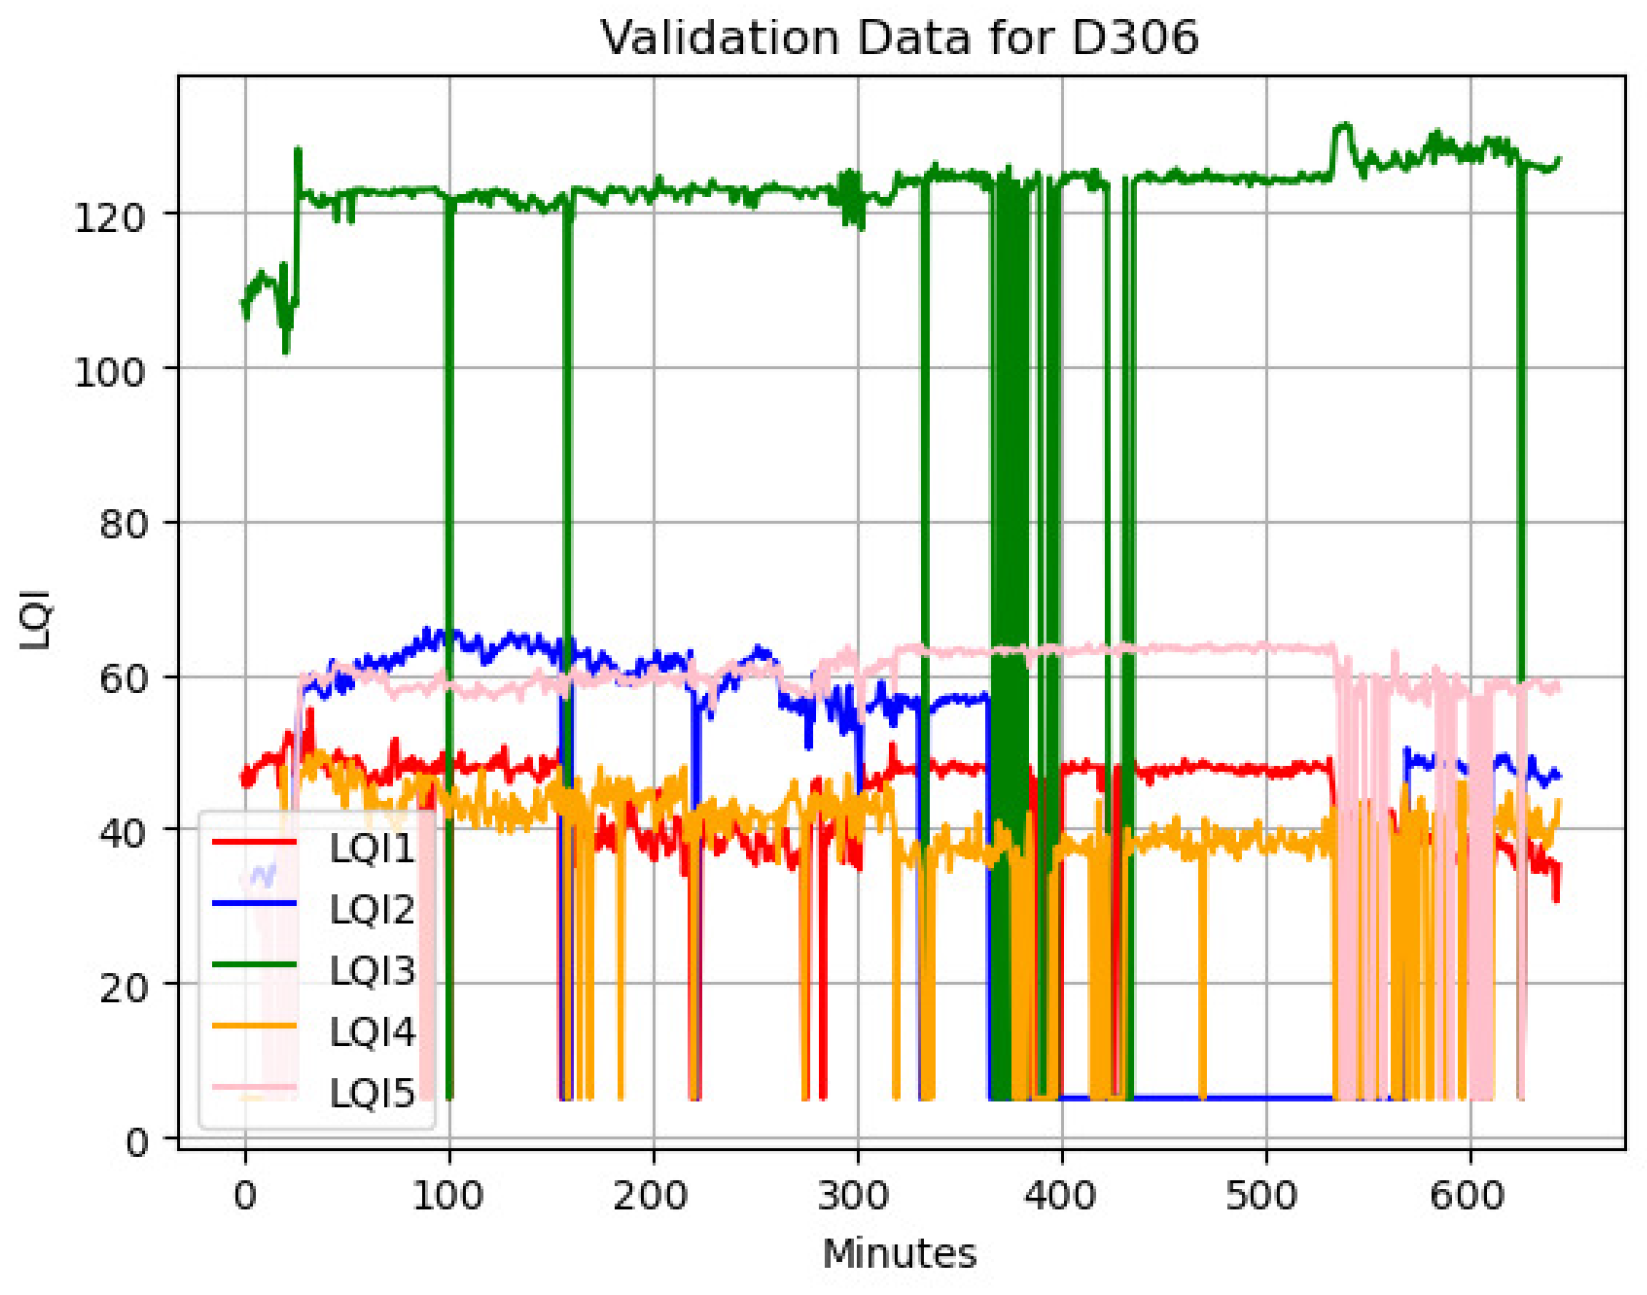
5.6. Measured LQI Data and Detection Result for D306
6. Evaluation over Time
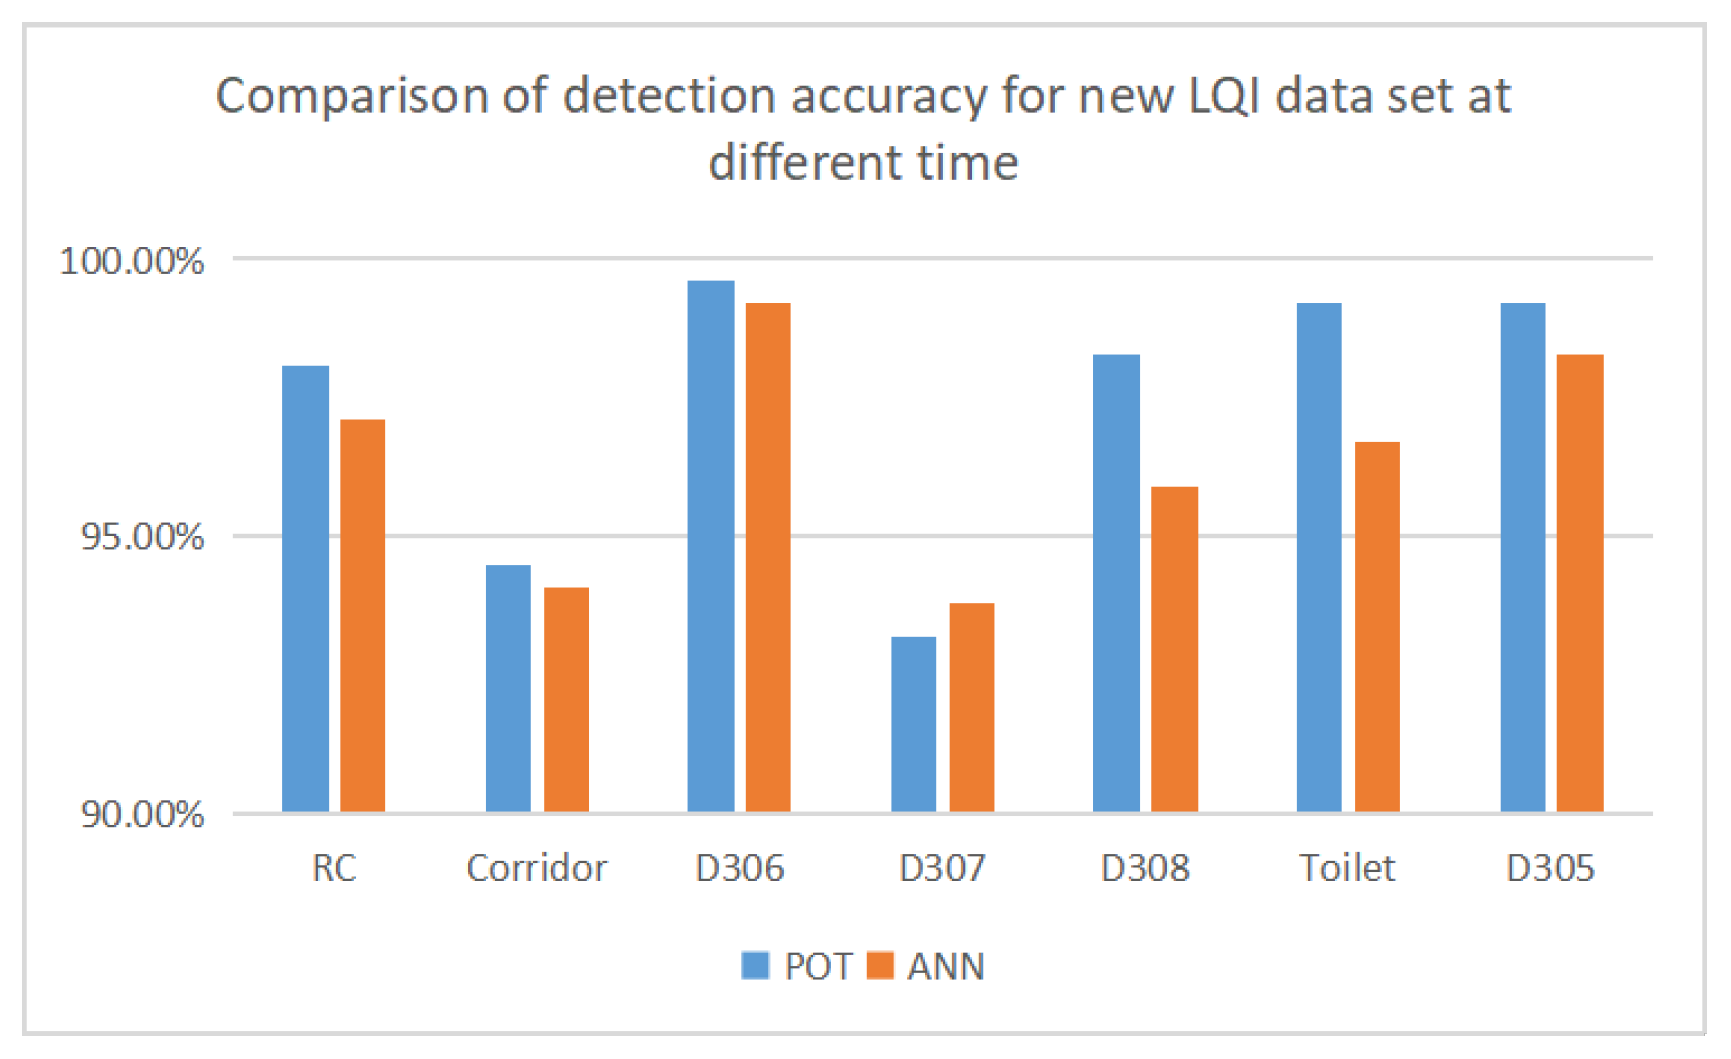
6.1. Detection Result for LQI Data at Different Times
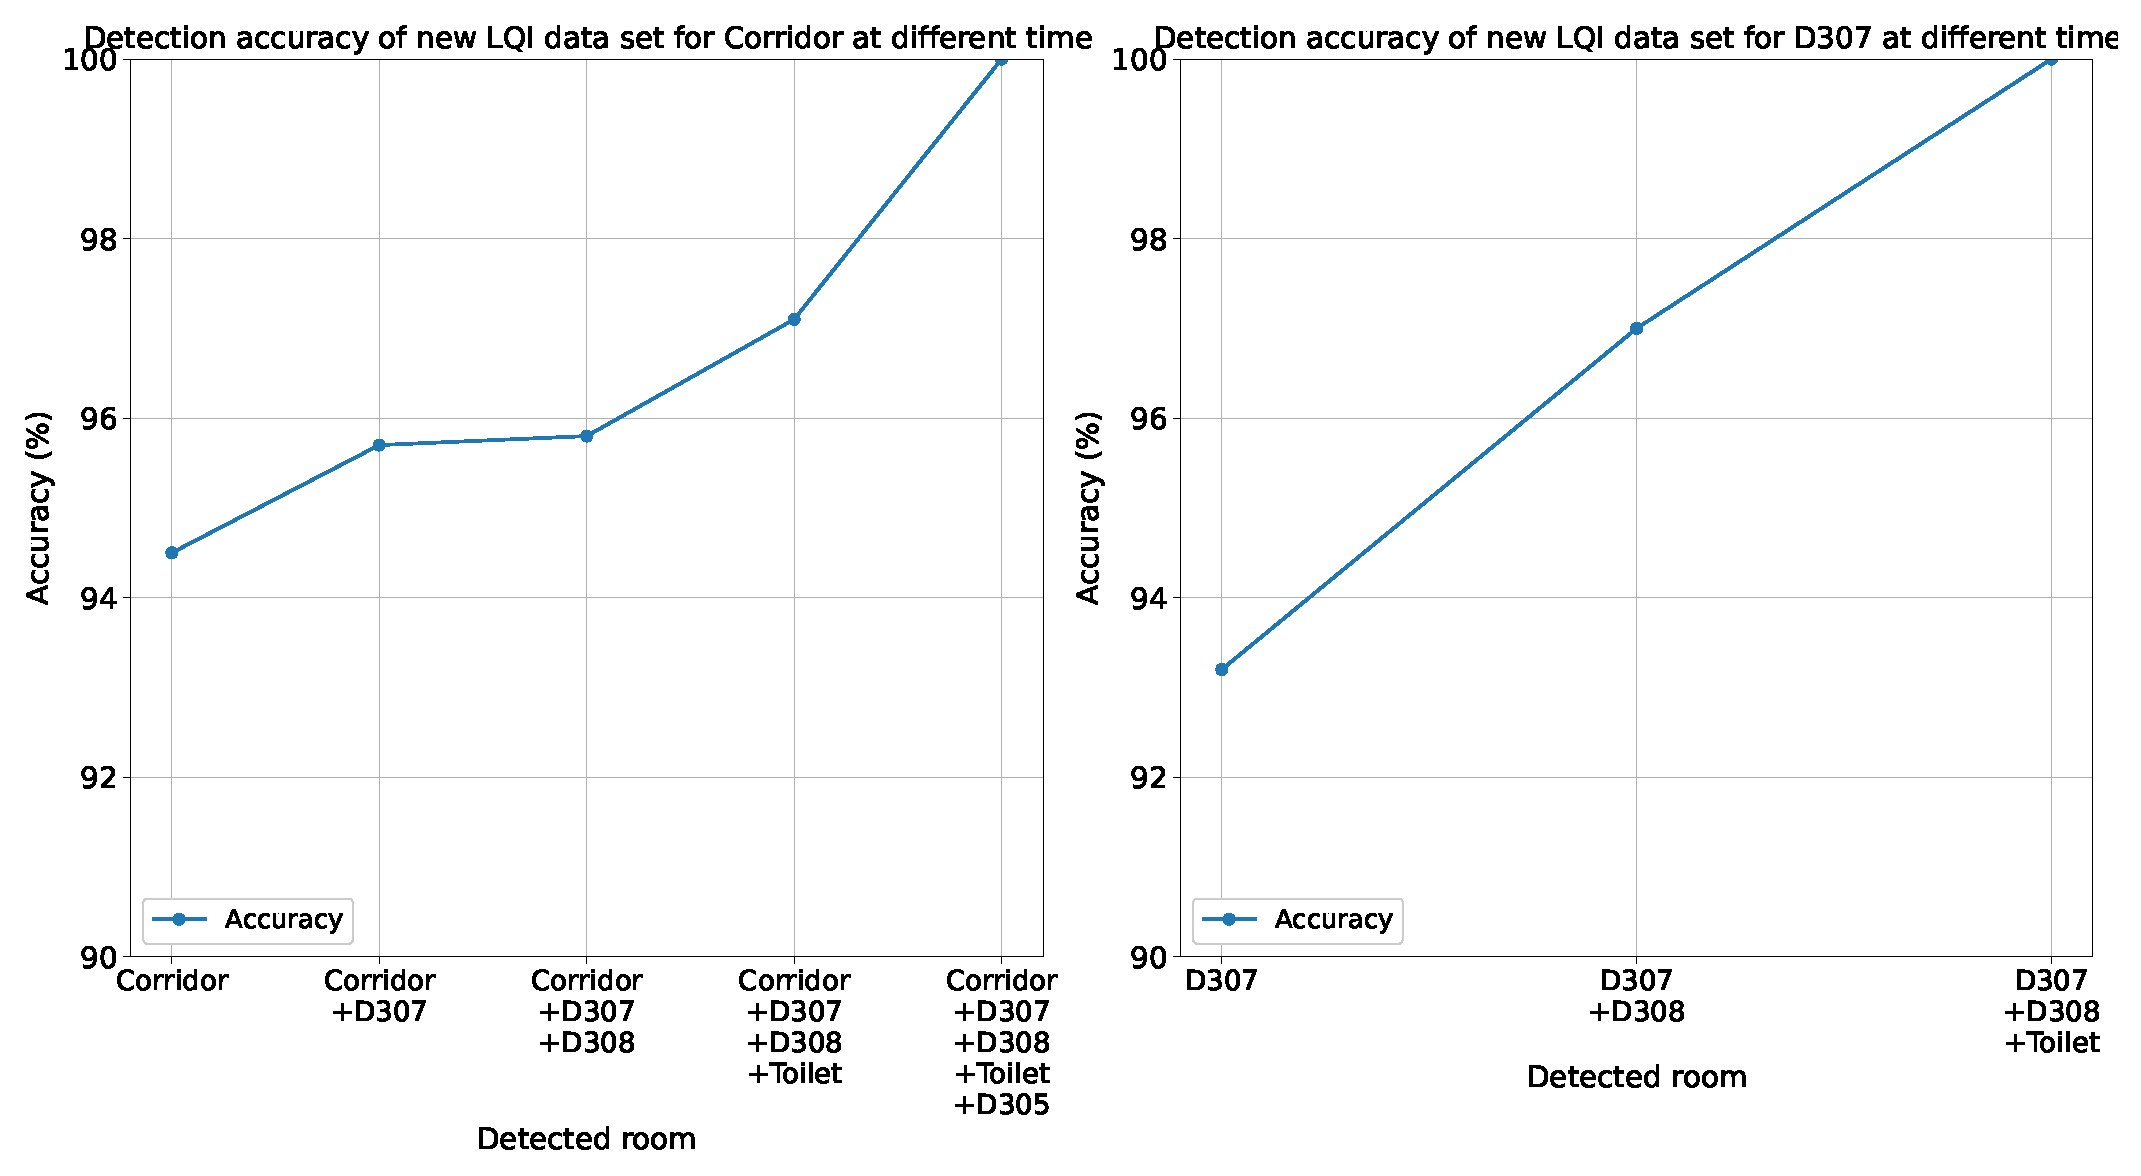
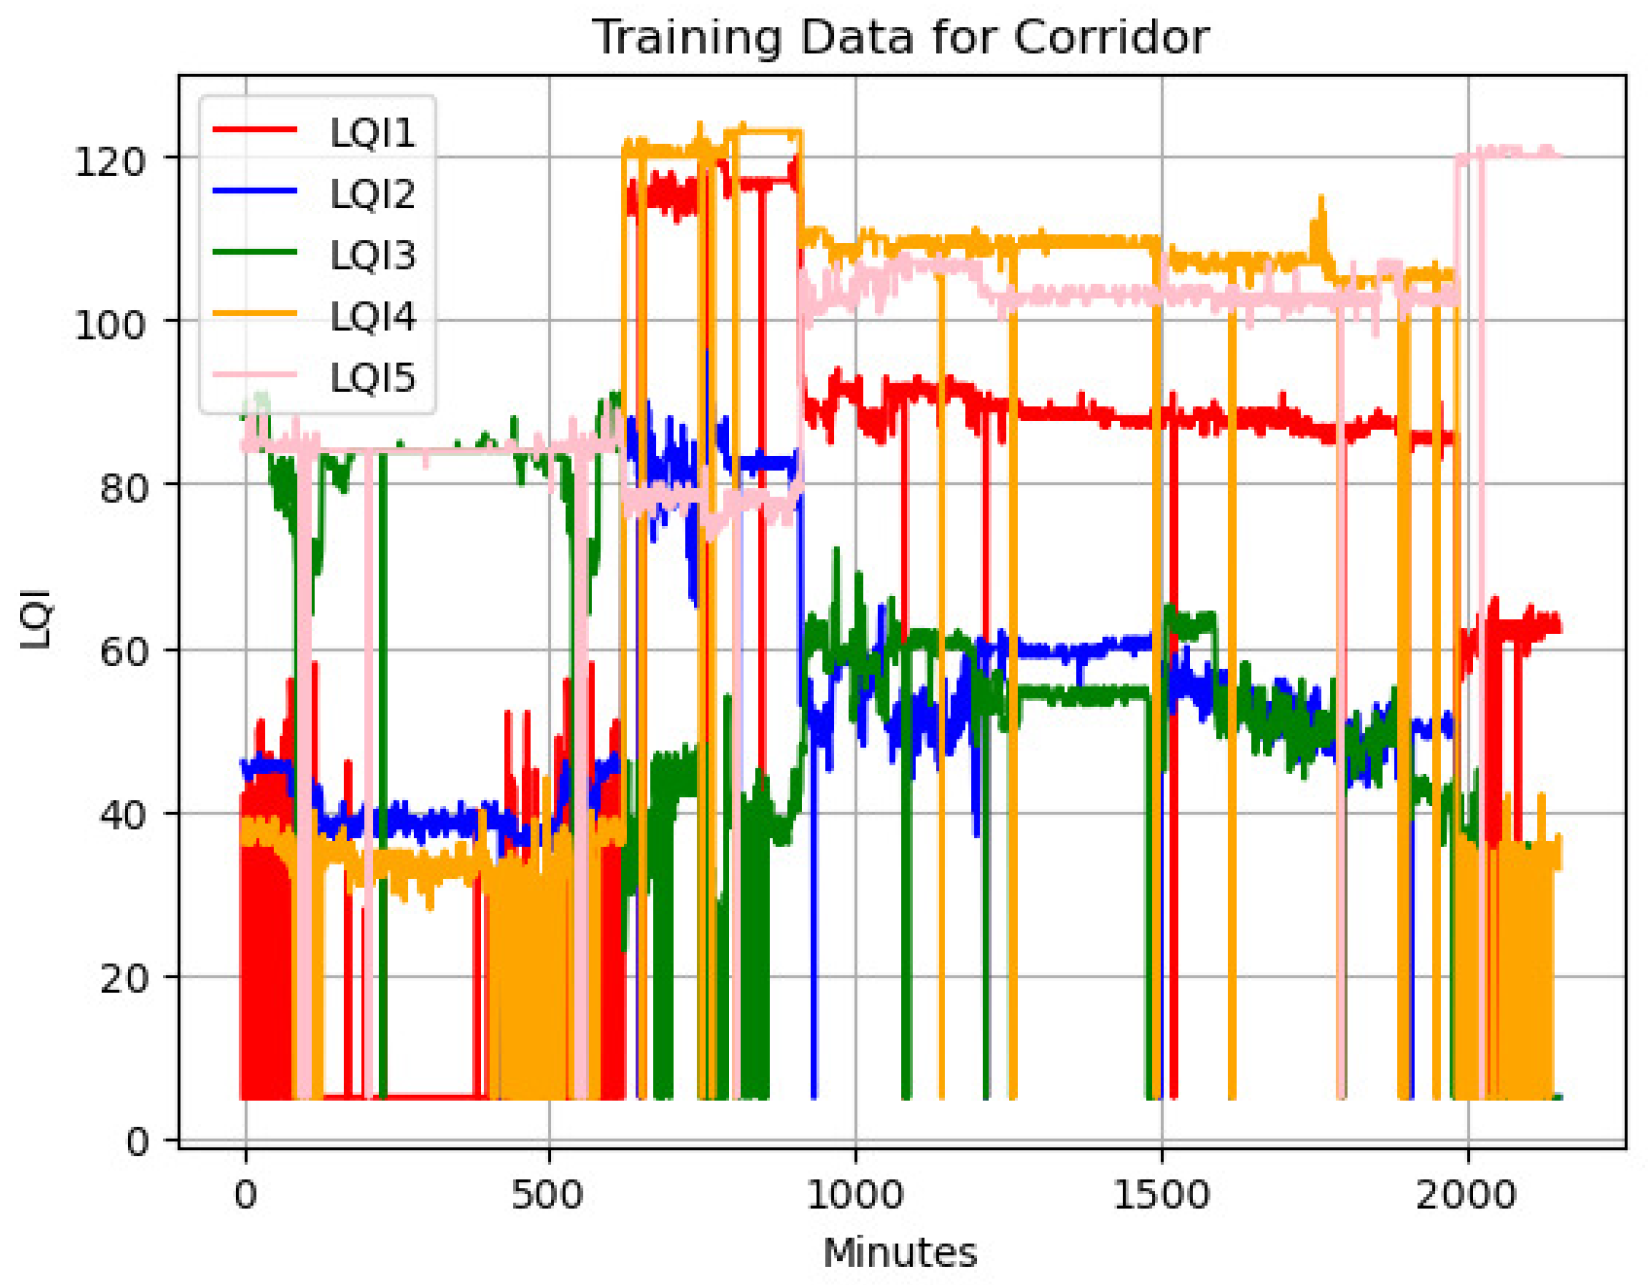
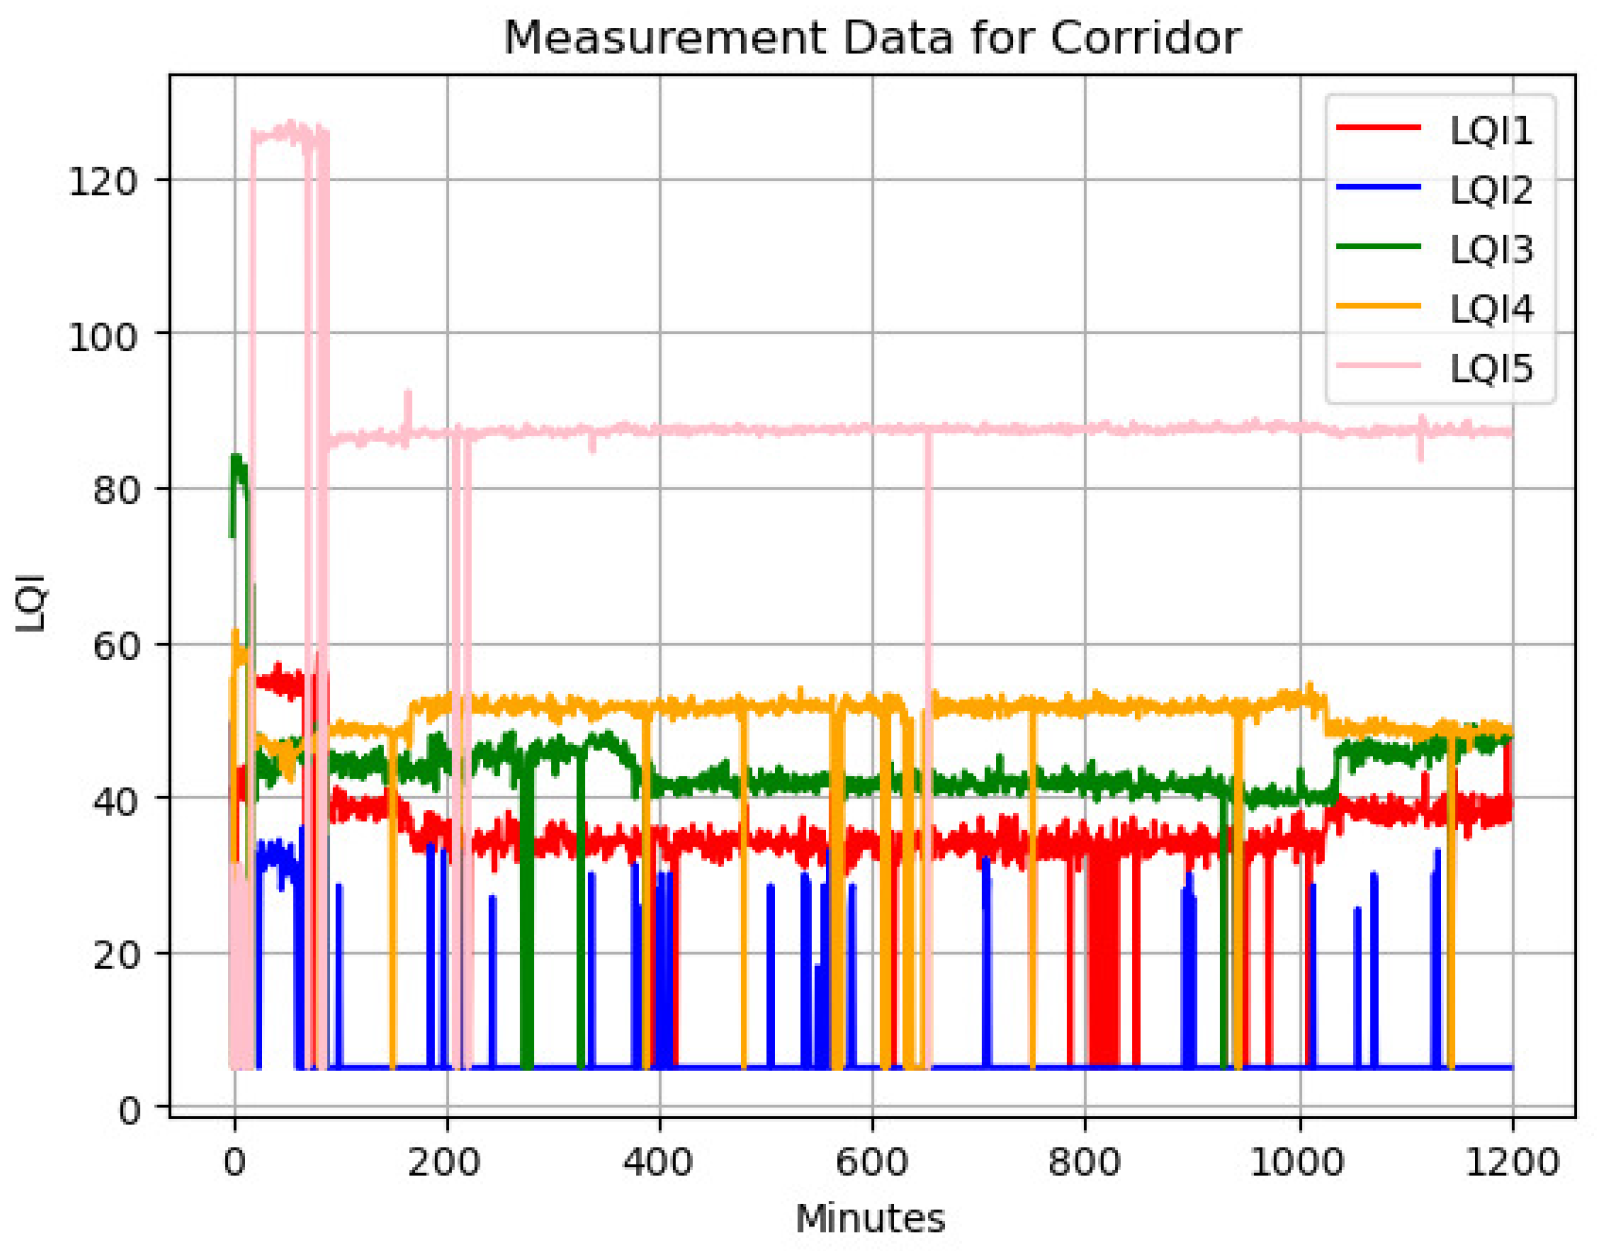
6.2. Measured LQI Data and Detection Results for the Corridor
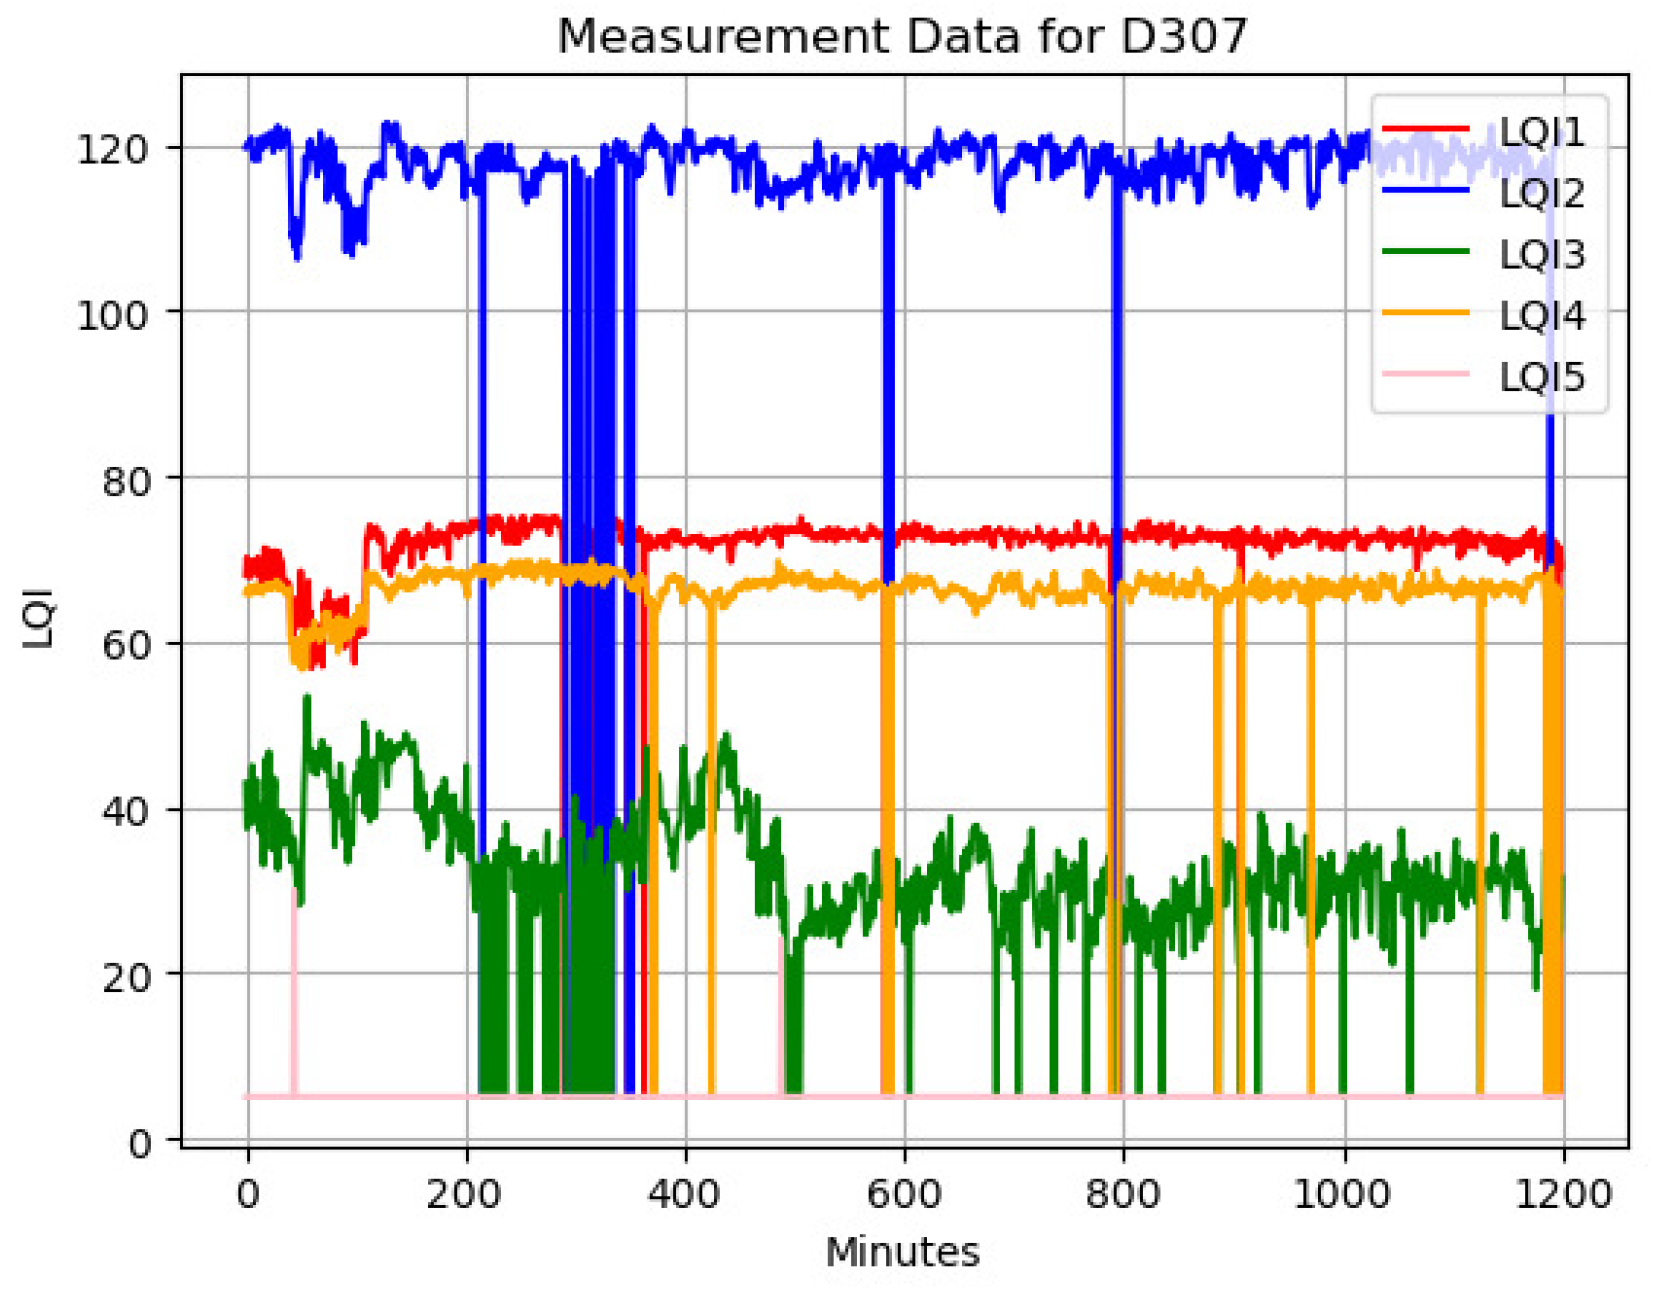
6.3. Measured LQI Data and Detection Result for D307
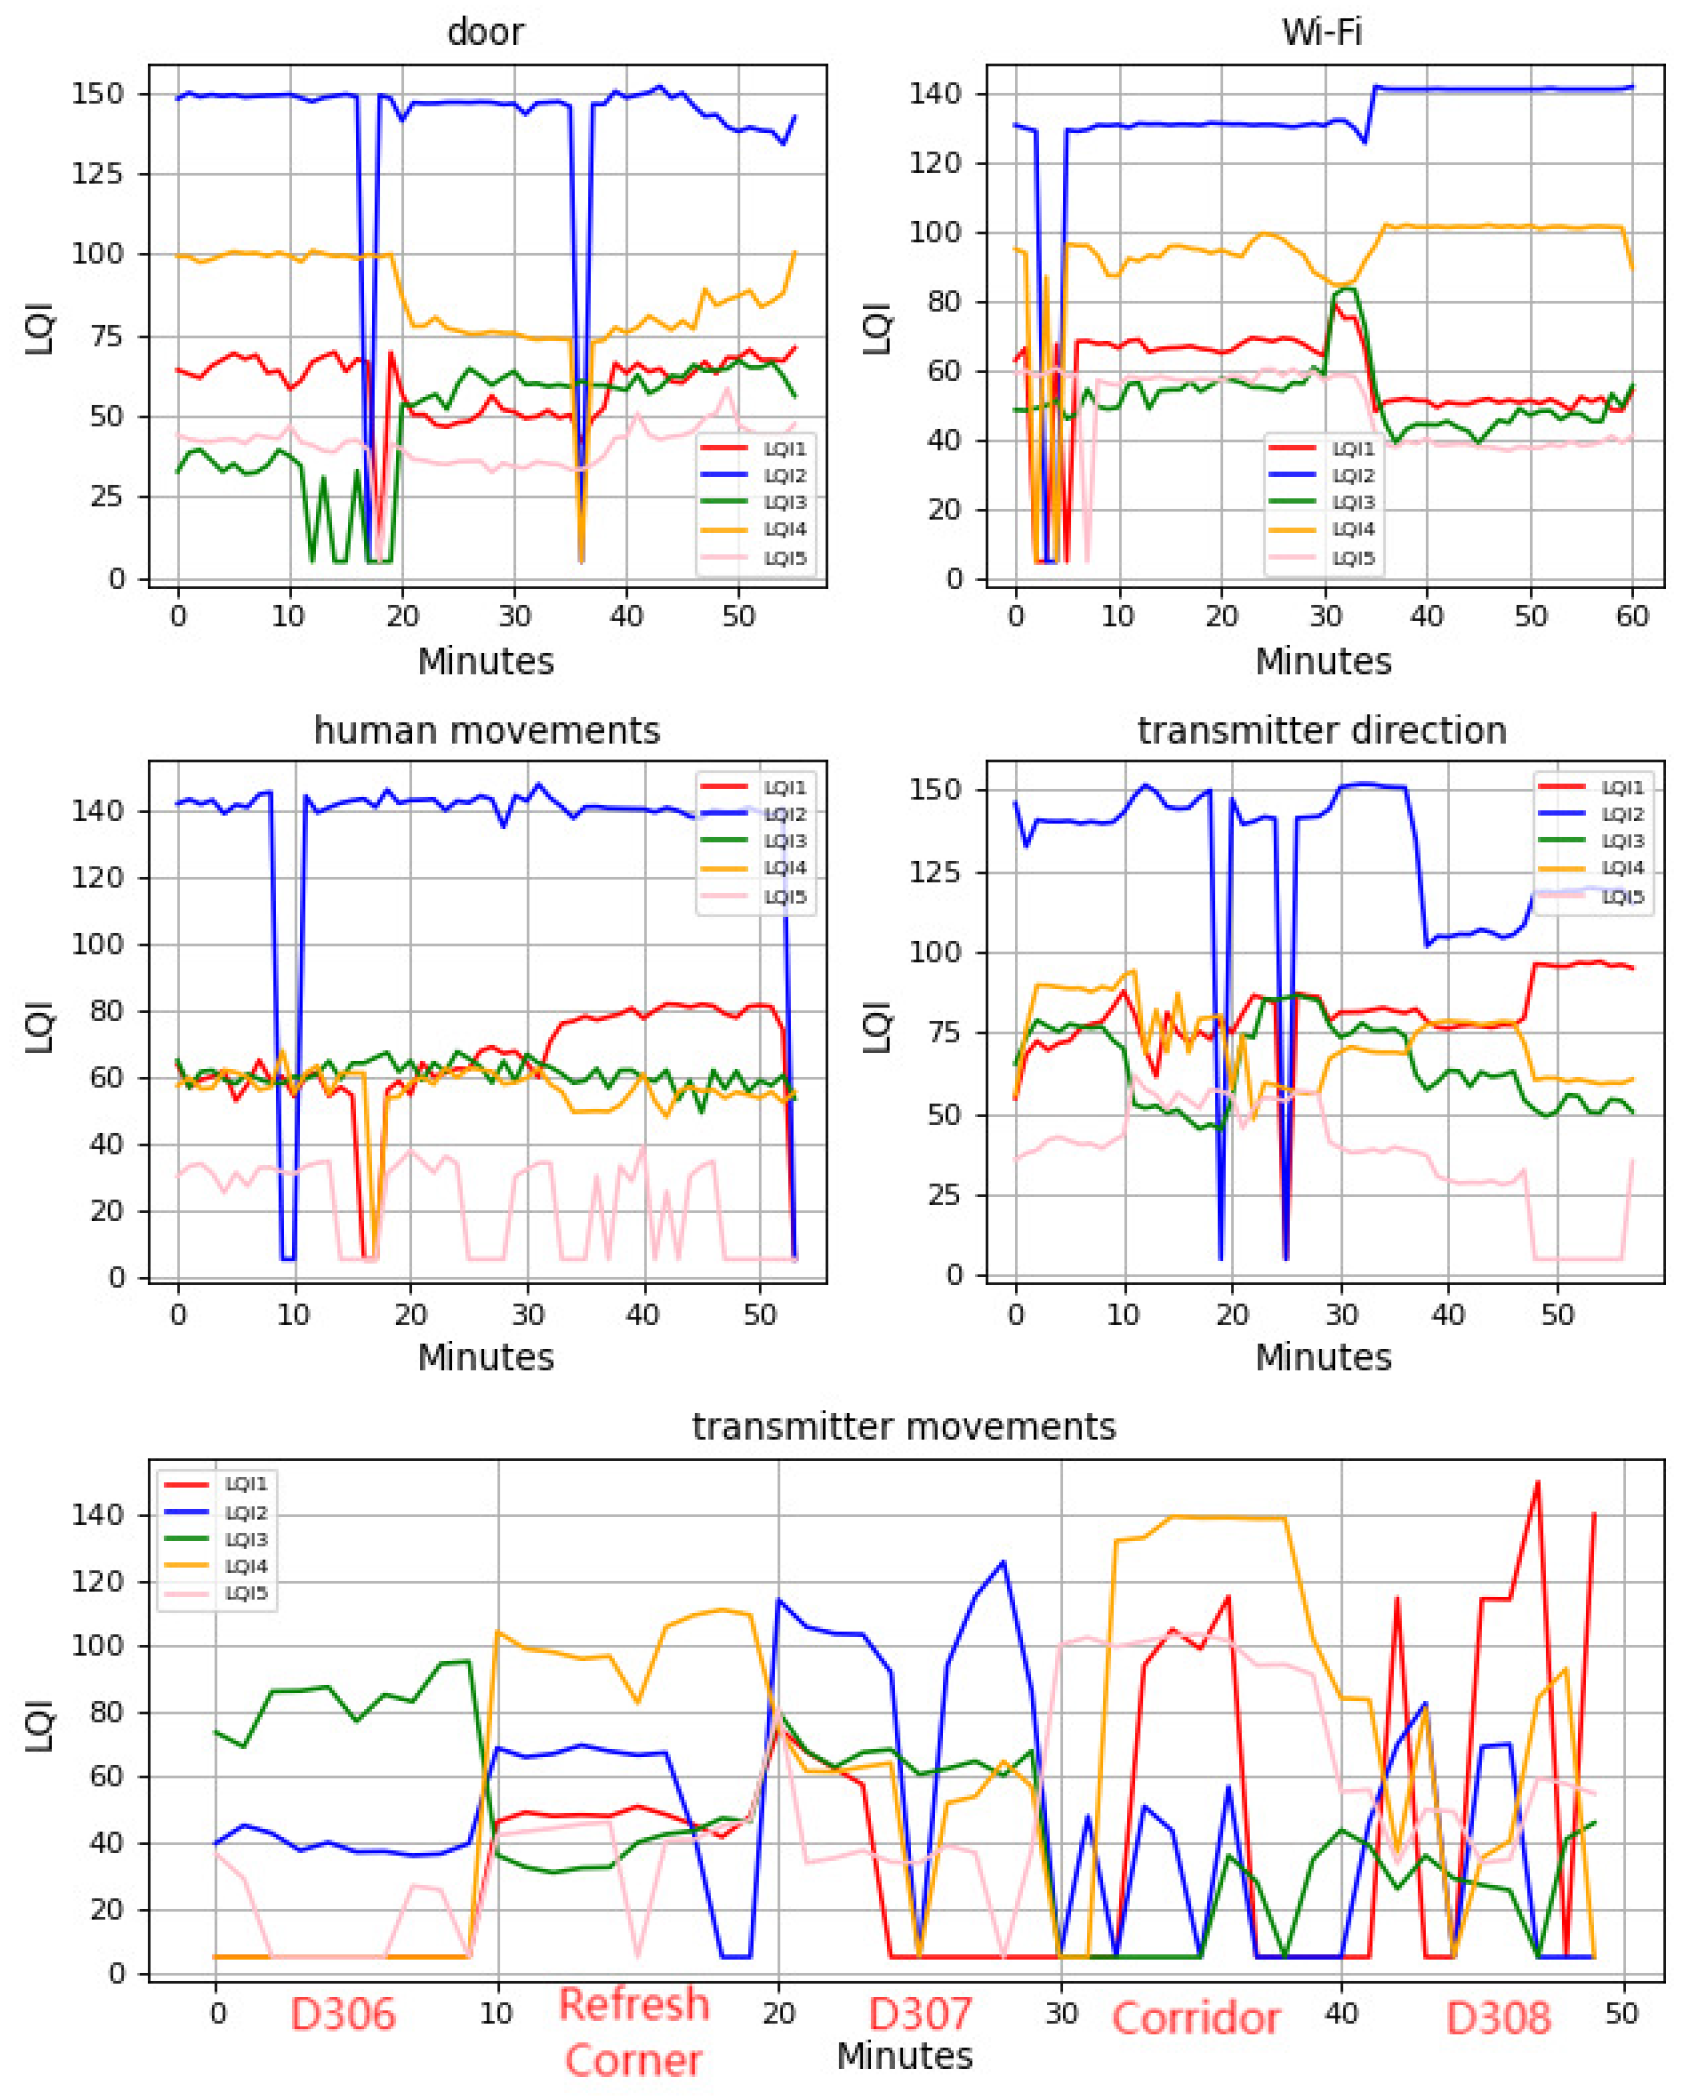
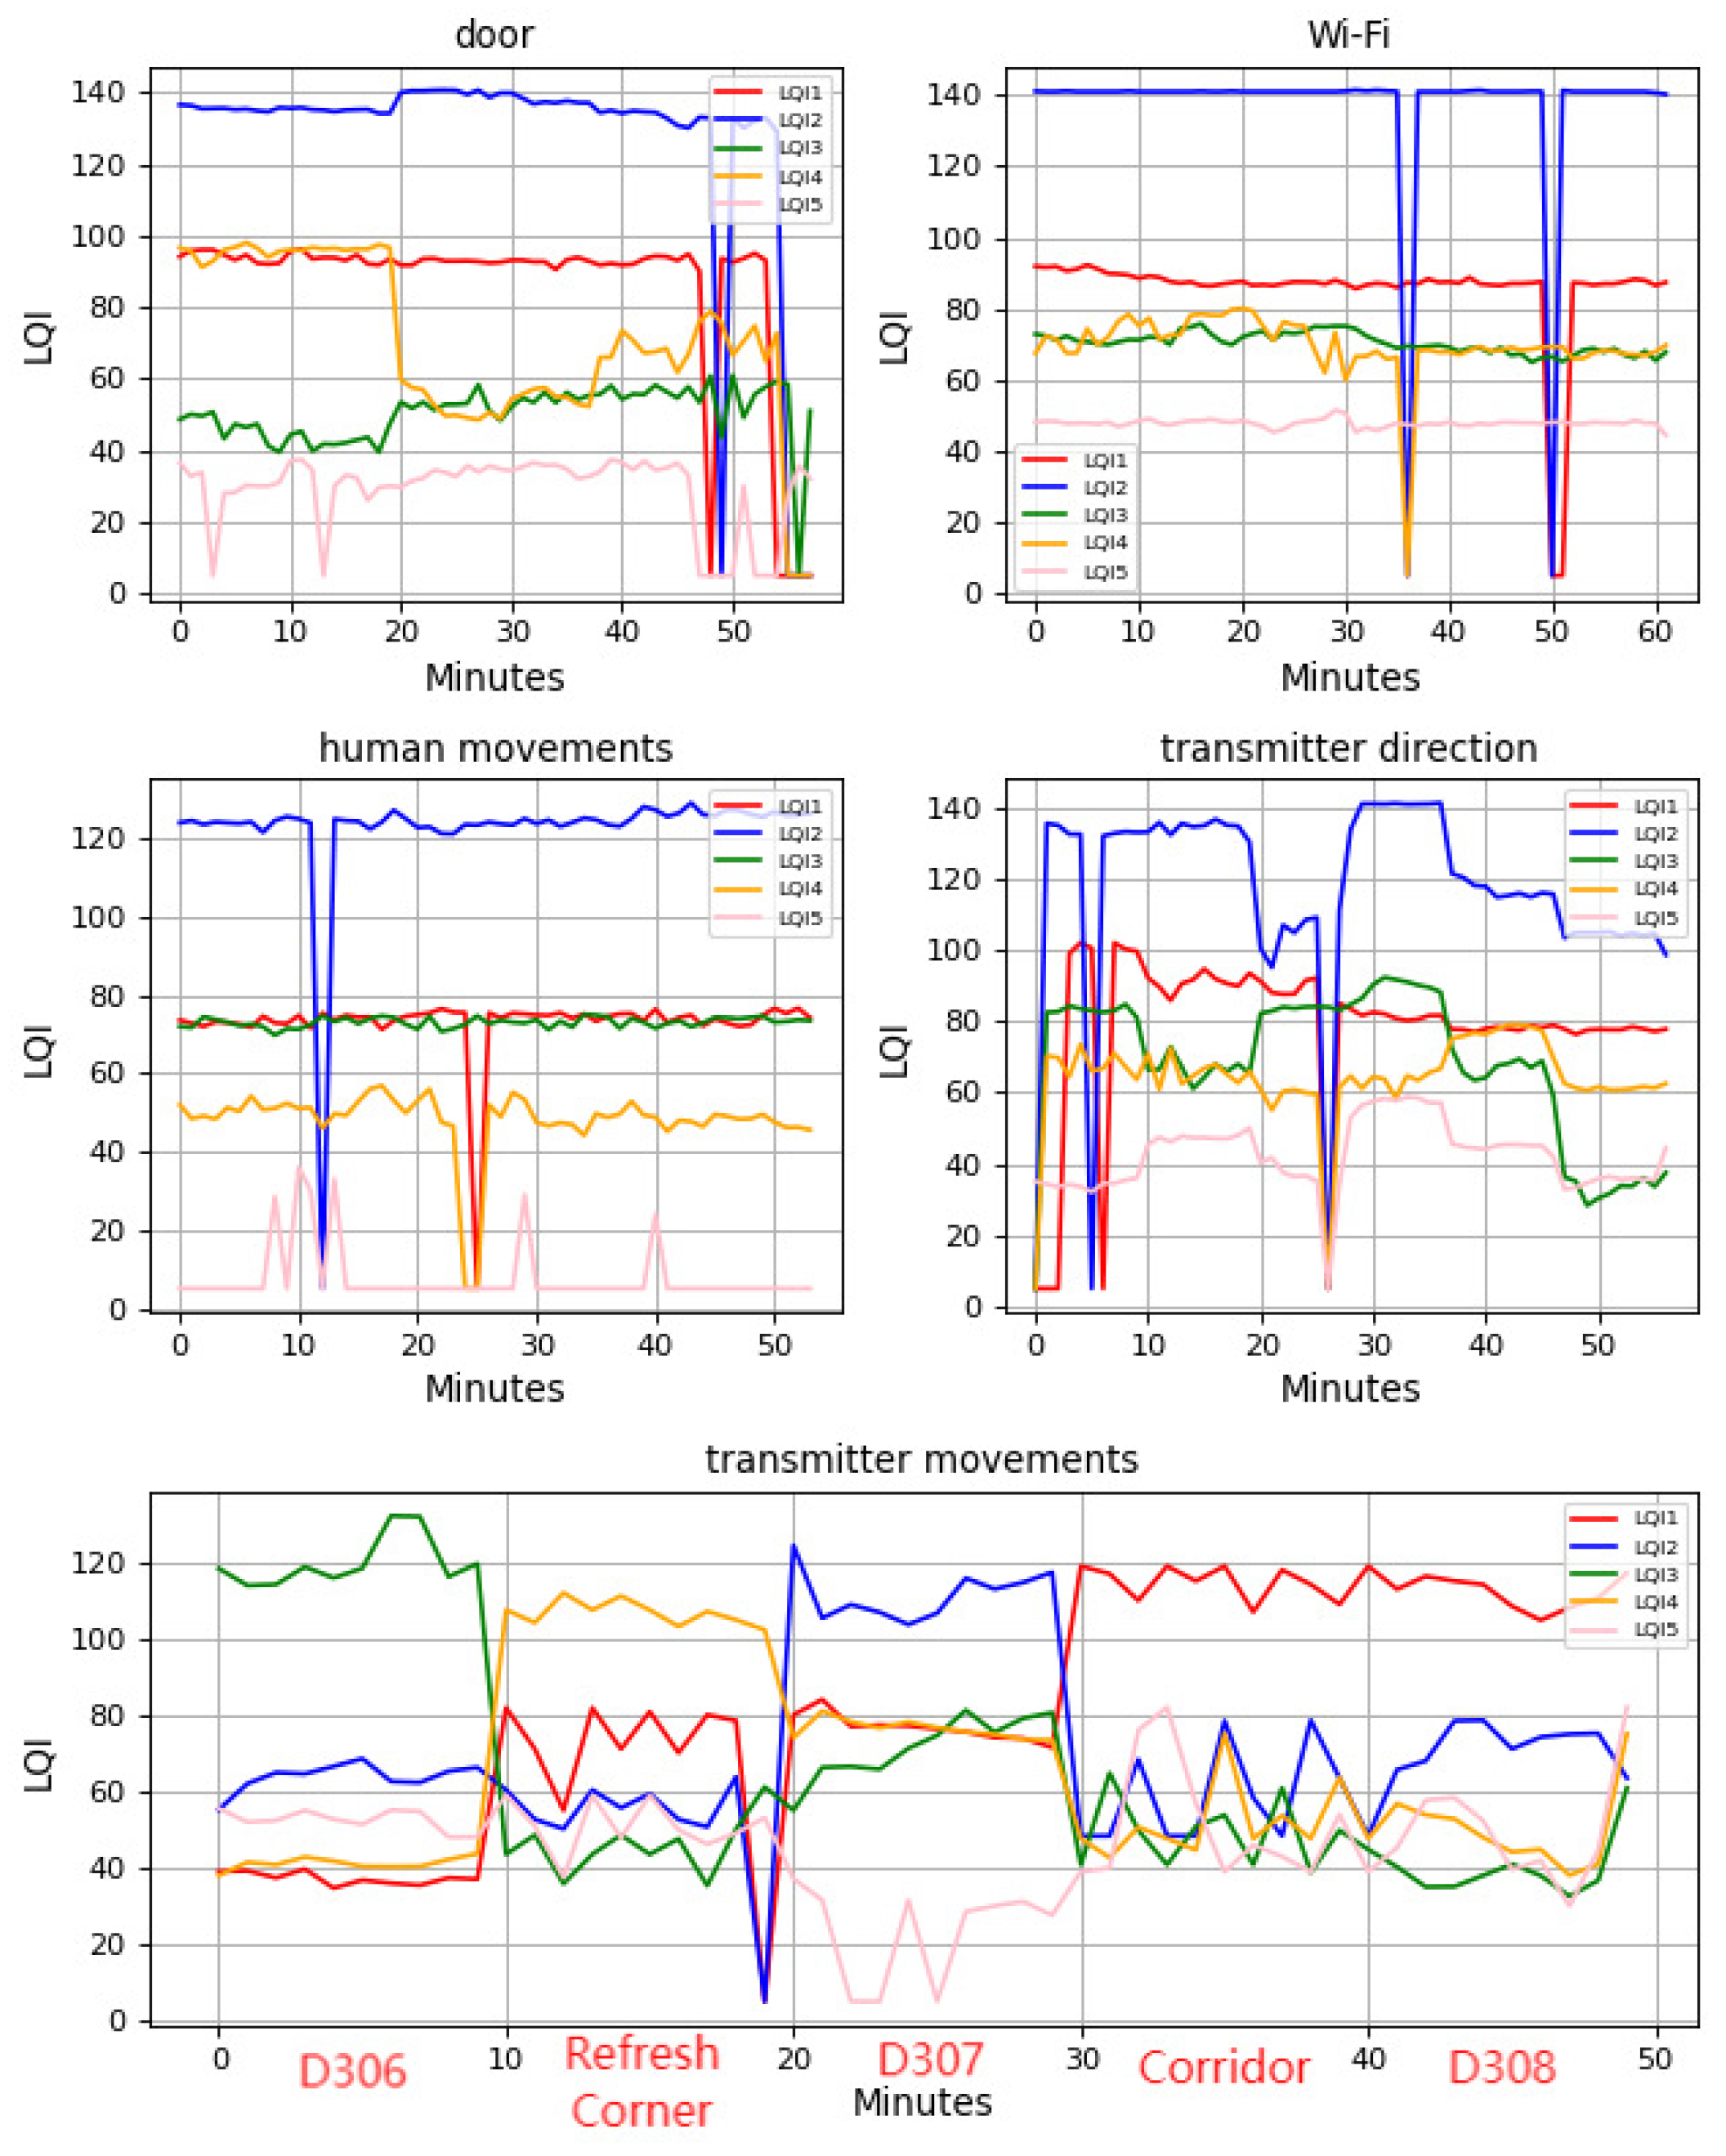
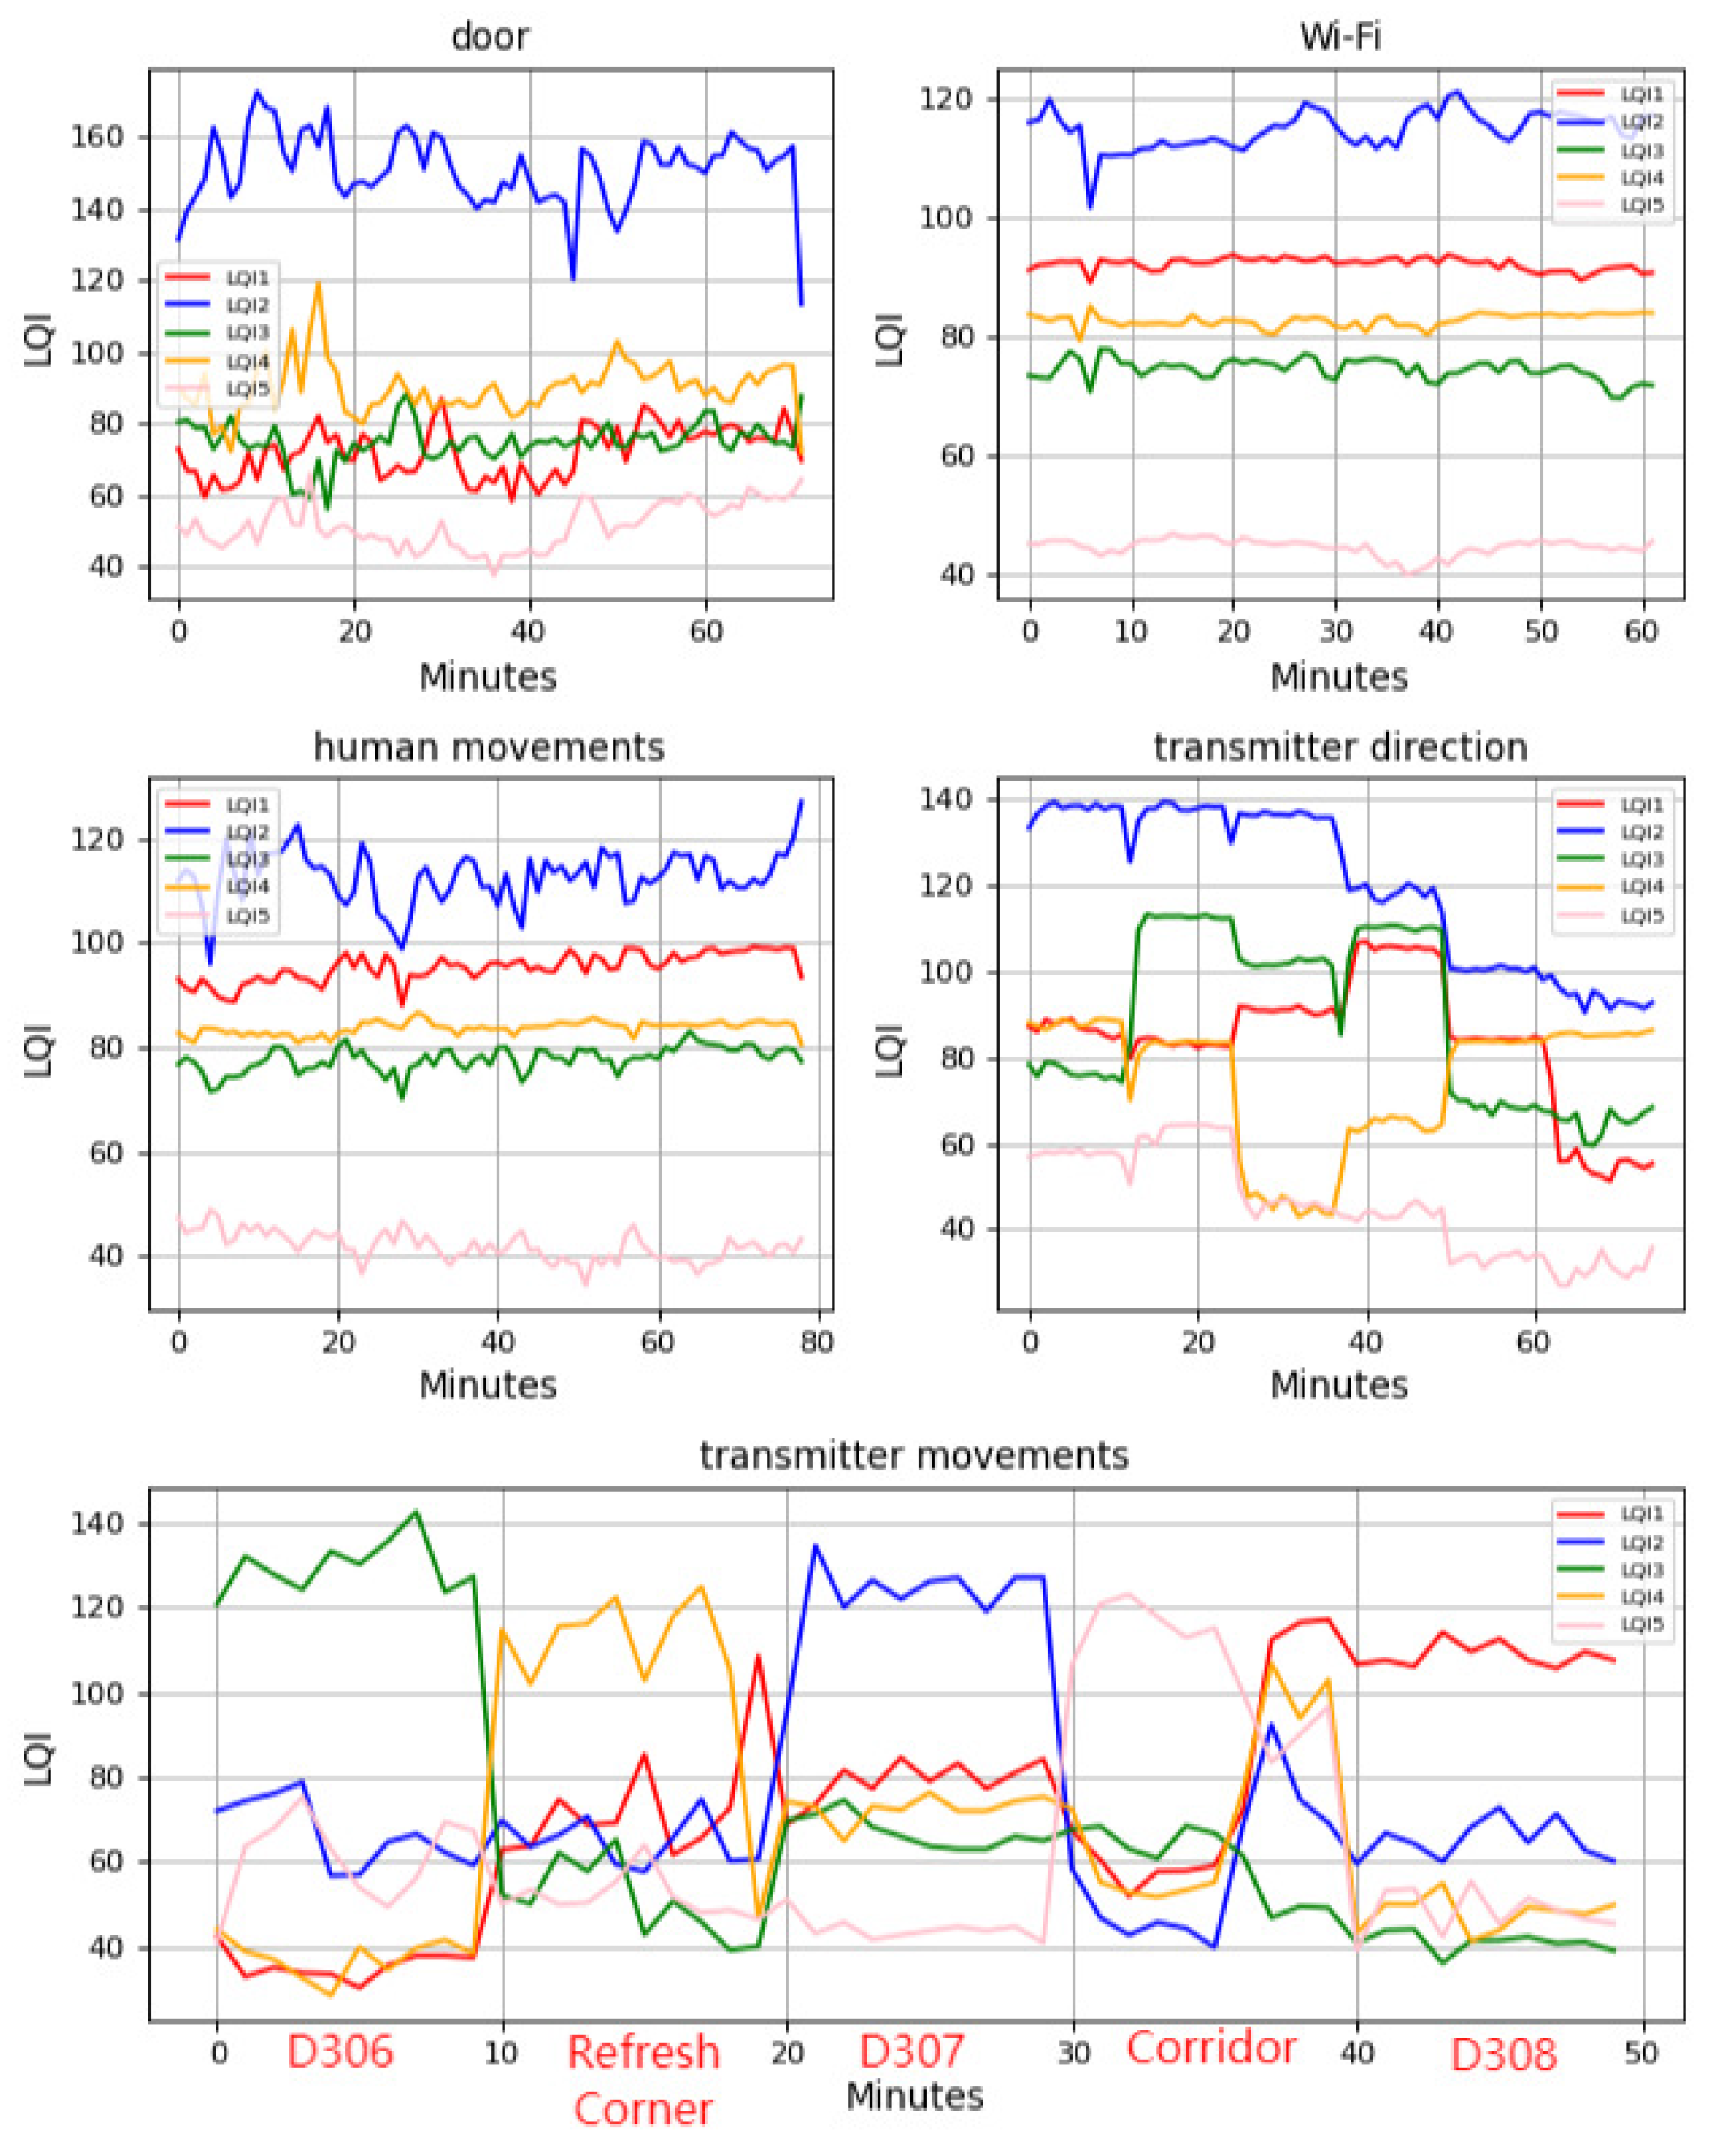
7. Evaluation with Fluctuation Causes
8. Discussion
9. Related Works
10. Conclusions
Author Contributions
Funding
Institutional Review Board Statement
Informed Consent Statement
Data Availability Statement
Acknowledgments
Conflicts of Interest
References
- Curran, K.; Furey, E.; Lunney, T.; Santos, J.; Woods, D.; McCaughey, A. An Evaluation of Indoor Location Determination Technologies. J. Loc. Base. Serv. 2011, 5, 61–78. [Google Scholar] [CrossRef]
- Kunhoth, J.; Karkar, A.; Al-Maadeed, S.; Al-Ali, A. Indoor Positioning and Wayfinding Systems: A Survey. Hum.-Cent. Comput. Inf. Sci. 2020, 10, 18. [Google Scholar] [CrossRef]
- Al-Ammar, M.A.; Alhadhrami, S.; Al-Salman, A.; Alarifi, A.; Al-Khalifa, H.S.; Alnafessah, A.; Alsaleh, M. Comparative Survey of Indoor Positioning Technologies, Techniques, and Algorithms. In Proceedings of the International Conference on Cyberworlds, Cantabria, Spain, 6–8 October 2014; pp. 245–252. [Google Scholar]
- Brena, R.F.; Garcia-Vazquez, J.P.; Galvan-Tejada, C.E.; Munoz-Rodriguez, D.; Vargas-Rosales, C.; Fangmeyer, J. Evolution of Indoor Positioning Technologies: A Survey. J. Sens. 2017, 1, 1–21. [Google Scholar] [CrossRef]
- Davidson, P.; Piche, R. A Survey of Selected Indoor Positioning Methods for Smartphones. IEEE Commun. Surv. Tutor. 2016, 19, 1347–1370. [Google Scholar] [CrossRef]
- Molina, B.; Olivares, E.; Palau, C.E.; Esteve, M. A Multimodal Fingerprint-Based Indoor Positioning System for Airports. IEEE Access 2018, 6, 10092–10106. [Google Scholar] [CrossRef]
- Puspitaningayu, P.; Hamazaki, K.; Funabiki, N.; Htet, H.; Kuribayashi, M. An Implementation of Fingerprint-Based Indoor Positioning System Using IEEE 802.15.4; IEICE Tech. Report, LOIS2020-28; IEICE: Tokyo, Japan, 2021; pp. 33–38. [Google Scholar]
- Yuanzhi, H.; Puspitaningayu, P.; Funabiki, N. A Parameter Optimization Method for Fingerprint-Based Indoor Localization System Using IEEE 802.15. 4 Devices. In Proceedings of the International Conference on Computer Communication and the Internet, Nagoya, Japan, 25–27 June 2021; pp. 136–140. [Google Scholar]
- Mono Wireless. Mono Wireless Product Information. Available online: https://mono-wireless.com/jp/products/index.html (accessed on 10 May 2021).
- Funabiki, N.; Taniguchi, C.; Lwin, K.S.; Zaw, K.K.; Kao, W.C. A Parameter Optimization Tool and Its Application to Throughput Estimation Model for Wireless LAN. Adv. Intell. Syst. Comput. 2017, 611, 701–710. [Google Scholar]
- Mrindoko, N.R.; Minga, L.M. A Comparison Review of Indoor Positioning Techniques. Int. J. Comp. 2016, 1, 42–49. [Google Scholar]
- Choi, M.S.; Beakcheol, J. An Accurate Fingerprinting Based Indoor Positioning Algorithm. Int. J. Appl. Eng. Res. 2017, 12, 86–90. [Google Scholar]
- MQTT The Standard for IoT Messaging. Available online: https://mqtt.org/ (accessed on 10 May 2021).
- Youssef, M.; Agrawala, A. The Horus WLAN Location Determination System. In Proceedings of the International Conference on Mobile Systems, Cologne, Germany, 6–8 June 2005; pp. 205–218. [Google Scholar]
- Sen, S.; Radunovic, B.; Choudhury, R.; Minka, T. You Are Facing the Mona Lisa: Spot Localization Using PHY Layer Information. In Proceedings of the 10th International Conference on Mobile Systems, Applications, and Services, Windermere, UK, 25–29 June 2012; pp. 183–196. [Google Scholar]
- Turner, J.S.C.; Ramli, M.F.; Kamarudin, L.M.; Zakaria, A.; Shakaff, A.Y.M.; Ndzi, D.L.; Nor, C.M.; Hassan, N.; Mamduh, S.M. The Study of Human Movement Effect on Signal Strength for Indoor WSN Deployment. In Proceedings of the IEEE Conference on Wireless Sensor, Kuching, Malaysia, 2–4 December 2013; pp. 30–35. [Google Scholar]
- Hamdoun, S.; Rachedi, A.; Benslimane, A. Comparative Analysis of RSSI-Based Indoor Localization When Using Multiple Antennas in Wireless Sensor Networks. In Proceedings of the 2013 International Conference on Selected topics in mobile and wireless networking (MoWNeT), Montreal, QC, Canada, 19–21 August 2013; pp. 146–151. [Google Scholar] [CrossRef]
- Luoh, L. ZigBee-Based Intelligent Indoor Positioning System Soft Computing. Soft Comput. 2013, 18, 443–456. [Google Scholar] [CrossRef]
- Koweerawong, C.; Wipusitwarakun, K.; Kaemarungsi, K. Indoor Localization Improvement via Adaptive RSS Fingerprinting Database. In Proceedings of the International Conference on Information Networking, Bangkok, Thailand, 28–30 January 2013; pp. 412–416. [Google Scholar]
- Tlili, F.; Rachedi, A.; Benslimane, A. Time-Bounded Localization Algorithm Based on Distributed Multidimensional Scaling for Wireless Sensor Networks. In Proceedings of the 2014 IEEE International Conference on Communications (ICC), Sydney, Australia, 10–14 June 2014; pp. 233–238. [Google Scholar]
- Torteeka, P.; Chundi, X. Indoor Positioning Based on Wi-Fi Fingerprint Technique Using Fuzzy K-Nearest Neighbor. In Proceedings of the 11th International Bhurban Conference on Applied Sciences & Technology, Islamabad, Pakistan, 14–18 January 2014; pp. 461–465. [Google Scholar]
- Aomumpai, S.; Kondee, K. Optimal Placement of Reference Nodes for Wireless Indoor Positioning Systems. In Proceedings of the 11th International Conference on Electrical Engineering/Electronics, Computer, Telecommunications and Information Technology, Nakhon Ratchasima, Thailand, 14–17 May 2014; pp. 1–6. [Google Scholar]
- Chapre, Y.; Ignjatovic, A.; Seneviratne, A.; Jha, S. CSI-MIMO: An Efficient Wi-Fi Fingerprinting Using Channel State Information with MIMO. Pervasive Mob. Comput. 2015, 23, 89–103. [Google Scholar] [CrossRef] [Green Version]
- Hamdoun, S.; Rachedi, A.; Benslimane, A. RSSI-Based Localisation Algorithms Using Spatial Diversity in Wireless Sensor Networks. Int. J. Hoc Ubiquitous Comput. 2015, 19, 157–167. [Google Scholar] [CrossRef]
- Prieto, J.; De Paz, J.F.; Villarrubia, G.; Bajo, J.; Corchado, J.M. Unified Fingerprinting/Ranging Localization for E-Healthcare Systems. Ambient. Intel. Soft. Appl. 2015, 376, 223–231. [Google Scholar]
- Ma, R.; Guo, Q.; Hu, C.; Xue, J. An Improved Wi-Fi Indoor Positioning Algorithm by Weighted Fusion. Sensors 2015, 15, 21824–21843. [Google Scholar] [CrossRef] [PubMed]
- Vasisht, D.; Kumar, S.; Katabi, D. Decimeter-Level Localization with A Single WiFi Access Point. In Proceedings of the 13th USENIX Symposium on Networked Systems Design and Implementation, Santa Clara, CA, USA, 16–18 March 2016; pp. 165–178. [Google Scholar]
- Alshami, I.H.; Ahmad, N.A.; Sahibuddin, S. The Effect of People Presence on WLAN RSS is Governed by Influence Distance. In Proceedings of the 3rd International Conference on Computer and Information Sciences, Kuala Lumpur, Malaysia, 15–17 August 2016; pp. 197–220. [Google Scholar]
- Wang, X.; Gao, L.; Mao, S. BiLoc: Bi-Modal Deep Learning for Indoor Localization with Commodity 5 GHz WiFi. IEEE Access 2017, 5, 4209–4220. [Google Scholar] [CrossRef]
- Bernas, M.; Płaczek, B. Fully Connected Neural Networks Ensemble with Signal Strength Clustering for Indoor Localization in Wireless Sensor Networks. Int. J. Distrib. Sens. Netw. 2017, 45, 403242–403252. [Google Scholar] [CrossRef] [Green Version]
- Uradzinski, M.; Guo, H.; Liu, X.; Yu, M. Advanced Indoor Positioning Using Zigbee Wireless Technology. Wirel. Pers. Commun. 2017, 97, 6509–6518. [Google Scholar] [CrossRef]
- Amri, S.; Khelifi, F.; Bradai, A.; Rachedi, A.; Kaddachi, M.L.; Atri, M. A New Fuzzy Logic Based Node Localization Mechanism for Wireless Sensor Networks. Future Gener. Comput. Syst. 2019, 93, 799–813. [Google Scholar] [CrossRef]
- Omer, M.; Ran, Y.; Tian, G.Y. Indoor Localization Systems for Passive UHF RFID Tag Based on RSSI Radio Map Database. Prog. Electron. Res. 2019, 77, 51–60. [Google Scholar] [CrossRef] [Green Version]
- Ashraf, I.; Hur, S.; Shafiq, M.; Kumari, S.; Park, Y. GUIDE: Smartphone Sensors-Based Pedestrian Indoor Localization with Heterogeneous Devices. Int. J. Commun. Syst. 2019, 32, e4062. [Google Scholar] [CrossRef]
- Setiabudi, C.A.; Riady, A.; Kusuma, G.P. Indoor Positioning System Using BLE for Tracking Dynamic User Positions. Int. J. Emer. Trend. Eng. Res. 2020, 8, 455–463. [Google Scholar] [CrossRef]
- Ashraf, I.; Hur, S.; Park, Y. Smartphone Sensor Based Indoor Positioning: Current Status, Opportunities, and Future Challenges. Electronics 2020, 9, 891. [Google Scholar] [CrossRef]
- Njima, W.; Chafii, M. Indoor Localization Using Data Augmentation via Selective Generative Adversarial Networks. IEEE Access 2021, 9, 98337–98347. [Google Scholar] [CrossRef]
- Fahmy, I.; Ayman, S.; Rizk, H.; Youssef, M. MonoFi: Efficient Indoor Localization Based on Single Radio Source and Minimal Fingerprinting. In Proceedings of the 29th International Conference on Advances in Geographic Information, Beijing, China, 2–5 November 2021; pp. 674–675. [Google Scholar]
- Jiang, J.R.; Subakti, H.; Liang, H.S. Fingerprint Feature Extraction for Indoor Localization. Sensors 2021, 21, 5434. [Google Scholar] [CrossRef]
- Ezhumalai, B.; Song, M.; Park, K. An Efficient Indoor Positioning Method Based on Wi-Fi RSS Fingerprint and Classification Algorithm. Sensors 2021, 21, 3418. [Google Scholar] [CrossRef] [PubMed]


| Feature | Fingerprinting | Signal Propagation Model-Based | Time of Arrival (ToA) | Angle of Arrival (AoA) |
|---|---|---|---|---|
| accuracy | high | low | high | low |
| time synchronization | no | no | yes | no |
| directional antenna | no | no | no | yes |
| implementation cost | low | low | high | high |
| Room | |||||
|---|---|---|---|---|---|
| RC | 74 | 33 | 14 | 147 | 22 |
| Corridor | 38 | 46 | 68 | 36 | 112 |
| D306 | 29 | 15 | 118 | 41 | 53 |
| D307 | 65 | 112 | 48 | 50 | 10 |
| D308 | 81 | 77 | 30 | 66 | 5 |
| Toilet | 62 | 5 | 66 | 49 | 52 |
| D305 | 5 | 5 | 37 | 34 | 59 |
| Room | Accuracy | Margin | ||
|---|---|---|---|---|
| RC | 99.34% | 41.03 | 93.05 | 52.02 |
| Corridor | 87.4% | 81.58 | 86.32 | 4.74 |
| D306 | 98.28% | 54.14 | 80.43 | 26.29 |
| D307 | 92.51% | 52.28 | 74.84 | 22.56 |
| D308 | 90.32% | 39.44 | 61.44 | 22 |
| Toilet | 76.96% | 49.37 | 63.56 | 14.19 |
| D305 | 100% | 31.23 | 61.72 | 30.49 |
| Average | 92.12% | 49.87 | 74.48 | 24.61 |
| Room | |||||
|---|---|---|---|---|---|
| RC-1 | 66 | 40 | 30 | 130 | 26 |
| RC-2 | 7 | 24 | 37 | 139 | 5 |
| Corridor-1 | 12 | 22 | 30 | 64 | 98 |
| Corridor-2 | 118 | 48 | 26 | 70 | 93 |
| Corridor-3 | 23 | 40 | 67 | 26 | 116 |
| D306 | 24 | 31 | 124 | 45 | 40 |
| D307-1 | 39 | 5 | 70 | 83 | 14 |
| D307-2 | 68 | 112 | 48 | 50 | 22 |
| D308-1 | 79 | 78 | 30 | 66 | 8 |
| D308-2 | 99 | 5 | 10 | 43 | 9 |
| Toilet-1 | 62 | 15 | 46 | 41 | 52 |
| Toilet-2 | 42 | 5 | 46 | 60 | 21 |
| Toilet-3 | 5 | 5 | 34 | 30 | 50 |
| D305-1 | 159 | 60 | 97 | 6 | 26 |
| D305-2 | 5 | 5 | 37 | 34 | 59 |
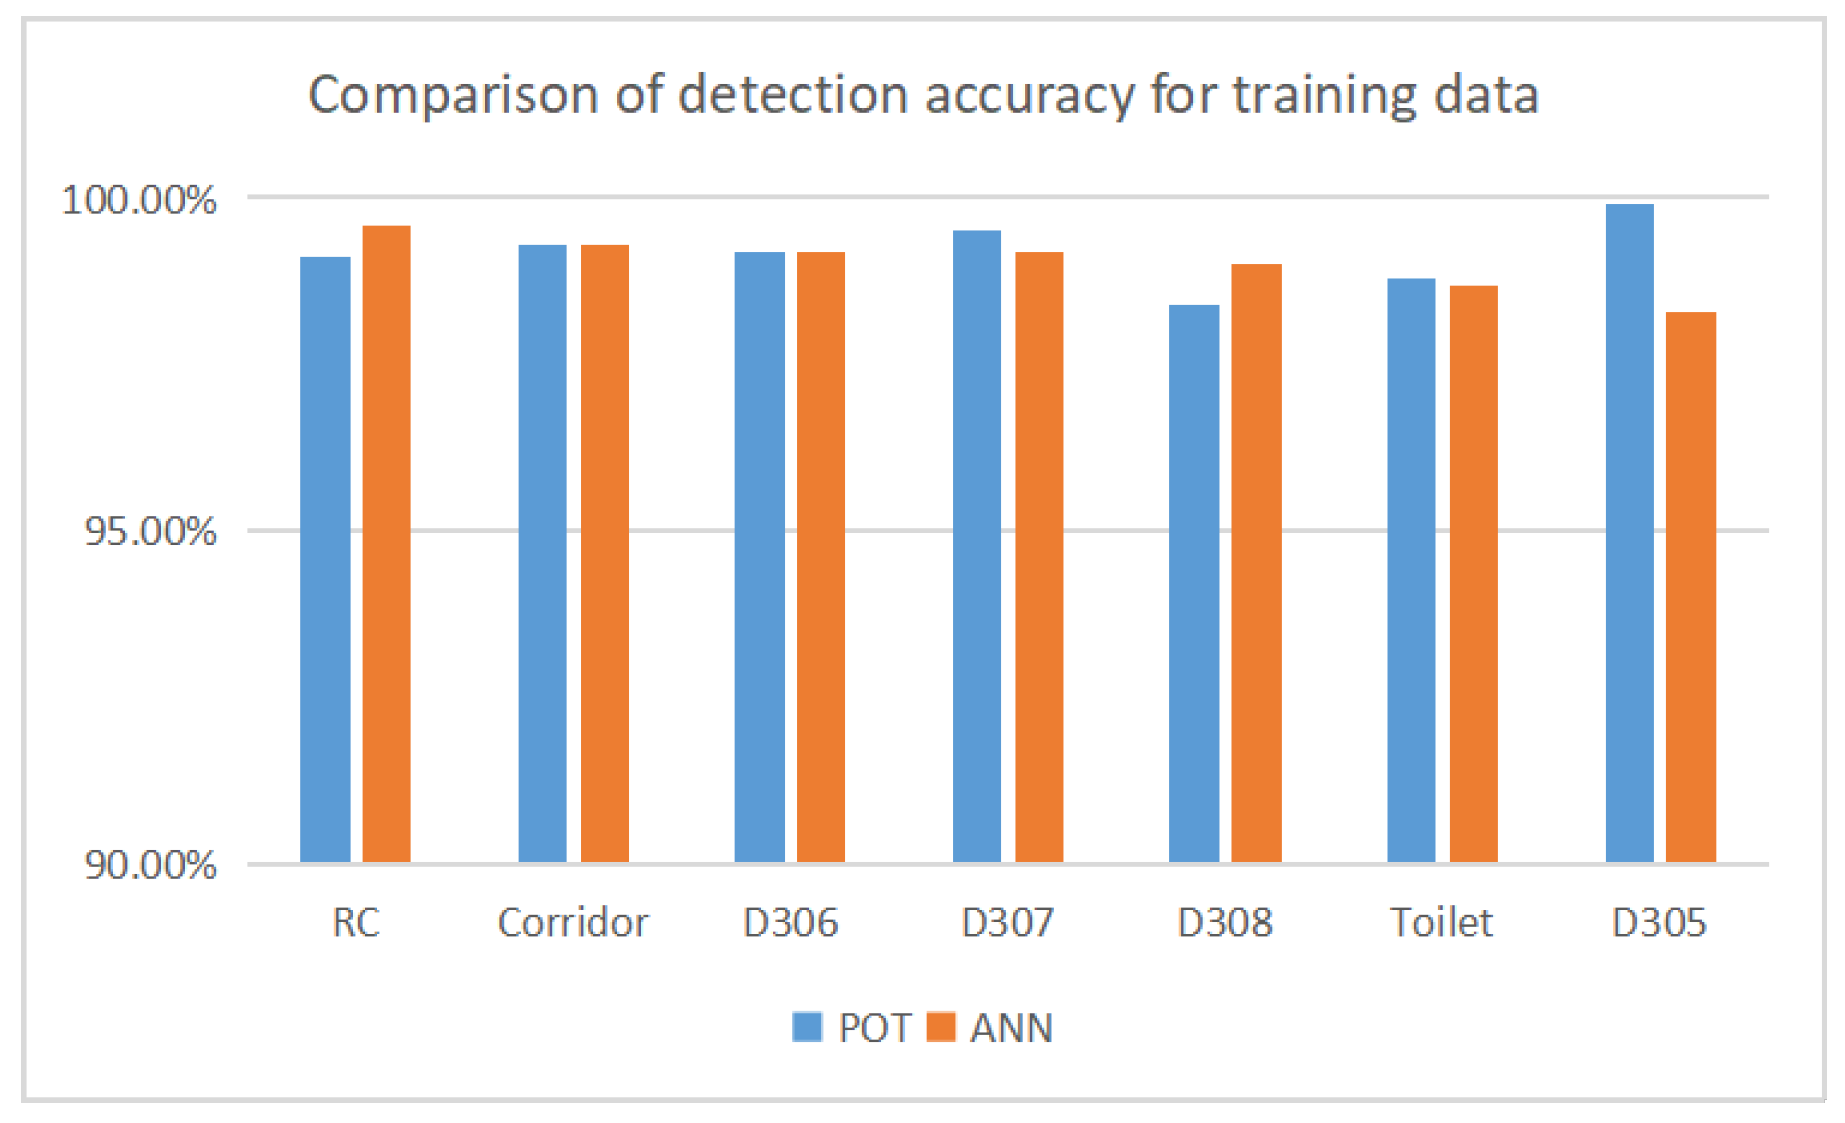
| Room | Accuracy (POT) | Accuracy (ANN) | Margin | ||
|---|---|---|---|---|---|
| RC | 99.1% | 99.6% | 40.21 | 88.53 | 48.32 |
| Corridor | 99.3% | 99.3% | 55.96 | 80.13 | 24.17 |
| D306 | 99.2% | 99.2% | 50.47 | 85.71 | 35.24 |
| D307 | 99.5% | 99.2% | 46.58 | 78.00 | 31.42 |
| D308 | 98.4% | 99% | 35.10 | 59.89 | 24.79 |
| Toilet | 98.8% | 98.7% | 40.96 | 57.32 | 16.36 |
| D305 | 99.9% | 98.3% | 26.86 | 35.31 | 8.45 |
| Average | 99.2% | 99% | 42.31 | 69.27 | 26.96 |
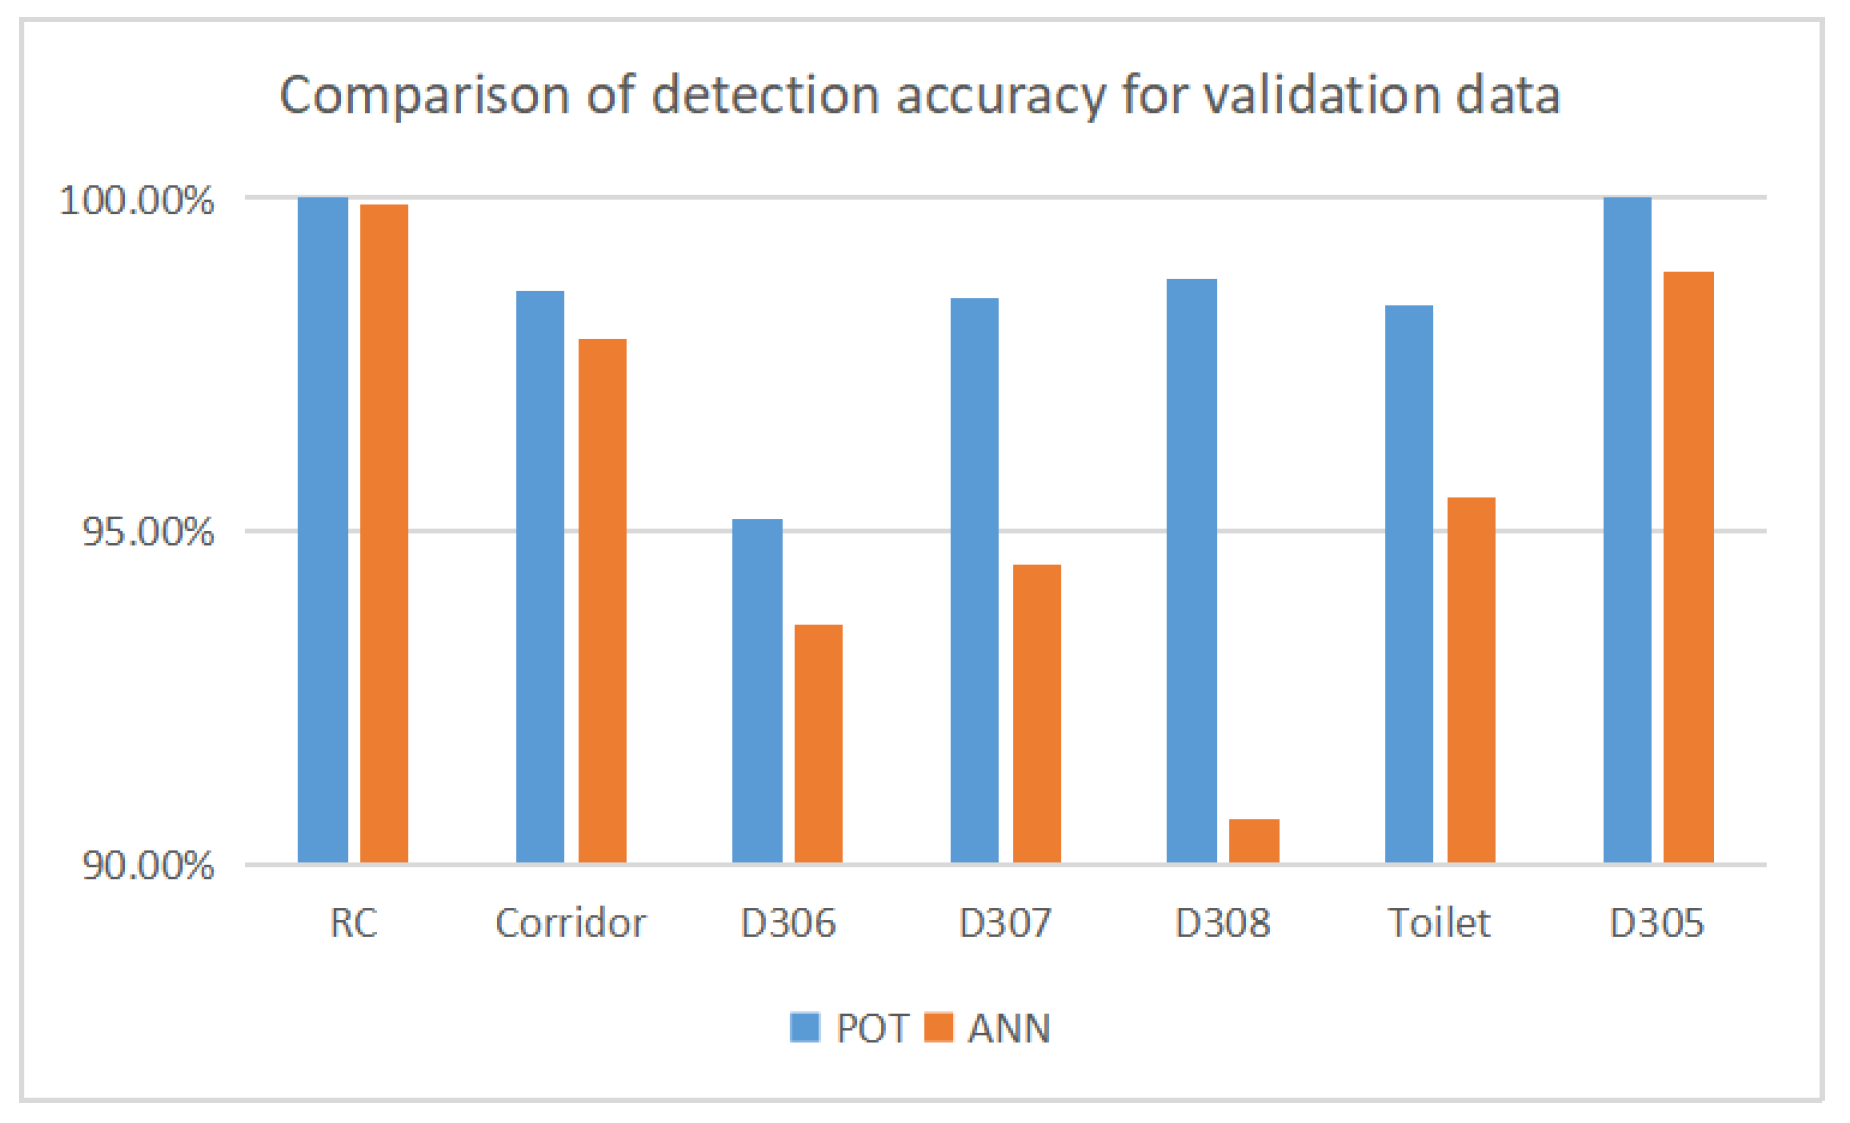
| Room | Accuracy (POT) | Accuracy (ANN) | Margin | ||
|---|---|---|---|---|---|
| RC | 100% | 99.9% | 46.42 | 68.70 | 22.28 |
| Corridor | 98.6% | 97.9% | 73.74 | 80.80 | 7.06 |
| D306 | 95.2% | 93.6% | 45.88 | 83.09 | 37.21 |
| D307 | 98.5% | 94.5% | 30.46 | 50.84 | 20.38 |
| D308 | 98.8% | 90.7% | 34.11 | 64.37 | 30.26 |
| Toilet | 98.4% | 95.5% | 29.72 | 46.01 | 16.29 |
| D305 | 100% | 98.9% | 44.20 | 48.53 | 4.33 |
| Average | 98.5% | 95.9% | 43.50 | 63.19 | 19.69 |
| Room | Periods (min) | Percentage |
|---|---|---|
| Toilet | 1∼88, 90∼91, 93∼117, 121∼936, 938, 940∼1106, 1108∼1270, 1273∼1274, 1276∼1439, 1441∼1518, 1520∼1538, 1540∼1633, 1636∼1743, 1745∼1802, 1804, 1806∼1809, 1811∼1813, 1815∼1925, 1927∼2037, 2039∼2040, 2042∼2097, 2099∼2150 | 98.8% |
| Corridor | 1275, 1539 | 0.1% |
| D307 | 937, 939, 1271∼1272, 1440, 1803, 1805, 1810 | 0.4% |
| D308 | 92, 118∼120, 2038, 2041, 2098 | 0.3% |
| D305 | 89, 1107, 1519, 1634∼1635, 1744, 1814, 1926 | 0.4% |
| Room | Periods (min) | Percentage |
|---|---|---|
| Toilet | 1∼418, 420, 422∼483, 485∼496, 499∼527, 535∼736 | 98.4% |
| D308 | 419, 421, 484, 497∼498, 528∼534 | 1.6% |
| Detected Room | Periods (min) | Percentage |
|---|---|---|
| D307 | 1∼598, 600∼941, 943∼1321, 1323∼1520, 1524∼1826, 1830∼2007, 2009∼2150 | 99.5% |
| D308 | 1828 | 0.1% |
| Toilet | 599, 942, 1322, 1521∼1523, 1827, 1829, 2008 | 0.4% |
| Room | Periods (min) | Percentage |
|---|---|---|
| D307 | 1∼323, 325∼497, 501∼540, 543∼611, 613, 615∼672, 674∼729, 731∼748 | 98.5% |
| Toilet | 324, 498∼500, 541∼542, 612, 614, 673, 730, 749 | 1.5% |
| Room | Periods (min) | Percentage |
|---|---|---|
| D306 | 1∼124, 126∼214, 216∼273, 275∼838, 840∼1108, 1110, 1114, 1116∼1411, 1415∼1441, 1443∼1719, 1723∼1881, 1883∼2150 | 99.2% |
| Toilet | 125, 215, 274, 839, 1109, 1111∼1113, 1115, 1412∼1414, 1721∼1722, 1882 | 0.7% |
| D308 | 1442, 1720 | 0.1% |
| Room | Periods (min) | Percentage |
|---|---|---|
| D306 | 1∼101, 103∼159, 161∼334, 336∼368, 372, 375∼376, 378, 380, 383, 385∼391, 396, 398, 400∼424, 433, 437∼626,628∼645 | 95.2% |
| Toilet | 102, 160, 335, 369∼371, 373∼374, 377, 379, 381, 384, 392∼395, 397, 425∼432, 434∼436, 627 | 4.5% |
| D305 | 382, 399 | 0.3% |
| Room | Accuracy (POT) | Accuracy (ANN) | Margin | ||
|---|---|---|---|---|---|
| RC | 98.1% | 97.1% | 34.09 | 65.01 | 30.92 |
| Corridor | 94.5% | 94.1% | 38.46 | 46.11 | 7.65 |
| D306 | 99.6% | 99.2% | 78.88 | 119.54 | 40.66 |
| D307 | 93.2% | 93.8% | 32.81 | 43.16 | 10.35 |
| D308 | 98.3% | 95.9% | 72.56 | 78.14 | 5.58 |
| Toilet | 99.2% | 96.7% | 42.11 | 53.8 | 11.69 |
| D305 | 99.2% | 98.3% | 37.34 | 40.59 | 3.25 |
| Average | 97.4% | 96.4% | 48.04 | 63.76 | 15.72 |
| Room | Periods (min) | Percentage |
|---|---|---|
| Corridor | 1∼88, 90∼95, 97∼104, 107∼111, 113∼205, 207∼421, 423∼540, 542∼547, 549∼556, 559∼563, 565∼806, 808∼1793, 1795∼2023, 2025∼2150 | 99.3% |
| D306 | 206 | 0.1% |
| D308 | 807, 2024 | 0.1% |
| Toilet | 96, 105∼106, 548, 557∼558, 1794 | 0.3% |
| D305 | 89, 112, 422, 541, 564 | 0.2% |
| Room | Periods (min) | Percentage |
|---|---|---|
| Corridor | 20∼71, 73∼83, 85, 89∼98, 100∼150, 153∼210, 214∼221, 223∼388, 391∼480, 482∼564, 567, 570∼571, 573∼611, 614, 616∼632, 634, 638, 650∼653, 655∼751, 753∼943, 947∼1119, 1121∼1144, 1146, 1148∼1196, 1198∼1200 | 94.5% |
| D307 | 3∼16 | 1.2% |
| D308 | 88 | 0.1% |
| Toilet | 1∼2, 17∼19, 72, 84, 86∼87, 99, 211, 222, 654, 1120, 1147, 1197 | 1.3% |
| D305 | 151∼152, 212∼213, 389∼390, 481, 565∼566, 568∼569, 572, 612∼613, 615, 633, 635∼637, 639∼649, 752, 944∼946, 1145 | 2.9% |
| Room | Periods (min) | Percentage |
|---|---|---|
| D307 | 1∼216, 218∼220, 222∼223, 225∼226, 229, 233∼236, 238∼250, 254, 256∼259, 261∼273, 275∼276, 279∼280, 282∼283, 285∼292, 300∼301, 303, 305∼307, 314, 322, 324, 326∼328, 334, 336∼348, 354∼493, 497∼498, 502∼503, 507∼584, 586, 588, 590∼605, 607∼684, 686∼704, 706∼736, 739∼766, 768∼793, 797∼814, 816∼830, 832∼835, 837∼922, 924∼1000, 1002∼1061, 1063∼1189, 1191∼1200 | 93.2% |
| D308 | 217, 221, 224, 227∼228, 230∼232 237, 251∼253, 255, 260, 274, 277∼278, 281, 284, 304, 308, 329∼330, 494∼496, 499∼501, 504∼506, 585, 589, 606, 685, 705, 737∼738, 767, 815, 831, 836, 923, 1001, 1062 | 3.8% |
| Toilet | 293∼299, 302, 309∼313, 315∼321, 323, 325, 331∼333, 335, 349∼353, 587, 794∼796, 1190 | 3% |
| Fluctuation Cause | Experiment Scenario |
|---|---|
| door open/close | • 0–20 min: open • 20–40 min: close • 40–60 min: frequently open/close |
| Wi-Fi on/off | • 0–30 min: on • 30–35 min: off • 35–60 min: on |
| human movement | • 0–20 min: three persons • 20–40 min: two persons • 40–60 min: one person |
| transmitter direction | • 0–10 min: east • 10–20 min: west • 20–30 min: north • 30–40 min: south • 40–50 min: up • 50–60 min: down |
| transmitter movement | • 0–10 min: D306 • 10–20 min: Refresh Corner • 20–30 min: D307 • 30–40 min: Corridor • 40–50 min: D308 |
| transmitter height | • 0.5 m • 1 m • 1.5 m • 1.8 m |
| Fluctuation Cause | Value | LQI1 | LQI2 | LQI3 | LQI4 | LQI5 | Accuracy |
|---|---|---|---|---|---|---|---|
| door open/close | AVE SD | 59.24 10.89 | 141.24 26.71 | 48.71 18.93 | 85.29 15.33 | 40.46 7.1 | 96.4% |
| Wi-Fi on/off | AVE SD | 57.56 14.88 | 130.85 23.96 | 52.14 9.19 | 93.3 17.2 | 49.03 11.22 | 96.7% |
| human movement | AVE SD | 64.41 17.46 | 134.01 31.67 | 60.54 3.68 | 56.05 8.22 | 21.59 13.56 | 96.2% |
| transmitter direction | AVE SD | 79.63 13.42 | 128.18 28.63 | 65 12.69 | 71.87 11.76 | 37.31 16.73 | 96.6% |
| transmitter movement | AVE SD | 38.36 43.16 | 49.09 35.58 | 46.71 27.04 | 64.82 47.5 | 47.96 30.65 | 82% |
| Fluctuation Cause | Value | LQI1 | LQI2 | LQI3 | LQI4 | LQI5 | Accuracy |
|---|---|---|---|---|---|---|---|
| door open/close | AVE SD | 90.3 2.97 | 146.41 1.6 | 53.39 5.59 | 64.67 14.71 | 40.44 6.89 | 100% |
| Wi-Fi on/off | AVE SD | 97.27 1.31 | 157.27 0.67 | 67.05 1.87 | 75.73 2.0 | 24.3 10.09 | 100% |
| human movement | AVE SD | 64.89 2.38 | 137.53 1.45 | 61.0 1.88 | 76.21 1.12 | 36.36 1.13 | 100% |
| transmitter direction | AVE SD | 78.5 14.84 | 131.35 6.25 | 48.13 17.02 | 73.16 10.27 | 38.88 15.48 | 100% |
| transmitter movement | AVE SD | 71.55 39.86 | 66.34 30.54 | 54.53 32.21 | 57.31 27.81 | 43.18 29.29 | 82% |
| Fluctuation Cause | Value | LQI1 | LQI2 | LQI3 | LQI4 | LQI5 | Accuracy |
|---|---|---|---|---|---|---|---|
| door open/close | AVE SD | 85.63 25.01 | 126.69 33.53 | 50.25 8.43 | 70.37 23.51 | 28.8 10.63 | 93.1% |
| Wi-Fi on/off | AVE SD | 85.21 14.85 | 136.65 24.23 | 70.4 2.8 | 69.62 9.5 | 47.8 1.06 | 96.8% |
| human movement | AVE SD | 72.89 9.51 | 122.55 16.38 | 73.04 1.25 | 48.04 9.0 | 7.79 8.06 | 98.1% |
| transmitter direction | AVE SD | 78.11 24.08 | 116.35 30.07 | 68.27 20.79 | 64.08 12.87 | 42.19 9.53 | 94.7% |
| transmitter movement | AVE SD | 81.74 31.28 | 71.03 23.79 | 65.3 30.57 | 65.25 24.85 | 45.46 15.89 | 88% |
| Fluctuation Cause | Value | LQI1 | LQI2 | LQI3 | LQI4 | LQI5 | Accuracy |
|---|---|---|---|---|---|---|---|
| door open/close | AVE SD | 72.02 7.03 | 150.97 10.27 | 74.91 5.52 | 90.01 7.42 | 51.42 6.3 | 100% |
| Wi-Fi on/off | AVE SD | 92.03 1.02 | 114.56 3.2 | 74.37 1.79 | 82.61 1.08 | 44.53 1.45 | 100% |
| human movement | AVE SD | 95.28 2.73 | 112.67 5.19 | 77.65 2.39 | 83.63 1.23 | 41.81 2.82 | 100% |
| transmitter direction | AVE SD | 84.09 14.88 | 120.46 18.24 | 88.66 19.51 | 74.95 15.14 | 45.62 11.86 | 100% |
| transmitter movement | AVE SD | 74.79 26.96 | 75.47 25.81 | 69.73 32.11 | 67.42 27.85 | 62.31 24.37 | 94% |
Publisher’s Note: MDPI stays neutral with regard to jurisdictional claims in published maps and institutional affiliations. |
© 2022 by the authors. Licensee MDPI, Basel, Switzerland. This article is an open access article distributed under the terms and conditions of the Creative Commons Attribution (CC BY) license (https://creativecommons.org/licenses/by/4.0/).
Share and Cite
Huo, Y.; Puspitaningayu, P.; Funabiki, N.; Hamazaki, K.; Kuribayashi, M.; Kojima, K. A Proposal of the Fingerprint Optimization Method for the Fingerprint-Based Indoor Localization System with IEEE 802.15.4 Devices. Information 2022, 13, 211. https://0-doi-org.brum.beds.ac.uk/10.3390/info13050211
Huo Y, Puspitaningayu P, Funabiki N, Hamazaki K, Kuribayashi M, Kojima K. A Proposal of the Fingerprint Optimization Method for the Fingerprint-Based Indoor Localization System with IEEE 802.15.4 Devices. Information. 2022; 13(5):211. https://0-doi-org.brum.beds.ac.uk/10.3390/info13050211
Chicago/Turabian StyleHuo, Yuanzhi, Pradini Puspitaningayu, Nobuo Funabiki, Kazushi Hamazaki, Minoru Kuribayashi, and Kazuyuki Kojima. 2022. "A Proposal of the Fingerprint Optimization Method for the Fingerprint-Based Indoor Localization System with IEEE 802.15.4 Devices" Information 13, no. 5: 211. https://0-doi-org.brum.beds.ac.uk/10.3390/info13050211