
A New Multivariate Approach for Real Time Detection of Routing Security Attacks in VANETs


1
ENSAM, Hassan II University, Casablanca 20000, Morocco
2
Faculty of Sciences, Chouaib Doukkali University, El Jadida 24000, Morocco
3
ESEF, Chouaib Doukkali University, El Jadida 24000, Morocco
*
Author to whom correspondence should be addressed.
Information 2022, 13(6), 282; https://0-doi-org.brum.beds.ac.uk/10.3390/info13060282
Submission received: 21 April 2022
/
Revised: 25 May 2022
/
Accepted: 26 May 2022
/
Published: 31 May 2022
(This article belongs to the Special Issue Automotive System Security: Recent Advances and Challenges)
Abstract
:Routing security attacks in Vehicular Ad hoc Networks (VANETs) represent a challenging issue that may dramatically decrease the network performances and even cause hazardous damage in both lives and equipment. This study proposes a new approach named Multivariate Statistical Detection Scheme (MVSDS), capable of detecting routing security attacks in VANETs based on statistical techniques, namely the multivariate normality tests (MVN). Our detection approach consists of four main stages: first, we construct the input data by monitoring the network traffic in real time based on multiple metrics such as throughput, dropped packets ratio, and overhead traffic ratio. Secondly, we normalize the collected data by applying three different rescaling techniques, namely the Z-Score Normalization (ZSN), the Min-Max Normalization (MMN), and the Normalization by Decimal Scaling (NDS). The resulting data are modeled by a multivariate dataset sampled at different times used as an input by the detection step. The next step allows separating legitimate behavior from malicious one by continuously verifying the conformity of the dataset to the multivariate normality assumption by applying the Rao–Ali test combined with the Ryan–Joiner test. At the end of this step, the Ryan–Joiner correlation coefficient (R–J) is computed at various time windows. The measurement of this coefficient will allow identifying an attacker’s presence whenever this coefficient falls below a threshold corresponding to the normal critical values. Realistic VANET scenarios are simulated using SUMO (Simulation of Urban Mobility) and NS-3 (network simulator). Our approach implemented in the Matlab environment offers a real time detection scheme that can identify anomalous behavior relying on multivariate data. The proposed scheme is validated in different scenarios under routing attacks, mainly the black hole attack. As far as we know, our proposed approach unprecedentedly employed multivariate normality tests to attack detection in VANETs. It can further be applied to any VANET routing protocol without making any additional changes in the routing algorithm.
1. Introduction
Intelligent Transportation Systems (ITSs) are one of the significant facets of a smart city used to intelligently monitor and regulate vehicle traffic by means of various communication types and networks such as Vehicular Ad hoc Networks (VANETs) [1]. VANETs are a subcategory of Mobile Ad hoc Networks (MANETs), wherein nodes are intelligent vehicles with sophisticated on-board technology and innovative features such as GPS, sensor equipment, radars, etc. Vehicles in VANETs communicate in a self-organized mode without using any fixed infrastructure support for message dissemination; this means that vehicles act as routing nodes in multi-hop mode [2]. VANETs are deployed for various reasons including minimizing the risk of car accidents, optimizing vehicle flows by reducing travel time, and avoiding traffic congestion situations. VANETs can also provide information and entertainment applications to road users. Given that VANETs are a subset of MANETs, they share all of their characteristics [3]. Nonetheless, VANETs have certain distinctive features. The first and the most problematic feature is the high and predictable mobility. Vehicles travel at high speeds and their motions are predictable as vehicles typically follow a mobility pattern regulated by road topology. Furthermore, VANETs face severe delay constraints, particularly in times of emergency when timely delivery of messages is a critical issue. Last but not least, nodes in VANETs are not limited in terms of power transmission and have high computational abilities [4]. VANETs pose many challenges due to the open and shared wireless channel, the fast movement, and the frequent disconnections of vehicles. In this study, we will mainly focus on a critical research challenge, specifically the routing security attacks [5]. We consider the black hole attack [6] which is among the most devastating attacks in VANETs. Hence, the core interest of this paper is to propose a new approach named Multivariate Statistical Detection Scheme (MVSDS) to detect routing security attacks against the AODV routing protocol by applying multivariate statistical techniques, namely the Multivariate Normality (MVN) tests [7,8,9]. In our detection approach, the first step consists of constructing the input data by monitoring the network traffic over time and measuring multiple performance metrics such as throughput, dropped packets ratio, and overhead traffic ratio. These performance indicators are highly affected when the attacks are launched [10]. The second step consists of rescaling the obtained data by applying three different rescaling techniques, namely the Z-Score Normalization (ZSN), the Min-Max Normalization (MMN), and the Normalization by Decimal Scaling (NDS) [11]. The output is modeled by a multivariate dataset used as an input by the detection scheme.
The detection step allows identifying legitimate behavior as opposed to malicious behavior by continuously verifying the conformity of the dataset to the multivariate normality assumption. We combined two methods: the multivariate normality test proposed by Rao and Ali [12] and the Ryan–Joiner univariate normality test [13]. At the end of this step, the Ryan–Joiner correlation coefficient (R–J) is computed at various time windows. The measurement of this coefficient will allow identifying the attacker’s presence whenever this coefficient falls below a threshold representing the normal critical values.
The main contributions of the present research work are summarized as follows:
- Propose a new approach capable of detecting black hole attack in real time and without performing any updates in the routing algorithm operations.
- Generate multivariate datasets by monitoring the vehicular traffic and simultaneously measuring multiple network metrics. Further, the impact of the black hole attack on these metrics is assessed.
- Detect the occurrence of attacks by continuously verifying the conformity of the datasets to the multivariate normality assumption by computing correlation coefficients and comparing them against thresholds representing the normal critical values.
- Demonstrate the relevance of employing data rescaling techniques in improving the data sensitivity to the normality conformity analysis, by comparing the outcomes of different rescaling techniques: Z-Score Normalization (ZSN), Min-Max Normalization (MMN), and Normalization by Decimal Scaling (NDS).
- Evaluate the proposed scheme using more realistic scenarios based on a realistic mobility model.
To demonstrate the applicability of the proposed approach, implementation of MVSDS with black hole attack is presented. Two scenarios are simulated: one normal AODV without attacks and a second with AODV under black hole attack. The simulation of these scenarios is conducted by combining two simulators: the road traffic generator SUMO (Simulation of Urban Mobility) [14] and the network simulator NS-3 [15]. SUMO is used to create mobility trace files based on a real map extracted from OpenStreetMap. These trace files are then used as input by the network simulator NS-3.
The findings reveal that our approach implemented in the Matlab environment [16] can detect AODV abnormal behavior in a real time by involving multiple network traffic characteristics simultaneously. It can further be applied to any VANET routing protocol without making any additional changes in the routing algorithm. The simulation results are promising since our approach needs fewer computational requirements with a high capability to analyze multiple network traffic characteristics simultaneously. As far as we know, our approach may offer an innovative solution for the detection of routing security attacks in VANETs.
This manuscript is organized into seven sections: In the next section, we introduce the background information. In Section 3, we present the related works of the previous literature. Section 4 describes the proposed approach, while the implementation details are given in Section 5. Section 6 provides an analysis of the results. Concluding remarks and future research directions are given in Section 7.
2. Background
This section is divided into four subsections. First, the AODV routing protocol is presented. Second, the functioning of the black hole attack is described. Details about the multivariate normality methods used in this study are then given. Finally, an overview of the data rescaling techniques is introduced.
2.1. AODV Routing Protocol
The Ad Hoc On-Demand Distance Vector (AODV) protocol [8] is one of the most extensively deployed reactive protocols in wireless ad hoc networks owing to the fact that it has fewer computational requirements since the route is initiated and maintained only when needed. AODV supports unicast, multicast, and broadcast communications. AODV is also loop free because it uses the destination sequence numbers, which are time stamps indicating the freshness of a route. The key mechanisms implemented in AODV are path discovery, reverse-path setup, and route maintenance.
AODV performs route discovery using two types of messages, namely the Route Request (RREQ) and the Route Reply (RREP). Whenever a source node needs to communicate data to a destination. It broadcasts an RREQ to all its neighboring nodes in an expanding ring lookup procedure until reaching the destination node or an intermediate node with a path to the targeted node. That node delivers unicast response to the source node through the RREP message in the reverse path. When the source node receives the RREP message, it starts the data transmission.
In AODV route maintenance mechanism, nodes maintain only active routes. Indeed, nodes periodically exchange HELLO messages with their neighbors in order to identify the link’s state and inform about the freshness of the path. If any link is broken during the data transmission, a Route Error (RERR) message is sent to all other nodes affected by the broken link, including the source node. When the source node receives the RERR message, it launches a new route discovery process.
2.2. Black Hole Attack
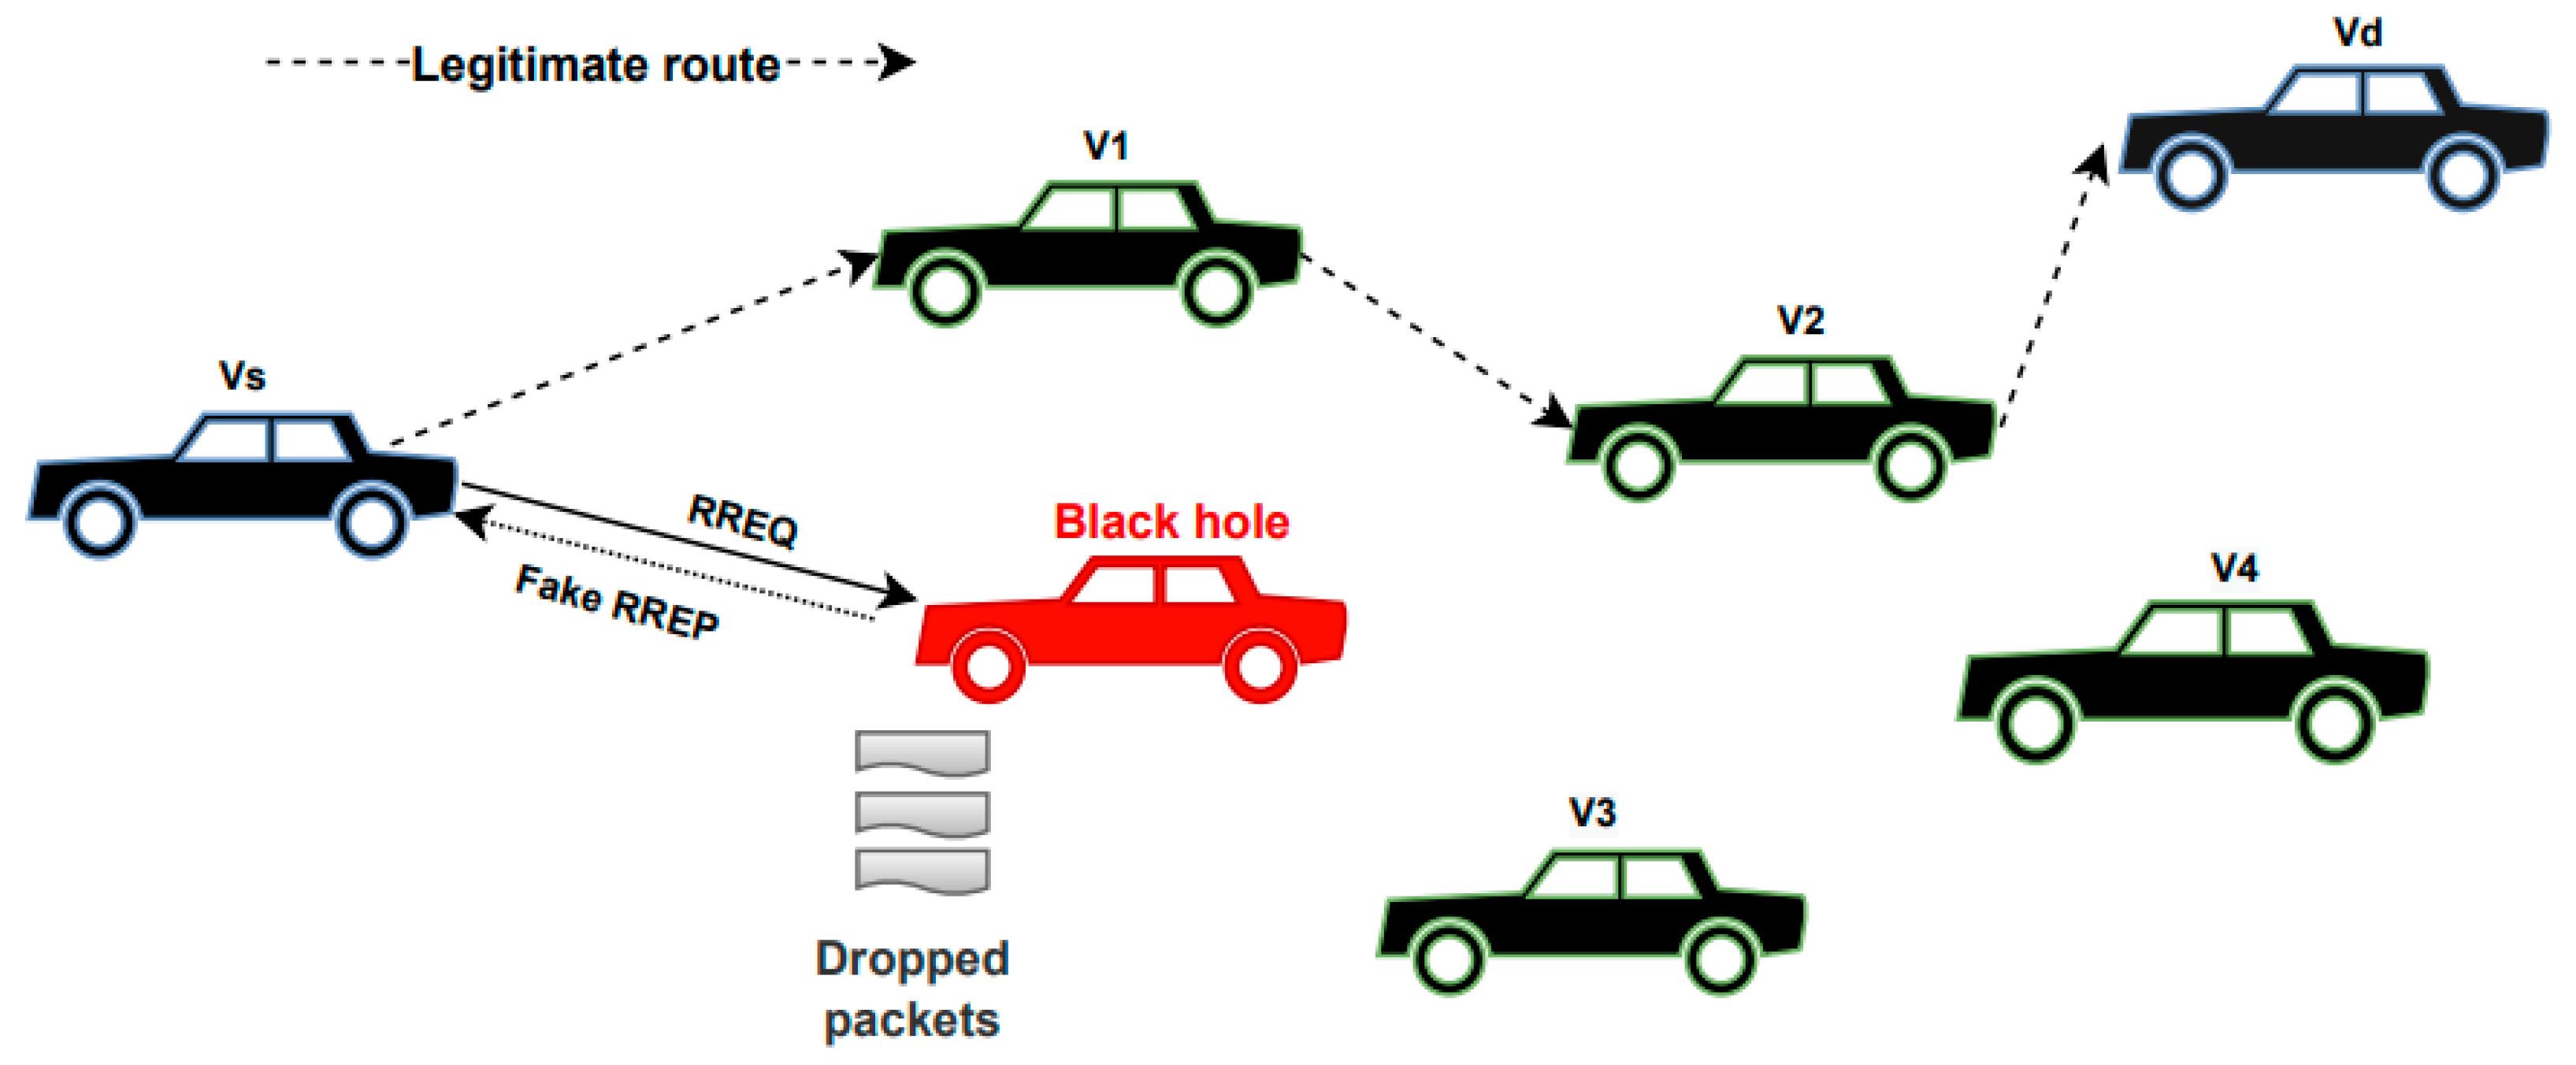
The black hole is one of the severe security attacks that may occur against the AODV routing protocol [6]. It is an active attack wherein a rogue node waits for neighboring nodes to send a route request (RREQ) message. When the malicious node receives an RREQ message, this latter, instead of forwarding discovery packets to neighboring nodes, interrupts the route discovery process by instantly sending a fake route reply message (RREP) with the maximum sequence number. Consequently, the source node presumes that route discovery is accomplished and immediately starts the forwarding of data packets to the malicious node believing that the optimal path is through this malicious node. The malicious node then captures all routing packets and drops them. An example of this attack is illustrated below (Figure 1), where node (Vs) wants to communicate with the destination (Vd). The shortest path is Vs–V1–V2–Vd, the rogue node (Black hole) claims to have the shortest path and it unicasts a fake RREP in the reverse path. Afterward, the suspected node completely drops all the data packets forwarded to it. As a result, the overall network performance degrades, and the process of information dissemination is interrupted.
2.3. Multivariate Normality Tests (MVN)
Normality tests are mainly employed in statistics to test whether the distribution of an observed dataset follows strictly or approximatively a normal distribution and to calculate the probability that a random variable underlying the dataset is normally distributed [9]. Several methods have been outlined in the literature to help assess this assumption. They can be categorized into two groups: the univariate normality tests (UVN) and the multivariate normal tests or MVN for short. The former consists of one random variable, while the second assesses whether multidimensional data made up of multiple random variables follow a multivariate normal distribution. Checking for multivariate normality assumption is an important task because instead of comparing the distribution of one variable against a univariate normal distribution, they are comparing the joint distribution of several variables against a multivariate normal distribution. However, checking the assumption of normality of multivariate data is more complex compared to a univariate one. In the statistical literature, numerous tests are available for testing multivariate normality. As far as we know, there is no standard or best test for evaluating this assumption. The three most widely used MVN tests include the Mardia test, the Henze–Zirkler test, and the Royston [9]. Details on MVN methods can be found in various review studies such as [17]. In our study, we employed the test proposed by Rao and Ali [12] which is one of the overall tests used to assess normality of a multivariate dataset. According to Rao and Ali [12], the test they proposed appears to be more sensitive than some others in the datasets they have examined. Further, it can easily transform the multivariate conformity analysis to a univariate one and enable users to have accurate results in their work.
Given a set of observations X1, …, Xn denoted by X, where each observation is described by a row vector of p variables. The dataset is thus represented by a matrix Xn × p. According to Rao and Ali, each observation vector Xi (i = 1, ……, n) is replaced by a vector defined as follows:
where S are the sample mean and variance-covariance matrix, respectively.
The authors Rao and Ali proposed to transform all the Xi’s variables to a single variable. All the N = n * p observations of the vectors Yi are considered as a sample of size N from a univariate distribution. After that, any well-known test for univariate normality can be applied to check the normality of the resulted univariate sample (Ryan–Joiner, Anderson–Darling, Kolmogorov–Smirnov tests, etc.) based on the N independent observations. Our study opted for the Ryan–Joiner univariate normality test [13]. The Ryan–Joiner test is a univariate test consisting of the calculation of the correlation coefficient between the sample data and their normal scores. A comparative study of UVN tests in favor of the Ryan–Joiner test is given in the study [18].
The Ryan–Joiner correlation coefficient is defined as follows:
or
where Yi are ordered observations with i = 1, 2, …, N, s2 the sample variance and bi are normal scores of the ordered data.
According to [13], the empirical critical values are given for different significance levels : 0.10, 0.05, and 0.01:
where N is the number of observations in the sample dataset. In our study, the significance level is α = 0.05.
2.4. Data Rescaling Techniques
Prior to applying the statistical methods cited above, it is vital to proceed to data rescaling because of the fact that input variables are measured at different scales. This might create biased data analysis. Thus, input data must be transformed or rescaled such that the effect of one attribute cannot dominate the others [11]. This implies transforming the original data to fall within a smaller or standard range such as [−1, 1] or [0, 1].
The most common normalization techniques available in literature are Z-Score Normalization, Min-Max Normalization, and Normalization by Decimal Scaling.
Let V be a numeric variable with n observed values v1, v2, …, vn.
- Z-Score Normalization
The mean and standard deviation measures are used to rescale the data such that resultant features have zero mean and a unit variance [11]. Each instance of the data vi is transformed into as follows:
where µ and σ denote the mean and standard deviation of the i-th original value of the variable V,, respectively.
- Min-Max Normalization
The min-max rescaling technique maps each value vi of V to in the range [0, 1] by computing the new value as follows:
where vi is the i-th original value of the variable V,, minV and maxV are respectively the minimum and the maximum computed over all the values of the variable V. For every variable, the minimum value of that variable gets transformed into 0 and the maximum value gets transformed into 1.
- If = minV; then = 0
- If = maxV; then = 1
- Normalization by Decimal Scaling
This technique normalizes each variable by determining its maximum value, which is equal to moving the decimal points of the instance values. The approach is appropriate for data with logarithmic variations in variables [11].
Each instance vi of the given data is rescaled into as follows:
where .
In our study, we applied these three techniques to the original data generated in our study and their outcomes are compared [11].
3. Related Works
Numerous studies in the literature have proposed methods to detect and countermeasure the black hole attack in VANETs. In one paper [19], a secure version of the AODV routing protocol was evolved to detect the black hole attack, relying on improvements of the RREQ and RREP routing packets. Further, cryptography function-based encryption and decryption were included to check the legitimacy of the source and the destination nodes. The reliability of the proposed approach was tested in terms of the following performance metrics: drop packets, end-to-end delay, packet delivery ratio (PDR), and routing request overhead. The researchers outlined that their proposed algorithm outperformed the original version of AODV. However, the improved version suffers from higher overheads and requires modifications of the AODV routing protocol‘s current version. Authors of [20] presented an intelligent scheme for black hole attack detection called IDBA that uses four main parameters: the sequence number, the hop count, the packet delivery ratio, and the end to end delay. First, an algorithm was proposed to pre-calculate the so-called thresholds regarding the future actions of the black hole based on the two first parameters, while a second algorithm was presented to compute thresholds for the two other performance metrics. The detection process floods alarms whenever these parameters are out of the predefined thresholds. The proposed IDBA was compared against AODV under black hole, Intrusion Detection System, and EAODV algorithms and showed its outperformance.
A new approach for protecting VANET from black and gray hole attackers was developed in [21] named dual attack detection for black and gray hole attacks (DDBG). The suggested DDBG method employs the connected dominating set (CDS) method and two extra characteristics: the energy and the node’s absence from the blacklist. The CDS technique is an efficacious, distinct, and confined method for recognizing nearly connected dominating sets of nodes within a small range. The selected IDS nodes broadcast a kind of status packet inside a size of the dominant set in order to obtain complete behavioral information from their nodes. Later, IDS nodes utilize the DDBG approach to examine the behavioral data obtained to identify malicious nodes and put them on the blacklist if the activity is suspicious. The authors of [22] suggested a novel IDS to detect black hole attack in mobile ad hoc networks based on a hybrid approach that makes use of both Adaptive Fuzzy Neuro Inference System (ANFIS) and Particle Swarm Optimization (PSO). The PSO is used to increase the efficiency of ANFIS by changing the membership functions and then reducing the error. The ANFIS predictions allow the attacker’s future behavior to be modeled and detected. A database is extracted from the network by creating a neighbor table, which captures all the neighbors’ activities. Afterward, the input parameters are calculated using this database. The authors used NS-2 simulation to demonstrate the effectiveness of their approach.
Authors of [23] proposed a heuristic strategy for identifying black hole attacks in MANETs. The approach is based on a fake RREQ message format similar to RREP, which is frequently employed to transmit faked packets in the AODV route discovery mechanism. Hence, a black hole is entrapped by replying to the requested fake destination IP address, which never existed in the network. This allowed for the identification of single and cooperative black hole intrusions.
In their paper [24], the authors presented a new intrusion detection system (IDS) for mitigating black hole attack. This solution, based on the two algorithms Integrated Cross Interio (ICI) and Preset Time Interval Algorithm (PTIA), enables the security of routing nodes by eliminating malicious activities. One of the most challenging tasks is to reduce routing costs while improving performance by reducing reaction time.
Another study [25] proposed an innovative clustering algorithm (CH election algorithm) and an intrusion detection framework based on game theory. By establishing stable vehicular clusters with greater communication among member vehicles, the proposed clustering technique maintains the IDS framework’s stability. After that, strategies for electing the CH and a collection of agent nodes for each cluster are used. In order to conduct the intrusion detection operation in a distributed manner, the proposed IDS architecture employs agent nodes, CHs, and RSUs operating at three distinct levels of the vehicular network.
In [26], researchers introduced a new algorithm consisting of three stages for detecting black hole. In the first stage, RSU serves as a certificate authority (CA) which keeps and provides a public and private key as well as certificates for the vehicles. Before launching any communication, vehicles must be approved by the RSU. The source transmits afterward the RREQ along with the correct certificate, nonce encryption, and the destination’s public key.
Authors of [27] implemented a modified version of the AODV routing protocol named SVODR to detect and mitigate the black hole attack in VANETs. They introduced a modified structure of both the RREQ and the RREP control packets by incorporating an Encrypted Random Number to the source and destination. A legitimate destination node is tested using the destination vehicle packet sequence number and the function (encryption/decryption) performed by the source or destination vehicle. Researchers tested the efficiency of their solution by conducting a comparison study with IDS in VANET.
In Table 1, we summarize various proposed detection techniques with regard to black hole attack.
4. The Proposed Detection Scheme
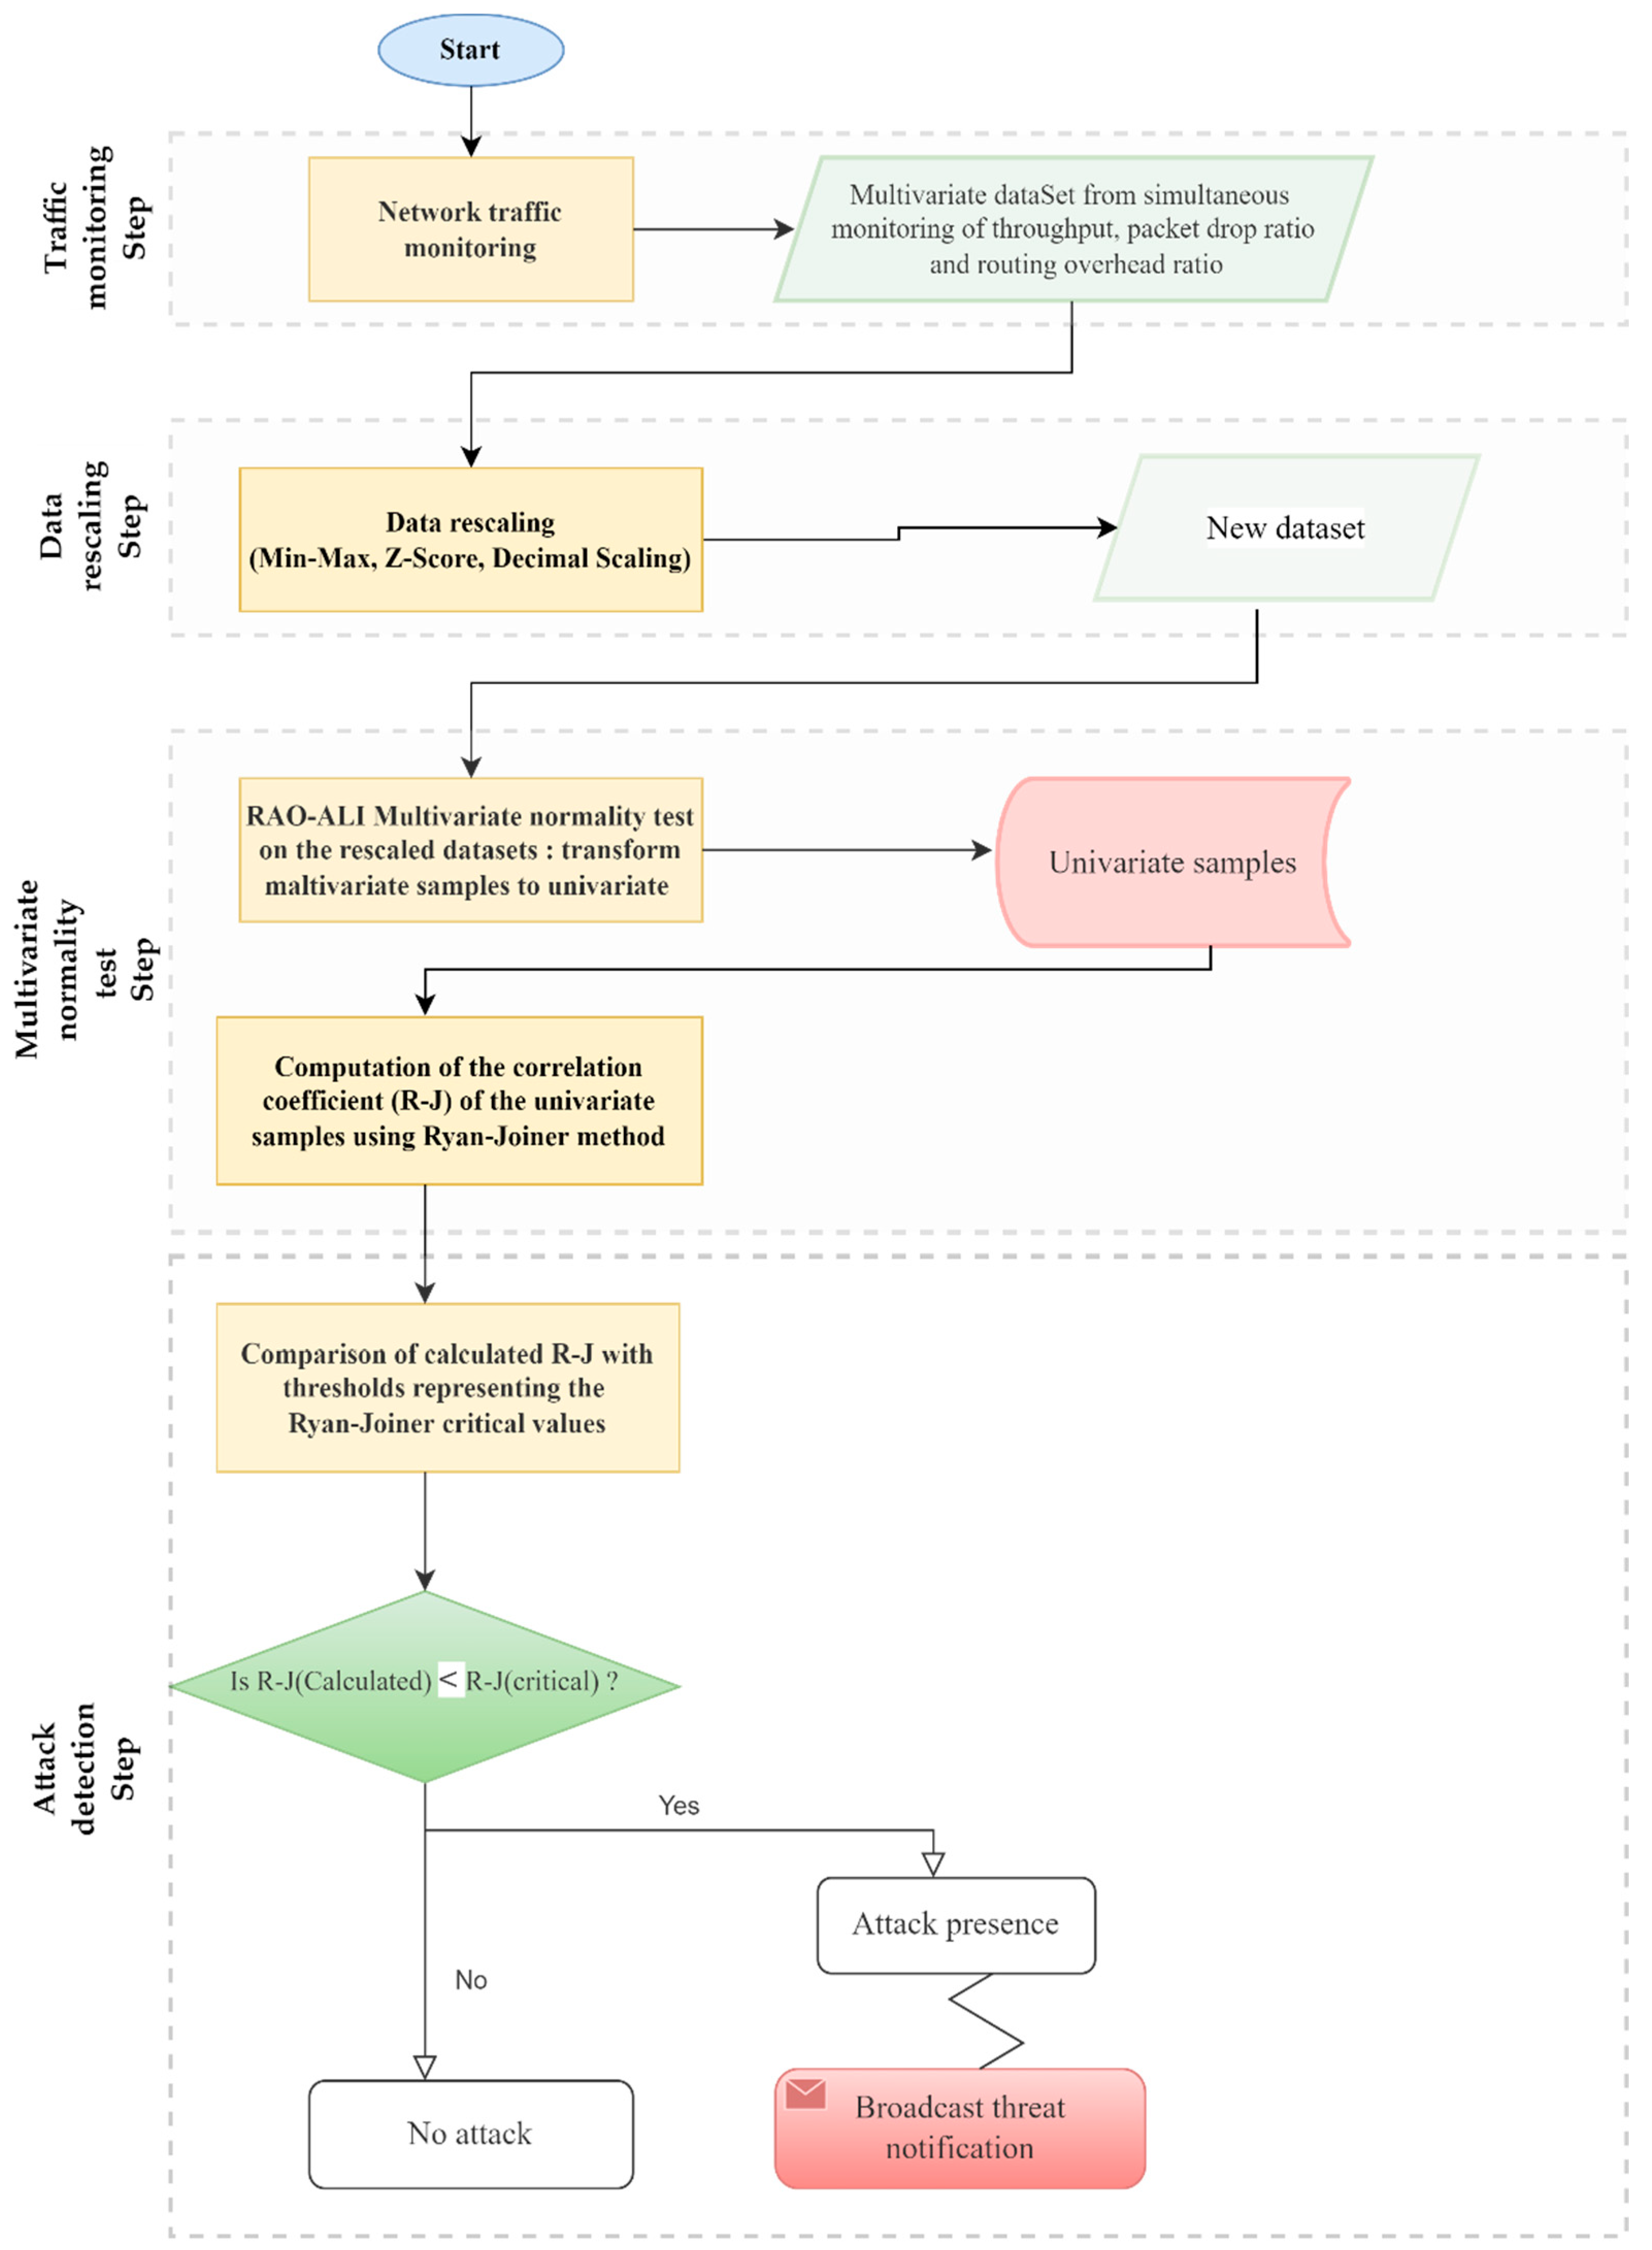
This section describes the proposed approach called Multivariate Statistical Detection Scheme (MVSDS) for detecting routing security attacks in VANETs by using statistical techniques based on multivariate normality (MVN) tests. Indeed, our proposed detection approach allows separating legitimate behavior from malicious behavior by following four main steps explained below and depicted in Figure 2.
4.1. Step 1: Real Time Traffic Monitoring
Our proposed approach is based on the idea that malicious activities have performance characteristics that are significantly different from the normal ones. Thus, the first step of our approach consists of constructing the input data by monitoring the vehicular network traffic over time. This monitoring system is deployed in every receiving node and consists of the measurements of three key traffic metrics, namely throughput, dropped packets ratio, and overhead traffic ratio.
4.2. Step 2: Input Data Rescaling
The process of constructing the data used in our detection scheme starts with capturing the network traffic and ends with the data rescaling step. At this stage, the three rescaling techniques, namely the Z-Score Normalization (ZSN), the Min-Max Normalization (MMN), and the Normalization by Decimal Scaling (NDS) are applied to compute the new values of each variable contained in the original data. The output data get updated continuously over a certain time interval. The generated data are modeled by multivariate datasets sampled at different times.
4.3. Step 3: Multivariate Normality Test
The goal of this stage is to verify the conformity of the dataset to the multivariate normal distribution by applying the Rao–Ali multivariate statistical test. Indeed, the multivariable samples obtained from the previous step are transformed to univariate samples for each time window. The resulting datasets are one dimension that will be used as input by the UVN normality test, namely the Ryan–Joiner test. Hence, the Ryan–Joiner is employed to compute the R–J correlation coefficient in each time window continuously. Based on the values of this correlation coefficient, the attack detection step is performed.
4.4. Step 4: Attack Detection
In the previous step, the Ryan–Joiner test is applied to measure the R–J correlation coefficient. The values of this correlation coefficient will allow us to determine the probability that an attacker is present or not, so that observations with R–J values that fall below a threshold value representing the R–J normal critical value will identify an abnormal behavior. The threshold values are computed using formulas in Equation (4), Equation (5), or Equation (6) given in Section 2.3.
- -
- If , the assumption of normality is approved and consequently, we can conclude the absence of malicious behavior.
- -
- If , the normality assumption is rejected and we detect the existence of a routing attack. A notification is generated as soon as the R–J coefficient value is below the pre-defined threshold corresponding to Ryan–Joiner the critical values.
5. Simulation Setup and Implementation
5.1. Simulation Setup
The purpose of this sub-section is to present the details of the simulation environment. In this study, we conducted realistic VANET simulations by combining two simulators: the road traffic generator SUMO (Simulation of Urban Mobility) and the network simulator NS-3. SUMO and NS-3 are used to simulate realistic VANET scenarios.
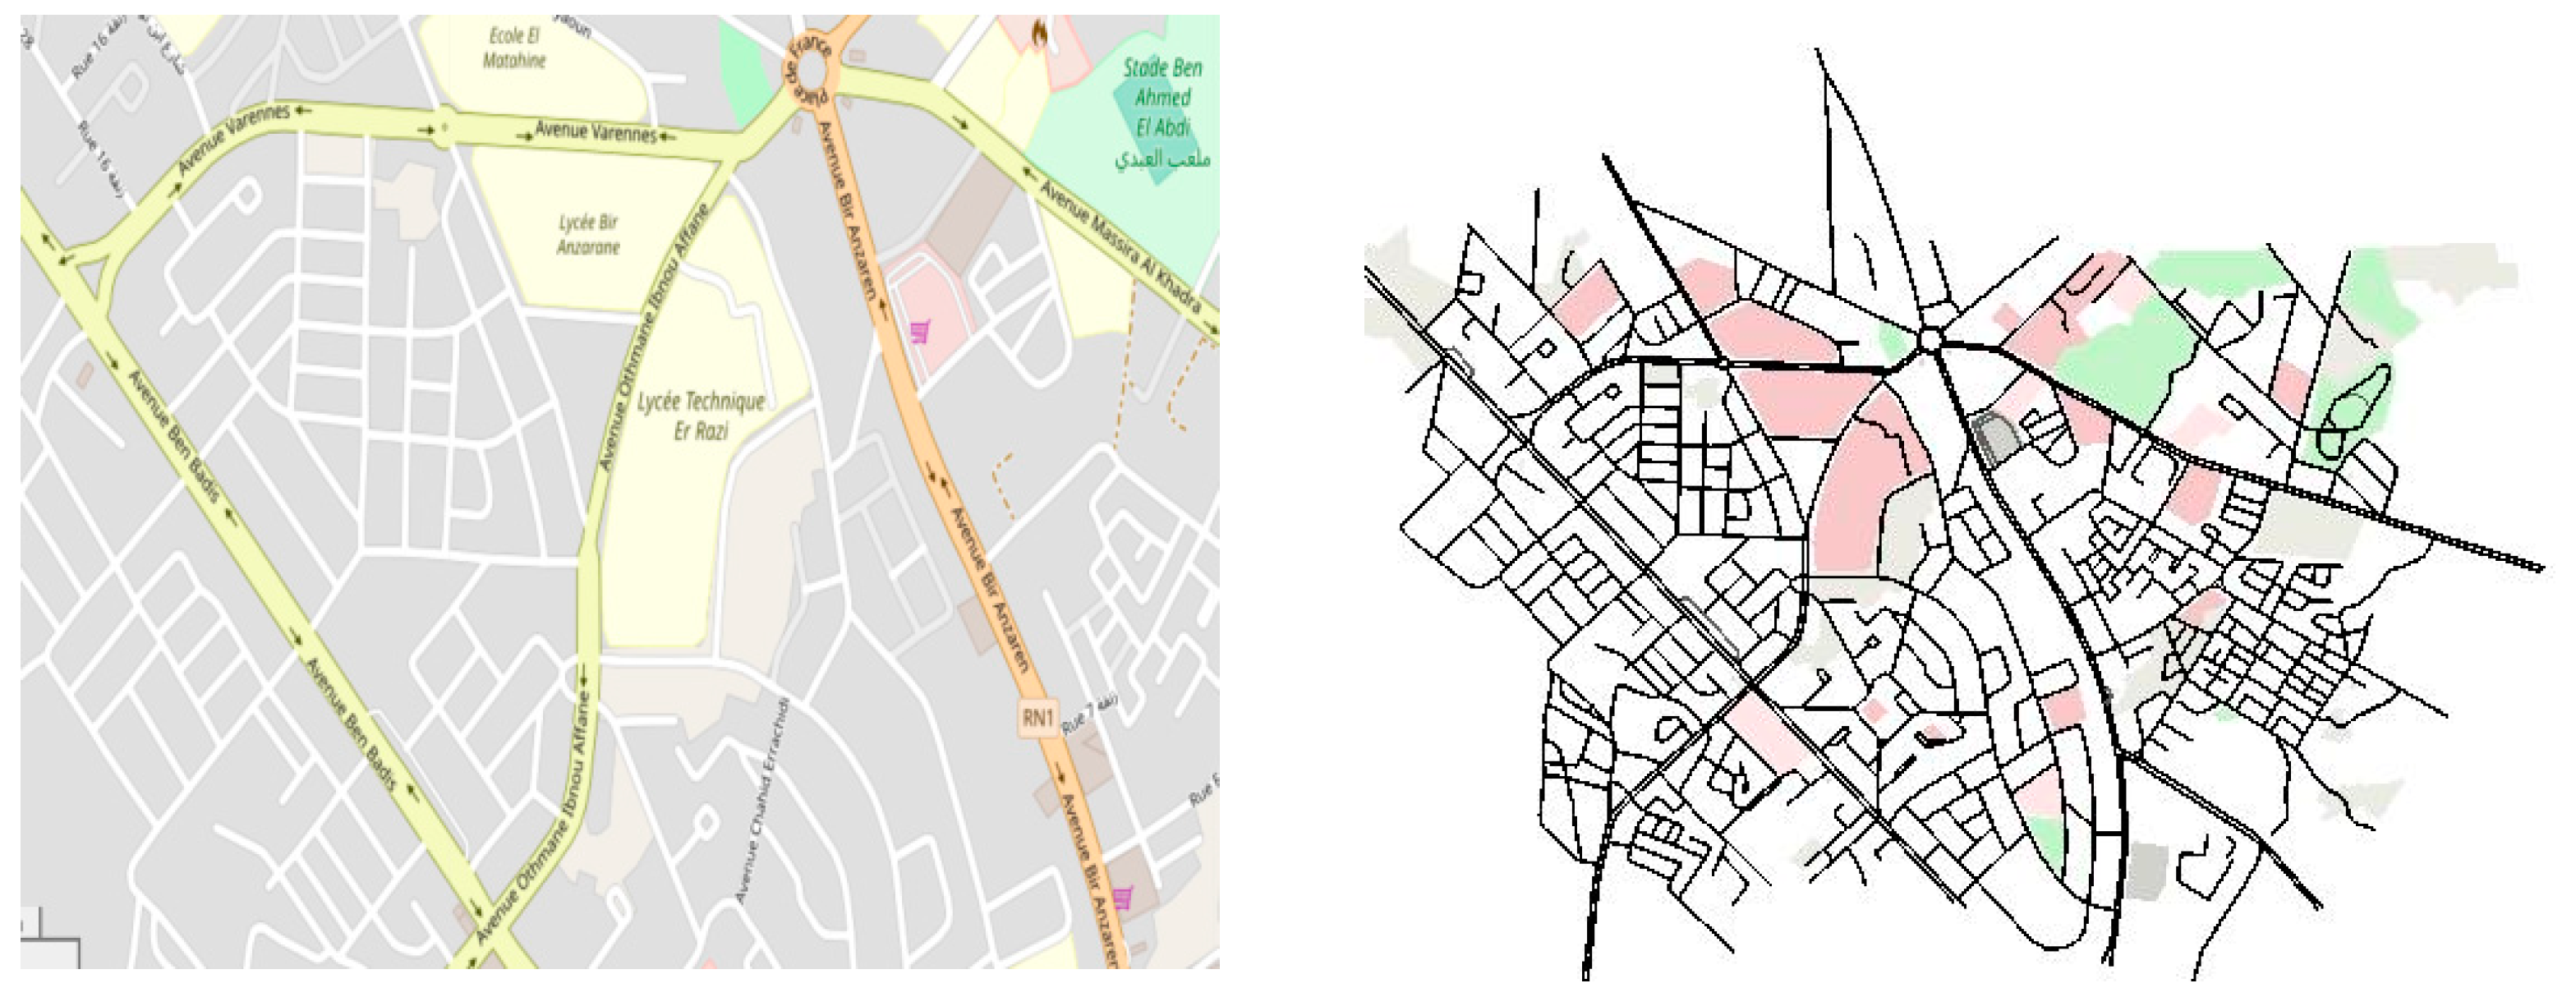
SUMO is a free, open, and microscopic simulator implemented in C++. It is used to simulate unlimited network size and number of vehicles. It offers the ability to configure vehicle types, traffic lights, vehicle speeds, and multi-lane roads; it also supports the lane-changing model, as well as generating automatic time schedules for traffic lights. SUMO also supports the import formats, such as OpenStreetMap. We executed a set of Python command lines on SUMO in order to generate realistic vehicle trace files that are then used as an input by the network simulator, NS-3. In our study, the simulation zone was extracted from OpenStreetMap, consisting of a map of El Jadidacity, Morocco given in Figure 3. The .osm file generated is interfaced to SUMO to get the mobility.tcl file with details of each node (vehicle), including the number of vehicles, position, speed, and direction.
Based on Linux, the system is set up and configured in Ubuntu environment. The simulation parameters are tabulated in Table 2.
In what follows, we explain the various parameters depicted in Table 2 used in performing VANET scenarios to evaluate the proposed detection scheme in the next sections.
Our simulations are implemented using version 3.29 of the simulation environment NS-3. The 802.11p standard is used on the MAC/PHY sub-layers, and the channels are modeled using the YansWiFiChannel with friisLoss propagation model. The transmission power is fixed to 33 dbm. The simulations run for 100 s with a total of 100 vehicles distributed over the imported simulation zone. Ten source nodes simultaneously generate Constant Bit Rate (CBR) traffic with fixed size packets of 1024 Bytes. Packets are routed using AODV routing protocol. Further, User Datagram Protocol (UDP) is used as the transport layer protocol.
5.2. Implementation of the Proposed Scheme
The first step in our detection scheme lies on the network traffic monitoring where the following traffic parameters are used:
- The throughput (TH) expressed in kilobits per second (Kbps), which is defined as a measure of the total amount of bytes successfully transmitted from source node to destination per unit time.
- Dropped packets ratio (DPR) defined as the ratio between the numbers of dropped packets to the total number of transmitted packets.
- Overhead traffic ratio (OTR) which refers to the ratio between the total number of control packets generated by the AODV routing protocol during route discovery and route maintenance to the total number of transmitted packets.
We monitor the network traffic over a time interval fixed at one second (1 s), and measure the three metrics, i.e., throughput, dropped packet ratio, and overhead traffic ratio denoted by TH, DPR, and OTR respectively. These measurements are collected and tabulated in CSV files, which are later converted into the form of datasets used by the Matlab environment. The generated multivariate datasets are raw data where columns represent the measurements of the variables TH, DPR, and OTR during the simulation time and rows are observations of these variables.
The rescaling techniques (ZSN, MMN, and NDS) are applied to compute the new values of each variable denoted by (NewTH, NewDPR, and NewOTR). The datasets are sampled at different times separated by time window (tw). In practice, we consider tw = 5 s; this means that his process is triggered continuously, i.e., at T = 10 s, T = 15 s, T = 20 s, T = 25 s, etc., where the datasets correspond to the T last collected samples.
The multivariate normality test, namely the Rao–Ali multivariate statistical test, is employed to transform the multivariable samples to univariate ones. Afterwards, the Ryan–Joiner test is applied to measure the R–J correlation coefficient. The values of this correlation coefficient allow us to determine the probability that an attacker is present or not, so that observations with R–J values that fall below a threshold value representing the R–J normal critical value identify an abnormal behavior. The threshold values are computed using formulas in Equation (4), Equation (5), or Equation (6) given in Section 2.3 with chosen as the significance level.
The calculations are performed using a program that we have implemented in the Matlab environment. This program takes as an input the dataset retrieved from the previous step (step 2) and calculates the observed values of the R–J coefficient using formulas in Equations (2) and (3). Based on the results of step 3, the presence of an attacker is detected whenever the R–J values fall below a threshold value representing the R–J normal critical values with .
6. Results and Discussion
This section starts with an analysis of the influence of black hole attack on the considered network metrics mainly: throughput (TH), dropped packets ratio (DPR), and overhead traffic ratio (OTR). Further, an evaluation of the proposed scheme is performed by simulating two scenarios of AODV routing protocol: one normal AODV without attacks and a second with AODV black hole attack. Analysis and discussion of the obtained results are also presented.
6.1. Analysis of the Network Traffic under Black Hole Attack
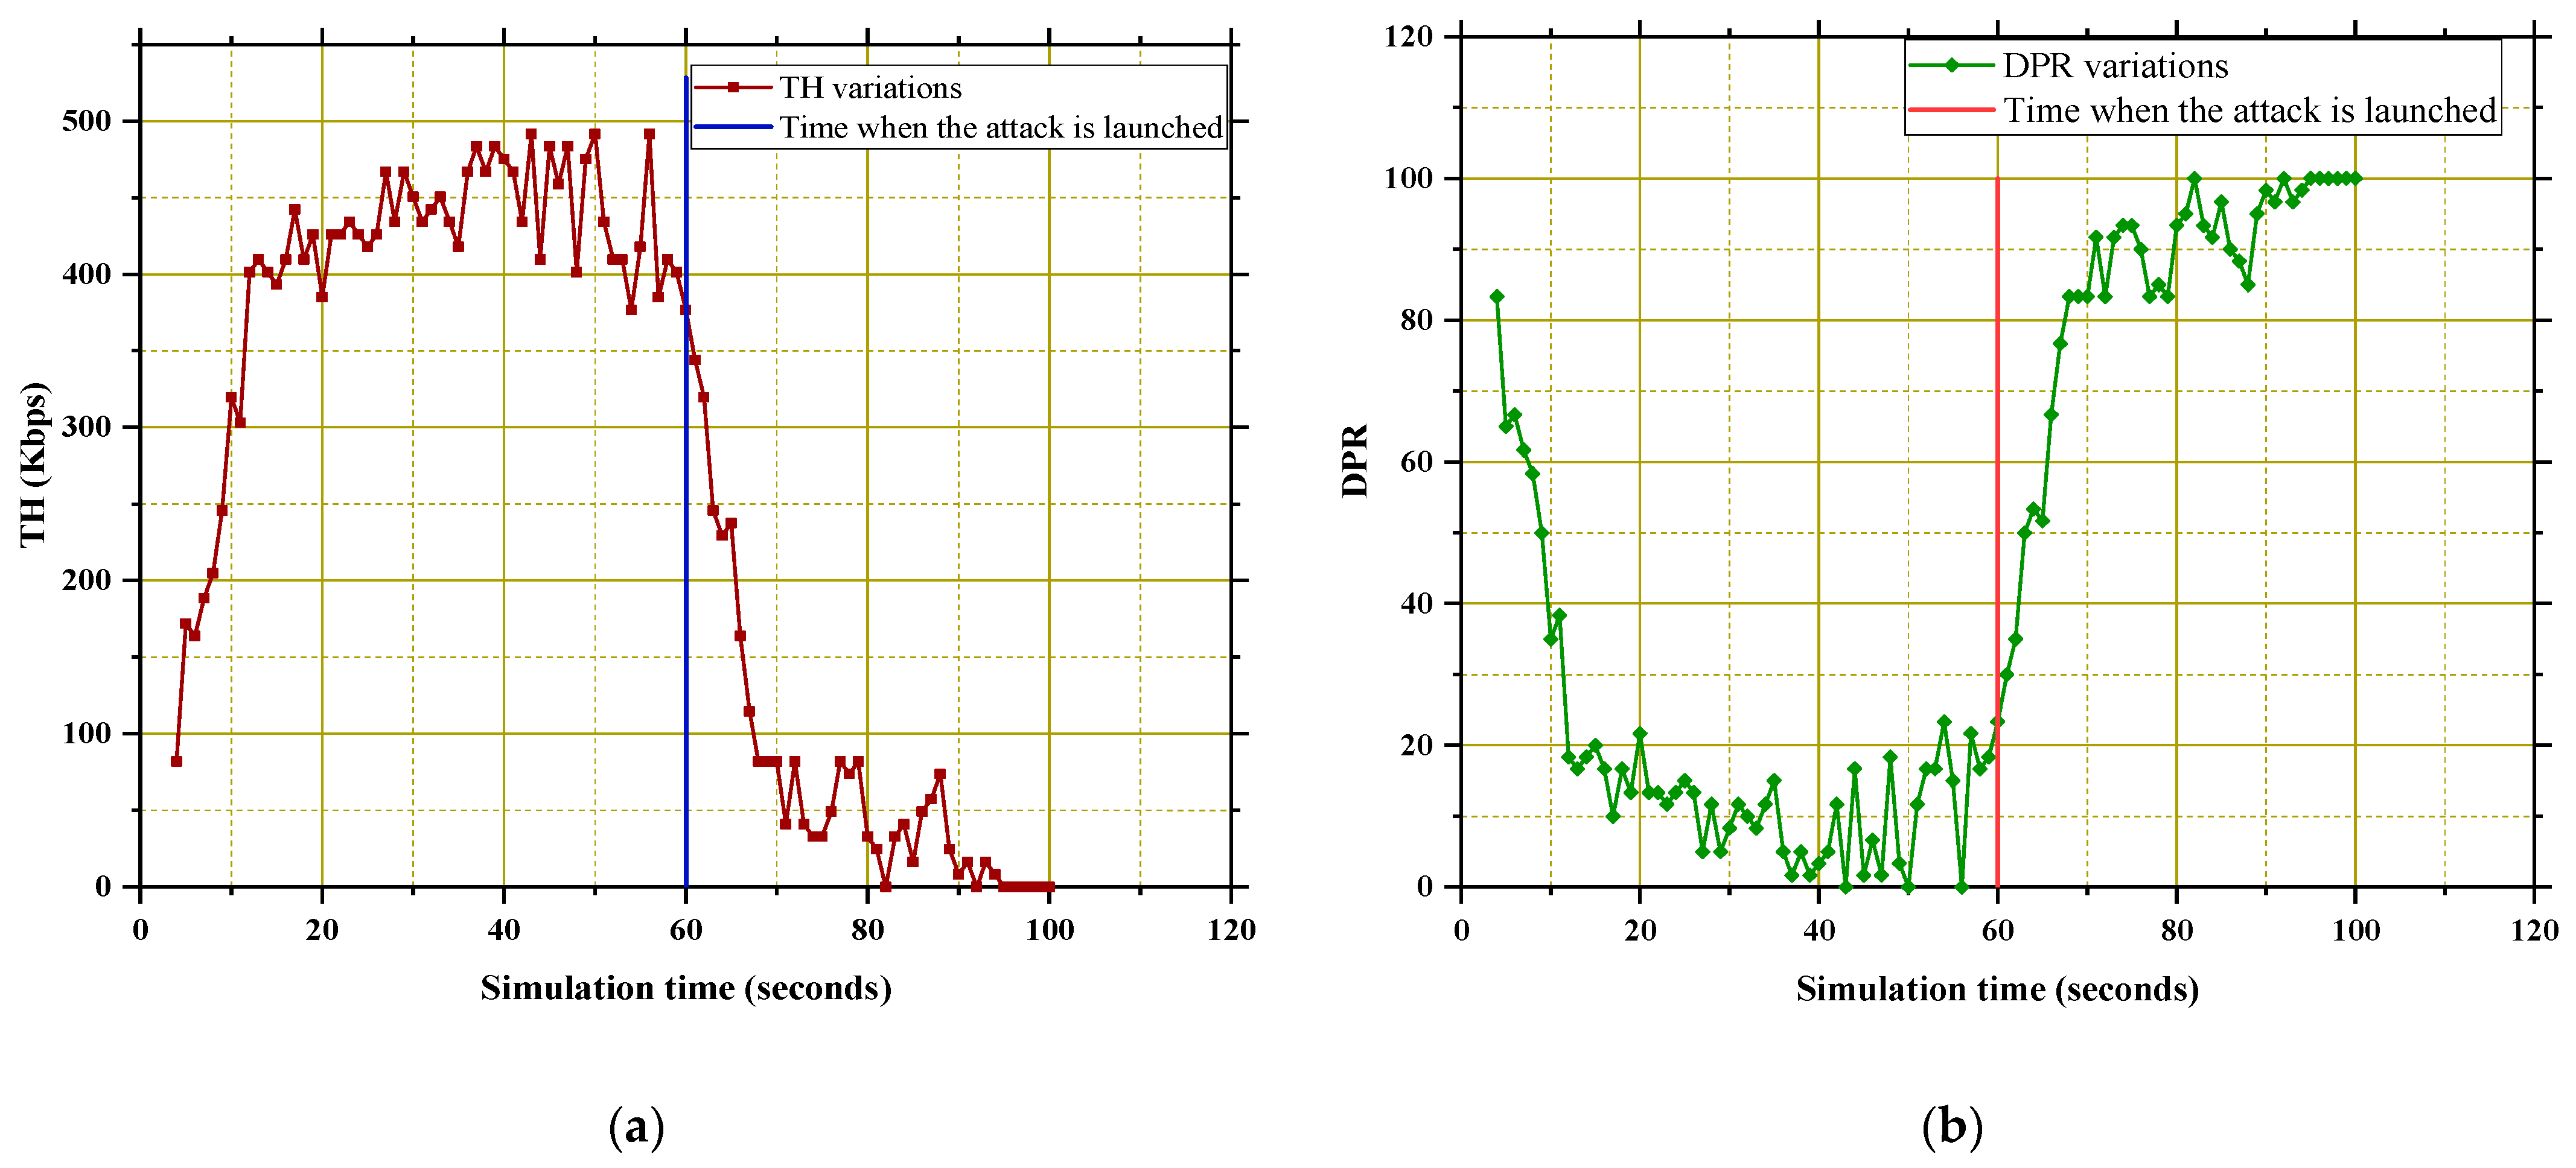
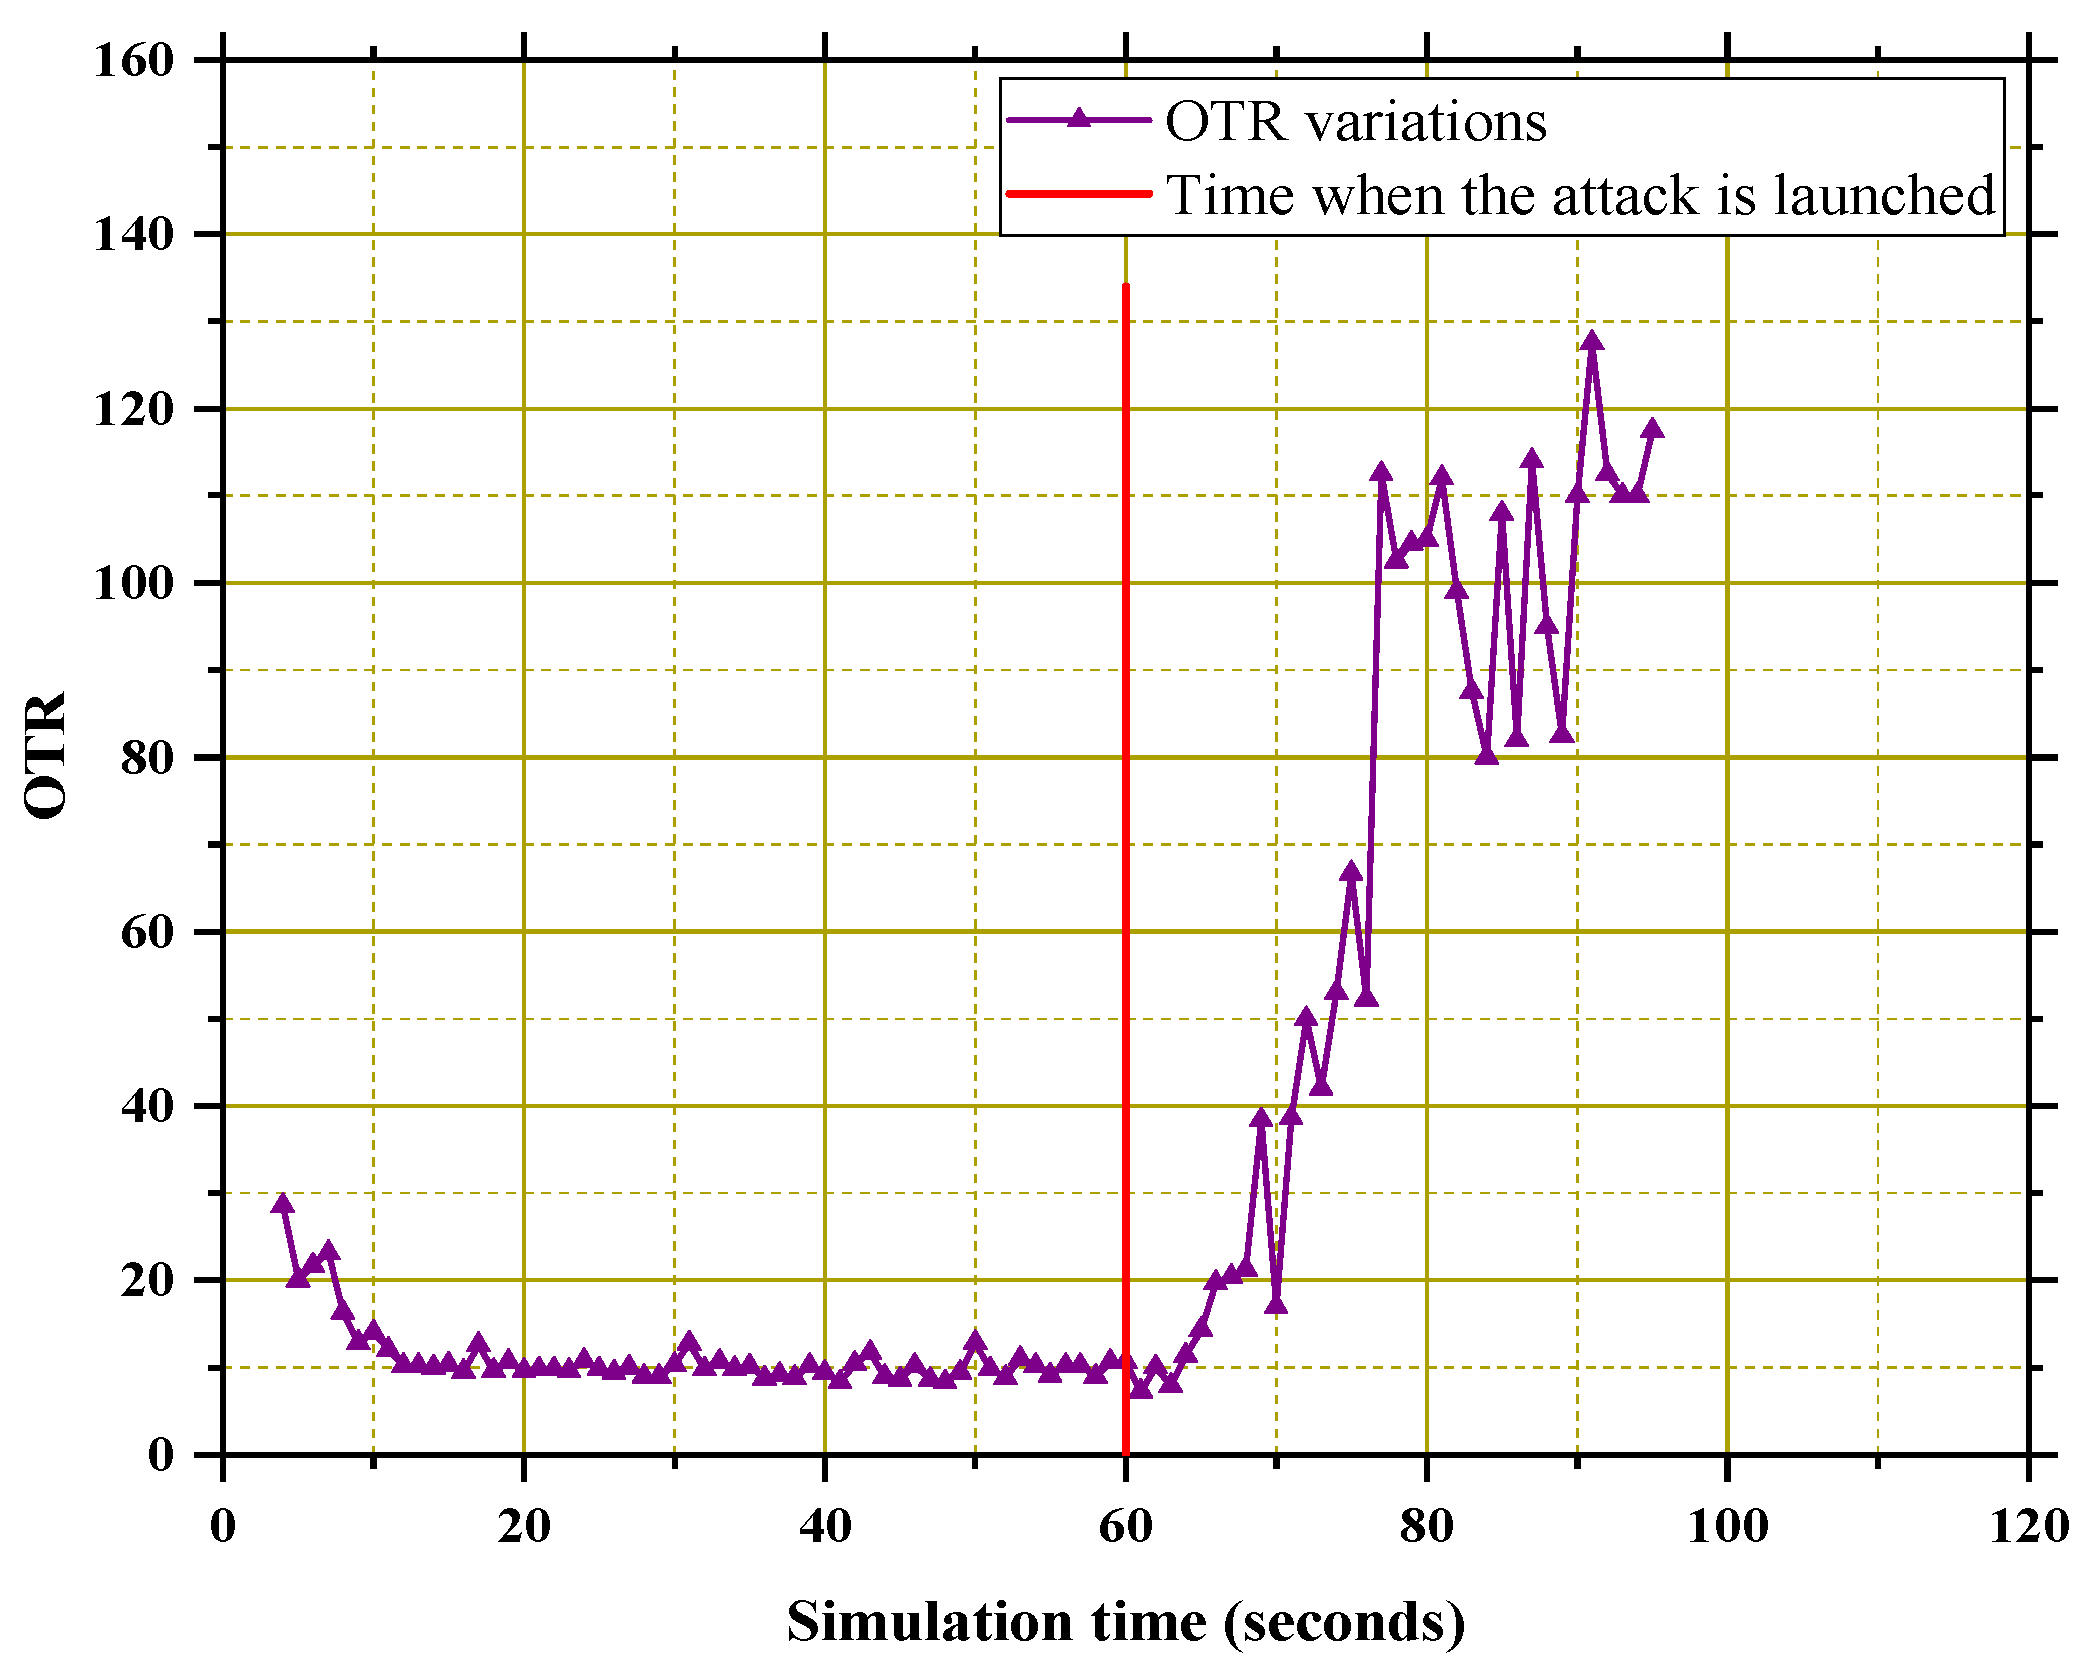
In this part, we simulated a scenario of AODV routing protocol using the simulation settings defined in the previous section (Table 2). In this scenario, 100 vehicles are involved with 10 random CBR connections over a simulation duration of 100 s. This scenario is divided into two parts. In the first part, i.e., from the simulation start time until the sixtieth seconds, all vehicles behave normally with no malicious activities. During the second part of this scenario, one malicious node is activated at the sixtieth second which is concerned with the black hole attack. The results of the traffic monitoring in terms of throughput (TH), dropped packets ratio (DPR), and overhead traffic ratio (OTR) before and after initiating the black hole attack are given in Figure 4 and Figure 5.
Figure 4 and Figure 5 illustrate the results of monitoring the network traffic regarding the three performance metrics considered in this study. Figure 4 shows the throughput variations per unit time and the dropped packet ratio, respectively. While Figure 5 depicts the overhead traffic ratio. Each figure shows how each performance metric varies per unit of time in both cases: the normal case and when the black hole attack is launched.
Examining these figures, we notice that the network characteristics are generally stable in the normal case (absence of black hole attacker). The small differences recorded are due to the dynamic environment and the high mobility of vehicles in VANETs. In contrast, these characteristics change significantly when the black hole attack is initiated. Indeed, we observe that the AODV routing protocol performance in terms of throughput degrades under the black hole attack. This degradation shows that most data packets have not been successfully transmitted from source to destination. These outcomes are logical since in the black hole attack, the malicious node acts by sending a fake route reply pretending to have the shortest path to the destination and subsequently drops the entire data packet forwarded to it. Similarly, in Figure 5, it can be seen that the dropped packet ratio increases severely from the time the attack is launched. Again, these variations are explained by the presence of the attacker node that tries to drop all the packets rather than delivering them to their intended destination. The variations in Figure 6 reveal a noticeable increase in the overhead traffic ratio after launching the attack in the sixtieth second compared to the normal situation. This finding can be justified by the fact that the number of successfully transmitted packets is lower than the number of routing control packets generated by the AODV routing protocol under black hole attack. As a result, the values of the overhead traffic ratio, which is defined as the ratio between the total number of control packets generated by the AODV routing protocol during route discovery and route maintenance to the total number of transmitted packets goes up. Conclusively, we can say that black hole attack severely affects the AODV performances and disturb the correct execution of the routing operations. These findings cope with our previous study [10], where it was confirmed that AODV performances are highly influenced by the introduction of routing attacks against AODV routing protocol.
6.2. Evaluation of the Proposed Scheme
In this part, the purpose is to evaluate the proposed approach and demonstrate its applicability to the AODV routing security attack in VANETs. We consider two different scenarios of the AODV routing protocol (scenarios 1 and 2):
- Scenario 1: normal AODV without attacks
In this case, the experiments are performed according to the simulation parameters exhibited in Table 2. The total vehicles involved are 100 vehicle nodes comprising 10 random source–destination pairs. These pairs simultaneously generate CBR traffic with fixed size packets of 1024 Bytes. Packets are routed using normal AODV routing protocol. In this way, all nodes are legitimate vehicles and no black hole node has been taken. The total time for the simulation was configured to 100 s.
- 2
- Scenario 2: AODV with black hole attack
In this simulation scenario, we implement one malicious node that acts as the black hole attacker. The remaining nodes are legitimate vehicles that behave normally and broadcast genuine messages to the other vehicles in the network.
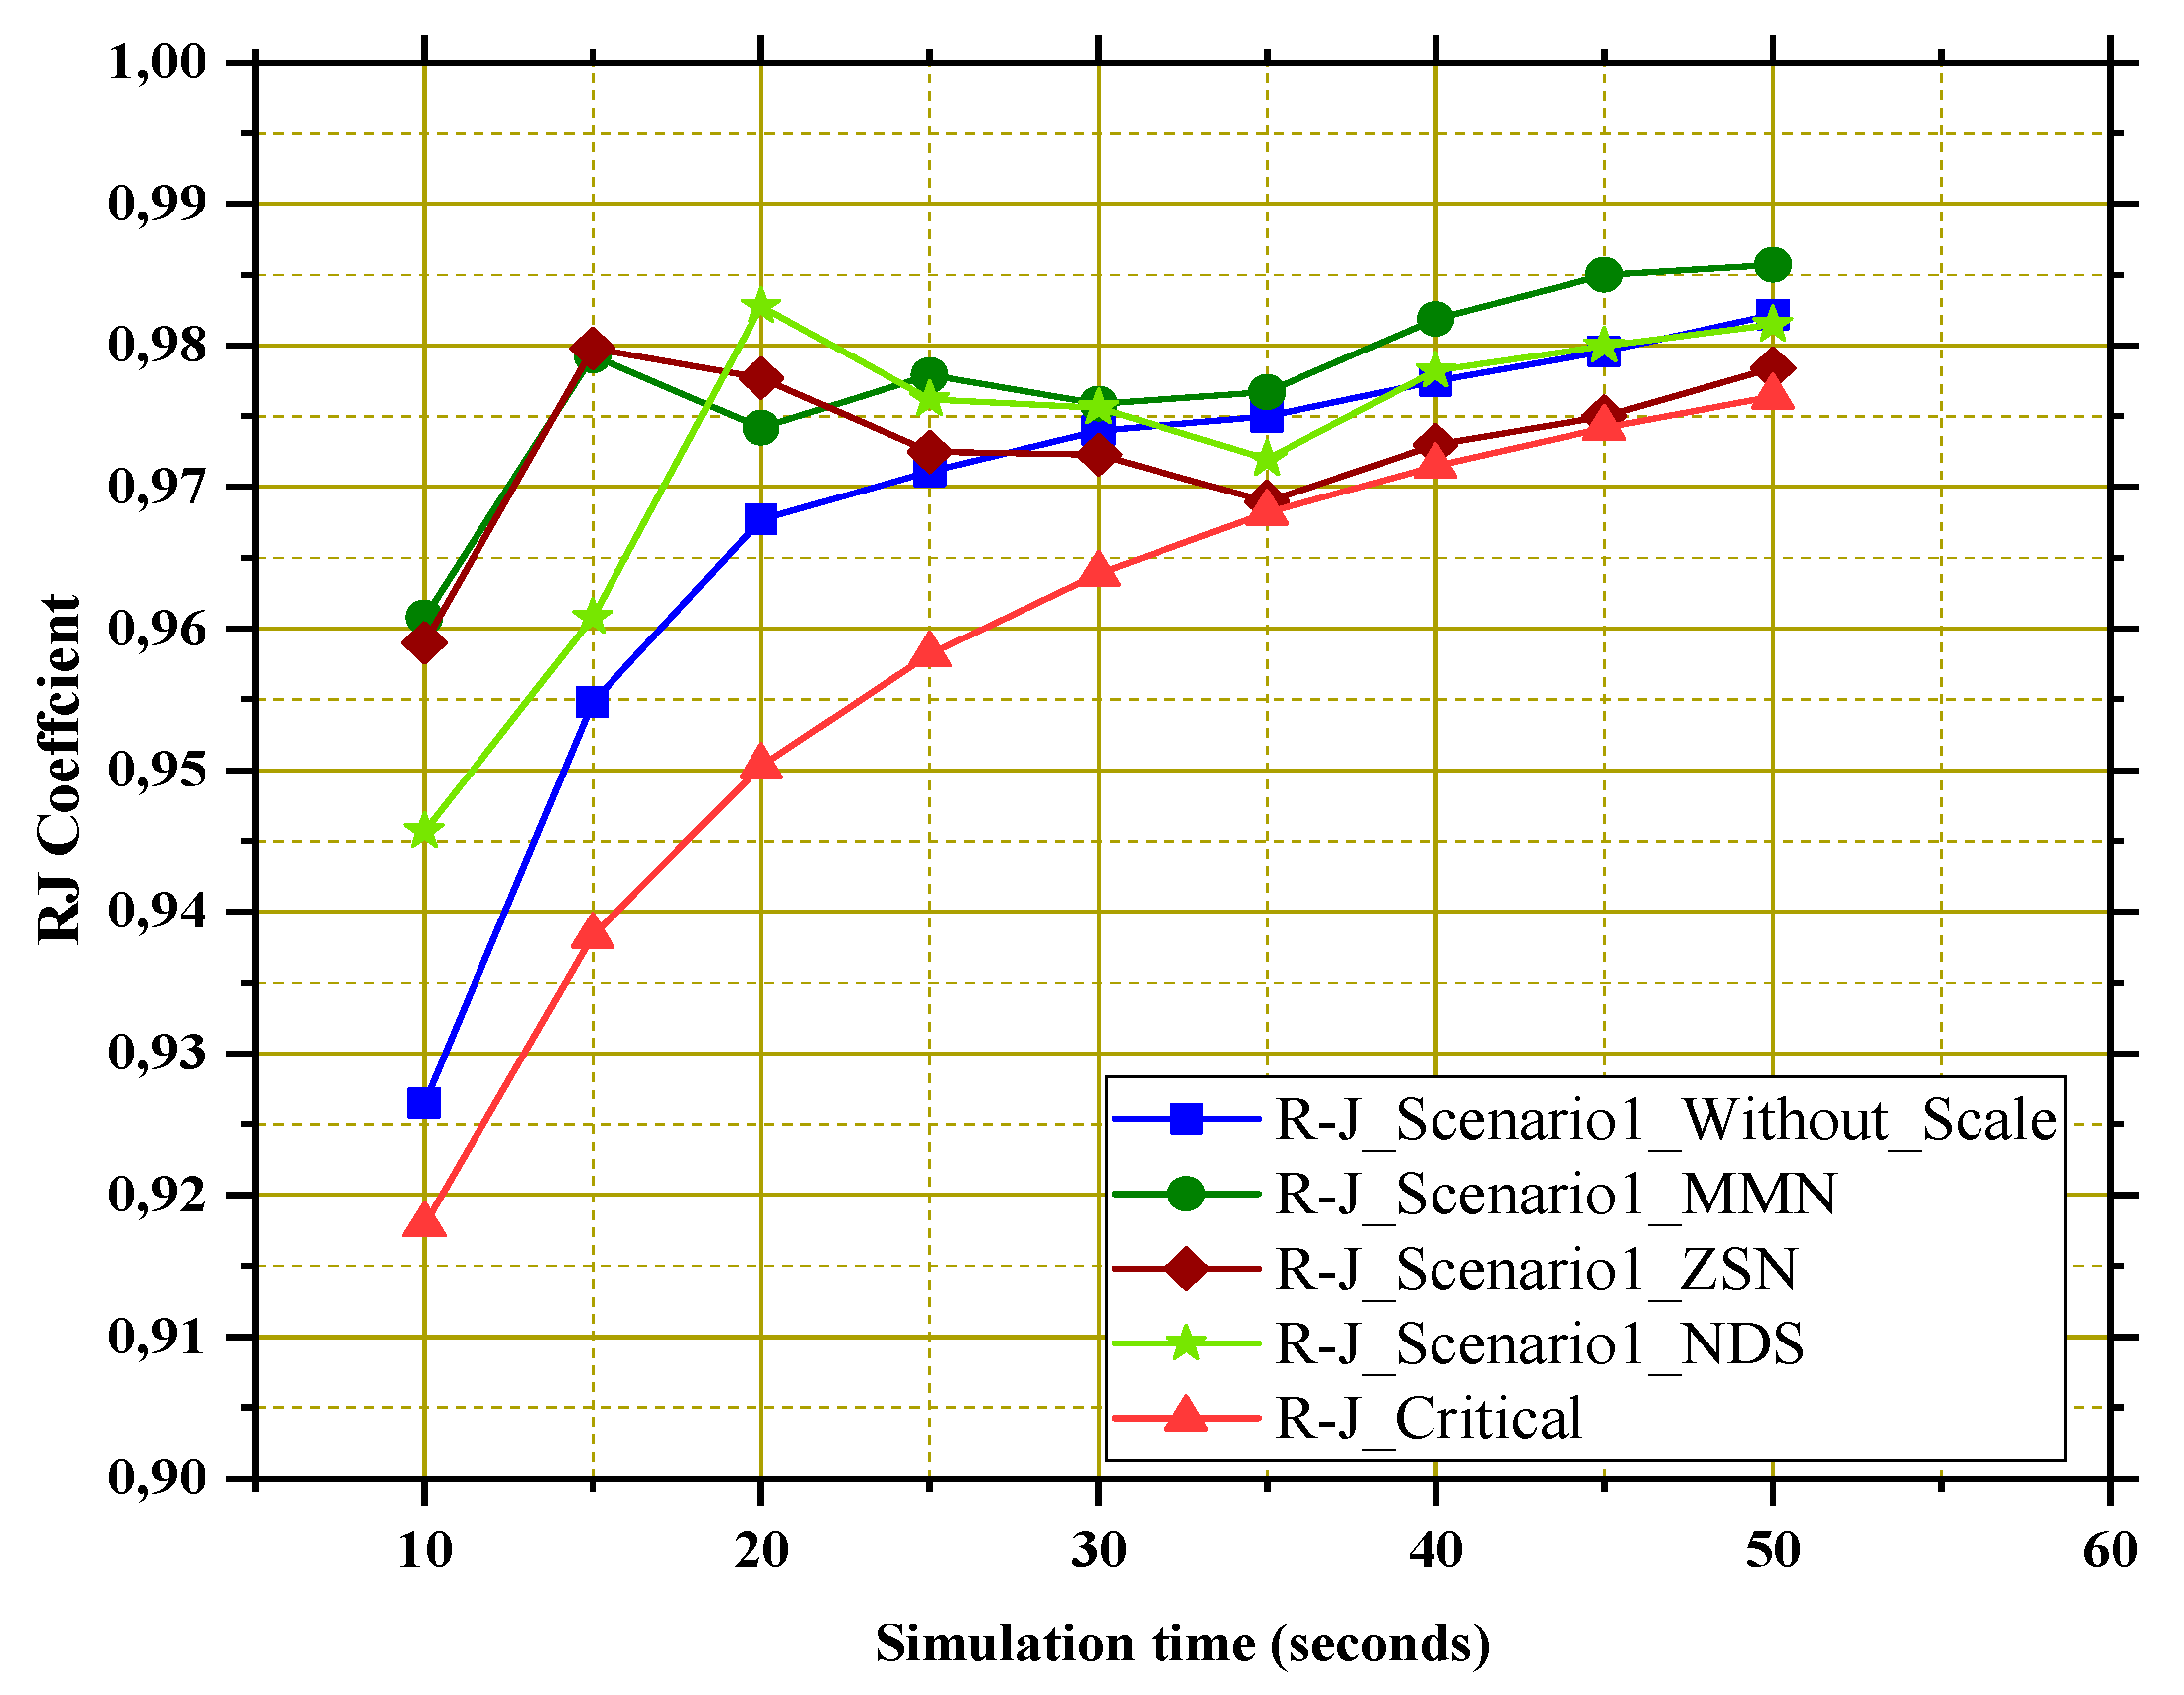
The steps described in the previous flowchart (Figure 2) are executed and the R–J coefficient values are computed accordingly. The following figures (Figure 6 and Figure 7) depict the results. These figures show the curves obtained after applying the proposed detection scheme for both scenarios: scenario 1 and scenario 2.
Figure 6 represents the results of applying our approach MVSDS (Multivariate Statistical Detection Scheme) in the normal scenario (the absence of black hole attack). This figure shows the plots of the calculated R–J values for non-rescaled and rescaled data with Min-Max Normalization (MMN), Z-Score Normalization (ZSN), and Normalization by Decimal Scaling (NDS) techniques. The objective is to illustrate the importance of data rescaling techniques for attack detection schemes in VANETs. Thresholds used for attack detection corresponding to the critical values of the Ryan–Joiner method are also plotted.
From this figure, it can be seen that the R–J values start with lower values than in the first seconds of the simulation. These values are logical since the AODV routing protocol uses the route discovery mechanism before launching the data transmission. As the simulation advances, it can be seen that the observed R–J values increase and we observe that the overall R–J values of the multivariate data are higher than the critical values at various times of the simulation. This outcome suggests that the R–J values without black hole attack confirm the multivariate normality assumption.
Furthermore, we note from the plots that the R–J values computed after applying the data rescaling techniques are higher than those computed on the original data for almost the three data rescaling techniques. These findings stipulate that applying the data rescaling techniques improve the data sensitivity to the multivariate normality assumption. This can be extremely helpful in accurately identifying the malicious activities in our detection scheme.
From Figure 6, it is also seen that the Min-Max technique performs better, since all points in its plot exceed the R–J calculated for the original data followed by the Decimal Scaling technique. The calculated R–J values by applying the Z-Score technique show quite inferior values as we progress in the simulation.
In conclusion, the key point to note is that our detection scheme performs better when applying the data rescaling techniques, particularly the Min-Max technique.
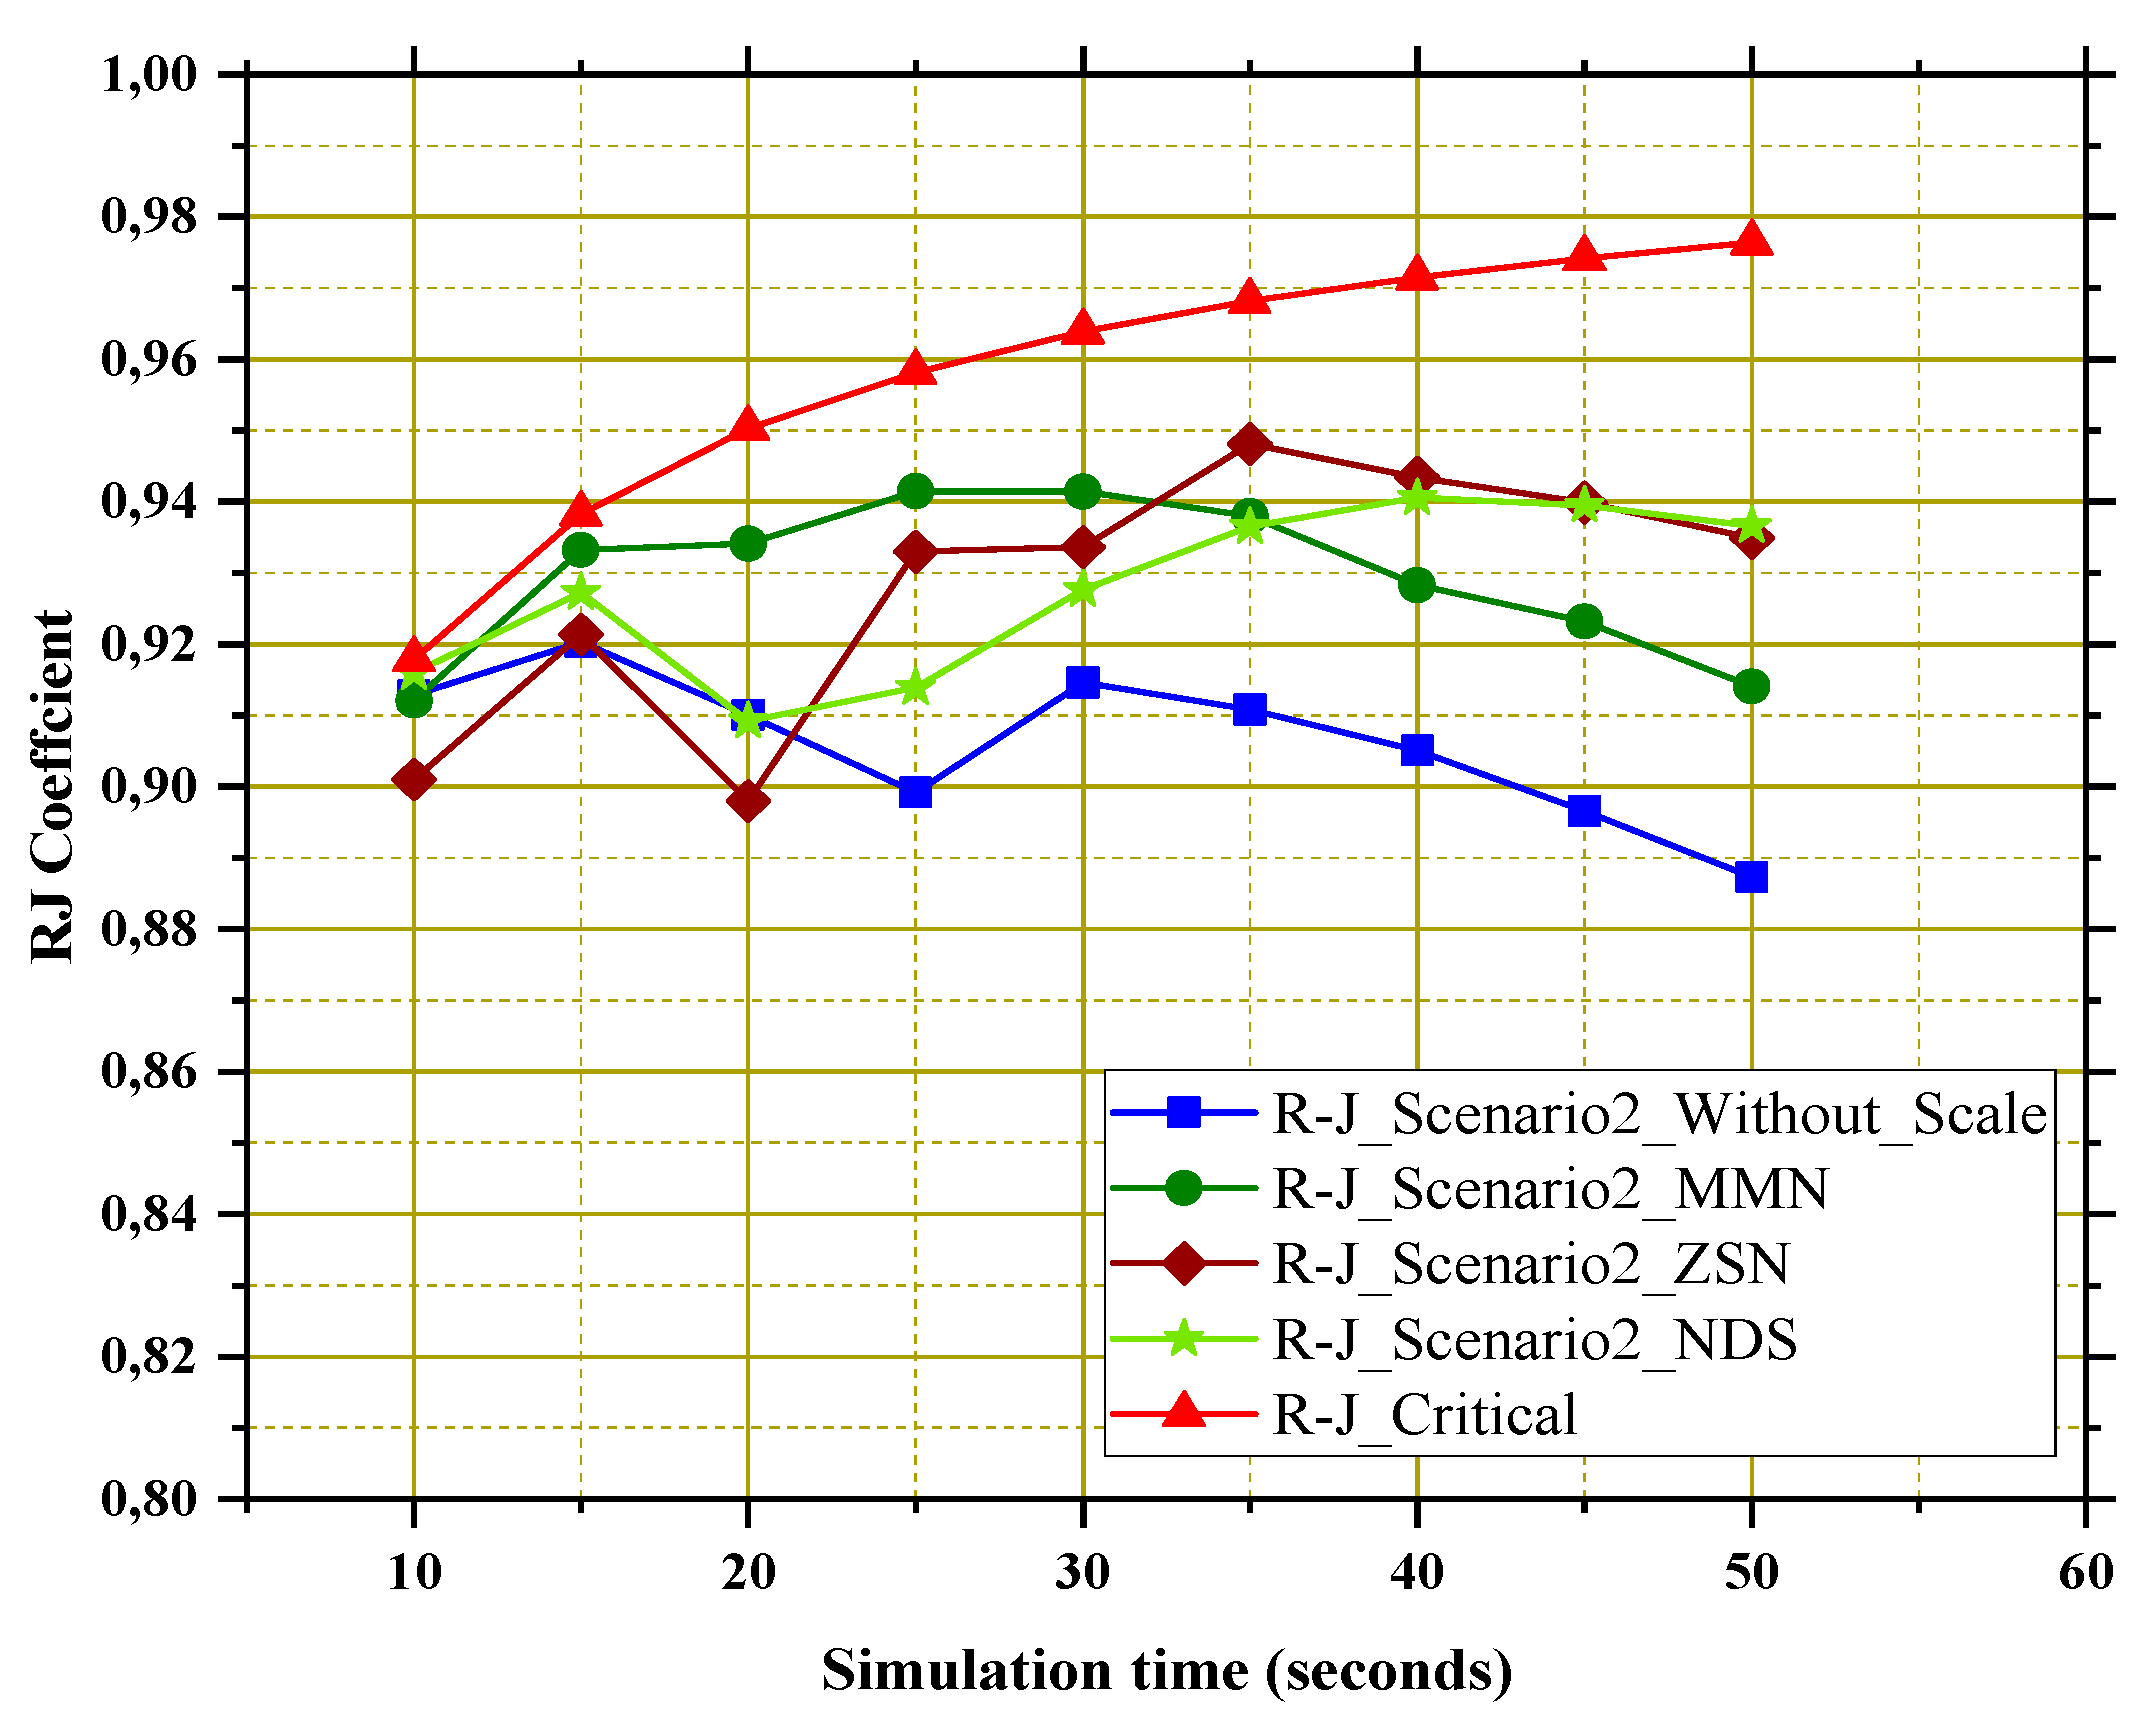
In contrast, when the black hole attack is initiated in the network (scenario 2), the computed values of the R–J coefficient had lower values than the critical values at various times of the simulation. Figure 7 below shows the results of these calculations.
Based on Figure 7, we note that in the beginning of the simulation, the R–J values were approximatively very close to the critical values for the non-rescaled data as well as with the Min-Max and Decimal Scaling techniques. However, as we progressed in the simulation, these values decreased noticeably and all the points fell under the critical values in both cases: with and without applying the data rescaling techniques. These outcomes reveal that the data traffic gathered at different times consisting of three variables, namely the throughput, dropped packets ratio, and overhead traffic ratio, are not from a multivariate normal distribution. This conclusion leads to the rejection of the multivariate normality assumption and subsequently confirms the presence of malicious behavior.
From the above figure, it was also observed that applying the three data rescaling techniques resulted in R–J coefficient values higher than those calculated on the original data. We note that from the 15th second of the simulation time, the overall values exceed the R–J values computed on the original data.
Additionally, the plots show that the Max-Min technique gave better results in terms of sensitivity to the normal distribution followed by the DSN technique, since all the points in their plots are beyond those of the non-rescaled data. In contrast, it was observed on the ZSN curve that not all the points exceeded those of the non-rescaled data.
In conclusion, we argue that applying data rescaling techniques can be considered an essential prerequisite for many attack detection tasks but it is often ignored. Further, the question of which technique is more effective still remains. In our study, it is outlined that the Max-Min technique gives better results in comparison with the non-rescaled data and the two remaining techniques.
An important conclusion that can be made is that our approach can detect abnormal activities in a simple manner with no updates to the routing protocol operations. Further, all statistical measurements are bounded in time, i.e., correspond to each particular time window, which gives meaningful results when monitoring the network traffic in real time.
7. Conclusions
Vehicular Ad hoc Networks are subjected to many vulnerabilities and security attacks because of their open and decentralized features. Black hole attack is one of the most serious attacks that affect the data availability in VANETs. In this paper, we proposed a new approach capable of detecting black hole attack in real time and without performing any updates in the routing algorithm. The findings reveal that the present study may provide an unprecedented approach that uses the multivariate normality tests to detect routing security attacks in VANETs. We tested our detection scheme in a more realistic environment using a realistic traffic model. The real time monitoring of the network traffic is a big advantage of our approach since time is a critical factor in detecting incidents in the VANETs.
Further, our approach relies on the multivariate concept, which is very useful in the context of our study. VANETs are highly dynamic, and their behavior must be characterized by more than one variable rather than an individual one. In that regard, our approach has the ability to distinguish legitimate behavior from malicious behavior based on multiple network characteristics simultaneously. We involved three main important network metrics that had not been previously combined for black hole detection, namely the throughput, the dropped packets ratio, and the overhead traffic ratio. It is also worth noting that our research demonstrated the relevance of employing data rescaling techniques (ZSN, MMN, and NDS) in improving the data sensitivity to the normality conformity analysis. Further in-depth details regarding these techniques can be tried in the future to get more insights into the differences between these methods and others from the literature.
To the best of our knowledge, this is the first study that combines rescaling techniques with multivariate data traffic for routing security attack detection. As a next step, additional experiments should be undertaken to provide further evaluation of the proposed scheme, including testing other routing security attacks. The proposed detection scheme can be enhanced by integrating other performance metrics and implementing a reaction scheme to countermeasure the routing attacks.
Author Contributions
Conceptualization, S.A. and S.E.H.; methodology, S.A. and M.-A.E.H.; validation, M.H.; formal analysis, S.A., M.H. and S.E.H.; investigation, S.A. and S.E.H.; resources, S.A. and S.E.H.; data curation, S.A. and S.E.H.; writing—original draft preparation, S.A., M.H. and S.E.H.; writing—review and editing, S.A., M.H. and S.E.H.; visualization, S.A., M.-A.E.H. and S.E.H.; supervision, M.H.; project administration, M.H. and S.E.H. All authors have read and agreed to the published version of the manuscript.
Funding
This research received no external funding.
Institutional Review Board Statement
Not applicable.
Informed Consent Statement
Not applicable.
Data Availability Statement
Not applicable.
Conflicts of Interest
The authors declare no conflict of interest.
References
- Lee, M.; Atkison, T. VANET Applications: Past, Present, and Future. Veh. Commun. 2021, 28, 100310. [Google Scholar] [CrossRef]
- Gonçalves, F.; Macedo, J.; Santos, A. An Intelligent Hierarchical Security Framework for VANETs. Information 2021, 12, 455. [Google Scholar] [CrossRef]
- Safwat, M.; Elgammal, A.; AbdAllah, E.G.; Azer, M.A. Survey and Taxonomy of Information-Centric Vehicular Networking Security Attacks. Ad Hoc Netw. 2022, 124, 102696. [Google Scholar] [CrossRef]
- Soni, G.; Chandravanshi, K. A Novel Privacy-Preserving and Denser Traffic Management System in 6G-VANET Routing Against Black Hole Attack. In Proceedings of the Sustainable Communication Networks and Application; Karrupusamy, P., Balas, V.E., Shi, Y., Eds.; Springer Nature: Singapore, 2022; pp. 649–663. [Google Scholar]
- Al-Shareeda, M.A.; Anbar, M.; Manickam, S.; Hasbullah, I.H. A Secure Pseudonym-Based Conditional Privacy-Preservation Authentication Scheme in Vehicular Ad Hoc Networks. Sensors 2022, 22, 1696. [Google Scholar] [CrossRef] [PubMed]
- Malik, A.; Khan, M.Z.; Faisal, M.; Khan, F.; Seo, J.-T. An Efficient Dynamic Solution for the Detection and Prevention of Black Hole Attack in VANETs. Sensors 2022, 22, 1897. [Google Scholar] [CrossRef] [PubMed]
- Saini, T.K.; Sharma, S.C. Recent Advancements, Review Analysis, and Extensions of the AODV with the Illustration of the Applied Concept. Ad Hoc Netw. 2020, 103, 102148. [Google Scholar] [CrossRef]
- Das, S.R.; Belding-Royer, E.M.; Perkins, C.E. Ad Hoc On-Demand Distance Vector (AODV) Routing. Available online: https://tools.ietf.org/html/rfc3561 (accessed on 20 December 2020).
- Rencher, A.C. Methods of Multivariate Analysis, 2nd ed.; Wiley Series in Probability and Mathematical Statistics; J. Wiley: New York, NY, USA, 2002; ISBN 978-0-471-41889-4. [Google Scholar]
- Ajjaj, S.; El Houssaini, S.; Hain, M.; El Houssaini, M.-A. Performance Assessment and Modeling of Routing Protocol in Vehicular Ad Hoc Networks Using Statistical Design of Experiments Methodology: A Comprehensive Study. Appl. Syst. Innov. 2022, 5, 19. [Google Scholar] [CrossRef]
- Singh, D.; Singh, B. Investigating the Impact of Data Normalization on Classification Performance. Appl. Soft Comput. 2020, 97, 105524. [Google Scholar] [CrossRef]
- Rao, C.R.; Ali, H. An Overall Test for Multivariate Normality Student. 1998, pp. 317–324. Available online: http://repository.ias.ac.in/71898/ (accessed on 14 March 2022).
- Ryan, T.A.; Joiner, B.L. Normal Probability Plots and Tests for Normality; Technical Report; Statistics Department, The Pennsylvania State University: State College, PA, USA, 1976. [Google Scholar]
- Documentation—SUMO Documentation. Available online: https://sumo.dlr.de/docs/index.html (accessed on 21 September 2021).
- Ns-3 | a Discrete-Event Network Simulator for Internet Systems. Available online: https://www.nsnam.org/ (accessed on 21 September 2021).
- Build MEX Function or Engine Application—MATLAB Mex. Available online: https://www.mathworks.com/help/matlab/ref/mex.html (accessed on 14 April 2022).
- Farrell, P.J.; Salibian-Barrera, M.; Naczk, K. On Tests for Multivariate Normality and Associated Simulation Studies. J. Stat. Comput. Simul. 2007, 77, 1065–1080. [Google Scholar] [CrossRef]
- Chantasorn, U. Efficiency Comparisons of Normality Test Using Statistical Packages. Thammasat Int. J. Sci. Technol. 2015, 16, 9–25. [Google Scholar]
- Kumar, A.; Varadarajan, V.; Kumar, A.; Dadheech, P.; Choudhary, S.S.; Kumar, V.D.A.; Panigrahi, B.K.; Veluvolu, K.C. Black Hole Attack Detection in Vehicular Ad-Hoc Network Using Secure AODV Routing Algorithm. Microprocess. Microsyst. 2021, 80, 103352. [Google Scholar] [CrossRef]
- Hassan, Z.; Mehmood, A.; Maple, C.; Khan, M.A.; Aldegheishem, A. Intelligent Detection of Black Hole Attacks for Secure Communication in Autonomous and Connected Vehicles. IEEE Access 2020, 8, 199618–199628. [Google Scholar] [CrossRef]
- Ali Zardari, Z.; He, J.; Zhu, N.; Mohammadani, K.; Pathan, M.; Hussain, M.; Memon, M. A Dual Attack Detection Technique to Identify Black and Gray Hole Attacks Using an Intrusion Detection System and a Connected Dominating Set in MANETs. Future Internet 2019, 11, 61. [Google Scholar] [CrossRef] [Green Version]
- Moudni, H.; Er-rouidi, M.; Mouncif, H.; Hadadi, B.E. Black Hole Attack Detection Using Fuzzy Based Intrusion Detection Systems in MANET. Proc. Comput. Sci. 2019, 151, 1176–1181. [Google Scholar] [CrossRef]
- Delkesh, T.; Jabraeil Jamali, M.A. EAODV: Detection and Removal of Multiple Black Hole Attacks through Sending Forged Packets in MANETs. J. Ambient Intell. Humaniz. Comput. 2019, 10, 1897–1914. [Google Scholar] [CrossRef]
- Vinayagam, J.; Balaswamy, C.; Soundararajan, K. Certain Investigation on MANET Security with Routing and Blackhole Attacks Detection. Proc. Comput. Sci. 2019, 165, 196–208. [Google Scholar] [CrossRef]
- Subba, B.; Biswas, S.; Karmakar, S. A Game Theory Based Multi Layered Intrusion Detection Framework for VANET. Future Gener. Comput. Syst. 2018, 82, 12–28. [Google Scholar] [CrossRef]
- Tyagi, P.; Dembla, D. Advanced Secured Routing Algorithm of Vehicular Ad-Hoc Network. Wirel. Pers. Commun. 2018, 102, 41–60. [Google Scholar] [CrossRef]
- Purohit, K.C.; Dimri, S.C.; Jasola, S. Mitigation and Performance Analysis of Routing Protocols Under Black-Hole Attack in Vehicular Ad-Hoc Network (VANET). Wirel. Pers. Commun. 2017, 97, 5099–5114. [Google Scholar] [CrossRef]
Figure 1.
Black hole attack in VANETs.

Figure 2.
Our proposed MVSDS detection scheme.

Figure 3.
Simulation zone from El Jadida city from Open Street Map and XML file edited by SUMO.

Figure 4.
(a) Throughput (TH) monitoring. (b) Dropped packet ratio (DPR) monitoring.

Figure 5.
Overhead traffic ratio (OTR) monitoring.

Figure 6.
Results of the R–J coefficient calculations in the normal scenario (scenario 1).

Figure 7.
Results of the R-J calculations in the black hole scenario (scenario 2).


Table 1.
Proposed techniques in literature to detect black hole attack.
| Author Year | Detection Technique | Context | Simulator | Performance Parameters | Routing Protocol’s Updates | Data Rescaling | Multivariate Statistical Analysis | Limitations |
|---|---|---|---|---|---|---|---|---|
| Kumar et al., 2021 [19] | Improved RREQ and RREP routing packets | VANET | NS-2 | drop packets, end-to-end delay, packet delivery ratio (PDR), routing request overhead | yes | no | no | More overhead caused by the extensive routing protocol modifications and additional routing messages. |
| Hassan et al., 2020 [20] | Intelligent black hole attack detection scheme (IDBA) | VANET | NS-2 | sequence number, hop count, packet delivery ratio and end to end delay | no | no | no | The computation of four thresholds simultaneously leads to higher processing time and additional overhead. |
| Ali Zardari et al., 2019 [21] | The CDS approach and IDS nodes | MANET | NS-2 | detection rate, packet delivery ratio, throughput, routing overhead, delay | no | no | no | Throughput and packet delivery ratio are negatively affected with the huge amount of generated routing overhead. |
| Moudni et al., 2019 [22] | Adaptive Fuzzy Neuro Inference System with Particle Swarm Optimization (PSO) | MANET | NS-2 /MATLAB | detection rate (DR) and false alarm rate (FAR) | no | no | no | Needs substantial computation time since additional tables are created to records all the activities of the neighbors. |
| Delkesh et Jabraeil Jamali, 2019 [23] | Heuristic approach | MANET VANET | NS-2 | throughput, packet loss rate, end-to-end delay | yes | no | no | May not operate in case the black hole attacker consults its routing table before sending back a reply to the source node, since the algorithm is based on sending forged packets in the route discovery. |
| Vinayagam et al., 2019 [24] | Novel Integrated Cross Interio (ICI) For IDS | MANET | NS-2 | communication efficiency ratio, average transmission delay, average throughput, destination utilization index, neighbor utilization index | no | no | no | The various stages of the proposed routing models are not multi-threaded, which increases the computation cost. |
| Subba et al., 2018 [25] | A game theory based multi layered intrusion detection framework | VANET | NS3, SUMO | detection rate and false alarm rate | no | no | no | Dynamic clustering algorithm is required to take into account the high mobility of vehicles. |
| Tyagi Dembla, 2018 [26] | ES-AODV | VANET | NCTUns | throughput, packet collision, packets dropped, packet delivery ratio, end to end delay, routing overhead | yes | no | no | Increased routing overhead and bandwidth due to the process of key generation in ECC algorithm and their storage with certificate of vehicles. |
| Purohit et al., 2017 [27] | Secure Vehicular on Demand Routing (SVODR) | VANET | NS-2 | PDR, throughput, NRL and average path length | yes | no | no | The need for employing additional fields for cryptographic functions if implemented with other protocols results in significant routing overhead and E2E latency. |
| Our method | MVSDS | VANET | NS-3 SUMO Matlab | throughput, dropped packets ratio, overhead traffic ratio | no | yes | yes | The advantage of our detection scheme is that no modifications in the routing algorithm operations are performed. This results in no additional overhead, so less time and costs are needed. However, other routing attacks such as cooperative black hole, worm hole will be addressed in future research work. |
Table 2.
Simulation settings.
| N | Parameter | Value |
|---|---|---|
| 1 | Network simulator | NS3.29 |
| 2 | Mobility simulator | SUMO-0.32.0 |
| 3 | Propagation model | friisLoss model |
| 4 | Number of vehicles | 100 |
| 5 | WiFi channel | YansWifi |
| 6 | Mac and Physic layer | IEEE 802.11p |
| 7 | Transmission power | 33 dbm |
| 8 | Simulation time | 100 s |
| 9 | Traffic type | CBR (constant bit rate) |
| 10 | Packet size | 1024 bytes |
| 11 | Routing protocol | AODV |
Publisher’s Note: MDPI stays neutral with regard to jurisdictional claims in published maps and institutional affiliations. |
© 2022 by the authors. Licensee MDPI, Basel, Switzerland. This article is an open access article distributed under the terms and conditions of the Creative Commons Attribution (CC BY) license (https://creativecommons.org/licenses/by/4.0/).
Share and Cite
MDPI and ACS Style
Ajjaj, S.; El Houssaini, S.; Hain, M.; El Houssaini, M.-A. A New Multivariate Approach for Real Time Detection of Routing Security Attacks in VANETs. Information 2022, 13, 282. https://0-doi-org.brum.beds.ac.uk/10.3390/info13060282
AMA Style
Ajjaj S, El Houssaini S, Hain M, El Houssaini M-A. A New Multivariate Approach for Real Time Detection of Routing Security Attacks in VANETs. Information. 2022; 13(6):282. https://0-doi-org.brum.beds.ac.uk/10.3390/info13060282
Chicago/Turabian StyleAjjaj, Souad, Souad El Houssaini, Mustapha Hain, and Mohammed-Alamine El Houssaini. 2022. "A New Multivariate Approach for Real Time Detection of Routing Security Attacks in VANETs" Information 13, no. 6: 282. https://0-doi-org.brum.beds.ac.uk/10.3390/info13060282
Note that from the first issue of 2016, this journal uses article numbers instead of page numbers. See further details here.