
Classification of Malaria Using Object Detection Models
by
 , , , and
Padmini Krishnadas
1,
Krishnaraj Chadaga
2,
Niranjana Sampathila
1,* ,
,
Santhosha Rao
3, 
Swathi K. S.
4,* and
Srikanth Prabhu
2 1
Department of Biomedical Engineering, Manipal Institute of Technology, Manipal Academy of Higher Education, Manipal, Udupi 576104, Karnataka, India
2
Department of Computer Science and Engineering, Manipal Institute of Technology, Manipal Academy of Higher Education, Manipal, Udupi 576104, Karnataka, India
3
Department of Information and Communication Technology, Manipal Institute of Technology, Manipal Academy of Higher Education, Manipal, Udupi 576104, Karnataka, India
4
Manipal Institute of Management, Manipal Academy of Higher Education, Manipal, Udupi 576104, Karnataka, India
*
Authors to whom correspondence should be addressed.
Informatics 2022, 9(4), 76; https://0-doi-org.brum.beds.ac.uk/10.3390/informatics9040076
Submission received: 20 July 2022
/
Revised: 7 September 2022
/
Accepted: 8 September 2022
/
Published: 27 September 2022
(This article belongs to the Special Issue Feature Papers in Medical and Clinical Informatics)
Abstract
:Malaria poses a global health problem every day, as it affects millions of lives all over the world. A traditional diagnosis requires the manual inspection of blood smears from the patient under a microscope to check for the malaria parasite. This is often time consuming and subject to error. Thus, the automated detection and classification of the malaria type and stage of progression can provide a quicker and more accurate diagnosis for patients. In this research, we used two object detection models, YOLOv5 and scaled YOLOv4, to classify the stage of progression and type of malaria parasite. We also used two different datasets for the classification of stage and parasite type while assessing the viability of the dataset for the task. The dataset used is comprised of microscopic images of red blood cells that were either parasitized or uninfected. The infected cells were classified based on two broad categories: the type of malarial parasite causing the infection and the stage of progression of the disease. The dataset was manually annotated using the LabelImg tool. The images were then augmented to enhance model training. Both models YOLOv5 and scaled YOLOv4 proved effective in classifying the type of parasite. Scaled YOLOv4 was in the lead with an accuracy of 83% followed by YOLOv5 with an accuracy of 78.5%. The proposed models may be useful for the medical professionals in the accurate diagnosis of malaria and its stage prediction.
1. Introduction
Malaria is caused due to the bite of a female Anopheles mosquito. It is a preventable and curable parasitic disease. The WHO statistics, in 2019, revealed 229 million cases of malaria infection, while the number of deaths caused by malaria was 409,000. Children under the age of five years are most vulnerable to this disease and accounted for 67% of the malaria deaths in 2019. The African region is the most severely affected, accounting for 97% of the population infected by malaria [1]. Due to the widespread nature of the illness combined with its mortality rate of about 1–3 million deaths per year, malaria levies considerable costs to both governments as well as individuals. The costs incurred by the government include the maintenance, supply, and staffing of health centers, purchase and manufacturing of drugs and other products to combat the disease, and public intervention measures for the control of malaria, such as the spraying of insecticides, disinfectants, or distribution of insecticide-sprayed beds. Thus, implementing measures to ensure the rapid diagnosis of this disease, as well as implementing preventive measures and efficient treatment, is vital to combat this disease.
Malaria is typically detected by rapid diagnostic tests, which are a useful alternative to microscopic examination, especially when tests must be conducted in regions without laboratory facilities [2]. The blood sample is placed on a sample pad on a test card along with some reagents. After 15 min, the test cards show specific bands that indicate if the patient is infected with malaria and the type of species. Another method for malaria detection is the indirect fluorescent antibody test (serology test), which detects the malaria antibody in the blood. It can be used to detect if the patient is infected with plasmodium content. In this method, schizonts are used as the antigen. The patient’s serum is attached to the homologous antibody (the organism), and if they are present, they attach to the antigen. This, when examined under a fluorescent microscope, gives the parasite a fluorescent green color [3]. However, these tests are time consuming and are not practical for day-to-day testing. There are also spectroscopic methods of testing for malaria. Raman spectroscopy uses chemical fingerprints to determine if the patient is infected with malaria [4]. Generally, the disease is treated in its early stages before it becomes fatal to the infected individual. Malaria can typically be treated with a range of medications depending on the type of malaria parasite that has caused the infection, the severity of the illness, and the person’s age, general immunity, and gender.
However, the screening and diagnosis of malaria is not an easy task. The identification of malarial parasites in a blood sample using a microscope is considered a gold standard for laboratory confirmation of malaria, but this is a tedious process. The rapid diagnostic tests have their disadvantages as well, as they do not eradicate the need for microscopic confirmation. They also have insufficient data to determine the ability of the test to detect all species of malaria accurately. Microscopic analyses are time consuming and lead to inaccuracy and inconsistency in some cases. The computerized approach uses digitized blood slides that are able to improve the consistency in diagnosis [5]. In this study, we propose a method for the automated classification of malarial parasites and the stage of progression of the disease from Giemsa-stained blood smears obtained from the patients. We use object detection algorithms, YOLOv5 and scaled YOLOv4, to obtain predictions of the class of the parasitic infection. The two models are also compared to understand their efficiency and accuracy in carrying out the task. Further, all the models are implemented using the PyTorch framework.
1.1. Background
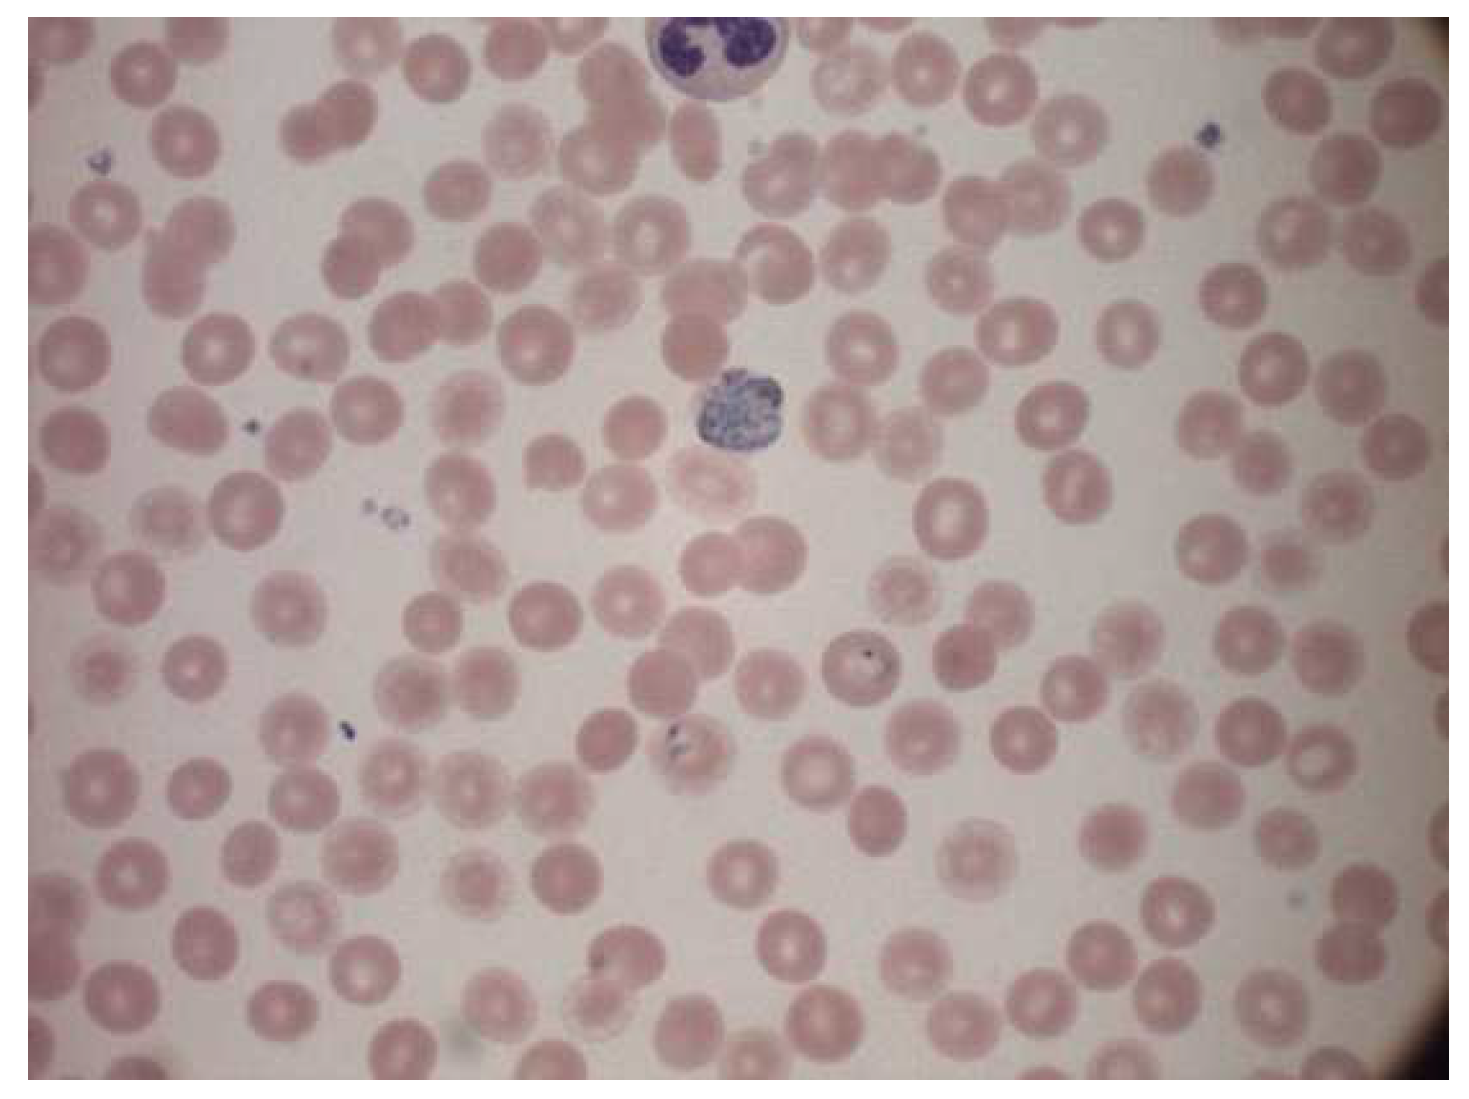
A malaria diagnosis can be made by observing a blood smear obtained from the patient under a microscope slide. The specimen is stained with the Giemsa stain [6]. This is a stain that allows for the differentiation of cells present in the hematopoietic tissue and microorganisms present in it. Since malaria is caused by the Plasmodium parasite that is transferred to the blood, the stain provides a characteristic color to it that aids with its identification [7]. Figure 1 describes the Giemsa-stained blood smear images of a patient infected with malaria.
The Giemsa stain is the gold standard staining technique for both thick and thin smears to identify blood parasites. The stained blood smear is viewed under a 100× oil immersion objective. The oil-immersion technique is opted for, as it allows the highest magnification to be retained.
1.1.1. Malarial Life Cycle
There are four major stages of the malarial life cycle. It begins with the female Anopheles mosquito injecting sporozoites into the human bloodstream. These sporozoites infect liver cells to form schizonts. Schizonts then rupture to produce merozoites. Merozoites develop into a preliminary stage of trophozoites called the ring stage, which further develops into Trophozoites on maturing. Trophozoites then mature into schizonts that further rupture, and hence the cycle continues [9]. Gametocyte is a cell in plasmodium specializing in the transition between the human and the mosquito host. Thus, the infection of malaria is a dual host process. The morphological stages seen in erythrocytes include trophozoites (growth stage), schizonts (dividing stage), and gametocytes (sexual forms) [10].
1.1.2. Malarial Parasitemia
Five species of malaria infect humans. They are Plasmodium Falciparum, Plasmodium Malariae, Plasmodium Vivax, Plasmodium Ovale, and Plasmodium Knowlesi. Plasmodium Falciparum malaria is life threatening. The stages preceding death may also cause liver failure, kidney failure, convulsions, and coma. Plasmodium Vivax and Plasmodium Ovale occasionally cause serious illness. Hypnozoites from the above two kinds of malaria manifest in the liver and remain dormant in the host hepatocytes for 3 to 45 weeks before maturing into hepatic schizonts, which, again, burst to form merozoites that infect red blood cells. This is the primary cause of malarial relapse. Plasmodium Vivax is the commonly observed parasite in recurring malaria infections. Figure 2 illustrates the different parasites of malaria and the various stages of progression.
1.2. Literature Review
There is a wide array of research conducted to automate and diagnose malaria from the microscopic images of blood smears acquired systematically from the peripheral blood smear using deep learning. The important research which focuses on the automation of malaria detection is discussed here.
Sampathila et al. (2018) reported a computational approach to the diagnosis of malaria through the classification of the malaria parasite from the microscopic image of a blood smear. It illustrates the usage of image segmentation and feature extraction to classify malaria present in images of microscopic blood smears. The hue, saturation, and value color space of each image were analyzed to remove unwanted noise or objects from the image. The data were then passed through a neural network to undergo feature classification and extraction based on colors, texture, and other desired features. The research achieved a training accuracy of 97.2% [5]. Sifat et al. (2020) developed a fully automated system to detect malaria parasites and their stages from the blood smear that illustrates the usage of one of the first deep learning algorithms. VGG16 was utilized to identify infected RBC parasites. It performed the automatic detection of malaria along with its stages. They achieved a segmentation accuracy of 97.67%. The U-Net model achieved an accuracy of 92.05%. The CNN (convolutional neural network) model also obtained a detection accuracy of 100% and a specificity of 95%. The average accuracy and specificity of the VGG16 model were 95.55% and 94.75%, respectively [11].
Nayak et al. (2019) investigated different deep learning models and their efficiency in detecting malaria. Their results showed the ResNet 50 model to be extremely promising with the highest training accuracy of 97.55%. [12]. The author assessed the performance of prominent deep learning models, such as ResNet50, AlexNet, FastAI V1, VGG-16 and DenseNet121.
Roy et al. (2018) detected the malaria parasite in the Giesma blood sample using image processing, where they developed a model that used the color pixel-based discrimination method and a segmentation operation to identify malarial parasites in microscopic blood smear images [13]. Their methodology involved using two different segmentations: watershed segmentation and HSV (hue, saturation, and value space) segmentation. Then they followed the morphological operations to highlight the presence of the parasite in the microscopic images of RBCs. Their methods resulted in a 90% accuracy in the detection of the parasite causing the disease. Scherr et al. (2016) proposed a method to analyze malaria using mobile phone imaging and cloud-based analysis for standardized malaria detection, where a mobile phone was used to take images for conducting a rapid diagnostic test. It also enabled the objective recording of the rapid diagnostic test, and this enabled web access for immediate result reporting. These images were uploaded to a database that was globally accessible and then analyzed. It achieved an 80.2% true negative rate (specificity). This was a novel use of digital pathology to ensure top-notch healthcare for patients [14].
More recent approaches to malaria detection can be observed in the paper put forth by authors Li et al. (2022) in the paper “Residual Attention learning network and SVM for malaria parasite detection”. The authors explored a hybrid model called RAL-CNN-SVM composed of multiple residual attention learning network modules, a global average pooling block and a classifier trained by a support vector machine. The model was observed to improve prediction accuracy significantly without involving additional complex computations [15]. Thuan et al. (2021) discussed the evolution of the YOLO algorithm and YOLOv5 as a state-of-the-art object detection algorithm [16]. The paper sheds light on how the YOLO algorithm was born to reframe the object detection problem as a regression problem, and it was carried out by a single neural network. Khandekar et al. (2020) reported blast cell detection for acute lymphoblastic leukemia diagnosis using object detection models YOLOv4 [17]. The authors incorporated the use of transfer learning to understand the impact of different variables in the detection process. They also proposed methods for the real-time detection of leukemia. Tack et al. (2021) developed an automated assessment of knee alignment from full leg X-rays by training a YOLOv4 model to locate regions of interest in full leg radiographs for the hip, knee, and ankle joints. Residual neural networks were then trained to regress landmark coordinates for each of the regions of interest to then determine the knee alignment [18].
Huang et al. (2021) used YOLOv5 for bone marrow cell recognition. They reported bone marrow cell recognition based on a novel loss function. The loss function proved to boost the model’s performance. The models can be used to train custom datasets [19]. Another recent approach was outlined in the paper “Image analysis and machine learning based malaria assessment system” by the authors Kyle Manning et al. [20]. The authors used image segmentation techniques to segment the infected (or uninfected) red blood cells to the region of interest before making a prediction based on a convolutional neural network. The model achieved an overall testing accuracy of 91.0%. Reddy et al. (2021) focused on identifying malaria cell images using the transfer learning method [21]. The research used pre-trained Resnet50 model and a fully connected dense layer that utilizes backpropagation for learning. The paper reported a training accuracy of 95.91%. Krishnadas et al. (2021) reported an algorithm for the detection of malaria implemented by deep learning using PyTorch. Pretrained models of DenseNet121 and Resnet50 are repurposed with transfer learning to fit the task of malaria detection in segmented single-cell images [22]. The authors evaluated the performance of the two deep learning models and reported an accuracy of 94.43% for the DenseNet121 model while the Resnet50 model achieved an accuracy of 91.72%.
2. Method
Several approaches to the computer-aided design (CAD) of malaria, based on automatic microscopic detection and characterization of plasmodia in blood films, have been proposed in the last years [23]. Object detection is a computer vision technology that can allow us to identify and locate objects in an image or a video. In this research, we also deal with image classification, which is the process of predicting the class of one object in an image.
2.1. Dataset Description
Two different datasets were considered for each kind of classification: one for parasite classification and one for stage classification. The first dataset used for parasite classification had 172 images and had four classes, each corresponding to the type of parasite. They are as follows: Vivax, Falciparum, Ovale, Malariae. This dataset was collected by using a smartphone camera attached to a microscope eyepiece. The slides were stained with a field stain at ×1000 magnification, and all the images were of 750 × 750 pixels. The dataset consisted of ground truth images indicating the axes where parasites were present. The images were also split into four folders corresponding to the type of parasite present. Additionally, each image name consisted of either an “R” (ring), “S” (schizont), “T” (trophozoite) or “G” (gametocyte), indicating the stage of progression. These images were originally in the .png format and were converted to the .jpeg format (the significance of which will be explained in the proceeding chapters). The second dataset was taken from the Broad Bioimage Benchmark Collection. It had 1330 images with information corresponding to the stage of progression of the disease: ring, trophozoite, RBC, gametocyte, schizont, leukocyte, and difficult. Out of these classes, leukocyte and RBC corresponded to the uninfected classes, and the rest were infected. An important observation about the dataset was the large number of uninfected red blood cells compared to any other class of object. The significance of this is revisited in the proceeding chapters. The labels were originally stored in the form of a json file that was converted to a csv file containing x- and y-axis coordinates corresponding to the presence of the parasite. This csv file was later referenced while creating bounding boxes for the data. Both datasets had to be manually annotated before they could be used for the YOLO algorithms as a major input parameter for the algorithm are the annotations (more specifically, the bounding boxes), that indicate the location of the object of interest in the image. While both datasets did contain supporting label information for the cells, this information had to be integrated into annotations and saved in the yaml format expected by the YOLO object detection algorithms.
2.2. Yolo Architecture
An object detector is designed to create feature images from its input images and then feed these features into a prediction system that draws bounding boxes around the objects and predicts the classes of the objects in question. YOLO models precisely perform these functions and implements them in an end-to-end differentiable network. A YOLO object detection model has three major components that include the backbone, neck and head. The first component, the backbone, is a convolutional neural network-based architecture that aggregates the features of the image at different granularities. The second component is the neck, which has series of layers that mix and combine image features and pass them forward for prediction. The third component, the head, collects the features from the neck and then draws a box around the object along with its predicted class [16]. The architecture of YOLOv5 is illustrated in Figure 3.
YOLOv4, on the other hand, consists of a CSPDarknet53 backbone (a cross stage partial connection convolutional neural network that serves as a backbone for object detection tasks), an SPP (spatial pyramid pooling) and a PAN (path aggregation network) as the neck, and YOLOv3 as the head of the model. It involves the implementation of DropBlock regularization and class label smoothing. It also uses a bag of specials for the backbone, comprising Mish activation, cross stage partial connections (CSP) and multi input weighted residual connections (MiWRC). These plug-in modules are also used for the detector with appropriate alterations [23].
2.3. Parasite Classification Data Structure
The dataset used was a public source dataset published first by authors Andrea Loddo et al. [24]. The dataset contained 172 images of microscope slide images. The name of each image indicated if the progression of the disease was one of the four stages: ring, trophozoite, gametocyte and schizont. The dataset also had four folders, each corresponding to the kind of parasitic infection. They are Falciparum, Ovale, Vivax, and Malariae. Figure 4 represents a sample image from the dataset.
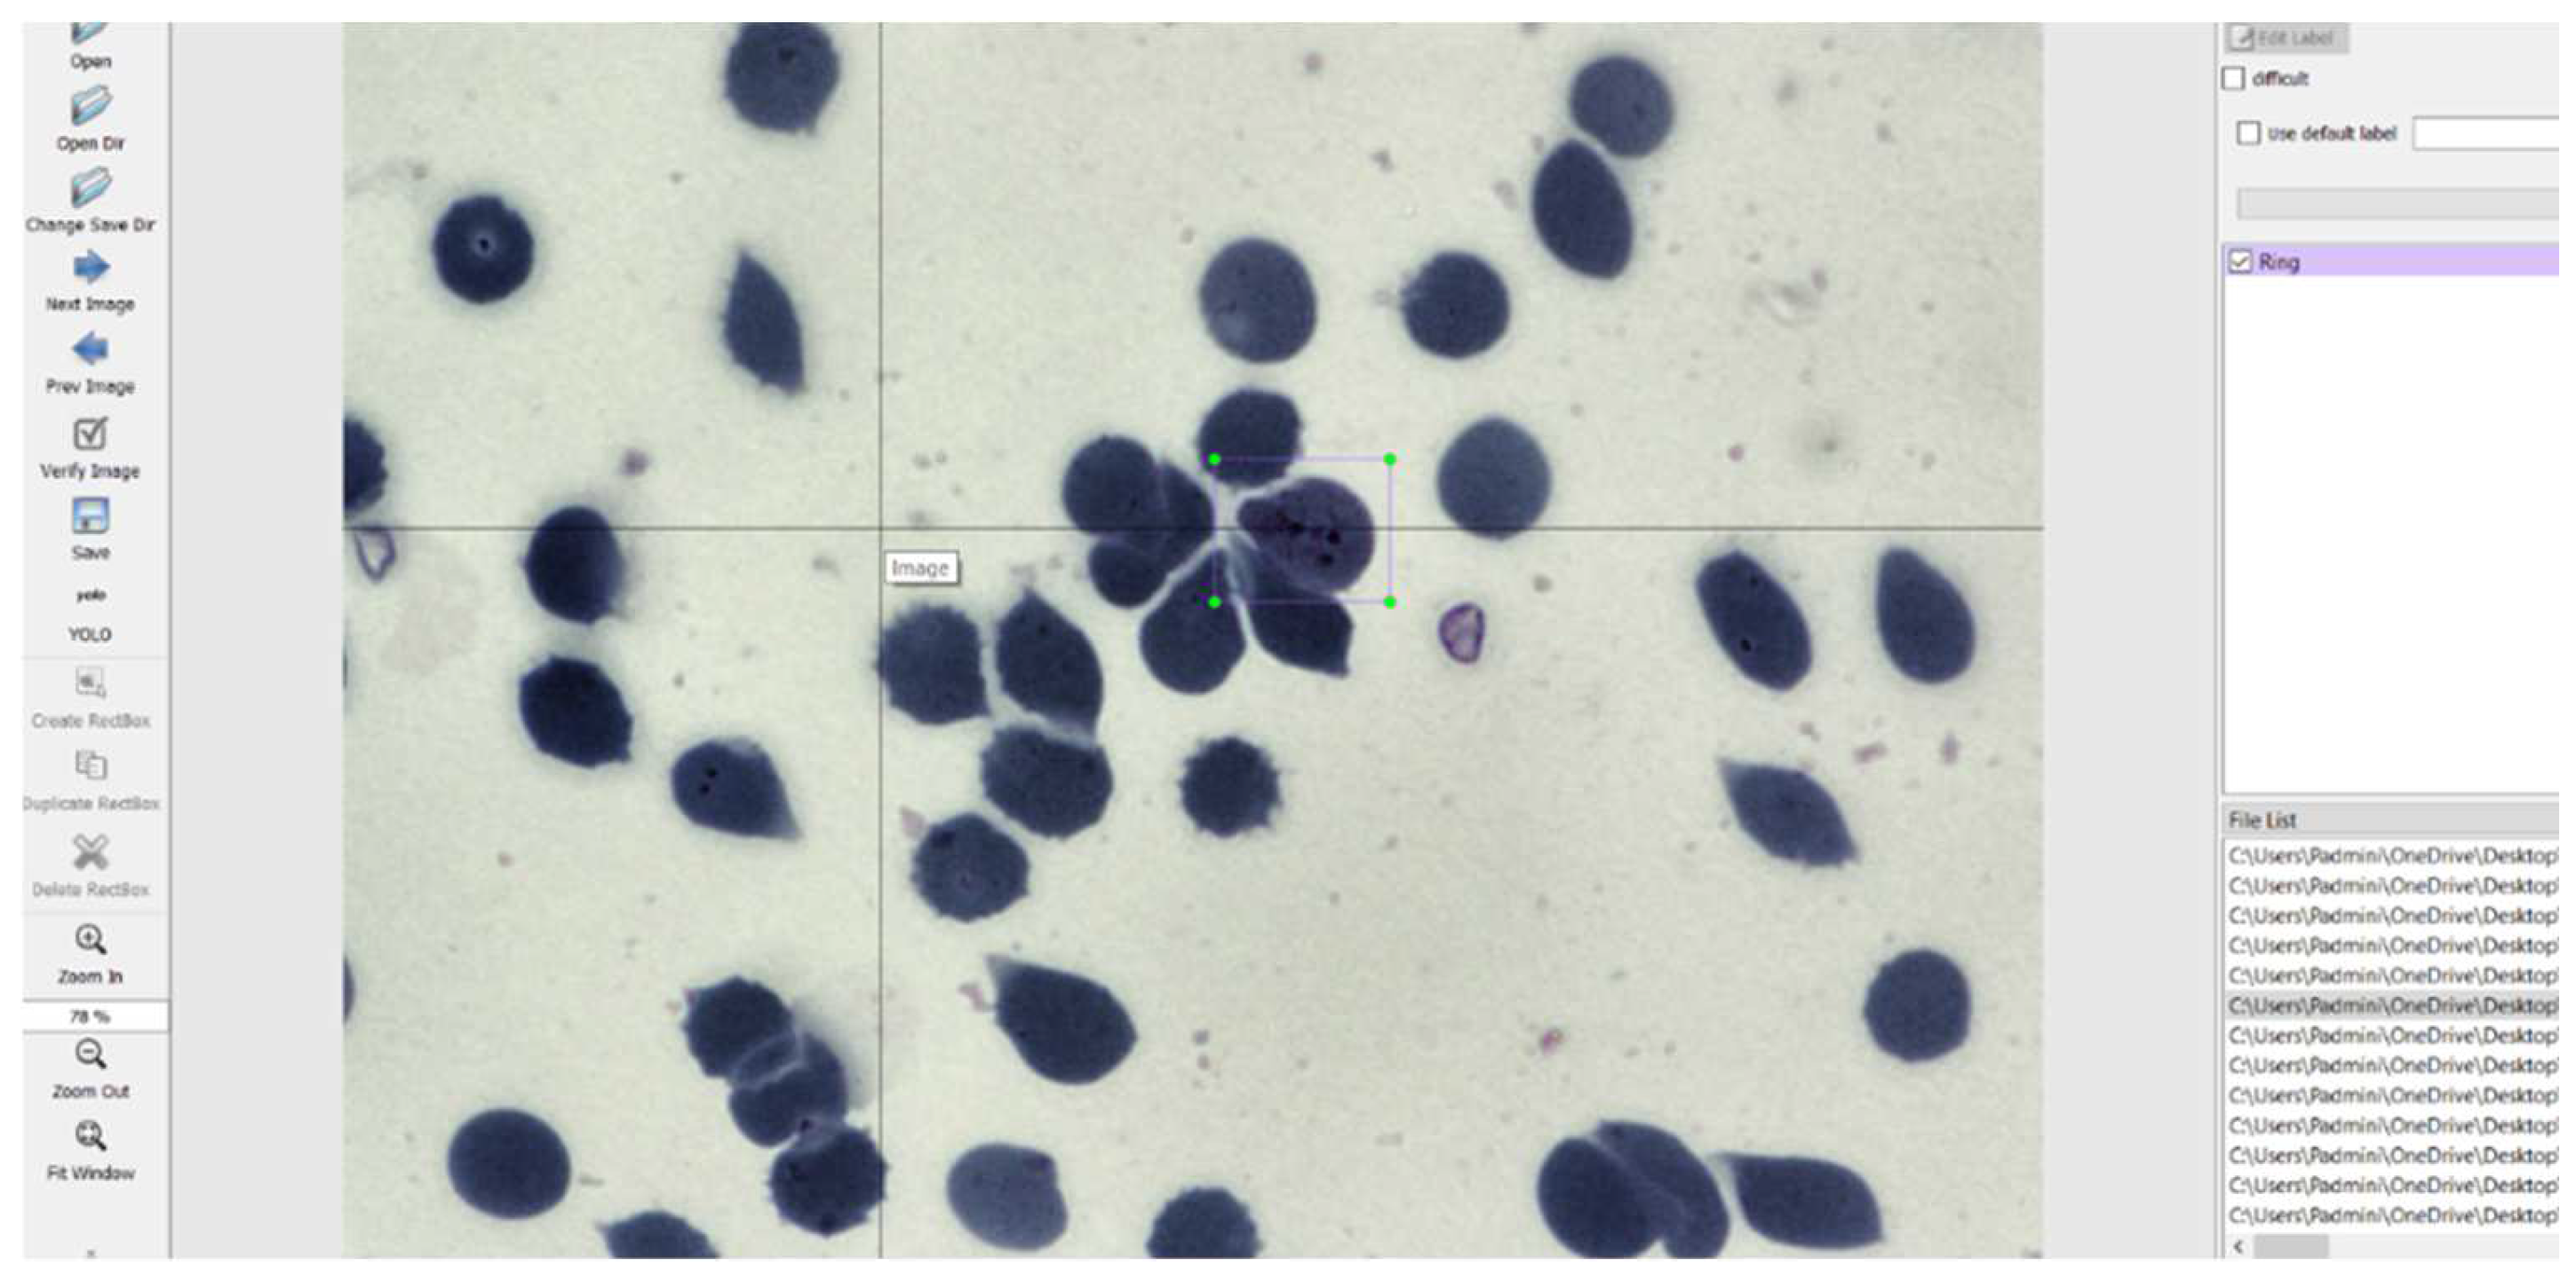
The images had to be manually annotated since their labels were not explicitly provided for each image. The LabelImg tool is used to manually annotate the images and create text files for each image containing the image’s annotations. This tool was developed and launched with a primary focus on manual annotations. Once the manual annotation is complete, the annotations are exported in the required format. The tool was cloned from a GitHub repository [24] and then deployed on a laptop. It simply records the coordinates of each object as drawn by the user and saves it along with the label of the object in a text file of the desired format. The input to the LabelImg must be a jpeg file and hence all the images were converted to that format to suit the requirements. The graphical user interface of LabelImg is illustrated in Figure 5 [25].
Looking at the objects of interest used in dataset 1 for parasite classification, it was observed that the class Falciparum were greater in number. This caused a significant bias while performing training. Information about the class and the number of corresponding samples is given in Table 1.
Generally, the performance of deep learning or object detection algorithm may depend on the data size and quality. The more data available for training, the better the algorithm learns and in turn performs. Currently, the dataset is rather small with a lot of underrepresented classes. Since the model is expected to perform better with more data, we perform augmentation to increase its size.
2.4. Data Augmentation
Augmentation is performed mainly for two reasons: To increase variability in the dataset and to increase the size of the dataset. Both are done with the interest of helping the algorithm learn better and faster. Augmentation is a crucial and vital step in any deep learning algorithm [26]. Once the annotations were created, they were converted to the yaml format expected by the YOLO models. The images were then preprocessed and augmented with the following specifics:
Preprocessing:
- Auto orientation.
- Resizing the images to fit 1080 × 1080. This increases the resolution of the images, thus increasing the model learning capacity.
Augmentations:
- Rotation between +15° and −15°.
- Brightness between +5% and −5%.
- Exposure between −7% and +7%.
- Blur up to 0.5 px.
- Noise up to 2% of pixels.
An example of the image after annotation and pre-processing performed by Roboflow is given below in Figure 6.
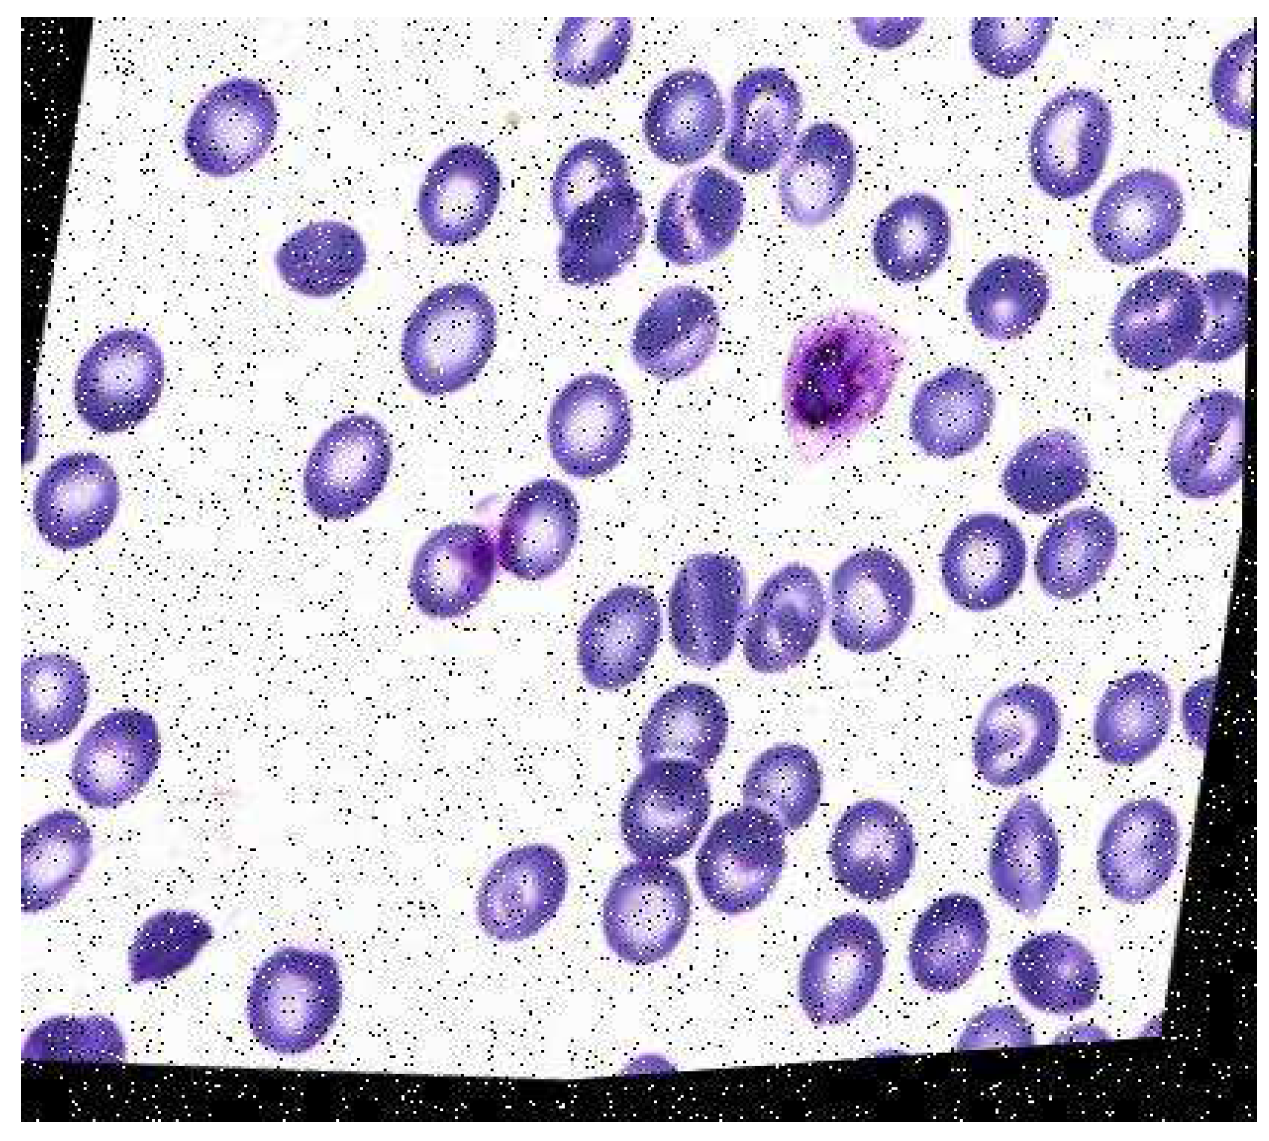
Roboflow also provides pre-processing and augmentation services. For pre-processing, the data were auto-oriented and then fit to the resolution 1080 × 1080. A consequence of this is the addition of black edges to match the required image resolution. Each image underwent one or more of the augmentations mentioned above, thus increasing the size of the dataset while introducing variability into the dataset. The final dataset before training had a total of 422 images. An example of the augmented data generated after augmentation was performed by Roboflow is depicted in Figure 7.
2.5. Stage Classification Data Structure
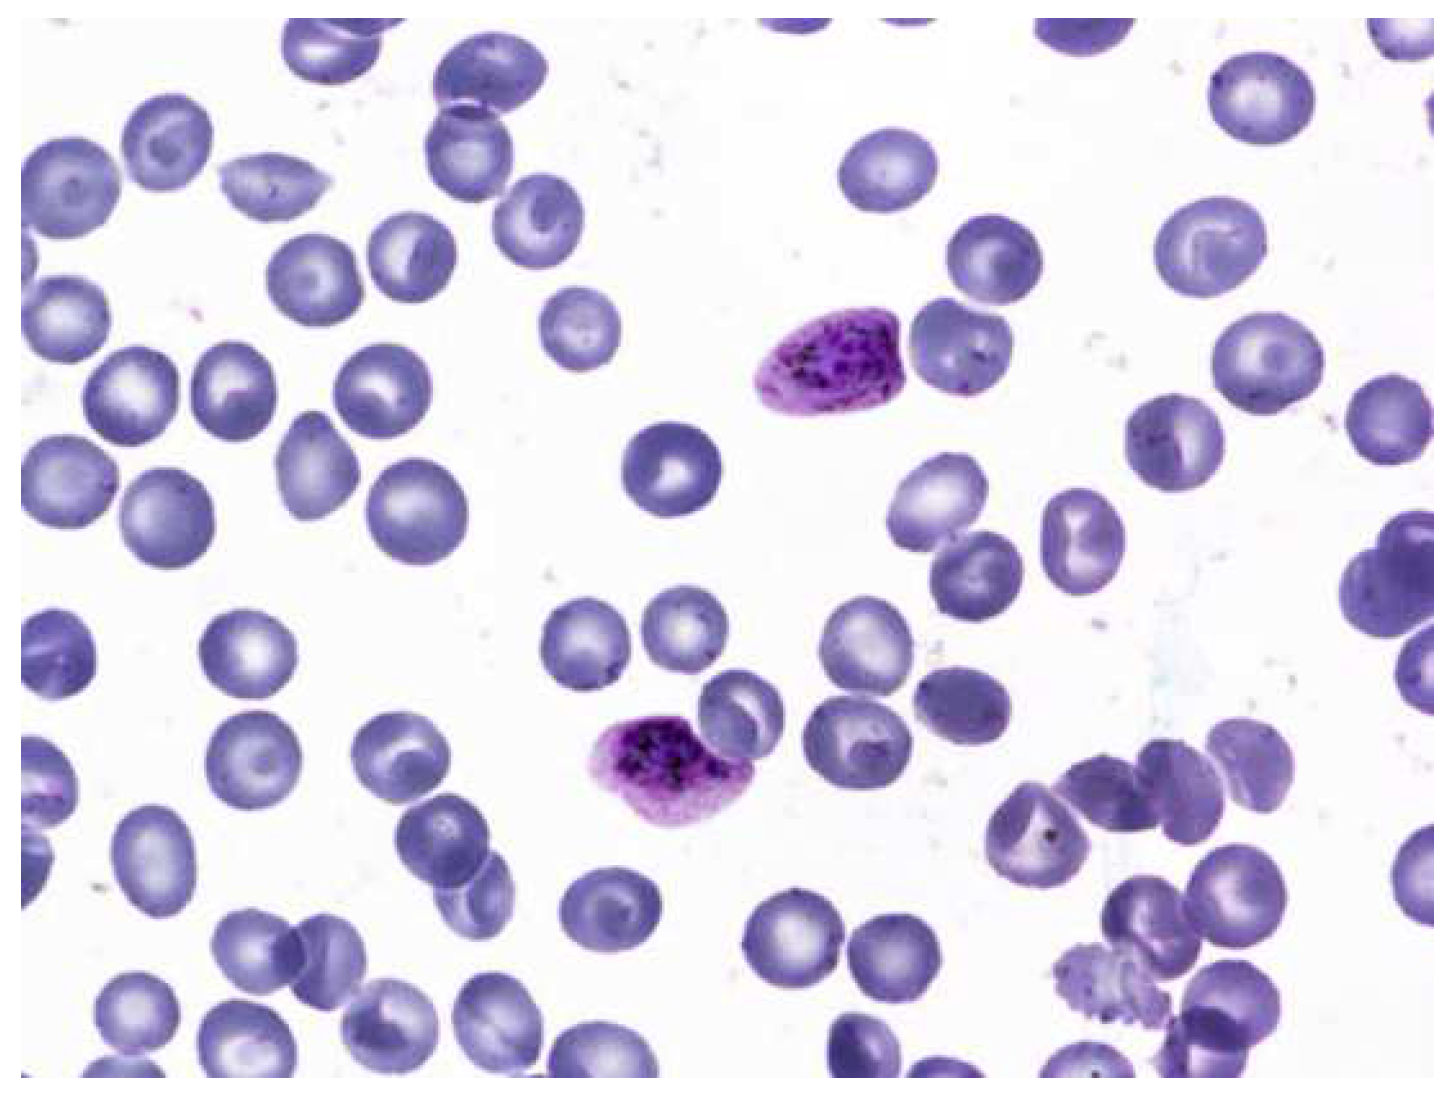
The dataset consisted of 1330 images of multicellular microscope slides [27] out of which only 830 were used. The rest were discarded and were not considered part of the dataset. This was mostly because the images were of poor quality, the objects of interest were indistinguishable during annotation, or the image suffered from staining aberrations. The dataset consisted of two classes of uninfected cells: leukocytes and red blood cells. There are four classes of infected cells: gametocytes, schizont, trophozoites, and rings. It is worth noting that cells of the type schizont, leukocytes, and gametocytes are less in number. The dataset also contained “json” files that had information regarding the labels. The file was then converted to a “.csv” format. This file was used as a reference to annotate the images manually using the LabelImg annotation tool. A sample image from the dataset is given in Figure 8.
The dataset had seven classes. They are as follows: ring, trophozoite, schizont, gametocyte, leukocyte, difficult and RBC. Out of these, RBC and leukocytes represented uninfected cells, whereas the other cells represented the presence of the malarial parasite in the cell. The approximate numbers of labels are provided in Table 2.
It is evident that there is a massive overrepresentation of red blood cells and a severe underrepresentation of leukocytes. This can potentially cause a significant learning bias during training and render the model unable to learn the labels of far greater importance, i.e., those with the malarial parasite.
The easiest way to deal with this is to remove the RBC labels from the list of annotations. This reduces the number of classes to 6 instead of 7 and allows the model to focus training on the labels with greater significance.
2.6. Data Augmentation
Once the annotations were created, the dataset was converted to the required scaled YOLOv4 and YOLOv5 formats as mentioned for the previous dataset. The images were then preprocessed and augmented with the following specifics:
Preprocessing:
- Auto orientation.
- Resizing the images to fit 1080 × 1080. This increases the resolution of the images, thus increasing the model learning capacity.
Augmentations:
- Rotation between +15° and −15°.
- Brightness between +5% and −5%.
- Exposure between −7% and +7%.
- Blur up to 0.5 px.
- Noise up to 2% of pixels.
An example of augmented data is given in Figure 9.
After augmentation, 1989 images were generated. These 1989 images were utilized for model training.
2.7. Model Implementation
The model was implemented in the PyTorch framework. The advantage of a Pytorch implementation lies in the allowance of a half floating-point precision in training and inference from 32 bits to 16 bits. This significantly speeds up the inference time of YOLOv5 models. Configuration files used to support and run the model are present in the “.yaml” file. These are condensed files that contain specifications of different layers in the network and then multiply them by the number of layers in a particular block. In this study, we focus on the YOLOv5 and scaled YOLOv4 models. We trained both the object detection models on the two sets of data to compare the results between the two versions of the object detection algorithm. The different aspects of the two models are indicated in Table 3.
All YOLO models have pre-trained weights based on the COCO dataset [28]. The COCO dataset is a dataset with 80 different classes of everyday objects. When the “.yaml” configuration files for this dataset are replaced with our dataset for the malaria project, the weights are accordingly shifted to suit the number of classes present in the dataset.
3. Results
3.1. Preliminary Results
The metric used to evaluate object detection models is the mean average precision (mAP) metric. This is calculated over the recall values and ranges between 0 and 1. The mAP is calculated as the weighted mean of precisions at each threshold. Here, the weight represents the difference in recall from the previous threshold. The models were trained for 200 and 400 epochs each to gauge their rudimentary performance before making any adjustments to the either the pre-processing or the training pipeline. The significance of these preliminary results lies not just in model validation, but also in understanding the model limitations and the quality of the dataset used. The preliminary results for stage classification are given in Table 4. The preliminary results for parasite classification are given in Table 5.
As shown in Table 4, the following changes were sequentially applied, and the models were trained to see if they improved the results; changes in augmentations were performed [26]. The resolution of the images was varied to test its effect on learning. The learning rate was also adjusted to observe any effect on learning. Upon further inspection of the dataset, it was concluded that it may not be well suited for object detection algorithms. Irregularities in the standard shape of RBCs also caused doubt in the correctness of the label information provided. Thus, this dataset was removed from consideration.
Since the same dataset that was considered for parasite classification contained annotation information for stage classification, it was repurposed to fit this task as well. The images were annotated according to the stages present with the following four classes: ring, trophozoite, schizont and gametocyte. The augmentations and pre-processing performed were the same as those performed for the parasite classification model, and then the model was run in the YOLOv5 and scaled YOLOv4 algorithms.
3.2. Final Results for Stage Classification
The models were first trained for 300 epochs and achieved mean average precisions of 41% and 44.5% for YOLOv5 and scaled YOLOv4, respectively. These results were unsatisfactory. As mentioned before, changes to the pre-processing and augmentations were made to see if the mAP could be improved. The dataset was even edited to have only images similar in color and shape of the cells, but this also did not affect the improvement of the mAP. Therefore, a fresh start was taken, and an alternate dataset was employed to train the algorithms. The results for the same are presented in Table 6
From Table 6, it is observed that the scaled YOLOv4 algorithm was able to predict the classes of the objects with a 68.4% accuracy. The YOLOv5 algorithm, on the other side did not perform as well. The results from the scaled YOLOv4 were considered as the relevant results for this part of the research. Figure 10 provides graphical information about the metrics: mean average precision, precision and recall for the superior model. Scaled YOLOv4 is trained with the second dataset for stage classification, and is shown in Figure 11 as an example output as to how the classification model identifies each stage of the cells.
As observable in the figure, the model can recognize cells and classify them according to stage. This is highlighted by the bounding boxes drawn over the infected red blood cells with the stage of progression.
3.3. Parasite Classification
The dataset corresponding to parasite classification was used to train the YOLOv5 and scaled YOLOv4 algorithms. Preliminary results were observed. After that, an alteration to the dataset augmentation was created. Saturation values were varied as an additional augmentation step, and the results are presented in Table 7.
The YOLOv5 model achieved a mAP of 78%, while the scaled YOLOv4 model achieved a mAP of 83%. It was then concluded that the scaled YOLOv4 model was superior to the YOLOv5 model for this application. Figure 12 provides graphical information about the metrics: mean average precision, precision, and recall for the superior model, and scaled YOLOv4 with the second dataset for stage classification.
Object detection models are not optimized for the detection of microorganisms from microscopic images, as they are minuscule objects. The proposed model can be improvised by adding more detection layers or by enhancing the accuracy of detection. Research published by Abdurahman et al. (2021) worked on this to detect malarial parasites using YOLOv3 and YOLOv4 algorithms (after additional optimization). Their results prove that optimized object detection can be used to detect malarial parasites with an accuracy of 96.32% [29]. Their study focused on binary classification and proposed a pipeline that focused on predicting the presence of only one parasite: plasmodium falciparum rather than a multi class approach as considered in this paper. The algorithms proposed in this paper are also expected to perform exponentially better after model optimization and increasing the feature scale to accurately identify the malarial parasite. Additionally, training the model for a larger number of epochs after optimizing its hyperparameters can also boost its learning capabilities.
The parasite classification conducted by the best model, scaled YOLOv4 after testing, is shown in Figure 13.
Once again, we can see that the model is able to classify the cells according to the parasite causing the infection highlighted by the bounding box with the name of the parasite. Therefore, it may be concluded that with the right data, the proper stage classification of malaria can be achieved. Parasite classification results also proved satisfactory but can be improved upon further research and development. In a comparison between YOLOv5 and scaled YOLOv4, scaled YOLOv4 proved to be superior in classifying the kind of parasite as well as the stage of progression of the disease. One reason why the YOLOv4 model outperformed the YOLOv5 model may be due to the fact that YOLOv5 suffers from higher latency periods for larger batch sizes. This results in a lower accuracy than that of YOLOv5. This is also taking into consideration that the dataset was of relatively poor resolution and the objects themselves, being red blood cells, were very small. The architecture of YOLOv4 may also have suited the objects of interests, as it has a strong detector module. The future scope of this project would begin with understanding the shortcomings of the dataset and the models used for parasite and stage detection. Further, they can be optimized to function more efficiently and predict the classes of the cells more accurately. This can aid with quicker and correct diagnoses.
Another vital area that could help improve not only the results of this study, but the entire field of digital pathology is increasing the amount of public data available for research and development. Artificial intelligence algorithms rely heavily on the quality and the quantity of the data used, and hence a vast database can be highly beneficial to both employees of the healthcare industry as well as the patients. The accuracy and performance of the models can also be improved by further pre-processing the images before beginning the training process. Various cell segmentation processes could be applied to assist better model learning [30,31].
It Is worth mentioning that cell segmentation process should not be mistaken for segmentation algorithms, such as U-Net that have been extensively researched upon [11]. Hasan et al. reported an accuracy of 92.06% on employing U-Net for cell segmentation. These results, while impressive, should not be compared to results from models employing CNNs or object detection algorithms. This is because the objective functions of the two models are distinct, and while segmentation algorithms focus on classifying each pixel of the image into respective classes, object detection algorithms focus on classifying patches of the image rather than pixels into their respective classes. A direct consequence is the requirement of different metrics and loss functions to measure the quality of the two models, thus rendering the results incomparable at face value.
Other image processing methods, such as feature scaling, may also be employed to facilitate better feature extraction and can significantly increase the learning ability of the models used [5,32,33]. Furthermore, models can be developed to ascertain the concentration of the parasite in the blood smear to better understand the rapid progression of the disease and make an appropriate diagnosis [33].
Optimized models that meet the required specifications can then be integrated with a microscope. The microscope is used to take the picture of the blood smear and then run it through the model to identify the parasite causing the infection and the stage of progression of the disease. This can be a great tool, as early treatment is a crucial factor for the recovery of the patient due to the rapidly progressive nature of the disease [34]. The authors would like to note that in the case of real-world deployment, the use of tools such as LabelImg for annotation and the Roboflow platform for augmentation is purely restricted to the data pre-processing pipeline, and they will not be required during deployment. They are only used to process the dataset used to train the optimized model. Once the model undergoes training, validation and testing and achieves satisfactory results, only the classification model will be deployed to detect and classify the malaria parasites.
The algorithms can also be used in telemedicine, where blood smears of patients in rural or places far from a laboratory are collected [35]. The images may then be sent to the concerned individuals and run through the algorithm. Thus, it can be used to treat patients in rural areas with poor resources and help change and better a pathologist’s approach to diagnosis [36,37]. Applications can also be built, such as portable impedance analyzers for rapid screening tests [38].
The approaches discussed in this project as well as the previous work conducted in the area cover a variety of model architectures, each with different objective functions. They are all, however, focused on a common goal: computer-aided malaria detection, or CAM detection. These CAM detection approaches offer a new perspective or second opinion to doctors [39,40]. Ranging from clustering algorithms to segmentation algorithms, there is great potential in computer-aided detection, and this can be the next revolutionary step in the healthcare industry.
4. Conclusions
Presently, many researchers focus on deep learning for the detection of malaria. However, these techniques vary from traditional segmentation or morphological operations to those that employ cutting edge deep learning or machine learning techniques. In this article, we explored the use of object detection techniques for the classification of the type of malarial parasite and the stage of progression of the disease. For the stage task, the dataset employed contained 1330 images of microscopic blood smears from patients infected with malaria. The label information for the images was extracted from the corresponding csv file, and the images were manually annotated using the LabelImg tool and then uploaded to the ‘Roboflow’ website for pre-processing and augmentation. The YOLOv5 and scaled YOLOv4 object detection models were then trained on this dataset. When this returned unsatisfactory results, changes were made to the pre-processing pipeline and the training pipeline to observe any significant changes in the training accuracy. This also returned unsatisfactory results, and thus the dataset was discarded. It is suspected that these data were unsuitable due to the large imbalances between the classes. Many were underrepresented, while few were vastly overrepresented. Thus, a second dataset was annotated (again using LabelImg). The data were uploaded to Roboflow and underwent pre-processing and augmentation, and then were used to train the models. By comparing the results obtained, we can conclude that the scaled YOLOv4 model is superior to the YOLOv5 model, scoring a mean average precision of 68.4% and is considered relevant to the research.
For the parasite classification part of the problem, the revised dataset used for stage classification was again annotated according to the classes fitting this task, using LabelImg, and then uploaded to Roboflow for pre-processing and augmentation. Then the data were used to train the YOLOv5 and scaled YOLOv4 models. On comparing the two models in the given reported study, it was observed that the scaled YOLOv4 model was better than the YOLOv5 model, achieving mean average precisions of 83% and 78%, respectively. The results of these models, while significant, can be improved in terms of mAP, precision, and recall.
The future scope of this research lies in improving the object detection models by adding depth to the model architecture and/or incorporating feature scaling to better suit tiny object detection as required for small objects, such as infected red blood cells in microscopic slides. The authors strongly believe that with the implementations of these improvements, the model can be deployed in real-world situations to assist clinicians in delivering accurate, fast and reliable treatment not only at hospitals, but also to rural areas of the world that lack access to healthcare resources. This can also help advance the field of telemedicine and promote affordable, accessible, and safe healthcare for everyone who needs it.
Author Contributions
P.K.: Software, Draft preparation; K.C.: formal analysis; N.S.: Supervision and project administration; S.R.: Draft editing; S.K.S.: Project administration and draft editing; S.P. Methodology, Draft editing. All authors have read and agreed to the published version of the manuscript.
Funding
This research received no external funding.
Institutional Review Board Statement
Not applicable.
Informed Consent Statement
Not applicable.
Data Availability Statement
The dataset that was considered for the stage classification task is the Mendeley dataset taken from the paper “Ljosa, V., Sokolnicki, K. & Carpenter, A. Annotated high-throughput microscopy image sets for validation. Nat Methods 9, 637 (2012). https://0-doi-org.brum.beds.ac.uk/10.1038/nmeth.2083.” [27]. The dataset for parasite classification is from “Loddo, A., Di Ruberto, C., Kocher, M. and Prod’Hom, G., 2018, September. MP-IDB: the malaria parasite image database for image processing and analysis. In Sipaim–Miccai Biomedical Workshop (pp. 57–65). Springer, Cham.” [24]. Both datasets are open sources and can be publicly accessed.
Acknowledgments
The authors would like to thank the Department of Biomedical Engineering, The Department of Computer Science and Engineering, Manipal Institute of Technology, MAHE and Manipal Institute of Management, MAHE for their encouragement, guidance and support through this research.
Conflicts of Interest
The authors declare no conflict of interest.
References
- Malaria, R.B. World Malaria Report 2005; World Health Organization: Geneva, Switzerland; UNICEF: Geneva, Switzerland, 2005.
- Murray, C.K.; Bennett, J.W. Rapid diagnosis of malaria. Interdiscip. Perspect. Infect. Dis. 2009, 2009, 415953. [Google Scholar] [CrossRef]
- Wood, B.R.; McNaughton, D. Resonance Raman spectroscopy in malaria research. Expert Rev. Proteom. 2006, 3, 525–544. [Google Scholar] [CrossRef]
- Raman, C.V.; Krishnan, K.S. A New Type of Secondary Radiation. Nature 1928, 121, 501–502. [Google Scholar] [CrossRef]
- Sampathila, N.; Shet, N.; Basu, A. Computational approach for diagnosis of malaria through classification of malaria parasite from microscopic image of blood smear. Biomed. Res. 2018, 29, 3464–3468. [Google Scholar] [CrossRef]
- Shute, P.G.; Maryon, M. An improved technique for staining malaria parasites with GIEMSA stain. Arch. Roum. Pathol. Exp. Microbiol. 1963, 22, 887–894. [Google Scholar]
- Tobie, J.E.; Coatney, G. Fluorescent antibody staining of human malaria parasites. E. Parasitol. 1961, 11, 128–132. [Google Scholar] [CrossRef]
- Shute, P.G. The staining of malaria parasites. Trans. R. Soc. Trop. Med. Hyg. 1966, 60, 412–416. [Google Scholar] [CrossRef]
- Tuteja, R. Malaria—An overview. FEBS J. 2007, 274, 4670–4679. [Google Scholar] [CrossRef]
- Crutcher, J.M. Medical Microbiology, 4th ed.; University of Texas Medical Branch: Galveston, TX, USA, 1996. Available online: https://0-www-ncbi-nlm-nih-gov.brum.beds.ac.uk/books/NBK8584 (accessed on 8 June 2022).
- Sifat, M.H.; Islam, M.M. A Fully Automated System to Detect Malaria Parasites and their Stages from the Blood Smear. In Proceedings of the 2020 IEEE Region 10 Symposium (TENSYMP), Dhaka, Bangladesh, 5–7 June 2020; pp. 1351–1354. [Google Scholar] [CrossRef]
- Nayak, S.; Kumar, S.; Jangid, M. Malaria detection using multiple deep learning approaches. In Proceedings of the 2019 2nd International Conference on Intelligent Communication and Computational Techniques (ICCT), Jaipur, India, 8–29 September 2019; pp. 292–297. [Google Scholar]
- Roy, K.; Sharmin, S.; Mukta, R.B.M.; Sen, A. Detection of Malaria Parasite in Giemsa Blood Sample Using Image Processing. Int. J. Comput. Sci. Inf. Technol. 2018, 10, 55–65. [Google Scholar] [CrossRef]
- Scherr, T.F.; Gupta, S.; Wright, D.W.; Haselton, F.R. Mobile phone imaging and cloud-based analysis for standardized malaria detection and reporting. Sci. Rep. 2016, 6, 28645. [Google Scholar] [CrossRef] [Green Version]
- Li, D.; Ma, Z. Residual attention learning network and SVM for malaria parasite detection. Multimed. Tools Appl. 2022, 81, 10935–10960. [Google Scholar] [CrossRef]
- Francies, M.L.; Ata, M.M.; Mohamed, M.A. A robust multiclass 3D object recognition based on modern YOLO deep learning algorithms. Concurr. Comput. Pract. Exp. 2022, 34, e6517. [Google Scholar] [CrossRef]
- Khandekar, R.; Shastry, P.; Jaishankar, S.; Faust, O.; Sampathila, N. Automated blast cell detection for Acute Lymphoblastic Leukemia diagnosis. Biomed. Signal Process. Control 2021, 68, 102690. [Google Scholar] [CrossRef]
- Tack, A.; Preim, B.; Zachow, S. Fully automated Assessment of Knee Alignment from Full-Leg X-Rays employing a “YOLOv4 And Resnet Landmark regression Algorithm” (YARLA): Data from the Osteoarthritis Initiative. Comput. Methods Programs Biomed. 2021, 205, 106080. [Google Scholar] [CrossRef]
- Huang, D.; Cheng, J.; Fan, R.; Su, Z.; Ma, Q.; Li, J. Bone Marrow Cell Recognition: Training Deep Object Detection with A New Loss Function. In Proceedings of the 2021 IEEE International Conference on Imaging Systems and Techniques (IST) 2021, Kaohsiung, Taiwan, 24–26 August 2021; pp. 1–6. [Google Scholar] [CrossRef]
- Manning, K.; Zhai, X.; Yu, W. Image analysis and machine learning-based malaria assessment system. Digit. Commun. Netw. 2021, 8, 132–142. [Google Scholar] [CrossRef]
- Reddy, A.S.B.; Juliet, D.S. Transfer learning with ResNet-50 for malaria cell-image classification. In Proceedings of the 2019 International Conference on Communication and Signal Processing (ICCSP), Melmaruvathur, India, 4–6 April 2019; pp. 0945–0949. [Google Scholar]
- Krishnadas, P.; Sampathila, N. Automated Detection of Malaria implemented by Deep Learning in Pytorch. In Proceedings of the 2021 IEEE International Conference on Electronics, Computing and Communication Technologies (CONECCT), Bangalore, India, 9–11 July 2021; pp. 01–05. [Google Scholar] [CrossRef]
- Bochkovskiy, A.; Wang, C.Y.; Liao, H.Y.M. Yolov4: Optimal speed and accuracy of object detection. arXiv 2020, arXiv:2004.10934. [Google Scholar]
- Loddo, A.; Di Ruberto, C.; Kocher, M.; Prod’Hom, G. MP-IDB: The Malaria Parasite Image Database for Image Processing and Analysis. In Proceedings of the Sipaim–Miccai Biomedical Workshop, Granada, Spain, 20 September 2018; pp. 57–65. [Google Scholar] [CrossRef]
- Lin, T.Y.; Maire, M.; Belongie, S.; Hays, J.; Perona, P.; Ramanan, D.; Dollár, P.; Zitnick, C.L. September. Microsoft coco: Common objects in context. In European conference on computer vision, Zurich, Switzerland, 6–12 September 2014; Springer: Cham, Switzerland, 2014; pp. 740–755. [Google Scholar]
- Perez, L.; Wang, J. The effectiveness of data augmentation in image classification using deep learning. arXiv 2017, arXiv:1712.04621. [Google Scholar]
- Ljosa, V.; Sokolnicki, K.L.; Carpenter, A.E. Annotated high-throughput microscopy image sets for validation. Nat. Methods 2012, 9, 637. [Google Scholar] [CrossRef]
- Kim, D.H. Evaluation of COCO validation 2017 dataset with YOLOv3. Evaluation 2019, 6, 10356–10360. [Google Scholar]
- Abdurahman, F.; Fante, K.A.; Aliy, M. Malaria parasite detection in thick blood smear microscopic images using modified YOLOV3 and YOLOV4 models. BMC Bioinform. 2021, 22, 1–17. [Google Scholar] [CrossRef]
- Savkare, S.; Narote, S. Automated system for malaria parasite identification. In Proceedings of the 2015 International Conference on Communication, Information & Computing Technology (ICCICT), Mumbai, India, 15–17 January 2015; pp. 1–4. [Google Scholar] [CrossRef]
- Makkapati, V.V.; Rao, R.M. Segmentation of malaria parasites in peripheral blood smear images. In Proceedings of the 2009 IEEE International Conference on Acoustics, Speech and Signal Processing, Taipei, Taiwan, 19–24 April 2009; pp. 1361–1364. [Google Scholar] [CrossRef]
- Wattana, M.; Boonsri, T. Improvement of complete malaria cell image segmentation. In Proceedings of the 2017 Twelfth International Conference on Digital Information Management (ICDIM), Fukuoka, Japan, 12–14 September 2017; pp. 319–323. [Google Scholar]
- Ghanmode, B.D.; Paikrao, P.L. Malaria parasite concentration determination using digital image processing. In Proceedings of the 2018 4th International Conference for Convergence in Technology (I2CT), Mangalore, India, 27–28 October 2018; pp. 1–4. [Google Scholar]
- Perlmann, P.; Troye-Blomberg, M. (Eds.) Malaria Immunology; Karger Medical and Scientific Publishers: Basel, Switzerland, 2002; Volume 80. [Google Scholar]
- Hjelm, N.M. Benefits and drawbacks of telemedicine. J. Telemed. Telecare 2005, 11, 60–70. [Google Scholar] [CrossRef] [PubMed]
- Mayrose, H.; Sampathila, N.; Bairy, G.M.; Belurkar, S.; Saravu, K.; Basu, A.; Khan, S. Intelligent algorithm for detection of dengue using mobilenetv2-based deep features with lymphocyte nucleus. Expert Syst. 2021, e12904. [Google Scholar] [CrossRef]
- Upadya, P.S.; Sampathila, N.; Hebbar, H.; Pai, S.B. Machine learning approach for classification of maculopapular and vesicular rashes using the textural features of the skin images. Cogent Eng. 2022, 9, 2009093. [Google Scholar] [CrossRef]
- Rosa, B.M.; Yang, G.Z. Portable Impedance Analyzer as a Rapid Screening Tool for Malaria: An Experimental Study With Culture and Blood Infected Samples by Early Forms of Plasmodium Falciparum. IEEE Trans. Biomed. Eng. 2020, 67, 3531–3541. [Google Scholar] [CrossRef]
- Abbas, S.S.; Dijkstra, T. Malaria-Detection-2019. Mendeley Data, V1. 2019. Available online: https://data.mendeley.com/datasets/5bf2kmwvfn/1 (accessed on 8 June 2022).
- Narayanan, B.N.; Ali, R.; Hardie, R.C. Performance analysis of machine learning and deep learning architectures for malaria detection on cell images. In Applications of Machine Learning; SPIE: Bellingham, WA, USA, 2019; Volume 11139, pp. 240–247. [Google Scholar]
Figure 1.
Giemsa-stained thin blood smear from malaria patient [8].
Figure 1.
Giemsa-stained thin blood smear from malaria patient [8].

Figure 2.
Malaria parasites and stages of progression.

Figure 3.
YOLOv5 architecture [16].
Figure 3.
YOLOv5 architecture [16].

Figure 4.
Sample image from the dataset.

Figure 5.
LabelImg User Interface.

Figure 6.
Example of an image after annotation and pre-processing.

Figure 7.
Microscopic image of blood smear after augmentation.

Figure 8.
Sample image from the dataset.

Figure 9.
Augmented data.

Figure 10.
Metrics for stage classification model: scaled YOLOv4.

Figure 11.
Stage classification prediction testing by scaled YOLOv4.

Figure 12.
Metrics for scaled YOLOv4 for parasite classification.

Figure 13.
Parasite classification by scaled YOLOv4 algorithm after testing.


Table 1.
Distribution of the number of samples between classes for parasite classification dataset.
| Class | No. of Samples |
|---|---|
| Falciparum | 203 |
| Ovale | 40 |
| Malariae | 43 |
| Vivax | 67 |
Table 2.
Distribution of the number of labels between classes for stage classification dataset.
| Class | No. of Labels |
|---|---|
| RBC | 95,000 |
| Trophozoite | 650 |
| Ring | 478 |
| Schizont | 273 |
| Gametocyte | 218 |
| Leukocyte | 146 |
| Difficult | 301 |
Table 3.
Comparison between scaled YOLOv4 and YOLOv5.
| Scaled YOLOv4 | YOLOv5 | |
|---|---|---|
| Layers | 334 | 283 |
| Parameters | 5.25155 × 10⁷ | 7,263,185 |
| Gradients | 5.25155 × 10⁷ | 7,263,185 |
Table 4.
Preliminary results for stage classification.
| YOLOv5 | Scaled YOLOv4 | |
|---|---|---|
| Precision | 0.393 | 0.314 |
| Recall | 0.499 | 0.726 |
| mAP | 0.417 | 49.8 |
| Loss | 0.017 | 0.038 |
| Epochs | 200 | 200 |
| Image resolution | 720 × 720 | 720 × 720 |
| Batch size | 16 | 16 |
Table 5.
Preliminary results for parasite classification.
| YOLOv5 | Scaled YOLOv4 | |
|---|---|---|
| Precision | 0.701 | 0.52 |
| Recall | 0.787 | 0.938 |
| mAP | 0.70 | 0.83 |
| Loss | 0.20 | 0.021 |
| Time | 57 min 25 s | 3 h 26 min |
| Epochs | 400 | 400 |
| Image resolution | 720 × 720 | 720 × 720 |
| Batch size | 16 | 16 |
Table 6.
Comparison of the results for stage classification with the revised dataset.
| YOLOv5 | Scaled YOLOv4 | |
|---|---|---|
| Precision | 0.447 | 0.369 |
| Recall | 0.556 | 0.859 |
| mAP | 0.399 | 0.684 |
| Loss | 0.103 | 0.039 |
| Time | 1 h 22 min | 2 h 2 min |
| Epochs | 200 | 200 |
| Image resolution | 416 | 416 |
| Batch size | 16 | 16 |
Table 7.
Comparison of the results for parasite classification.
| YOLOv5 | Scaled YOLOv4 | |
|---|---|---|
| Precision | 0.741 | 0.52 |
| Recall | 0.797 | 0.938 |
| mAP | 0.78 | 0.83 |
| Loss | 0.020 | 0.021 |
| Time | 52 min 5 s | 3 h 26 min |
| Epochs | 400 | 400 |
| Image resolution | 720 × 720 | 720 × 720 |
| Batch size | 16 | 16 |
Publisher’s Note: MDPI stays neutral with regard to jurisdictional claims in published maps and institutional affiliations. |
© 2022 by the authors. Licensee MDPI, Basel, Switzerland. This article is an open access article distributed under the terms and conditions of the Creative Commons Attribution (CC BY) license (https://creativecommons.org/licenses/by/4.0/).
Share and Cite
MDPI and ACS Style
Krishnadas, P.; Chadaga, K.; Sampathila, N.; Rao, S.; S., S.K.; Prabhu, S. Classification of Malaria Using Object Detection Models. Informatics 2022, 9, 76. https://0-doi-org.brum.beds.ac.uk/10.3390/informatics9040076
AMA Style
Krishnadas P, Chadaga K, Sampathila N, Rao S, S. SK, Prabhu S. Classification of Malaria Using Object Detection Models. Informatics. 2022; 9(4):76. https://0-doi-org.brum.beds.ac.uk/10.3390/informatics9040076
Chicago/Turabian StyleKrishnadas, Padmini, Krishnaraj Chadaga, Niranjana Sampathila, Santhosha Rao, Swathi K. S., and Srikanth Prabhu. 2022. "Classification of Malaria Using Object Detection Models" Informatics 9, no. 4: 76. https://0-doi-org.brum.beds.ac.uk/10.3390/informatics9040076
Note that from the first issue of 2016, this journal uses article numbers instead of page numbers. See further details here.