Hydro-Thermo-Mechanical Analysis of an Existing Gravity Dam Undergoing Alkali–Silica Reaction


Department of Civil and Environmental Engineering, Politecnico di Milano, Piazza Leonardo da Vinci 32, 20133 Milan, Italy
*
Author to whom correspondence should be addressed.
Infrastructures 2019, 4(3), 55; https://0-doi-org.brum.beds.ac.uk/10.3390/infrastructures4030055
Submission received: 11 July 2019
/
Revised: 9 August 2019
/
Accepted: 15 August 2019
/
Published: 22 August 2019
(This article belongs to the Special Issue Advances in Dam Engineering)
Abstract
:The alkali–silica reaction is a chemical phenomenon that, by inducing expansion and the formation of cracks in concrete, can have a severe impact on the safety and functioning of existing concrete dams. Starting from a phenomenological two-phase isotropic damage model describing the degradation of concrete, the effects of alkali-silica reaction in an existing concrete gravity dam are evaluated and compared with real monitoring data. Considering the real temperature and humidity variations, the influence of both temperature and humidity are considered through two uncoupled diffusion analyses: a heat diffusion analysis and a moisture diffusion analysis. The numerical analyses performed with the two-phase damage model allow for prediction of the structural behaviour, both in terms of reaction extent and increase of crest displacements. The crest displacements are compared with the real monitoring data, where reasonably good agreement is obtained.
1. Introduction
The alkali–silica reaction (ASR) is a chemical phenomenon that may occur over time in concrete between the alkaline cement paste and the reactive silica present in some kinds of aggregates. This reaction causes expansion of the altered aggregate by the formation of a viscous gel, which increases in volume when absorbing water. This gel exerts an expansive pressure inside the siliceous aggregate and/or at the interface between aggregates and the cement paste, causes spalling and loss of stiffness of the concrete and, finally, leads to the formation of cracks [1]. While ASR can be avoided in new concrete structures by the selection of non-reactive aggregates and/or by the chemical composition of cement (which determines the alkali ion concentration in the pore solution [2]) and additions [3,4,5], ASR can lead to serious cracking in concrete structures built several decades ago in very wet environments (e.g., dams), resulting in critical structural problems. It takes many years for the reaction to develop and the symptoms to become visible, in terms of an increase in displacements and of a pattern of diffuse localized micro- and macro-cracks [6]. Several examples of important concrete structures, such as dams or shielding in nuclear plants, subject to ASR have been reported in the literature (see, e.g., [7,8,9]).
The expansion of concrete as a result of the reaction between cement and aggregates was first studied in [1]. Since then, much research effort has been devoted to describing the reactions occurring between aggregates and cement paste, in order to experimentally characterize the consequent expansion (as in [10]) and to develop material models to describe the mechanical effects at different scales (see, e.g., [11,12]) but, very often, there is a lack of validation of the proposed models at a structural level, as has been pointed out in [13]. Significant examples of analyses conducted on dams affected by ASR can be found in [14,15,16,17].
The purpose of this paper is to further validate the bi-phase damage model proposed in [18] by simulating the experimental campaign reported in [19] and to present a case study concerning the analysis, using that model, of a real concrete dam affected by ASR. As the kinetics of ASR strongly depend on the evolution of the temperature and humidity, as described in [20,21], we use real monitoring data of temperature variations and air humidity to compute the temperature and degree of saturation fields through preliminary heat and moisture diffusion analyses. Then, following a weakly coupled strategy, we perform an elasto-damage analysis, which allows for computation of the displacement evolution and the damage patterns.
2. Bi-Phase Damage Model
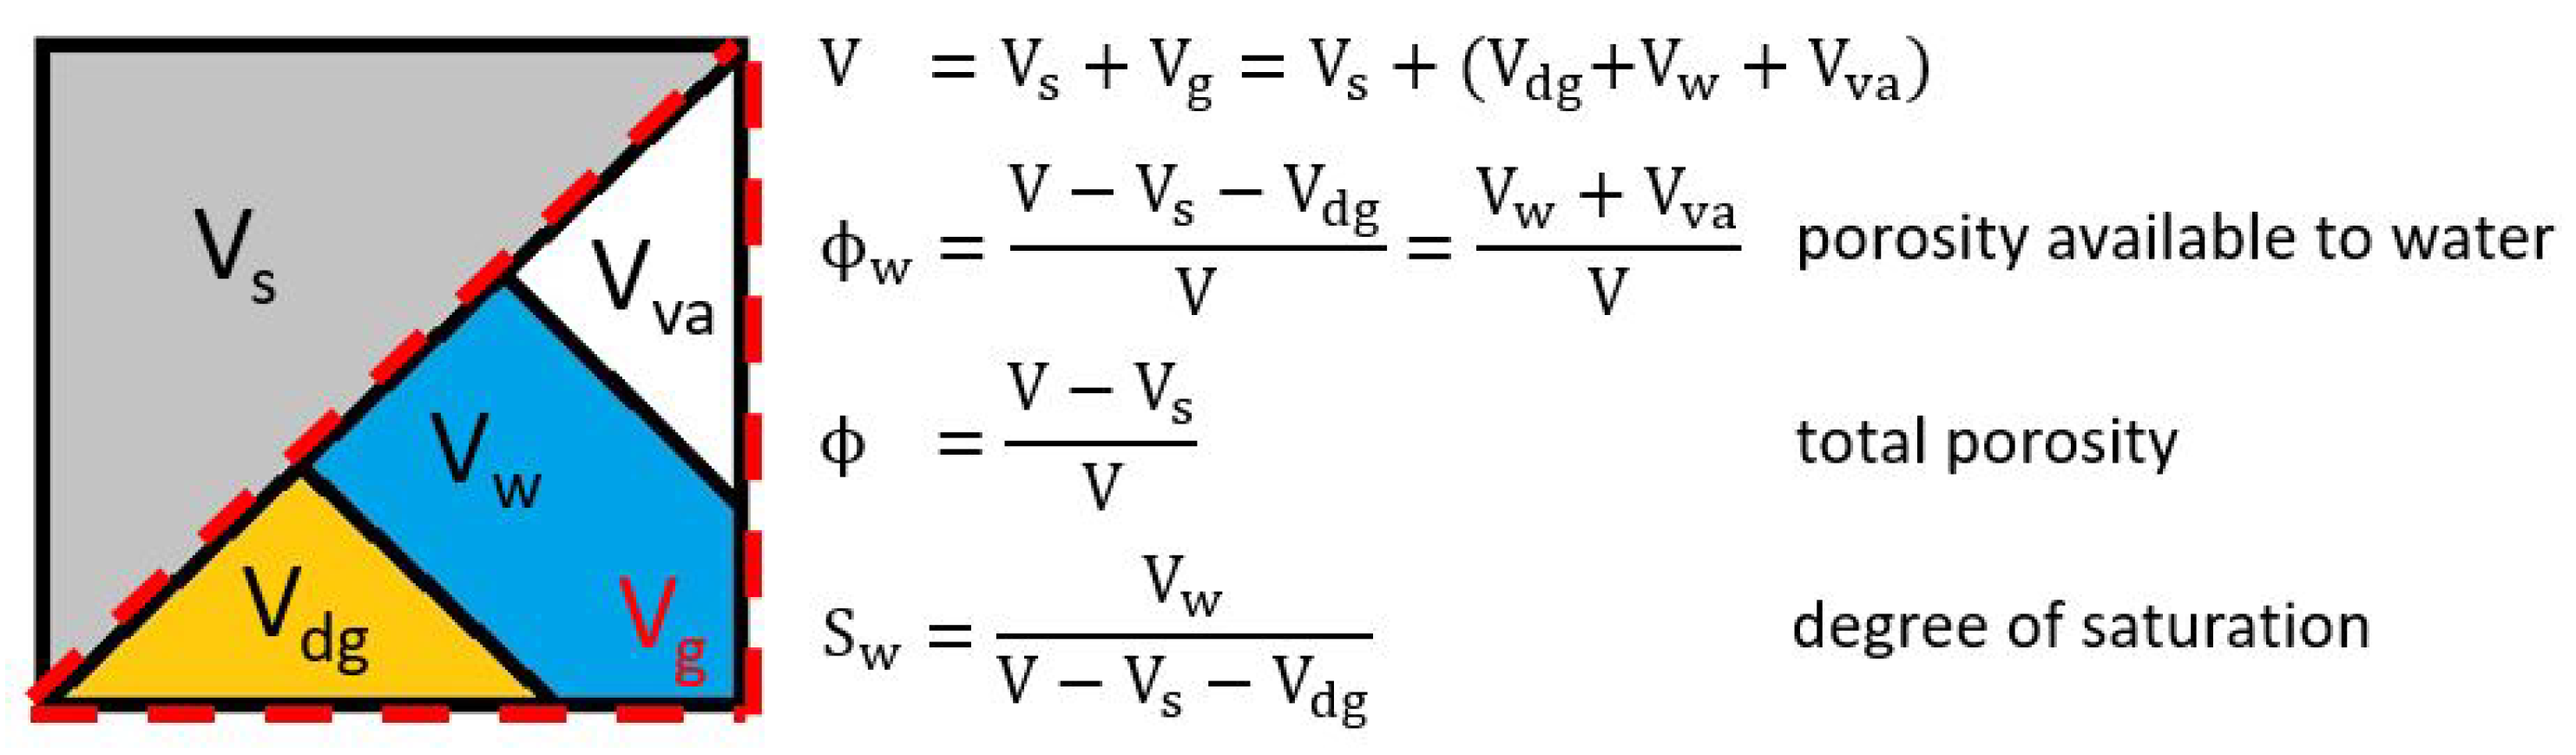
In this section, a brief summary of the chemo-damage model is given (for details, see [18]). At the meso-scale, concrete affected by ASR is described as a two-phase heterogeneous material constituted by a solid skeleton s and a wet gel g produced by ASR. The total volume V is, hence, divided into , the solid volume, and , the volume occupied by the dry gel , liquid water w, and the vapor and air phase (see Figure 1).
Assuming small strains and quasi-static conditions, the compatibility and equilibrium equations for the bi-phase solid are
where is the small strain tensor of the skeleton; is the skeleton displacement; is the Cauchy stress; is the mass density ( and being the intrinsic solid and fluid mass densities, respectively); and is the body force of the combination of solid and fluid. In this model, the variable which accounts for the gel formation and expansion (considered simultaneously) is the volumetric fraction of the wet gel,
To take into account the influence of humidity and temperature, the degree of saturation and the temperature T are included as additional state variables and proper conservation and transport laws are necessary. In particular, by combining the mass conservation law for liquid water and the transport law for moisture in its liquid form, as proposed in [22], and the relation between the water pressure and the degree of saturation given by the experimental capillarity curve (see, e.g., [23]), one obtains the non-linear transport law for moisture (in its liquid form) as
where is the permeability of concrete, dependent on the degree of saturation
where , , and are material parameters; k is the intrinsic permeability; and is the dynamic viscosity.
Regarding the temperature, the heat conservation law, combined with linear and isotropic Fourier conduction laws, gives the following heat transport law
where C is the volumetric heat capacity of concrete and is the isotropic heat conductivity coefficient.
In a bi-phase model, the stress is the sum of the effective stress (acting on the skeleton) and of the stress - (acting on the fluid phase), where b is Biot’s coefficient and p is the fluid pressure (see [24]). In the bi-phase model proposed in [18,25], the fluid phase is constituted of the wet gel and the material behaviour is assumed to be elastic with isotropic damage. The state equations, hence, read
where G and K are the shear and bulk moduli of the homogenized concrete skeleton, respectively; is the deviatoric strain tensor; M is the Biot modulus; and are the volumetric coefficients of thermal expansion of the skeleton and of the gel, respectively; is the temperature variation, with respect to a reference temperature ; and D is the isotropic damage variable.
The constitutive model is completed by the definition of the evolution law for the gel volume content, assumed to be proportional to the reaction extent , a phenomenological internal variable varying from 0 to 1,
where is the free asymptotic volumetric expansion due to ASR in the isothermal fully saturated case ( = 1).
The following form for the reaction rate is considered:
with
where and are material parameters, which are calibrated with experimental data.
In the present work, the following law for the intrinsic time is assumed, as in [18]
where and are defined as (with i = , )
where and [K] denote the Arrhenius activation energies, representing the energy that must be reached for a chemical reaction to occur.
For simplicity, and in view of the specific application of this paper, we only consider the activation of damage for prevaling tensile stress state, instead of the more general bi-dissipative damage model [26]. The evolution of the tensile damage variable D is governed by the loading–unloading conditions, defined in terms of and p through the inelastic effective stress (with ):
where f is the damage activation function; is the deviatoric stress; , , and are material parameters governing the shape and dimensions of the elastic domain (see [26] for details); and h is the softening function, defined as
The parameter c in Equation (17) tunes the specific fracture energy of the model.
3. Model Validation
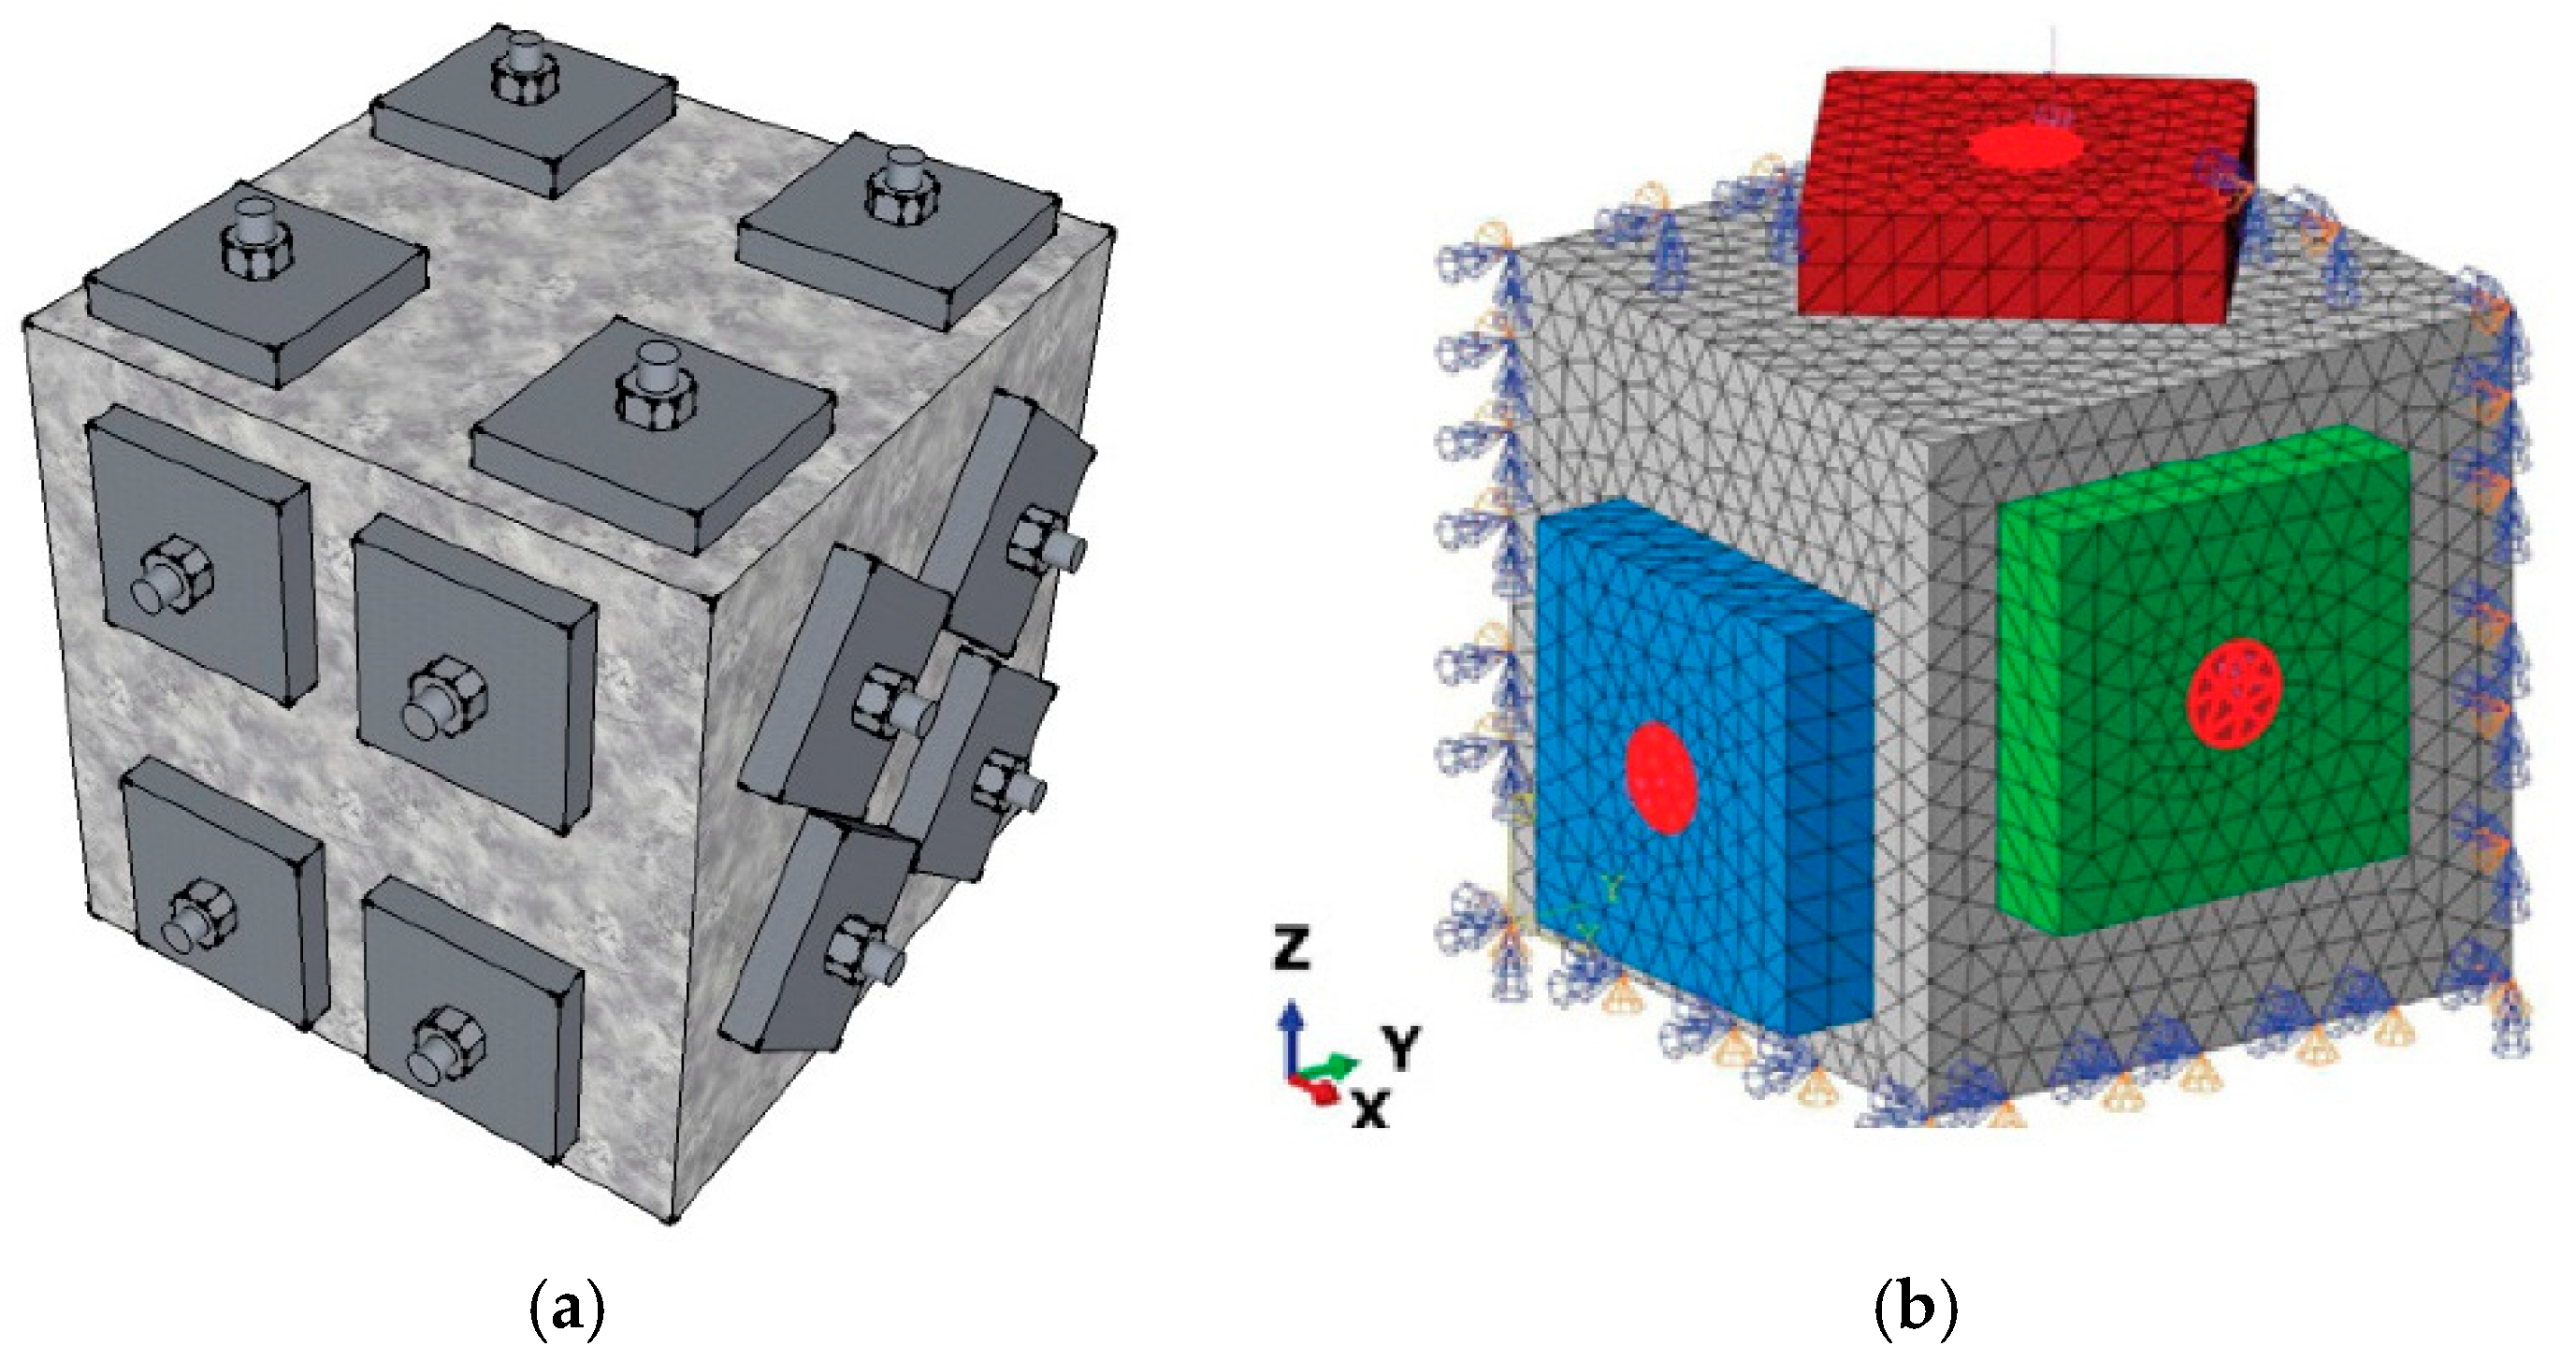
The model used in this work, already employed in [18,25] to simulate the experimental campaigns in [21,27], is here further validated by simulating the recent experimental campaign of [19,28]. In these works, the expansion of cubic specimens (of 254 mm side) of concrete affected by ASR and subject to multi-axial stresses was measured. The post-tensioning method of pre-stressing was chosen as the technique to apply and sustain the desired compressive stresses in the concrete specimens. The stress application in one direction required four high-strength bolts to be inserted into four rigid sheaths embedded in the concrete during casting. Figure 2a shows the experimental configuration for a three-axial stress-state application. Each bolt was stretched to a desired stress level by producing a reaction against a pair of bearing plates placed symmetrically on the opposite surfaces of a concrete specimen. Different dimensions of bolts allow for obtaining the average nominal compression stress in the concrete, in a range of 0–9.6 MPa.
Four (three reactive and one non-reactive to serve as the control specimen) cubic specimens were cast for each of the different stress states. Expansion for reactive specimens due to ASR can be decoupled from the creep and shrinkage strains by taking the algebraic difference between the expansion of a reactive specimen and the corresponding expansion of the control specimen (non-reactive concrete) at an identical stress state. We will refer to these data as ASR-only results. The stress was applied for 52–56 days after casting at room temperature. After 180 days, the specimens were conditioned inside an acceleration chamber maintained at 50 C and close to 100% relative humidity to promote and accelerate ASR. During these tests, the strains were monitored in the three directions as the average of the four measurements.
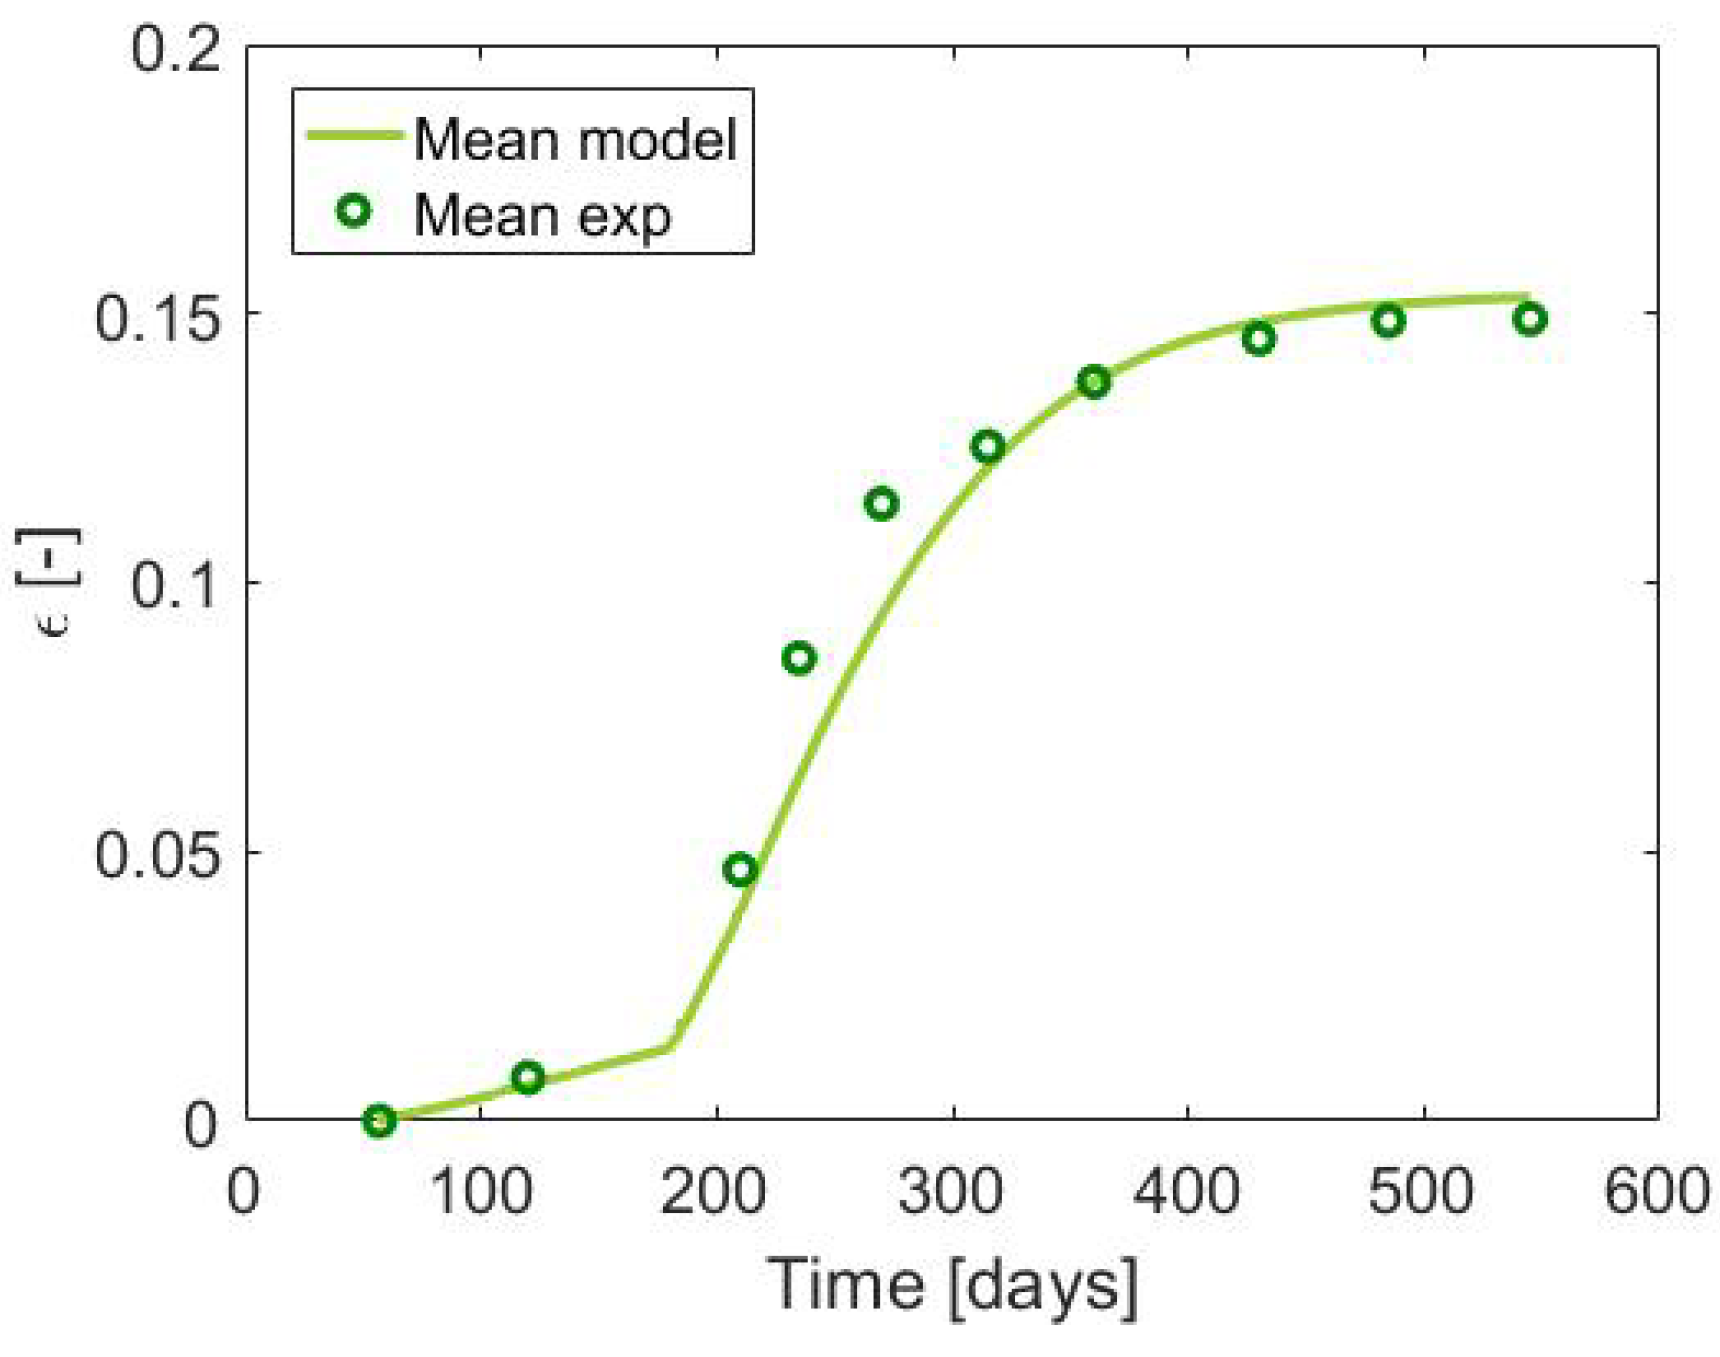
To simulate these experimental results, we assumed the mechanical parameters of concrete given in [19] and calibrated the material parameters governing the ASR evolution with the difference between the free expansion curves of reactive and non-reactive specimens (ASR-only data). Other material parameters were defined according to reference values, such as the porosity (from which it is possible to evaluate Biot’s coefficient ) and Biot’s modulus M= 5000 MPa. A comparison between experiments and the model result is shown in Figure 3, in terms of mean strain evolution. It should be noted that, in these tests, the temperature conditions changed while the degree of saturation was constant and equal to 1; therefore, according to Equation (13), the latency and characteristic times changed. The following values were identified at 23 C: = 478 days and = 274 days while, at 50 C, we have = 34 days and = 60 days. The identified asymptotic volumetric strain is = .
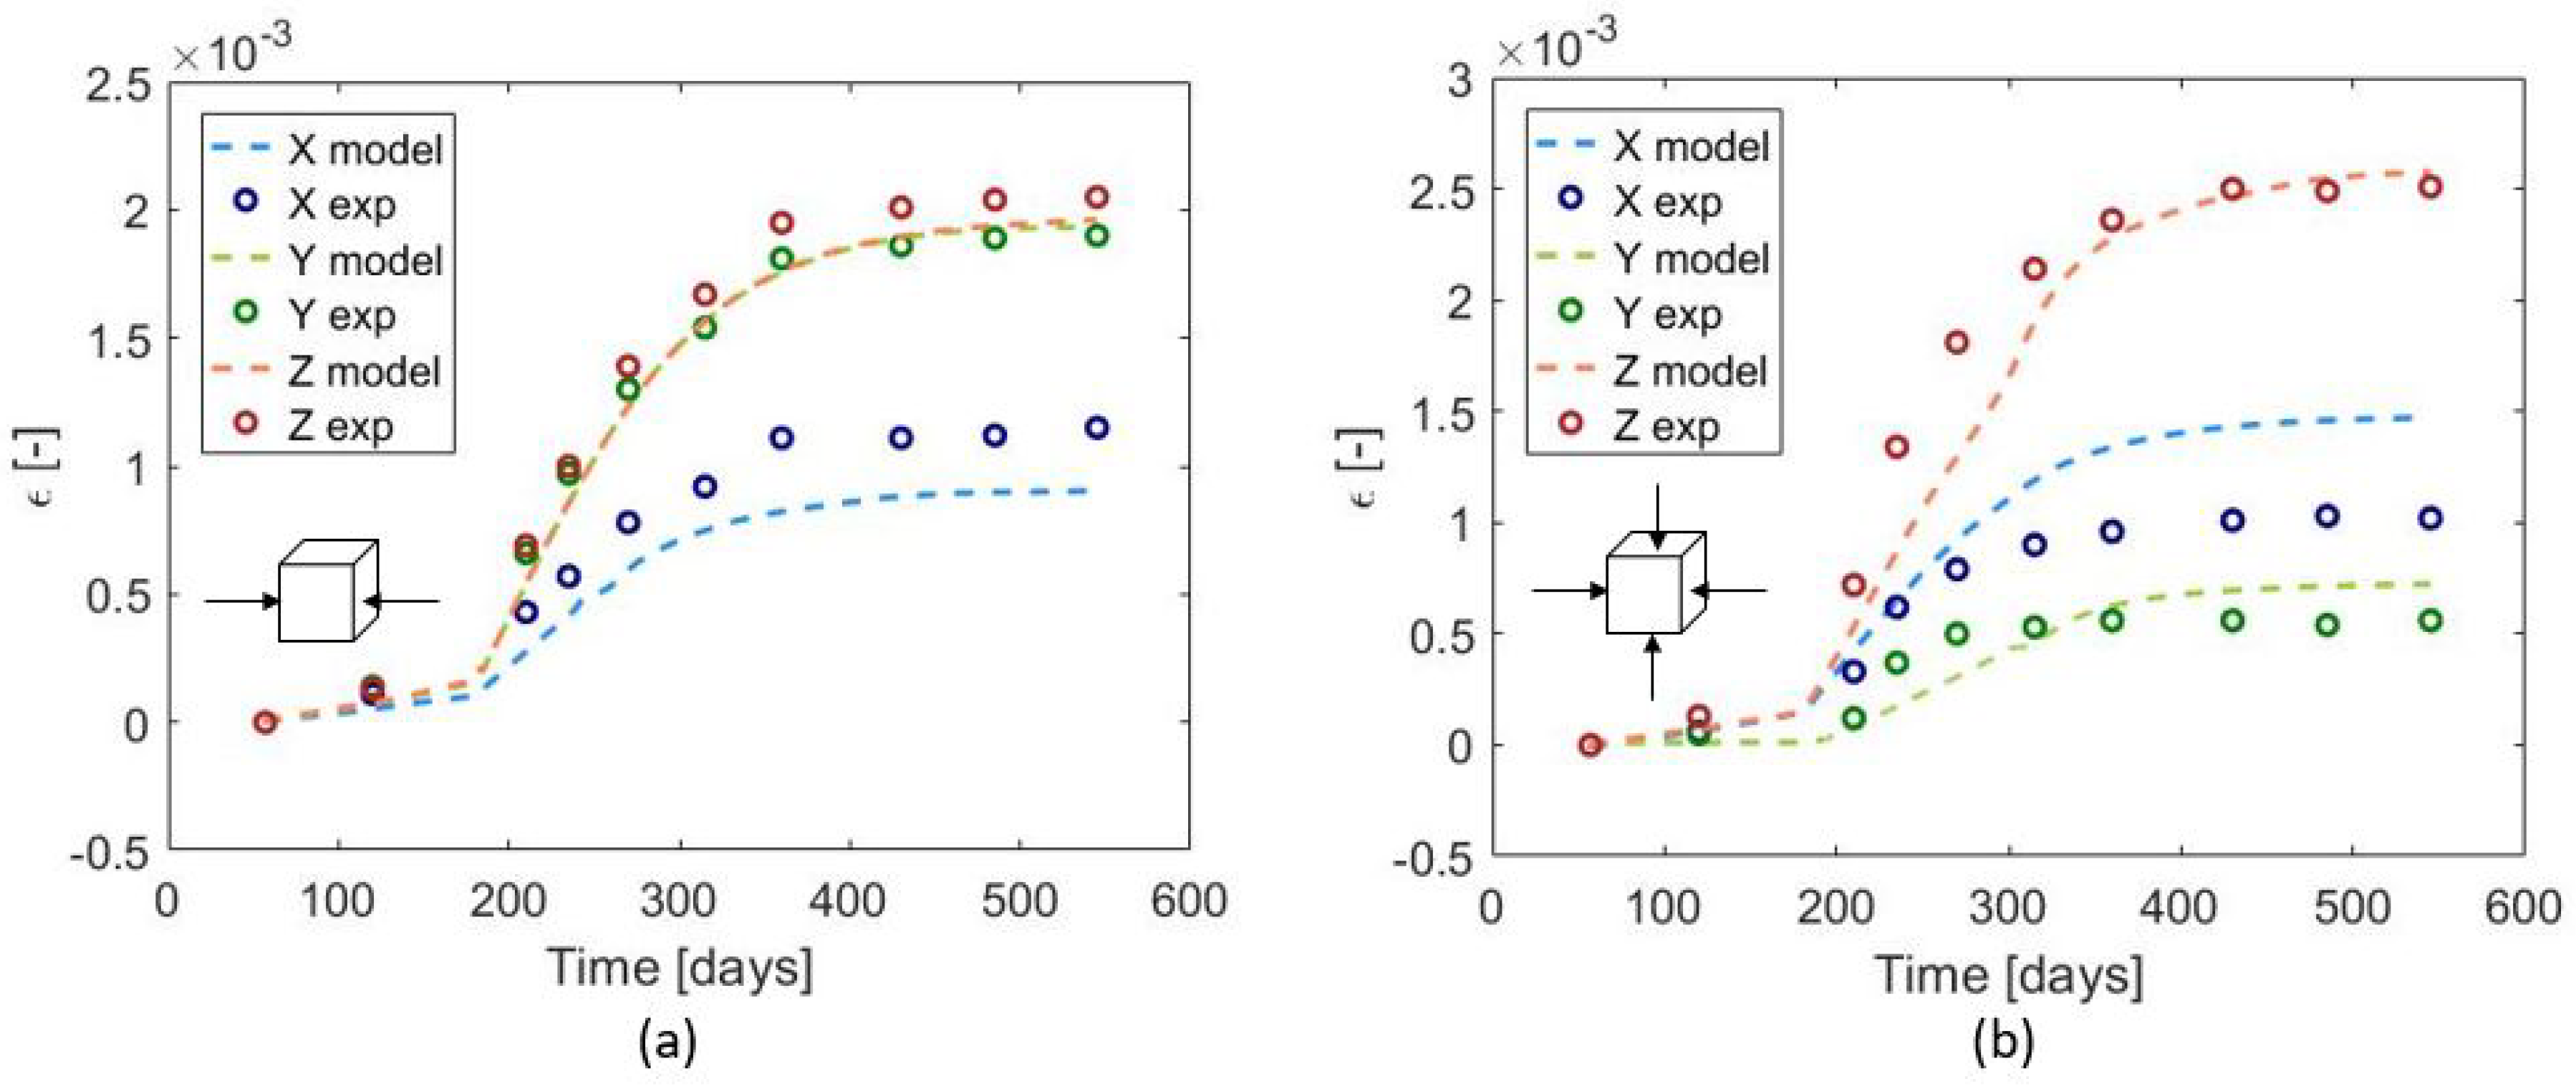
In order to simulate the loaded tests in a realistic way, a finite element (FE) mechanical analysis was carried out. In fact, the stress state within the specimens induced by the pre-stressed bolts was non-homogeneous. In Figure 2b, the finite element model used for the simulation of the experimental tests is shown (as the problem is symmetric, only one eighth of the cubic specimen was modelled), in which the plates were modelled and the load was applied in the circular regions representing the bolts. With the above parameters calibrated with the free exansion test, we simulated the tests with uniaxial compression and biaxial compression. In Figure 4, comparisons between the experimental data and numerical results are represented in terms of strain evolutions in the three directions. Even though the material model was isotropic, the load-induced anisotropy of the expansion curves was well predicted.
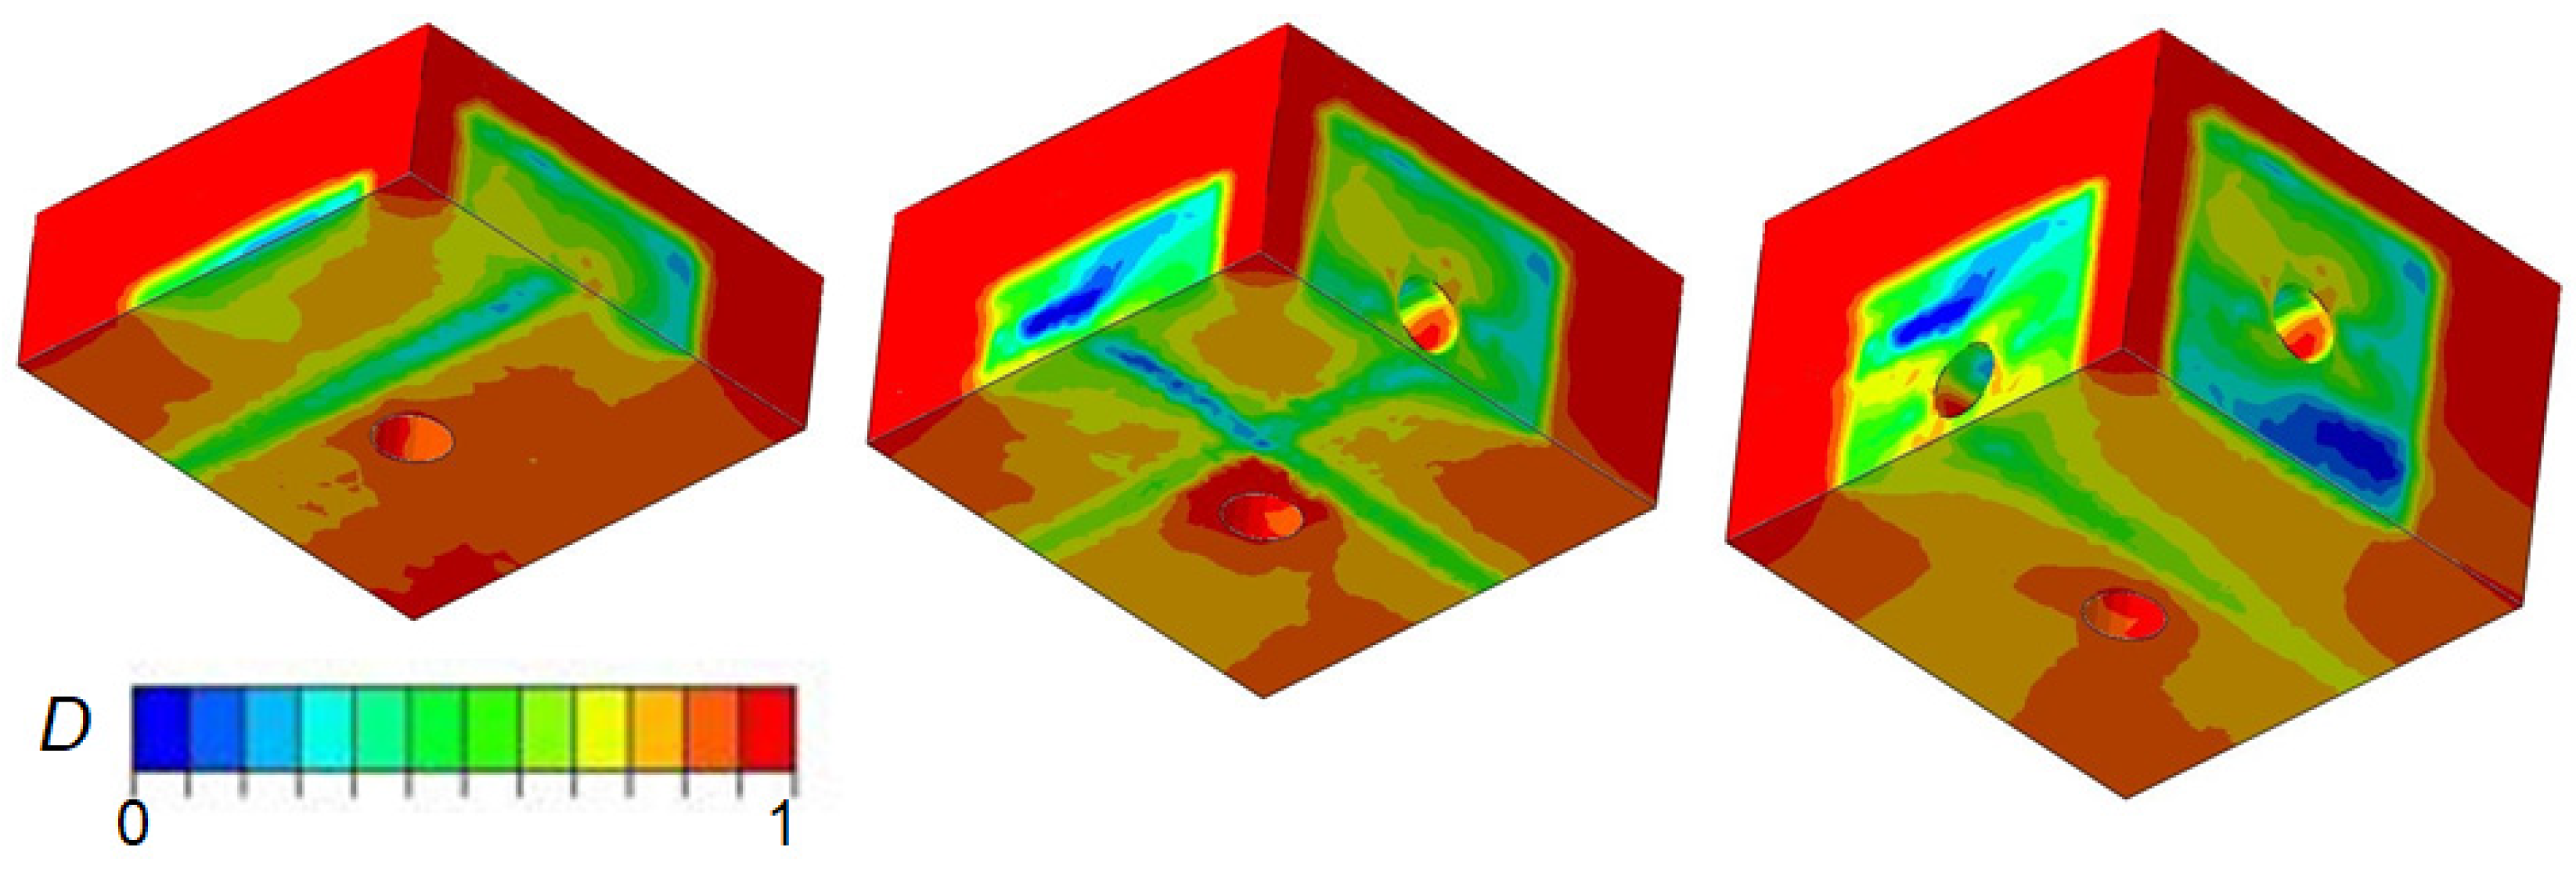
The difference between the expansion in the X and Y directions in the bi-axial loaded case (Figure 4b) was due to the different locations of the loading plates on the two faces of the cube, which induced a stress state far from being equi-biaxial at each point. The numerical simulation was able to predict this complex stress state and the consequent non-uniform damage pattern (see Figure 5).
4. Results and Discussion. Structural Analysis of a Concrete Dam Affected by Alkali–Silica Reaction
4.1. Numerical Approach
The model presented above allows us to perform numerical simulations, using the finite element method, of the mechanical consequences of ASR on real concrete structures.
The approach we followed is weakly coupled. First, the histories of degree of saturation and temperature are computed by solving the moisture diffusion problem (Equation (4)) and the heat diffusion problem (Equation (6)) with corresponding boundary conditions, possibly varying in time. Then, the reaction extent evolution can be evaluated, through Equation (10). As this evolution depends on temperature and humidity, the development of the reaction is non-uniform inside the structure; in particular, the reaction is faster in warmer parts of the dam and expansion is higher in parts where the degree of saturation is higher.
The reaction extent, together with the external loads and temperature variations, is the input of the elasto-damage analysis, which allows us to compute the evolution of displacements and the damage patterns leading to the formation of cracks.
4.2. Case Study: Gravity Dam in Canada
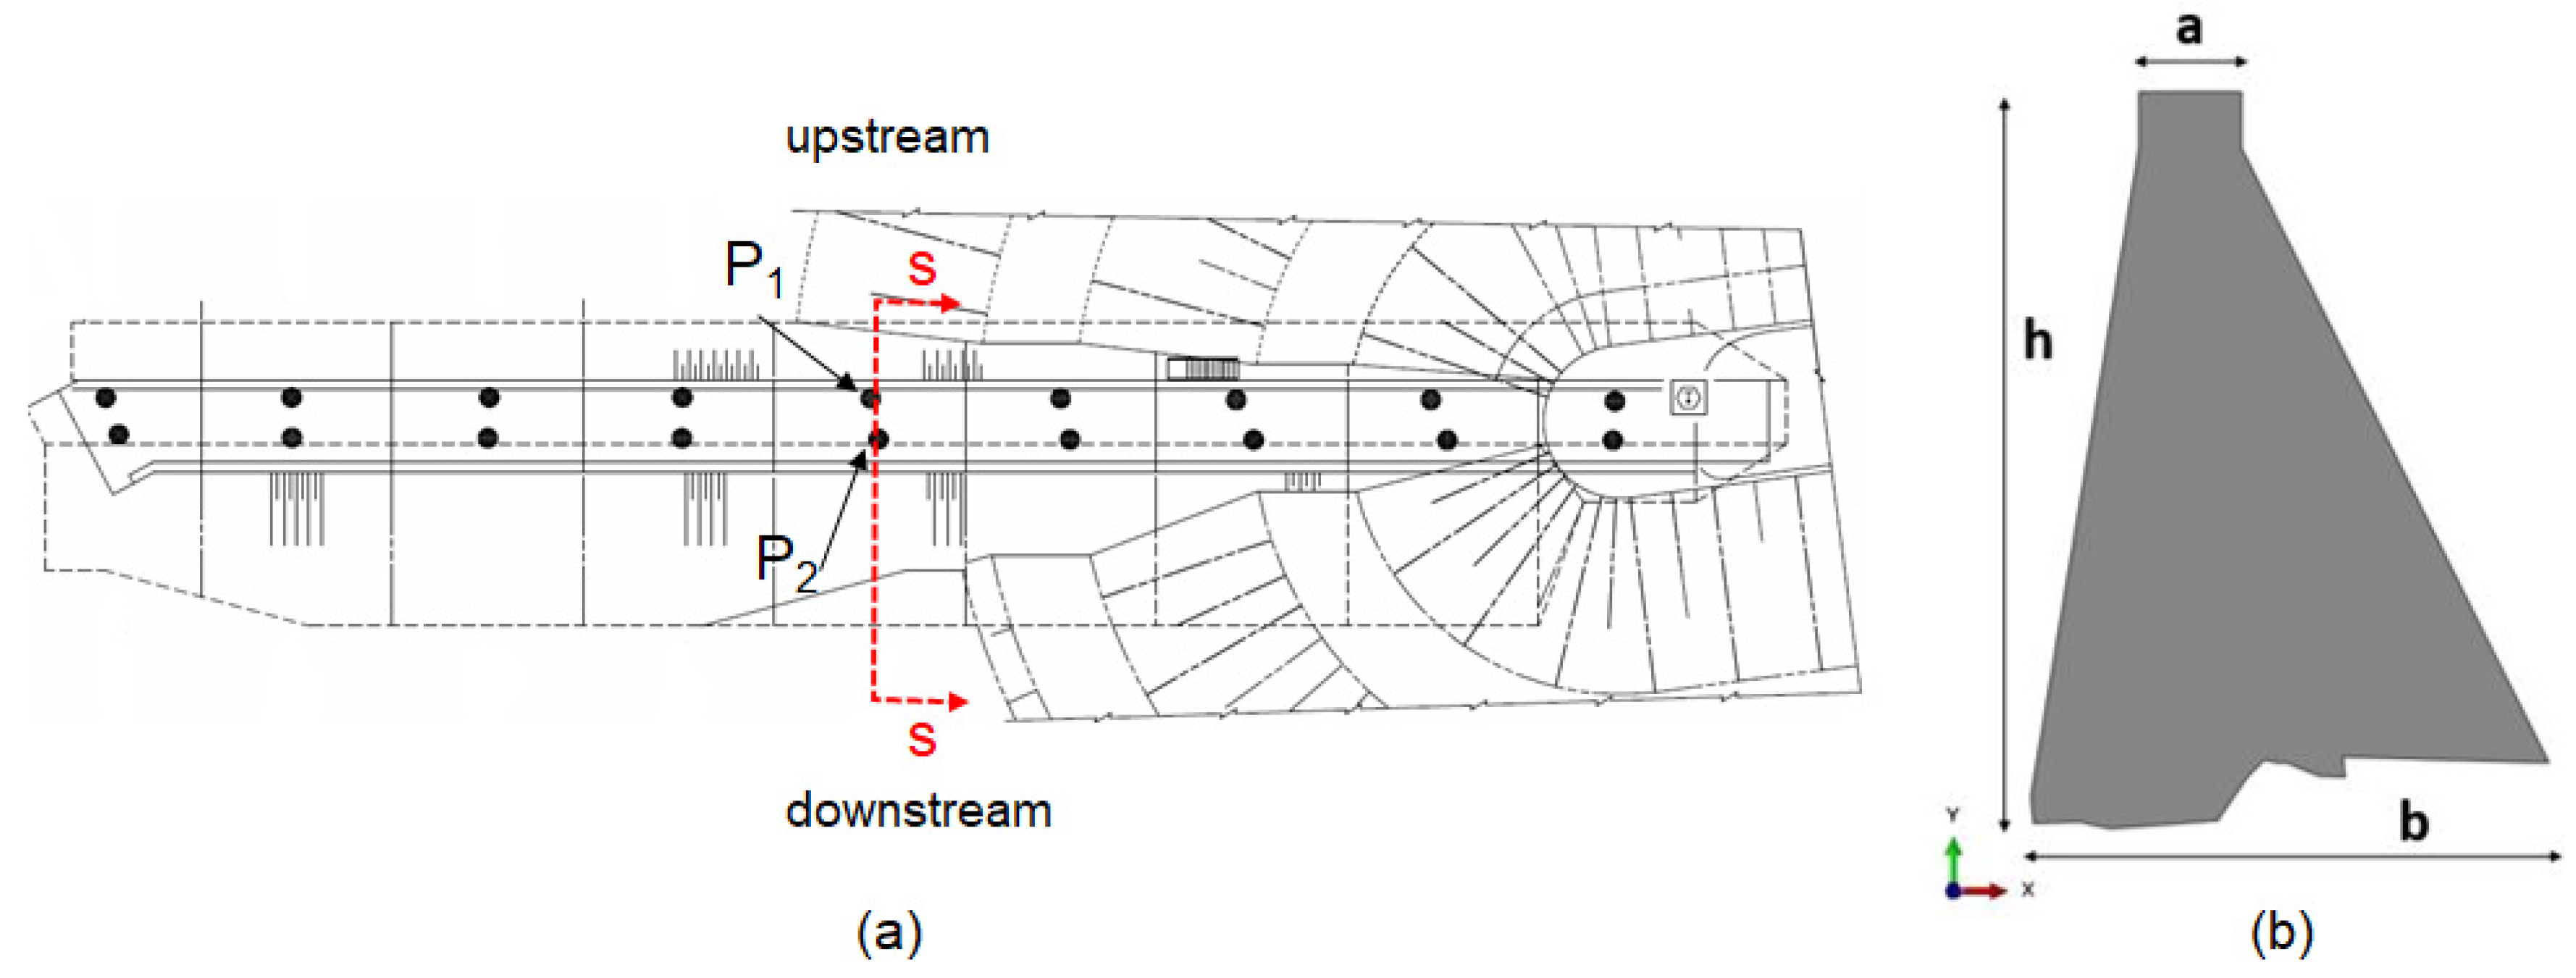
Reference is made to the left wing of the gravity dam of the Beauharnois power plant (Québec, Canada), shown in Figure 6, courtesy of Hydro-Québec. The construction of the whole plant begun in 1932 and the gravity dam, considered here, was built between 1956 and 1960. It is 21 m high (h) and it is characterized by a base width of b = 15 m and a crest dimension of a = 3 m (Figure 6b). The mechanical properties of the concrete and foundation provided by Hydro-Québec are collected in Table 1. The fracture energy in tension typical of concrete characterized by a large aggregate size was also given: G = 350 N/m.
Figure 6a shows the locations of the various instruments for monitoring. The monitoring system for the dam-foundation is represented by topographic measurements along dam crest through the reference targets shown by black dots in Figure 6a. Displacements in the three directions (X, Y, and Z) are measured at all reference targets. Due to ASR, an increase in the mean annual crest displacements has been observed since 1990.
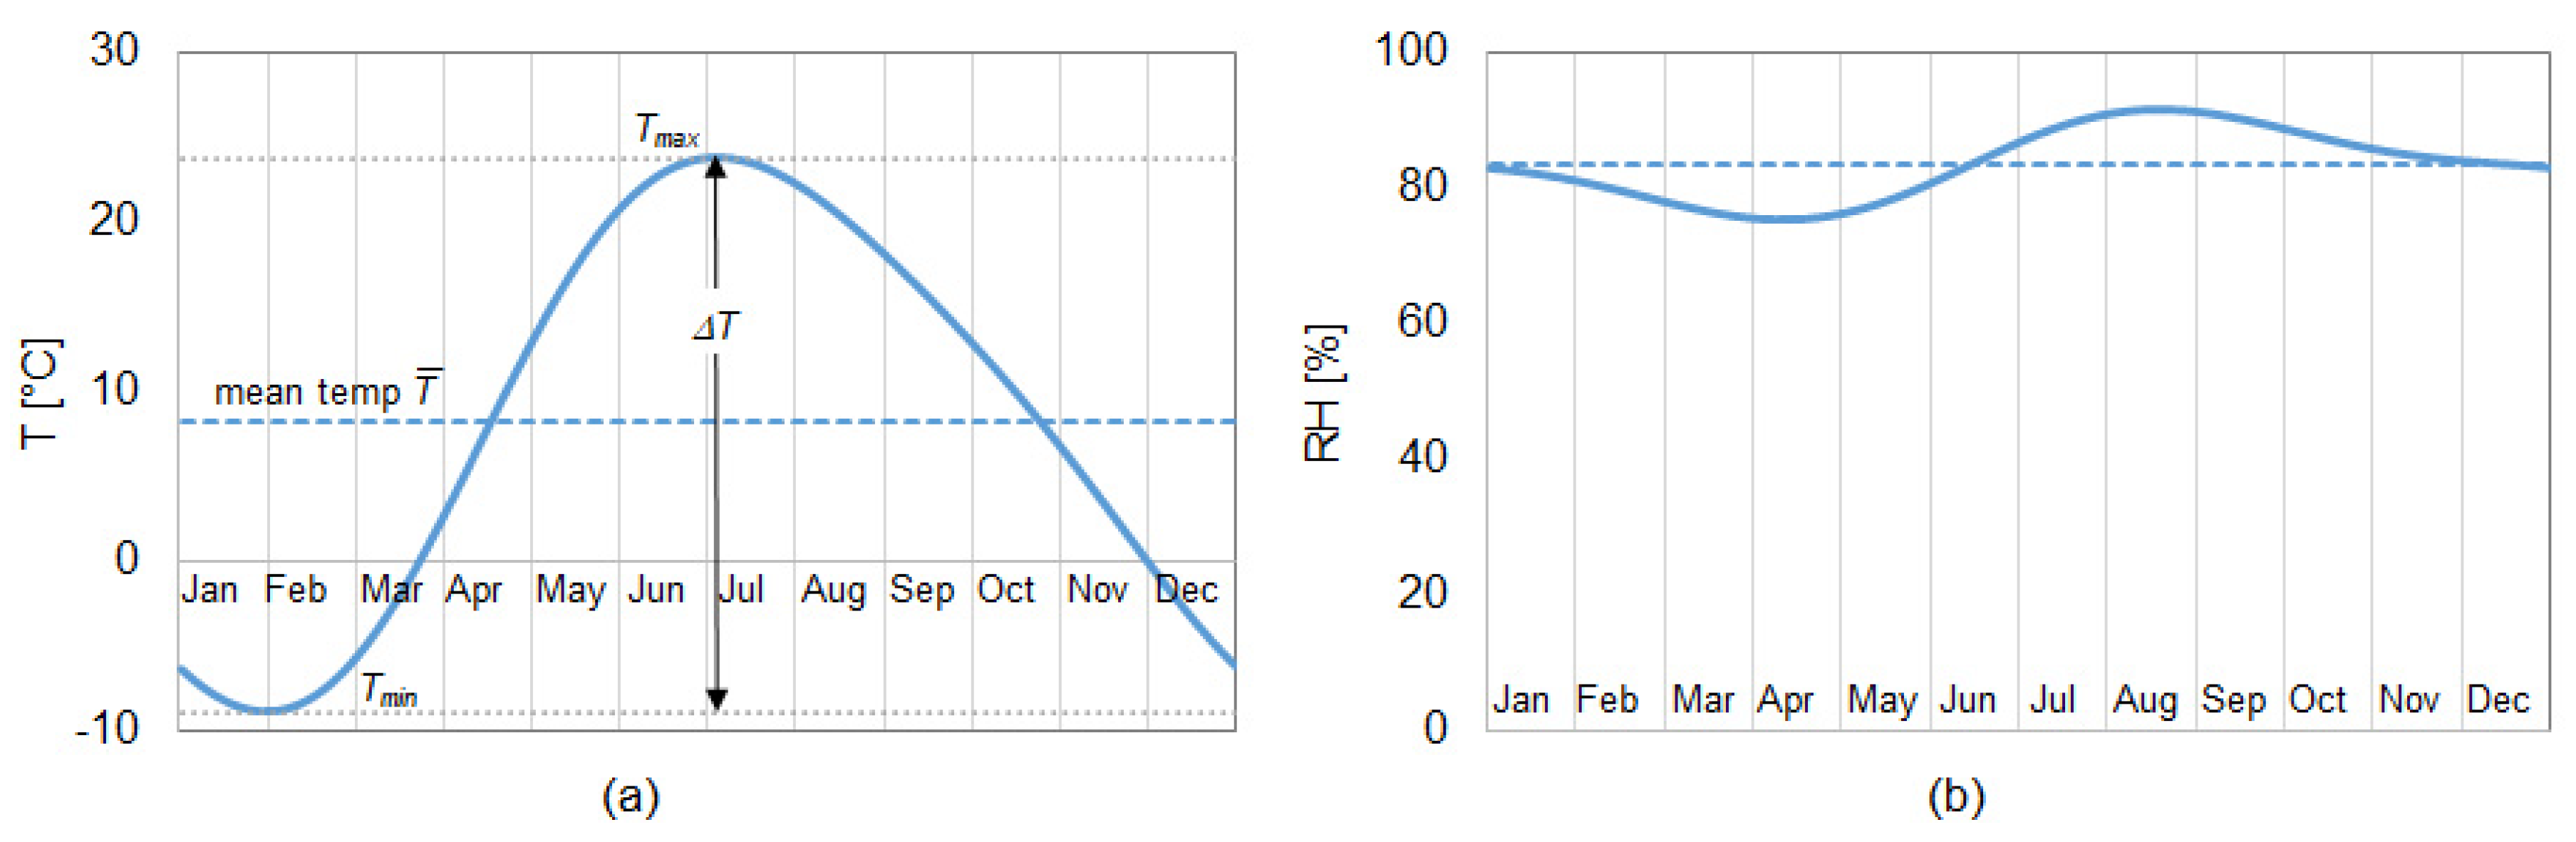
Furthermore, a set of thermometers determined the temperature of the concrete in contact with air. These values, recorded over six decades, have been interpolated by a periodic function with a period of one year. Figure 7a shows the annual profile thus obtained: , where and is the time function with period of one year.
The reservoir-level oscillations were very limited (with a maximum oscillation of 0.2 m, from a maximum value of 46.1 m to a minimum of 45.9 m). For this reason, a mean value of 46 m was considered in all analyses.
The degree of saturation inside the dam was, however, non-constant due to the variation of relative humidity of the air. The annual variation of relative humidity of the air is given in Figure 7b.
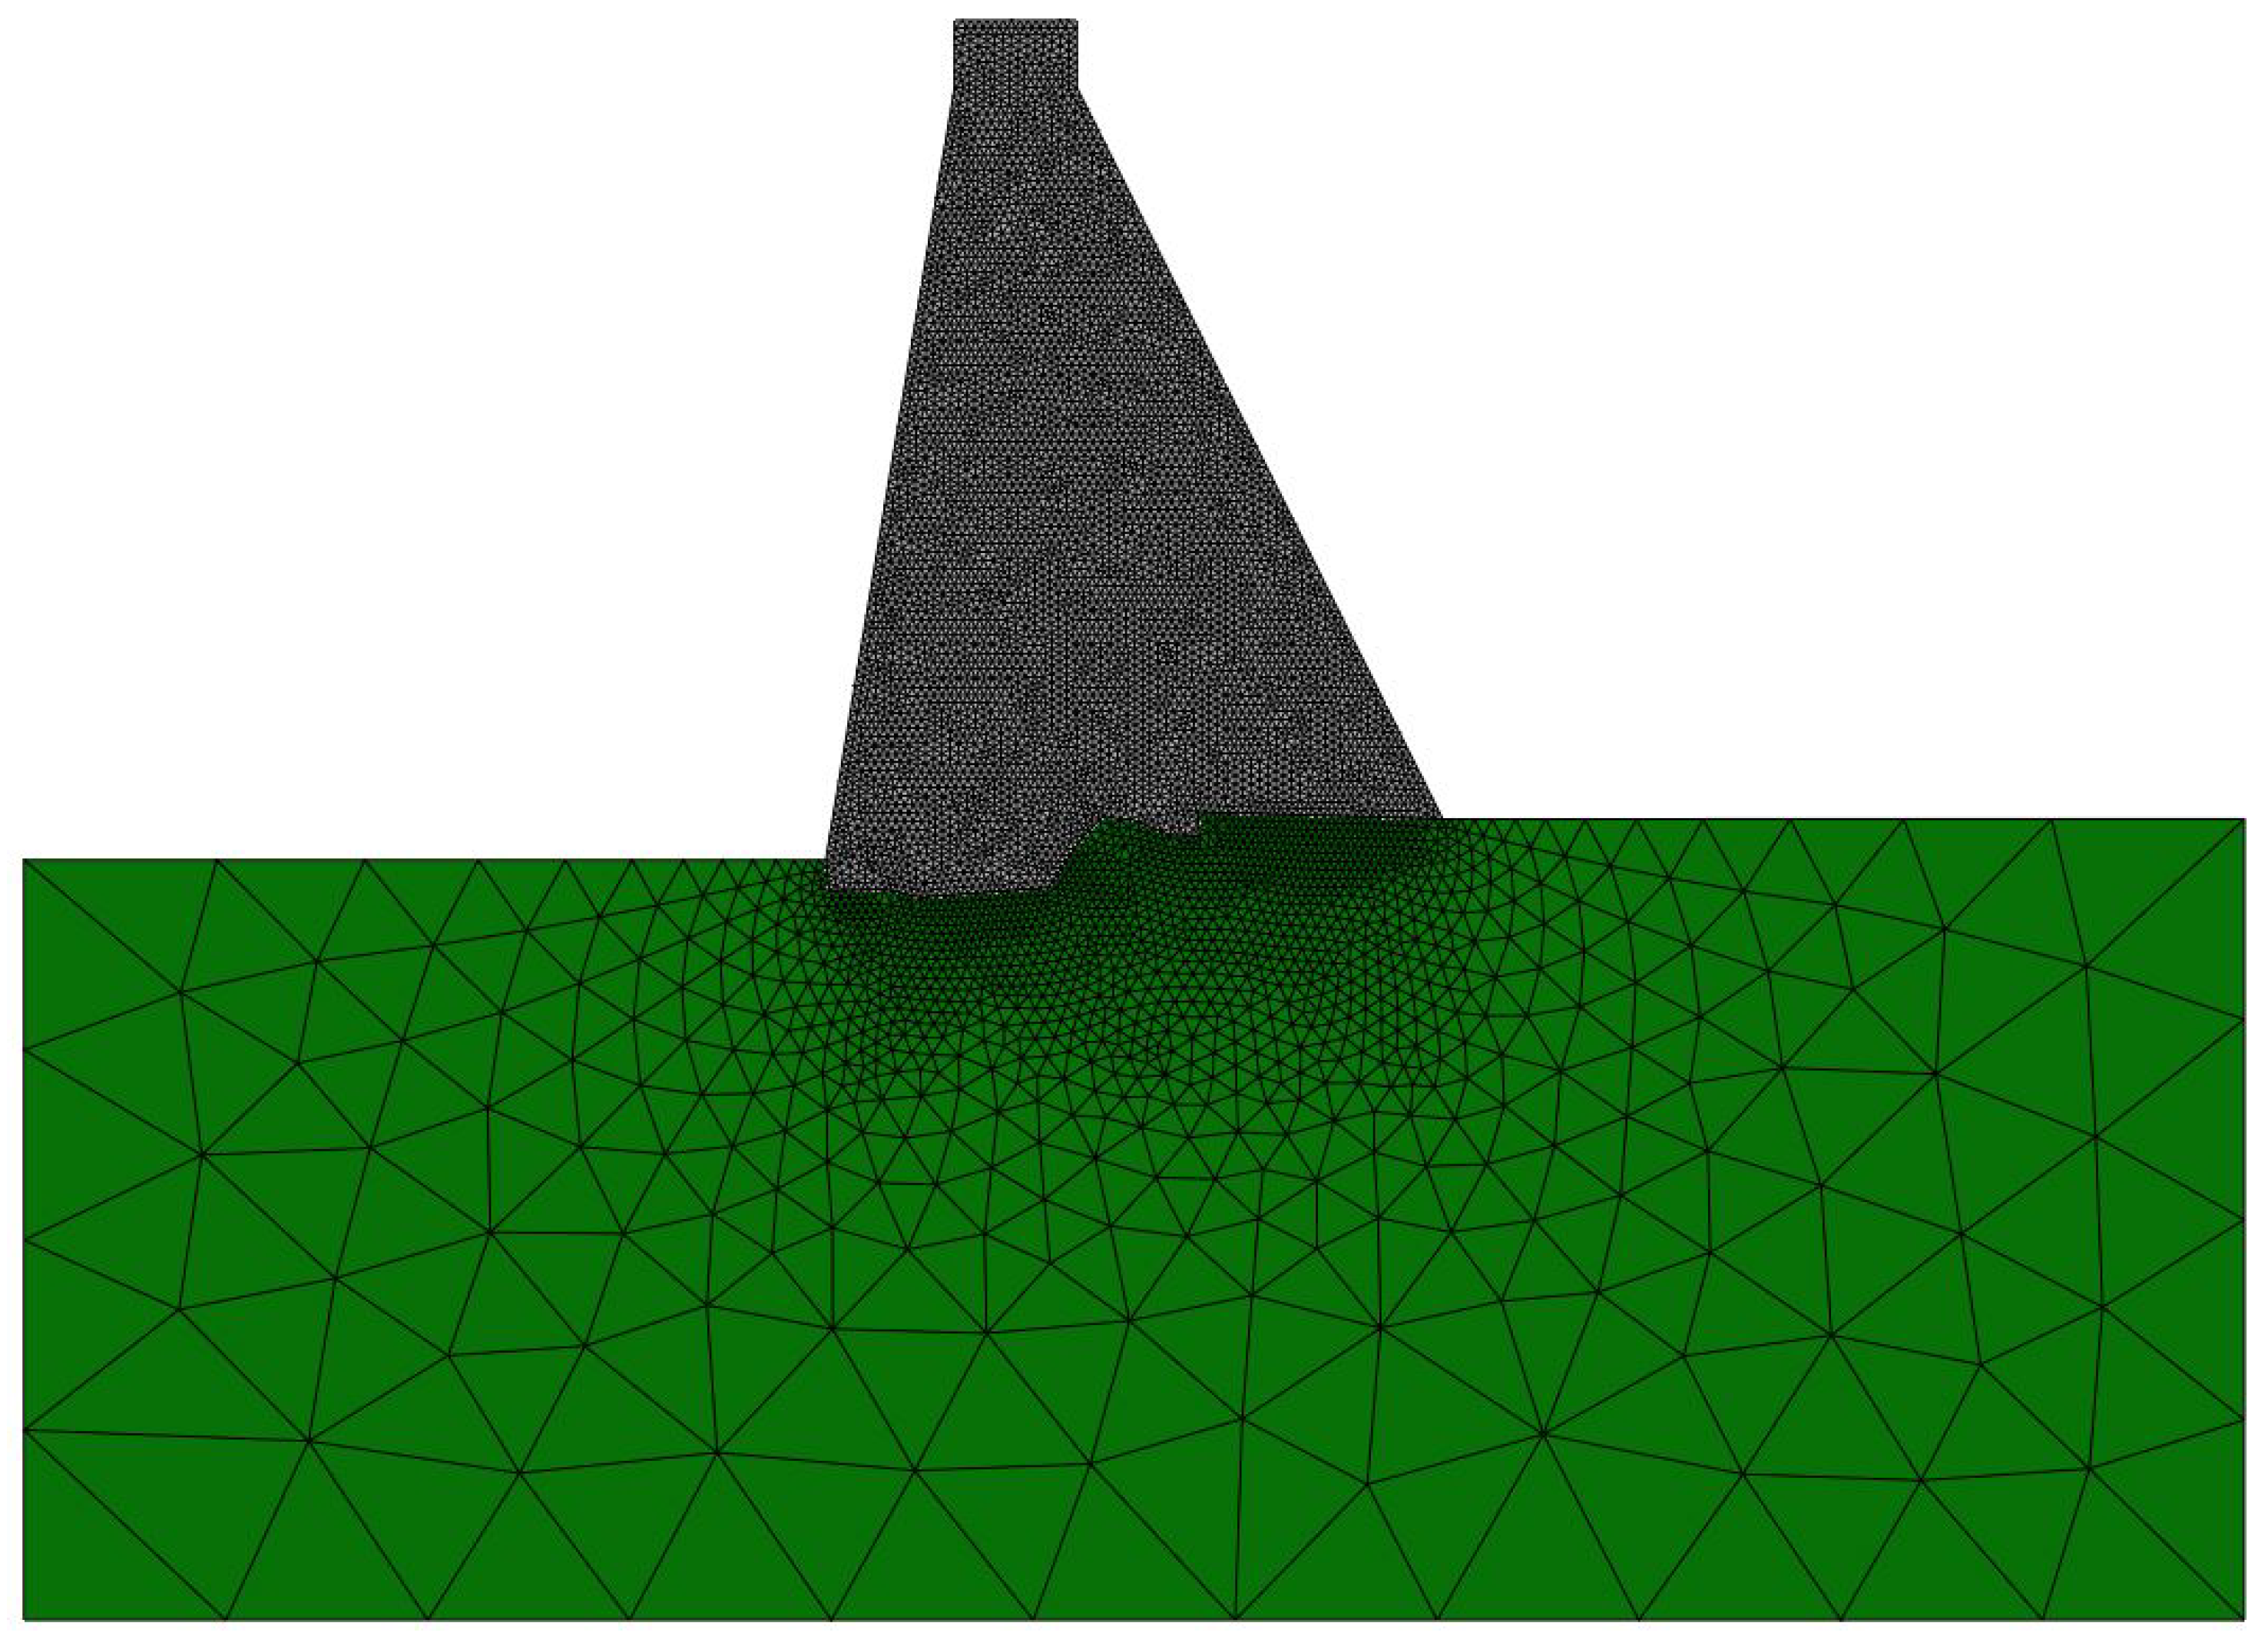
In view of the geometry, plane strain conditions were assumed and a 2D mesh with triangular (3 nodes) elements was employed, as depicted in Figure 8 (for the dam foundation system). Firstly, the temperature and humidity effects were evaluated using the diffusion analyses described previously. Then, the mechanical analysis of the studied dam was carried out, in order to compare the structural response obtained by the model with the real monitoring data.
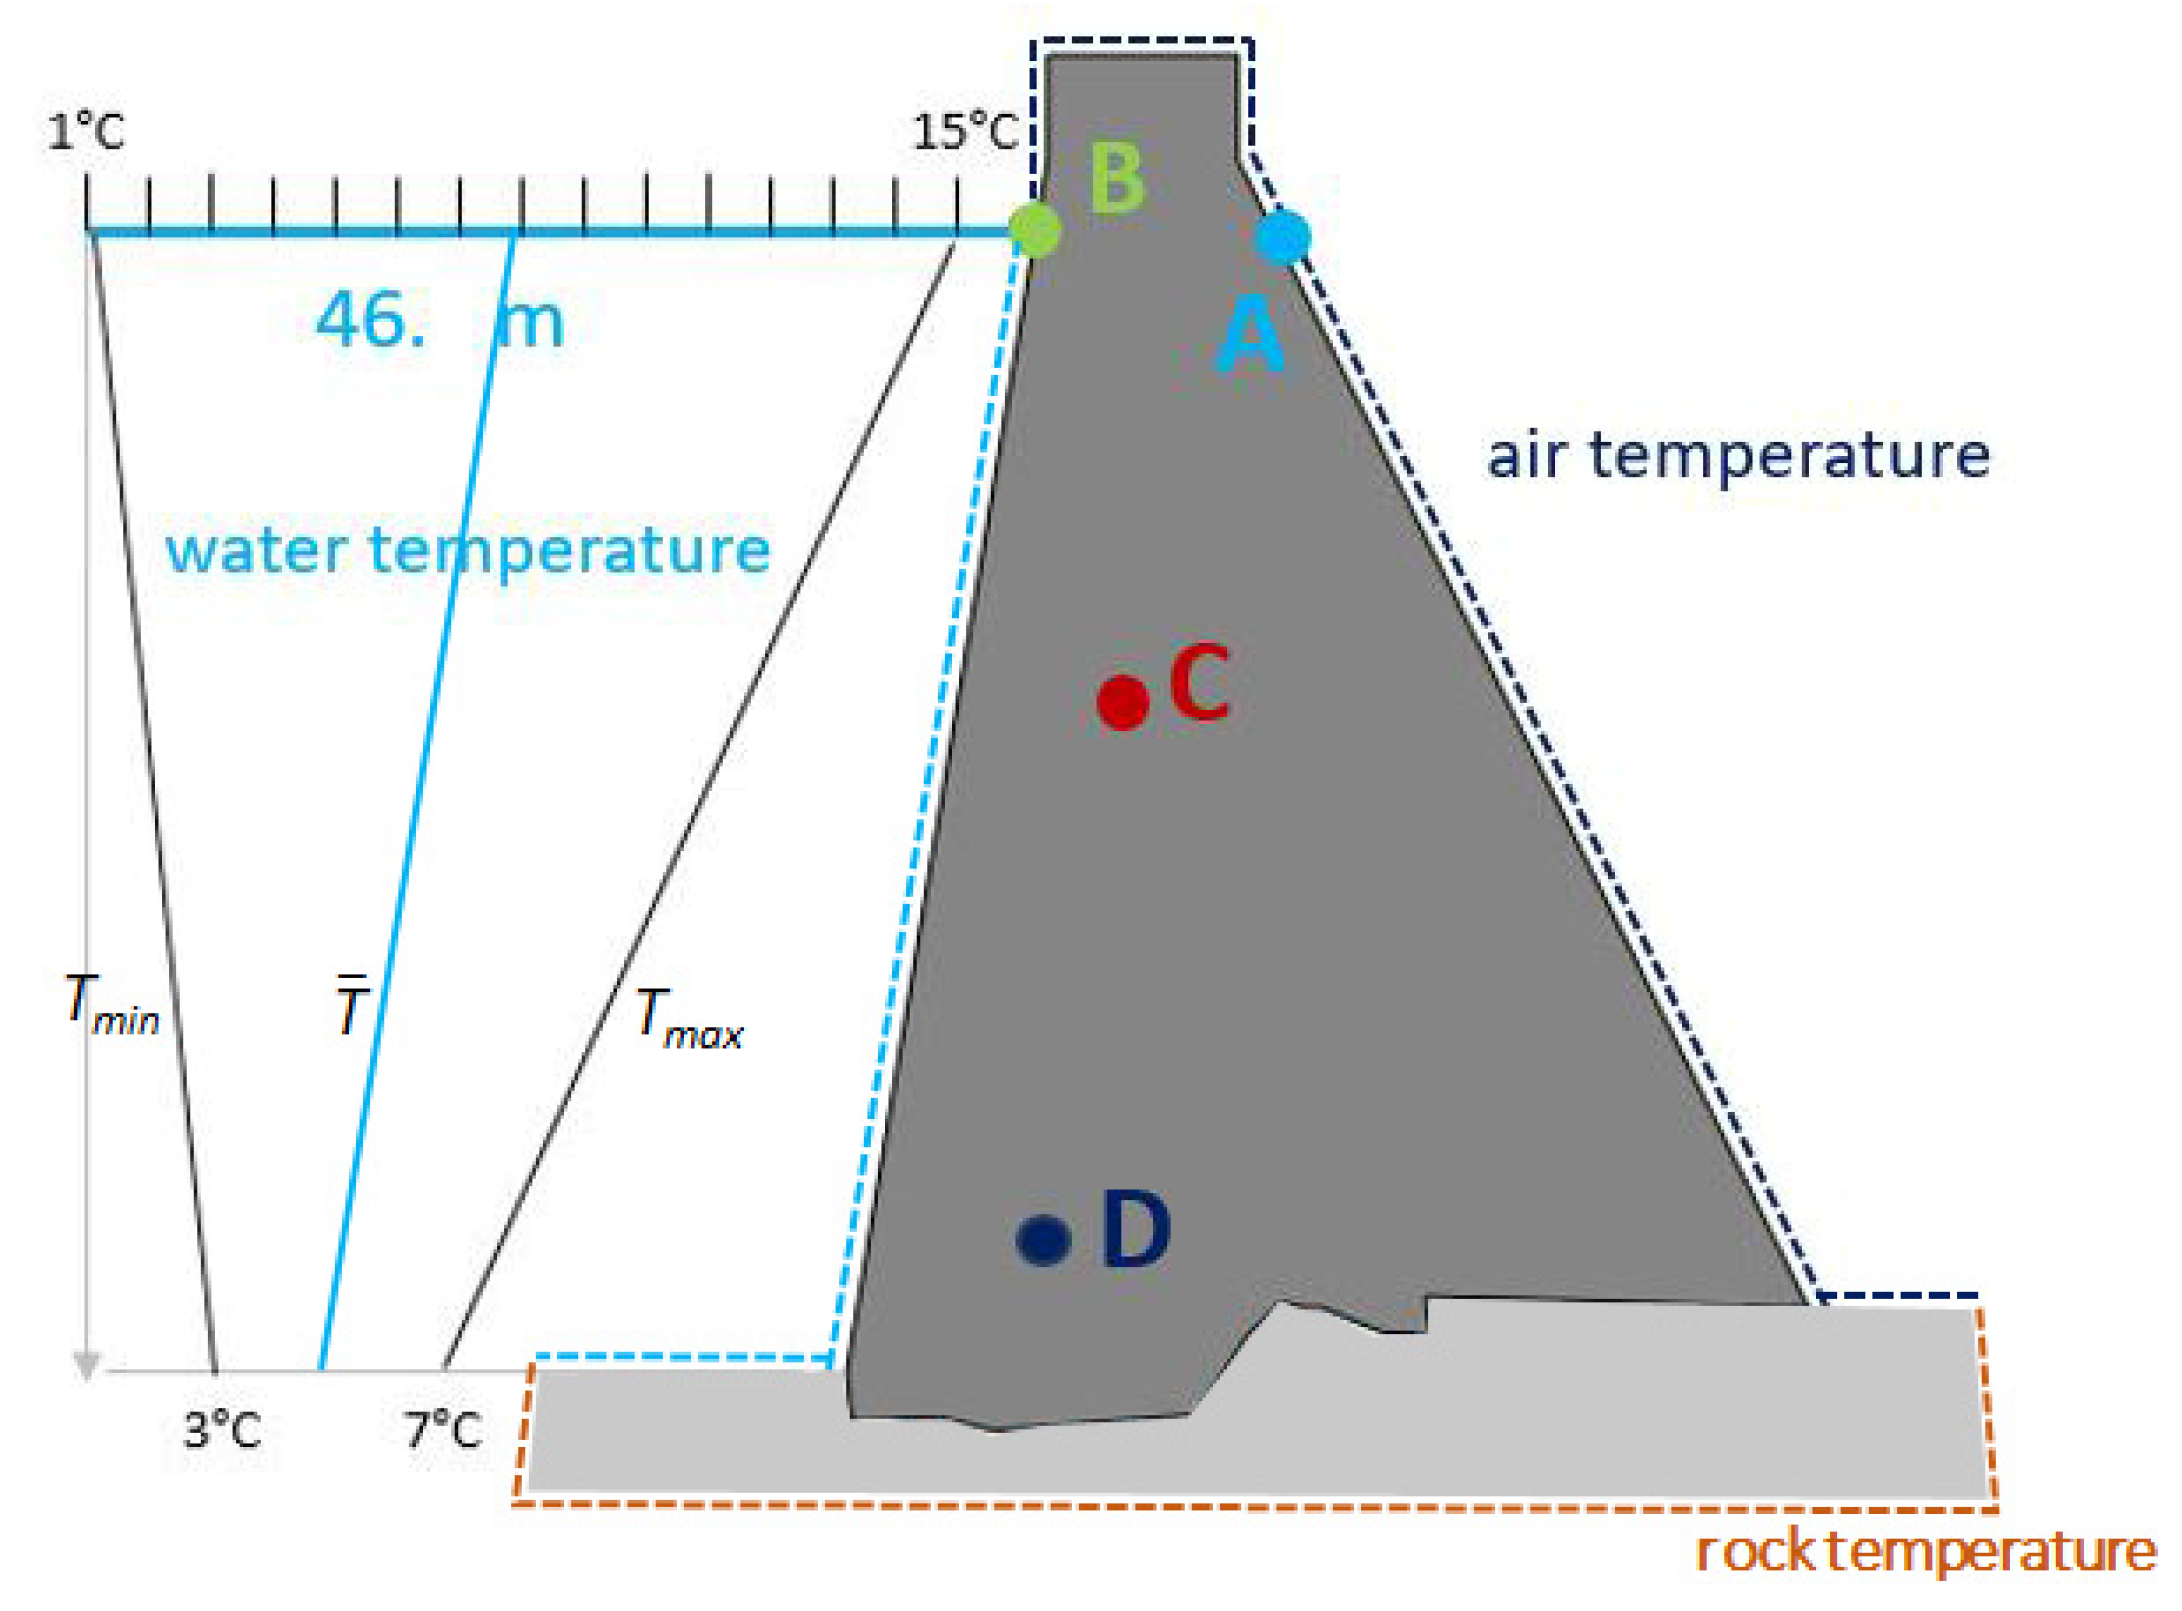
To determine the history of the temperature field within the dam, a heat diffusion analysis (by solving Equation (6) with proper initial conditions and varying boundary conditions) should be performed. The boundary conditions (BC) were set as follows (see Figure 9). The temperature of the dam surface in contact with air (the downstream face and the upstream face above water) was assumed equal to the air temperature, whose annual variation is known (as previously discussed) and shown in Figure 7a. The upstream surface below the reservoir level, assumed constant and equal to 46 m, was subject to a temperature linearly varying with the depth (as proposed in [29]), with an annual oscillation similar to that of the air, , but with different maximum and minimum values (from 1 C to 15 C at the water surface and from 3 C to 7 C at the dam foot, as depicted in Figure 9). The rock temperature at the external boundary was assumed constant and equal to 4 C. The specific heat capacity and thermal conductivity of concrete, given by Hydro-Québeq, were C= 917 J/kgC and = W/mC, respectively. These values were all within the quite large range of variability of concrete thermal properties [30,31].
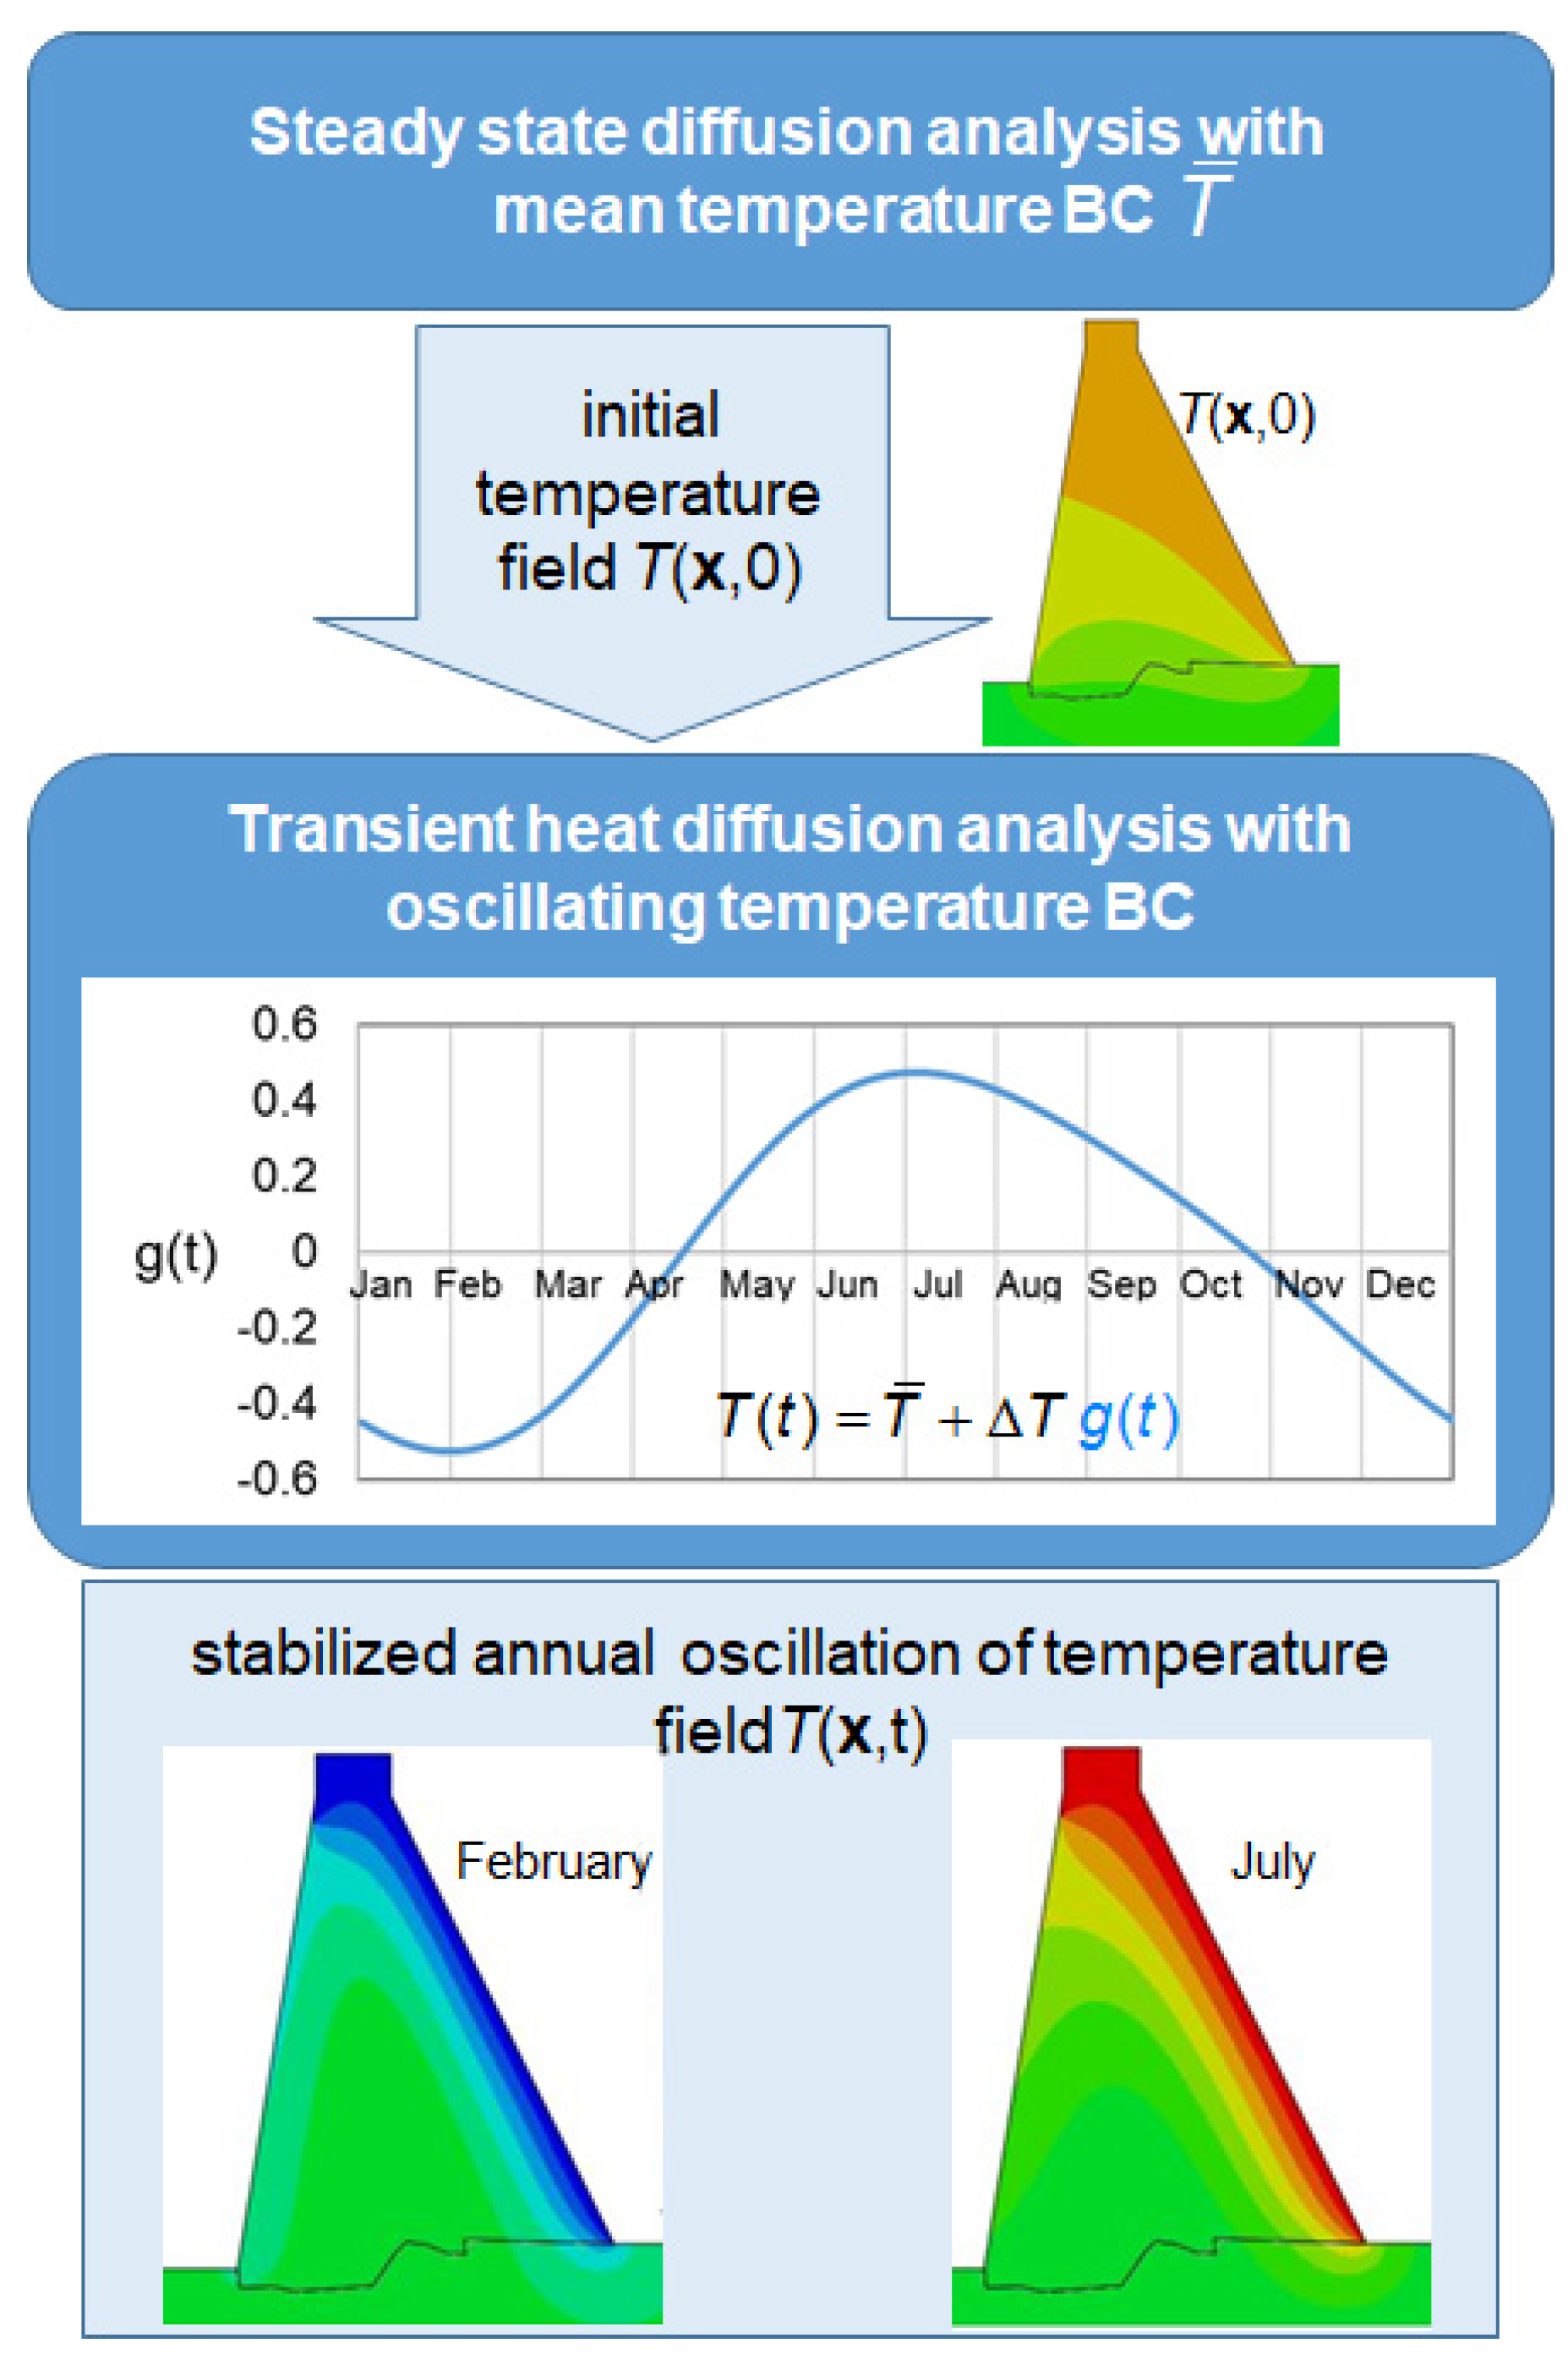
The procedure followed to determine the temperature at each point of the dam, at each time of the year, and then periodically repeating, , is schematically shown in Figure 10.
In the first step, fixing the temperature at different portions of the boundary of the dam as equal to the mean value over one year, , in air, water, and rock, a steady state analysis was used to evaluate the stabilized temperature in the internal nodes of the mesh , which was used as initial conditions for the following transient analysis.
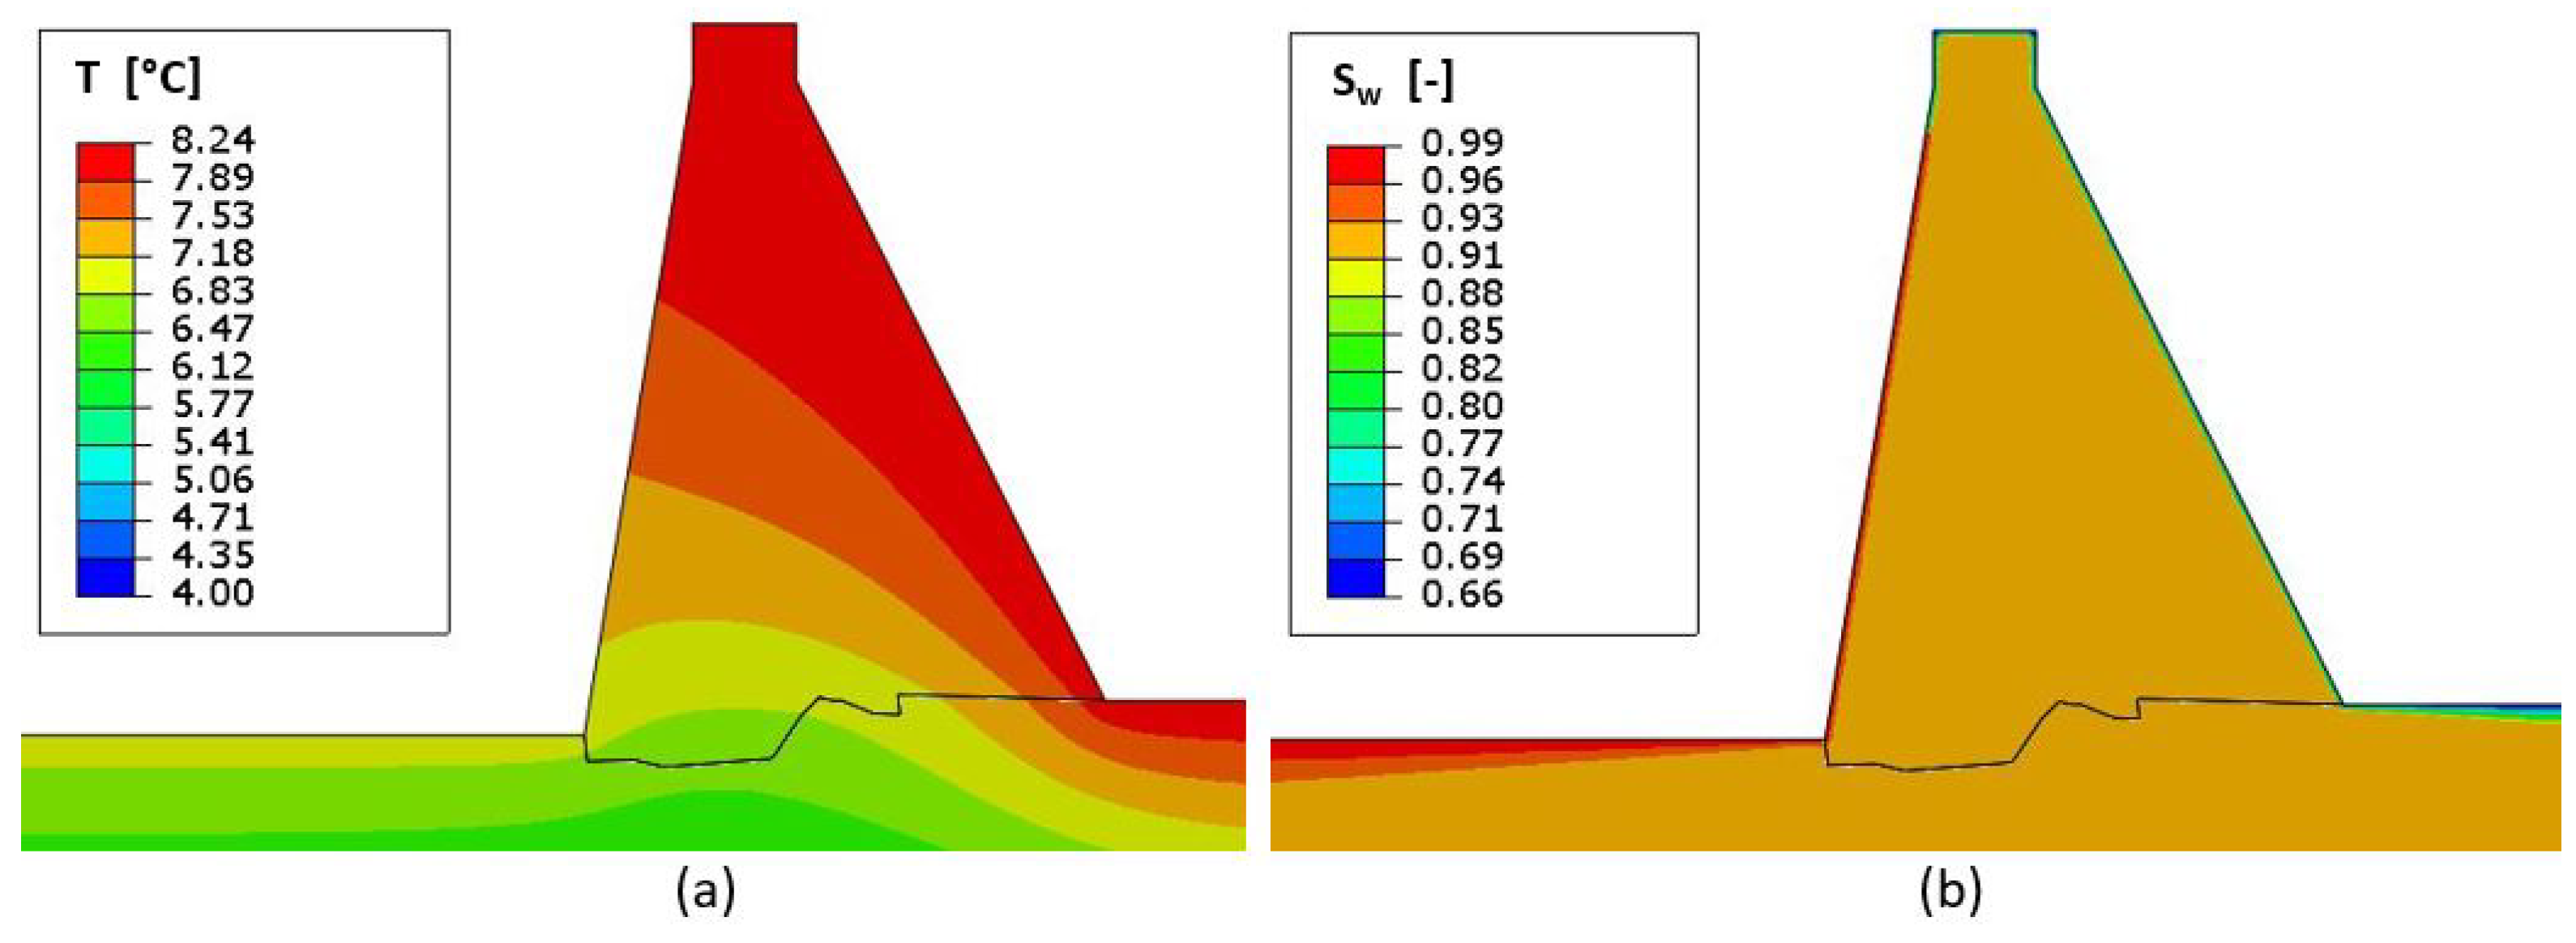
In Figure 11a, the contour plot of the stabilized initial temperature is shown.
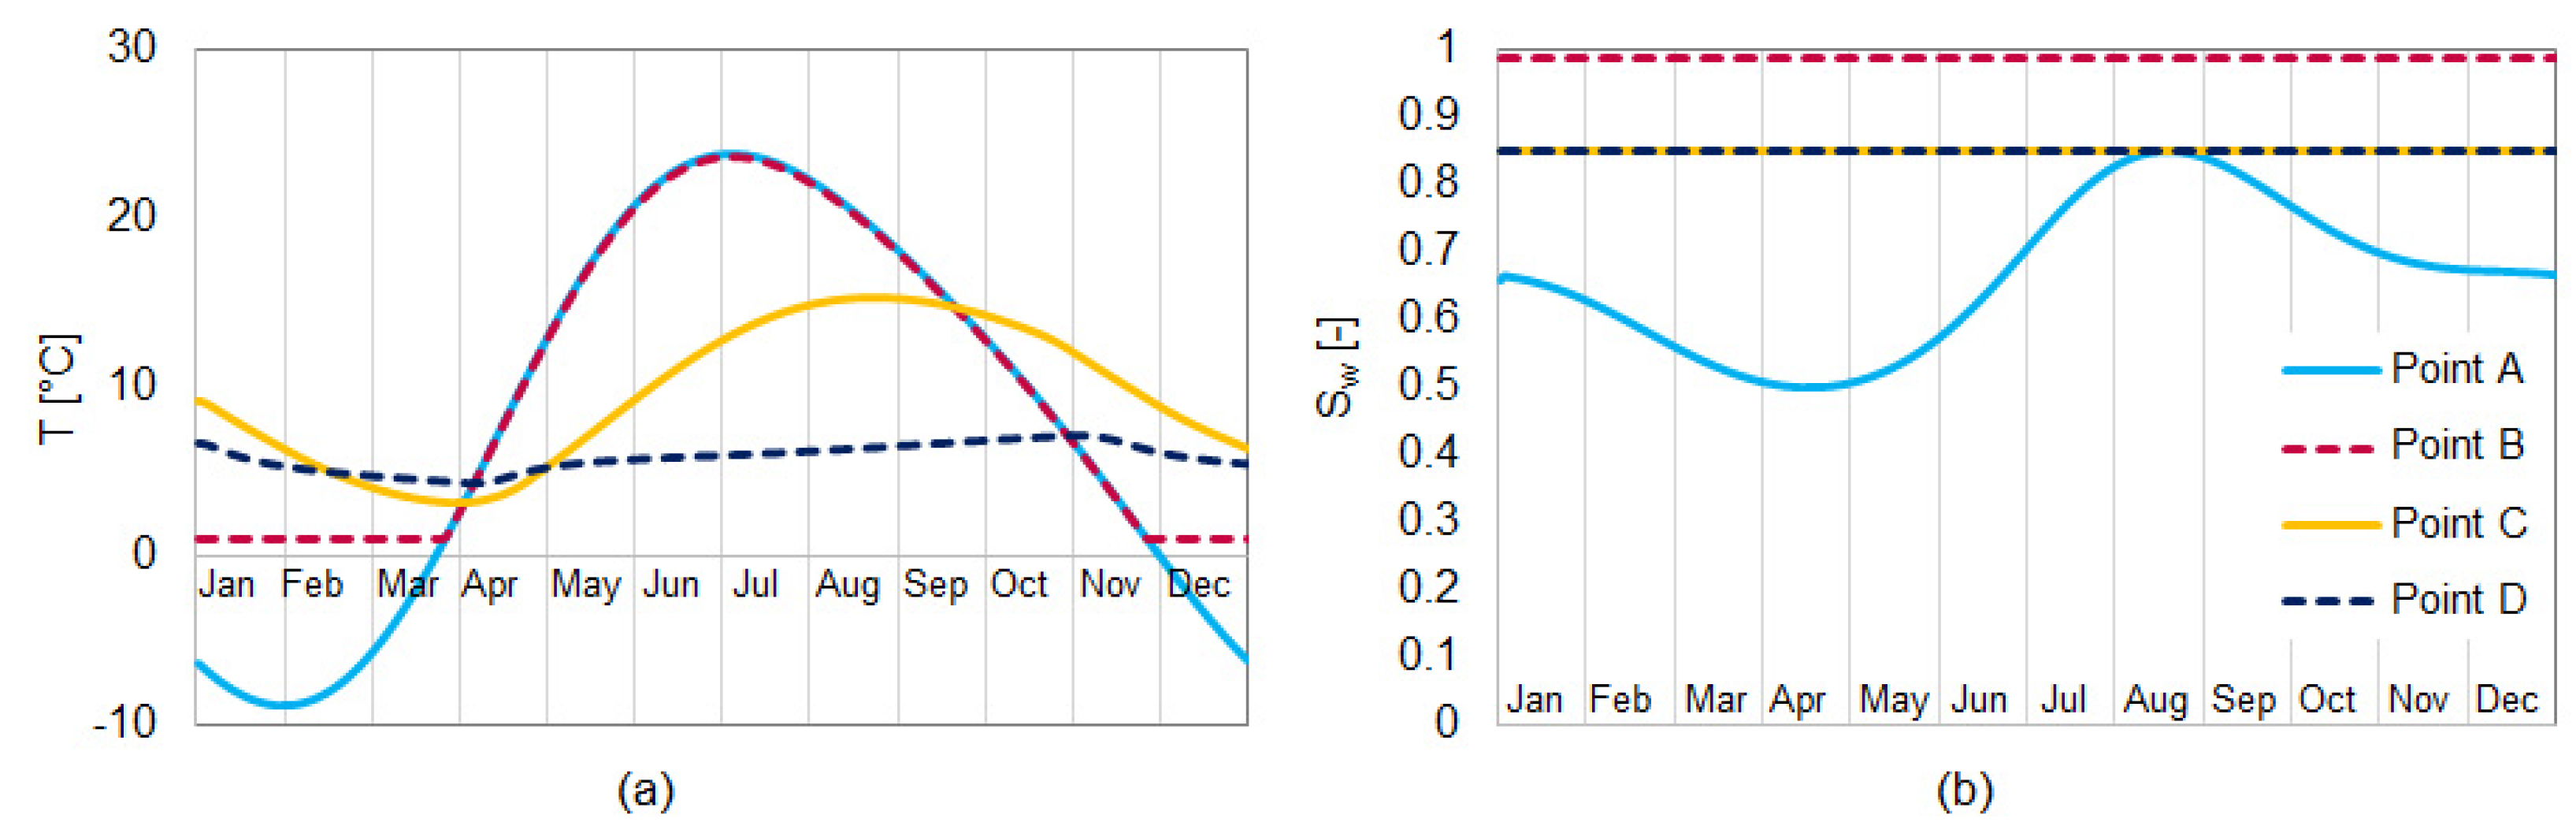
The second step consisted of a thermal transient analysis, in which the real periodic annual variation of air and water temperature was applied at the buondary . The analysis was performed until a stabilized periodic pattern was obtained throughout the whole body of the dam. This stabilized periodic temperature field was used as input for the following chemo-mechanical analysis. In Figure 12a, the yearly histories of temperature at different points of the dam (A = in contact with air, B = close to the reservoir level, and C and D = internal nodes; see Figure 9) obtained through this second transient analysis are depicted.
The evaluation of the yearly evolution of the degree of saturation field followed the same procedure. As in the case of thermal analyses, a preliminary moisture diffusion analysis was performed before the transient moisture diffusion analysis.
For the first analysis, we assumed an initial uniform field for the degree of saturation, =, and boundary conditions corresponding to a water level of 46 m, such that the submerged nodes were characterized by a complete saturation, while, for the nodes in contact with air, the mean of the sinusoidal annual variation (equal to 0.66 and corresponding to RH = 84%) was applied. The parameters , , and of the permeability were assumed, as in [22]; namely = MPa, = , and = . The obtained pattern of saturation degree is shown in Figure 11b. Then, the transient moisture diffusion analysis was performed, considering the annual oscillation of Figure 7b. Figure 12b reports the obtained stabilized yearly variations of the saturation degree at different nodes. It should be noted that the moisture diffusive process affects the external boundary of the structure only to a depth of about 20 cm (i.e., the depth of one element) and the degree of saturation is constant elsewhere, equal to the imposed initial value of 0.85. Therefore, the effect of humidity on the ASR evolution is expected to have a marginal role in the structural response.
The reaction extent evolution was then computed by integrating Equation (10). No specific tests of ASR expansion on concrete specimens of this dam were available. Therefore, we conducted several analyses by changing the latency, the characteristic times, and the asymptotic ASR expansion within the ranges previously established (e.g., in [18]) and, finally, we arrived at the values given in Table 2.
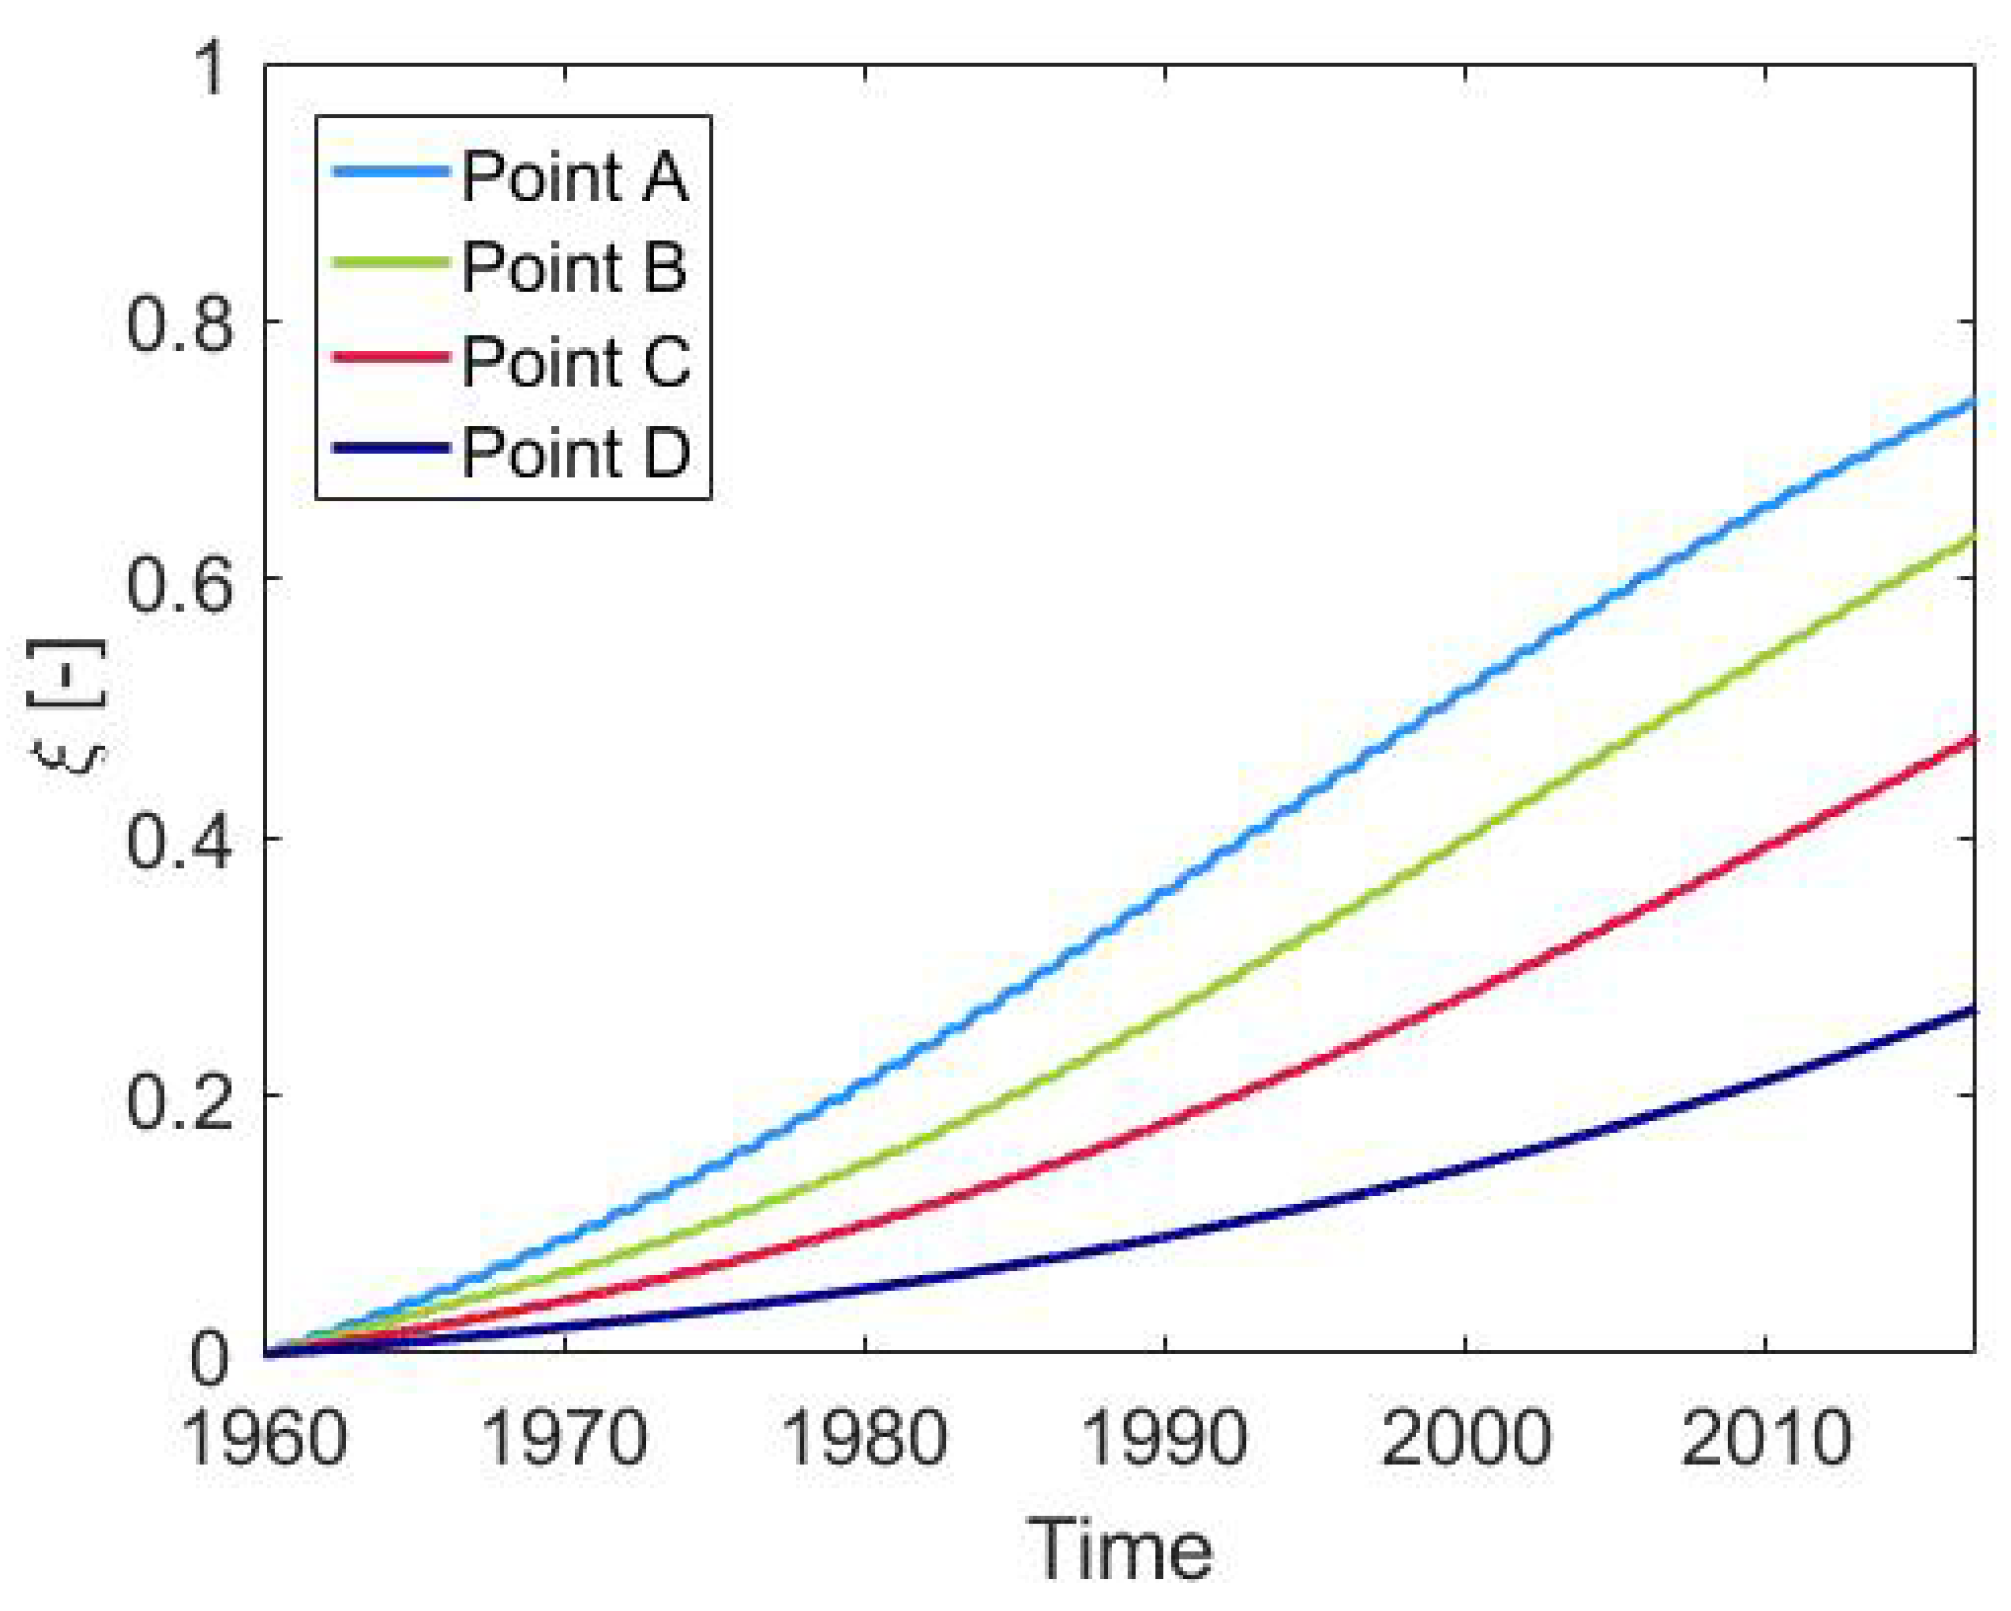
Figure 13 shows the evolution of the reaction extent for the points A, B, C, and D of Figure 9. The reaction extent developed more quickly at nodes A and B, located in the upper part of the dam, where the temperature was higher. The influence of the different degrees of saturation between points A and B was very limited. The temperature and the reaction extent fields were then the input into the chemo-thermo-mechanical analysis of the dam, aimed at evaluating the response due to ASR.
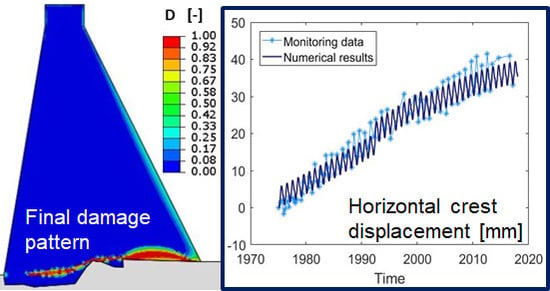
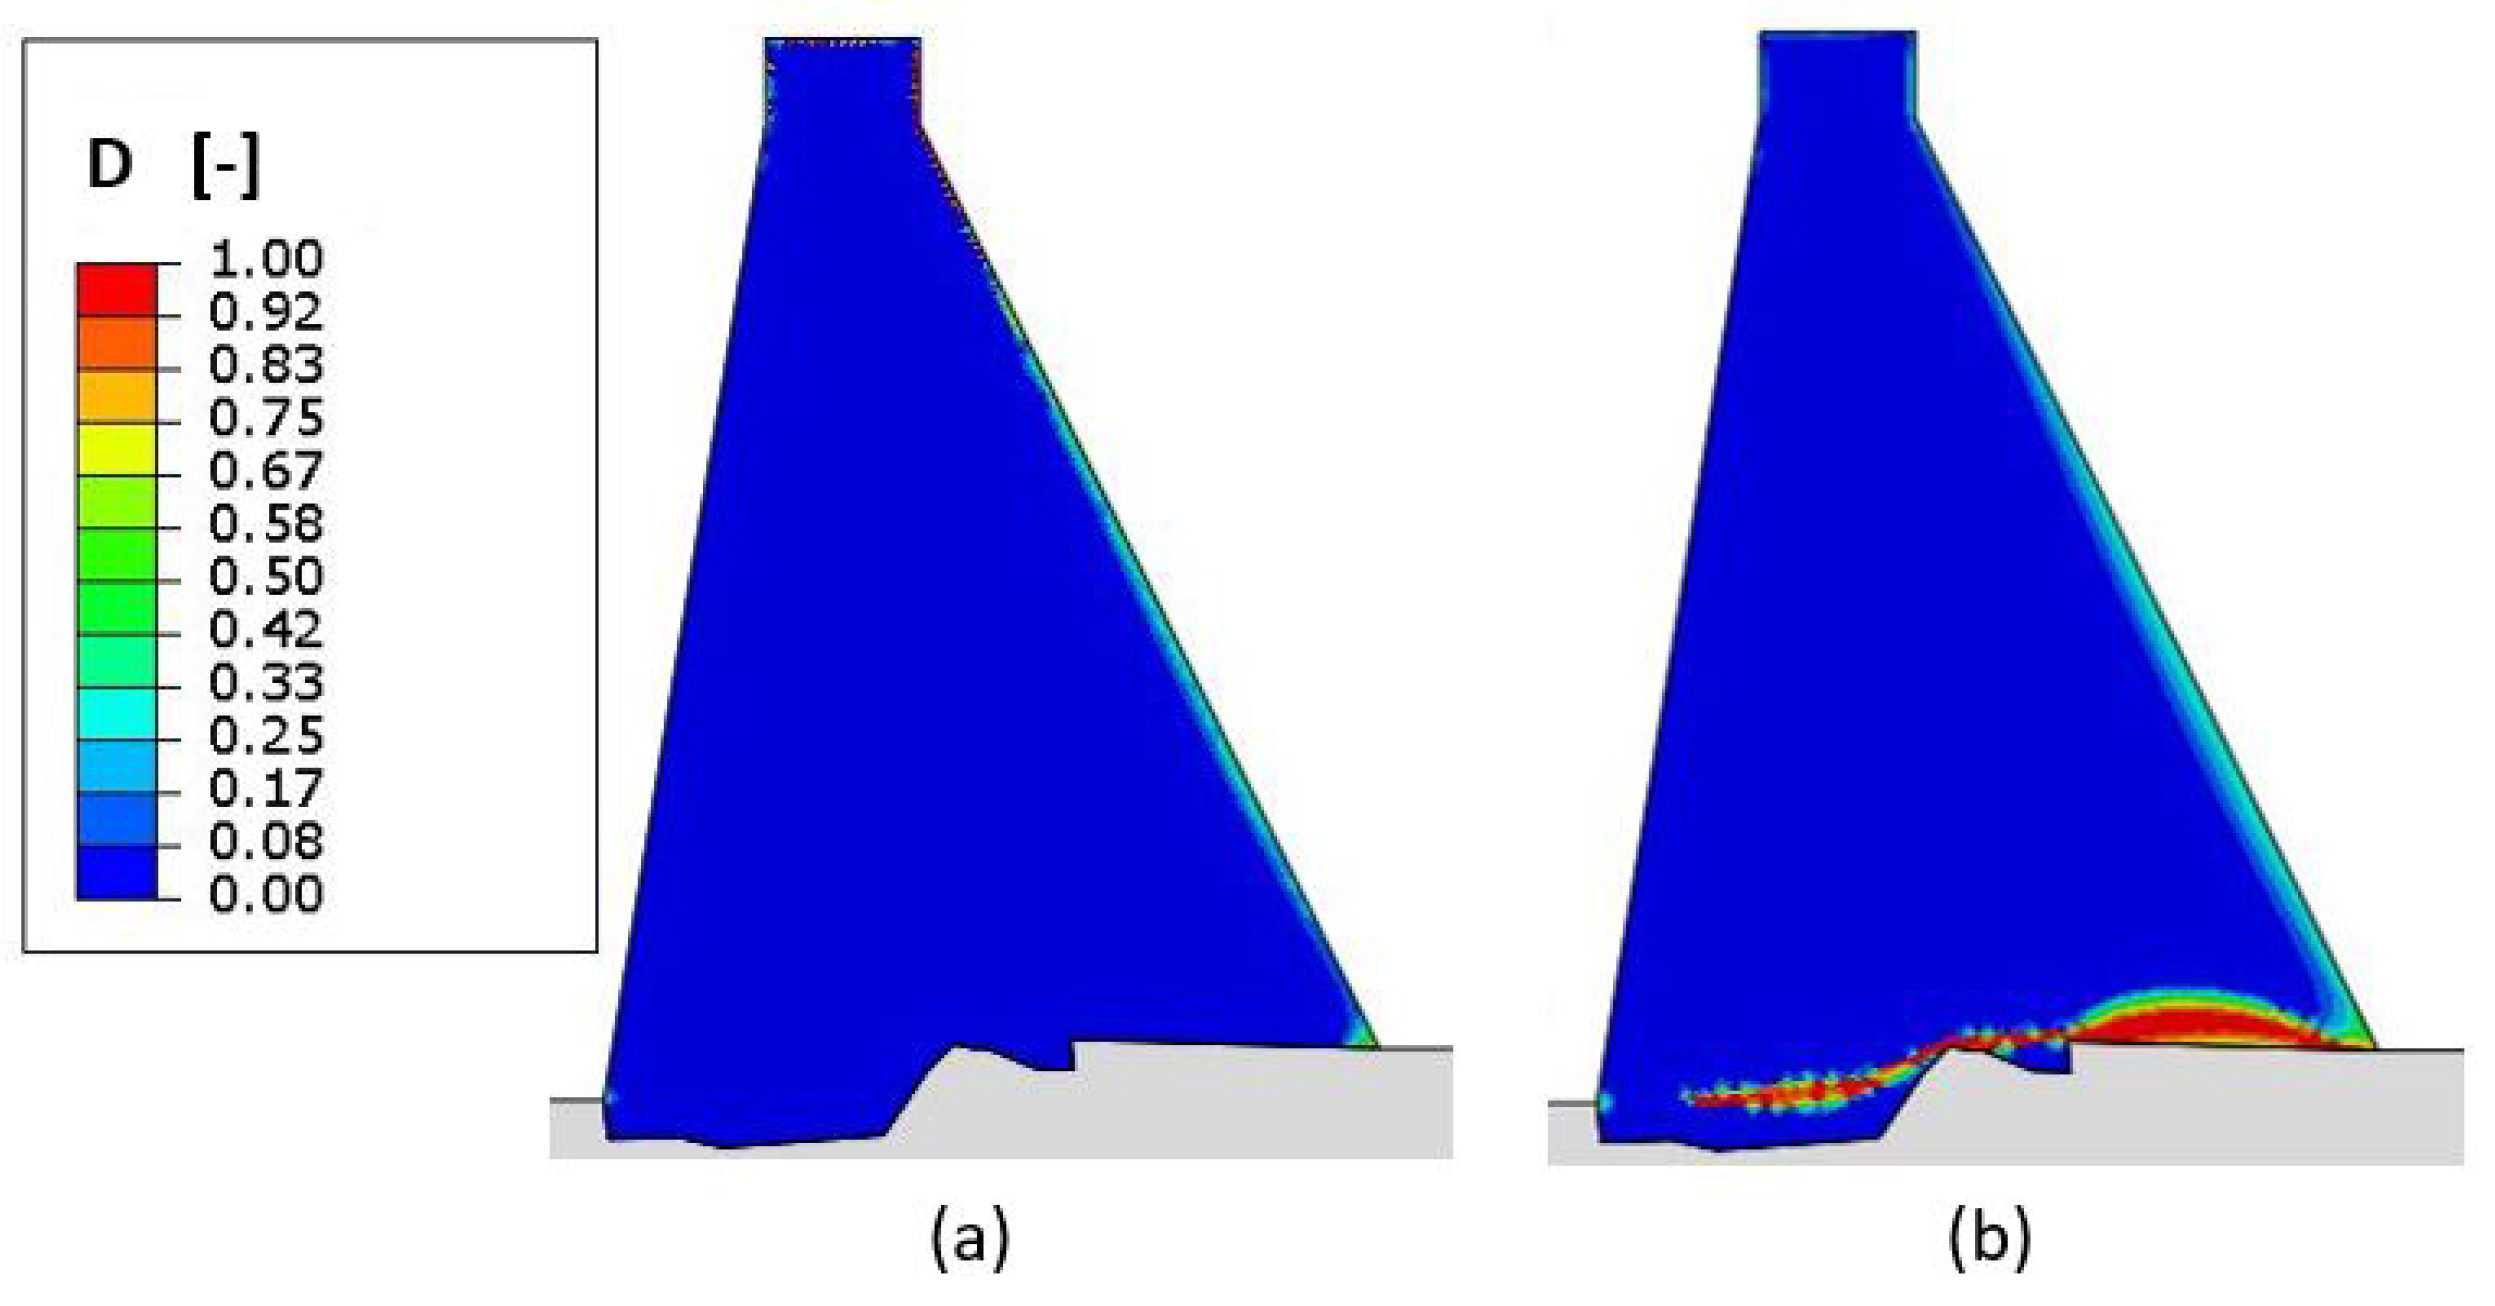
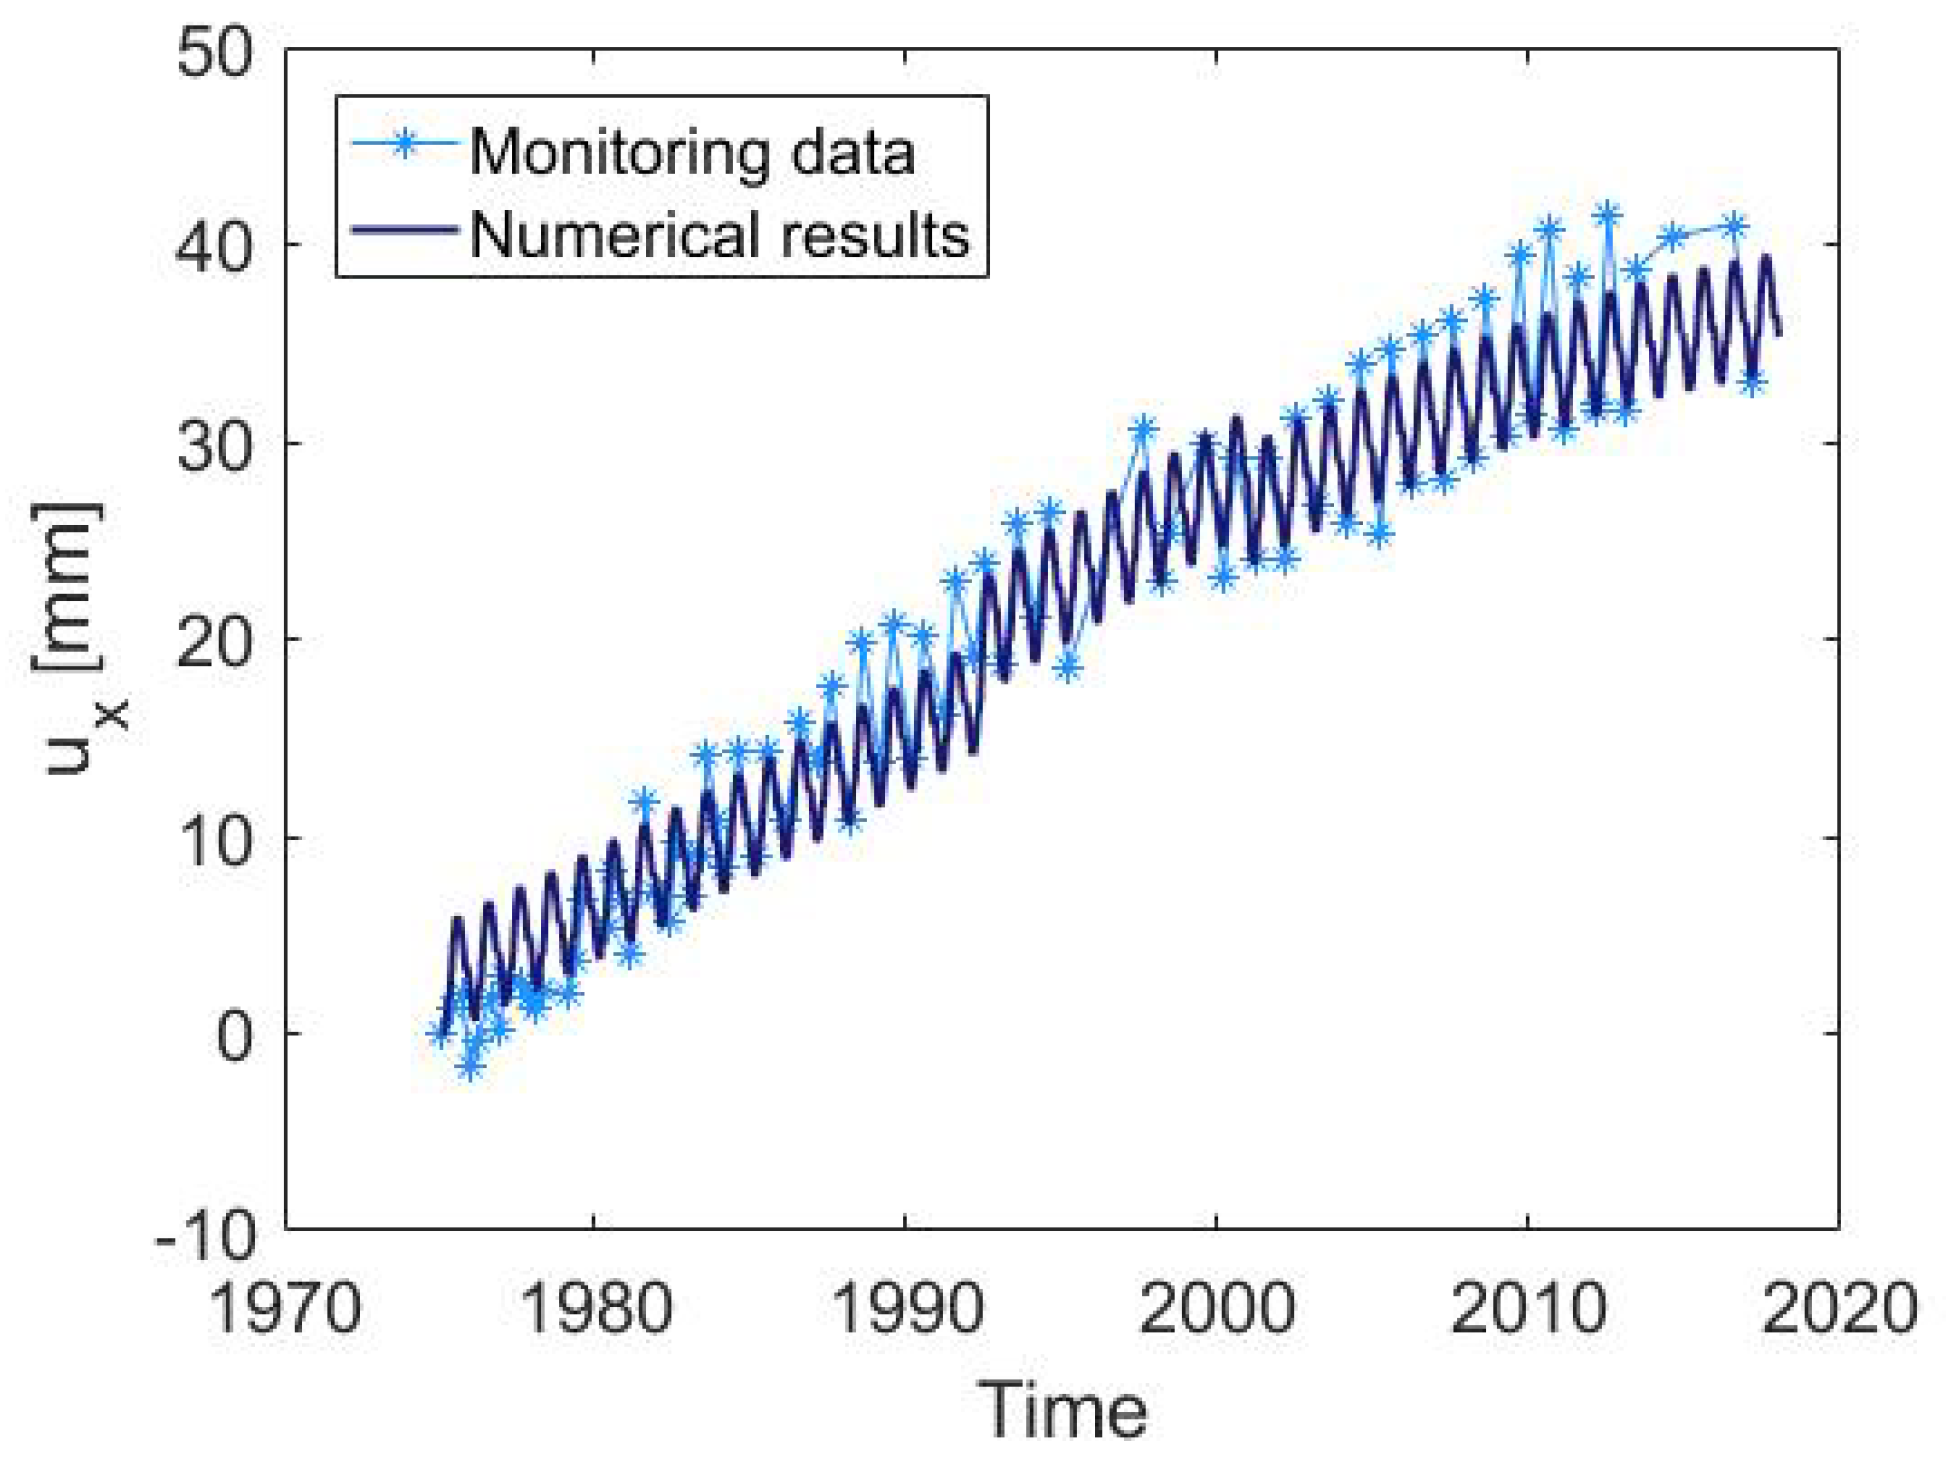
The development of ASR produced an overall expansion of the dam, with a permanent variation of upstream–downstream displacements, which was superposed to the normal seasonal oscillation. Furthermore, ASR induced damage in the material. Figure 14 shows the damage at two different time steps. At the beginning, the damage appeared only on the external skin of the structure; the only part affected by the external humidity conditions. This was the first manifestation of ASR development, due to the different expansions at points with different degrees of saturation. The first macroscopic crack in the body of the dam and visible on the surface of the structure in contact with the rock developed 30 years after construction. One should observe that, as expected in a real massive structure at moderate environmental temperatures, the time scale involved in the damage process due to ASR was completely different from that of one typical in a standard test on mortar specimens accelerated by high temperature (see, e.g., [32]). Figure 15 shows a comparison between the monitoring data (mean values at points and of Figure 6a) and the numerical results, in terms of horizontal crest displacement, positive in the downstream–upstream direction. A good agreement between them was obtained.
5. Conclusions
In this work, a bi-phase damage model for concrete subject to the alkali-silica reaction present in the literature was used to simulate a recent experimental campaign, as well as to perform a mechanical analysis of an existing concrete gravity dam. In the adopted model, based on Biot’s theory of multi-phase materials, the progressive expansion of the alkali–silica gel is described by a phenomenological internal variable, depending both on temperature and on degree of saturation.
The structural analysis of an existing concrete gravity dam was aimed at assessing the extent of structural damage caused by the reaction. The material parameters used in the model to define the mechanical behaviour and the reaction development were calibrated and fixed using the monitoring information available, provided by Hydro-Quebec.
Firstly, the effects of temperature and of humidity on the hydraulic structure were evaluated through a heat diffusion analysis and a moisture diffusion analysis, respectively. The moisture gradient was present only near the dowstream face of the dam and, so, its effect on the ASR evolution was limited. Then, the solutions of these two analyses were used as input for a consequent chemo-thermo-mechanical analysis, used to define the response due to ASR. The results, in terms of horizontal crest displacement, were in good agreement with the available real structural data.
Author Contributions
The authors confirm contribution to the paper as follows: conceptualization, M.C. and C.C.; methodology, C.C.; software, M.C.; validation, M.C.; analysis, M.C.; data curation, M.C. and C.C.; writing—original draft preparation, M.C.; writing—review and editing, M.C.and C.C.; supervision, C.C.
Funding
This research received no external funding.
Acknowledgments
The authors acknowledge Simon-Nicholas Roth (Études de sécurité Direction Barrages et Infrastructures, Hydro-Quebèc) for providing the monitoring data of the studied gravity dam.
Conflicts of Interest
The authors declare no conflict of interest.
Abbreviations
The following abbreviations are used in this manuscript:
| ASR | Alkali–Silica Reaction |
References
- Stanton, T. Expansion of Concrete Through Reaction between Cement and Aggregate. Proc. Am. Soc. Civ. Eng. 1940, 66, 1781–1812. [Google Scholar]
- Sanjuán, M.Á.; Estévez, E.; Argiz, C. Alkali Ion Concentration Estimations in Cement Paste Pore Solutions. Appl. Sci. 2019, 9, 992. [Google Scholar] [CrossRef]
- Stanton, T. Studies of Use of Pozzolans for Counteracting Excessive Concrete Expansion Resulting from Reaction between Aggregates and the Alkalies in Cement. In Symposium on Use of Pozzolanic Materials in Mortars and Concretes; ASTM: West Conshohocken, PA, USA, 1950; p. 178. [Google Scholar]
- Thomas, M. The effect of supplementary cementing materials on alkali-silica reaction: A review. Cem. Concr. Res. 2011, 41, 1224–1231. [Google Scholar] [CrossRef]
- Sanjuán, M.A.; Argiz, C. Coal fly ash alkalis content characterization by means of a full factorial design. Mater. Lett. 2016, 164, 528–531. [Google Scholar] [CrossRef]
- Alnaggar, M.; Di Luzio, G.; Cusatis, G. Modeling Time-Dependent Behavior of Concrete Affected by Alkali Silica Reaction in Variable Environmental Conditions. Materials 2017, 10, 471. [Google Scholar] [CrossRef]
- Léger, P.; Coté, P.; Tinawi, R. Finite element analysis of concrete due to alkali-aggregate reactions. Comput. Struct. 1996, 60, 601–611. [Google Scholar] [CrossRef]
- Ingraffea, A. Case studies of simulation of fracture in concrete dams. Eng. Fract. Mech. 1990, 35, 553–564. [Google Scholar] [CrossRef]
- Józwiak-Niedzwiedzka, D.; Glinicki, M.A.; Gibas, K.; Baran, T. Alkali-Silica Reactivity of High Density Aggregates for Radiation Shielding Concrete. Materials 2018, 11, 2284. [Google Scholar] [CrossRef]
- Grymin, W.; Gawin, D.; Koniorczyk, M. Experimental and numerical investigation of the alkali-silica reaction in the cement-based materials. Arch. Civ. Mech. Eng. 2018, 18, 1698–1714. [Google Scholar] [CrossRef]
- Grymin, W.; Koniorczyk, M.; Pesavento, F. Macroscopic and mesoscopic approach to the alkali-silica reaction in concrete Macroscopic and Mesoscopic Approach to the Alkali-Silica Reaction in Concrete. AIP Conf. Proc. 1922. [Google Scholar] [CrossRef]
- Cuba Ramos, A. Multi-Scale Modeling of the Alkali-Silica Reaction in Concrete. Ph.D. Thesis, Ecole Polytechnique Federale de Lausanne, Lausanne, Switzerland, 2017. [Google Scholar]
- Esposito, R.; Hendriks, M.A.N. Literature review of modelling approaches for ASR in concrete: A new perspective. Eur. J. Environ. Civ. Eng. 2017, 8189, 1–21. [Google Scholar] [CrossRef]
- Fairbairn, E.M.R.; Ribeiro, F.L.B.; Lopes, L.E.; Toledo-filho, R.D.; Silvoso, M.M. Modelling the structural behaviour of a dam affected by alkali-silica reaction. Commun. Numer. Methods Eng. 2006, 22, 1–12. [Google Scholar] [CrossRef]
- Saouma, V.; Perotti, L.; Shimpo, T. Stress Analysis of Concrete Structures Subjected to Alkali-Aggregate Reactions. ACI Struct. J. 2007, 104, 532–541. [Google Scholar]
- Noret, C.; Molin, X.; Theme, A. Effect of concrete swelling on the equilibrium and displacements of an arch dam. In Proceedings of the XI ICOLD Benchmark Workshop on Numerical Analysis of Dams, Valencia, España, 20–21 October 2011. [Google Scholar]
- Carrazedo, R.; Sanches, R.A.K.; de Lacerda, L.A.; Divino, P.L. Concrete Expansion Induced by Alkali-Silica Reaction in a Small Arch Dam. Int. J. Civ. Eng. 2017. [Google Scholar] [CrossRef]
- Comi, C.; Kirchmayr, B.; Pignatelli, R. Two-phase damage modeling of concrete affected by alkali-silica reaction under variable temperature and humidity conditions. Int. J. Solids Struct. 2012, 49. [Google Scholar] [CrossRef]
- Gautam, B.P.; Panesar, D.K. A new method of applying long-term multiaxial stresses in concrete specimens undergoing ASR, and their triaxial expansions. Mater. Struct. Constr. 2016, 49, 3495–3508. [Google Scholar] [CrossRef]
- Ulm, F.J.; Coussy, O.; Kefei, L.; Larive, C. Thermo-chemo-mechanics of ASR expansion in concrete structures. J. Eng. Mech. 2000, 126, 233–242. [Google Scholar] [CrossRef]
- Multon, S.; Toutlemonde, F. Effect of moisture conditions and transfers on alkali silika reaction damaged structures. Cem. Concr. Res. 2010, 40, 924–934. [Google Scholar] [CrossRef]
- Mainguy, M.; Coussy, O.; Baroghel-Bouny, V. Role of air pressure in drying of weakly permeable materials. J. Eng. Mech. 2001, 127, 582–592. [Google Scholar] [CrossRef]
- Baroghel-bouny, V.; Mainguy, M.; Lassabatere, T.; Coussy, O. Characterization and identification of equilibrium and transfer moisture properties for ordinary and high-performance cementitious materials. Cem. Concr. Res. 1999, 29, 1225–1238. [Google Scholar] [CrossRef]
- Coussy, O. Poromechanics; John Wiley & Sons: New York, NY, USA, 2004. [Google Scholar]
- Comi, C.; Fedele, R.; Perego, U. A chemo-thermo-damage model for the analysis of concrete dams affected by alkali-silica reaction. Mech. Mater. 2009, 41, 210–230. [Google Scholar] [CrossRef]
- Comi, C.; Perego, U. Fracture energy based bi-dissipative damage model for concrete. Int. J. Solids Struct. 2001, 38, 6427–6454. [Google Scholar] [CrossRef]
- Multon, S.; Toutlemonde, F. Effect of applied stresses on alkali-silica reaction-induced expansions. Cem. Concr. Res. 2006, 36, 912–920. [Google Scholar] [CrossRef]
- Gautam, B.P.; Panesar, D.K.; Sheikh, S.A.; Vecchio, F.J. Multiaxial expansion-stress relationship for alkali silica reaction-affected concrete. ACI Mater. J. 2017, 114, 171–184. [Google Scholar] [CrossRef]
- Huang, M.; Pietruszczak, S. Modeling of thermomechanical effects of alkali-silica reaction. J. Eng. Mech. 1999, 125, 476–485. [Google Scholar] [CrossRef]
- Asadi, I.; Sha, P.; Fitri, Z.; Abu, B. Thermal conductivity of concrete—A review. J. Build. Eng. 2018, 20, 81–93. [Google Scholar] [CrossRef]
- Pomianowski, M.; Heiselberg, P.; Jensen, R.L.; Cheng, R.; Zhang, Y. A new experimental method to determine specific heat capacity of inhomogeneous concrete material with incorporated microencapsulated-PCM. Cem. Concr. Res. 2014, 55, 22–34. [Google Scholar] [CrossRef]
- Shin, J.H.; Struble, L.J.; Kirkpatrick, R.J. Microstructural Changes Due to Alkali-Silica Reaction during Standard Mortar Test. Materials 2015, 8, 8292–8303. [Google Scholar] [CrossRef] [PubMed] [Green Version]
Figure 1.
Schematic representation of the assumed bi-phase model.

Figure 2.
(a) Experimental configuration of a concrete cubic specimen with plates and bolts in the three mutually perpendicular directions, adapt from [19]; and (b) adopted finite element (FE) mesh of one eighth of the specimen.
Figure 2.
(a) Experimental configuration of a concrete cubic specimen with plates and bolts in the three mutually perpendicular directions, adapt from [19]; and (b) adopted finite element (FE) mesh of one eighth of the specimen.

Figure 3.
Mean strain evolution in the free expansion test: Comparison between experimental ASR-only data by Gautam, et al. [28] and model result.
Figure 3.
Mean strain evolution in the free expansion test: Comparison between experimental ASR-only data by Gautam, et al. [28] and model result.

Figure 4.
Comparison between experimental data of Gautam’s campaign and model results obtained through 3D FE analysis, in terms of X, Y, and Z strains: (a) Uniaxial compression with = MPa, and (b) biaxial case with = = MPa.
Figure 4.
Comparison between experimental data of Gautam’s campaign and model results obtained through 3D FE analysis, in terms of X, Y, and Z strains: (a) Uniaxial compression with = MPa, and (b) biaxial case with = = MPa.

Figure 5.
Contour plot of damage at the end of the biaxal expansion test in different sections of the specimen.
Figure 5.
Contour plot of damage at the end of the biaxal expansion test in different sections of the specimen.

Figure 6.
(a) Location of the monitoring instruments in the studied gravity dam and (b) the 2D section s–s considered for the analyses.
Figure 6.
(a) Location of the monitoring instruments in the studied gravity dam and (b) the 2D section s–s considered for the analyses.

Figure 7.
Annual variation of (a) temperature in C and (b) relative humidity of the air (courtesy of Hydro-Quebec).
Figure 7.
Annual variation of (a) temperature in C and (b) relative humidity of the air (courtesy of Hydro-Quebec).

Figure 8.
Finite element model for the dam foundation system.

Figure 9.
Boundary condition for the upstream face of the dam and locations of the nodes considered for the diffusion analyses.
Figure 9.
Boundary condition for the upstream face of the dam and locations of the nodes considered for the diffusion analyses.

Figure 10.
Flowchart of the heat diffusion analyses to determine the yearly evolution of the temperature field.
Figure 10.
Flowchart of the heat diffusion analyses to determine the yearly evolution of the temperature field.

Figure 11.
Contour plots: (a) Stabilized temperature (in C) and (b) stabilized saturation degree.

Figure 12.
Histories of (a) temperature and (b) saturation degree for some nodes (A, B, C, and D) in the dam.
Figure 12.
Histories of (a) temperature and (b) saturation degree for some nodes (A, B, C, and D) in the dam.

Figure 13.
Reaction extent of point A (downstream face), B (upstream face, upper part), C (in the bulk), and D (close to the rock foundation) of the dam (see Figure 9 for point locations).
Figure 13.
Reaction extent of point A (downstream face), B (upstream face, upper part), C (in the bulk), and D (close to the rock foundation) of the dam (see Figure 9 for point locations).

Figure 14.
Patterns of damage after (a) 10 and (b) 30 years.

Figure 15.
Comparison between monitoring data and numerical results, in terms of horizontal crest displacements.
Figure 15.
Comparison between monitoring data and numerical results, in terms of horizontal crest displacements.


Table 1.
Mechanical and thermal parameters of concrete and rock for the Beauharnois dam.
| Parameter | Value | Unit |
|---|---|---|
| 26,000 | MPa | |
| 0.21 | - | |
| 2365 | kg/m | |
| 3 | MPa | |
| 1 | 1/C | |
| 30,000 | MPa | |
| 0.2 | - | |
| 1 | 1/C |
Table 2.
Parameters for the alkali–silica reaction (ASR) model used for the simulation of Beauharnois dam.
Table 2.
Parameters for the alkali–silica reaction (ASR) model used for the simulation of Beauharnois dam.
| Parameter | Value | Unit |
|---|---|---|
| 500 | days | |
| 1100 | days | |
| 350 | days | |
| 700 | days | |
| 0.01 | - |
© 2019 by the authors. Licensee MDPI, Basel, Switzerland. This article is an open access article distributed under the terms and conditions of the Creative Commons Attribution (CC BY) license (http://creativecommons.org/licenses/by/4.0/).
Share and Cite
MDPI and ACS Style
Colombo, M.; Comi, C. Hydro-Thermo-Mechanical Analysis of an Existing Gravity Dam Undergoing Alkali–Silica Reaction. Infrastructures 2019, 4, 55. https://0-doi-org.brum.beds.ac.uk/10.3390/infrastructures4030055
AMA Style
Colombo M, Comi C. Hydro-Thermo-Mechanical Analysis of an Existing Gravity Dam Undergoing Alkali–Silica Reaction. Infrastructures. 2019; 4(3):55. https://0-doi-org.brum.beds.ac.uk/10.3390/infrastructures4030055
Chicago/Turabian StyleColombo, Martina, and Claudia Comi. 2019. "Hydro-Thermo-Mechanical Analysis of an Existing Gravity Dam Undergoing Alkali–Silica Reaction" Infrastructures 4, no. 3: 55. https://0-doi-org.brum.beds.ac.uk/10.3390/infrastructures4030055