1. Introduction
This paper presents the most recent findings of a multiphase study conducted at the University of Nebraska with funding from the Nebraska Department of Transportation (NDOT). The ultimate goal of the study is to develop a novel nondestructive testing (NDT) approach for the continuous health monitoring of reinforced concrete bridge decks to identify the onset, type, and location of various flaws (corrosion, delamination, and concrete cracking). Current practice detects corrosion effects after the development of significant damage, including spalls and cracks in the surrounding concrete. The damage is detected using energy transmitted through concrete sections or reflected from damage.
The method discussed here involves use of the steel reinforcement (rebar) as a wave guide that transmits ultrasonic waves through the system and the measurement of the leaked energy at the surface of the concrete. The results are processed in the frequency domain, and amplitude measurements are utilized for the detection of changes in the system. This method provides a significant improvement over conventional damage assessment techniques, detecting microcracking and minor corrosion effects before corrosion and/or delamination has progressed to a damaging level.
In the previously published phases of this study, first, the proof of concept for the proposed ultrasonic guided wave leakage (UGWL) method’s effectiveness to detect the onset of delamination in reinforced concrete was demonstrated successfully [
1]. Then, early detection of the onset of corrosion and cracking in concrete was also demonstrated in simple specimens with unidirectional reinforcement [
2].
This paper builds upon the progress made in the previous phases and aims to further explore the capabilities and practicality of the proposed NDT method. Specifically, the limitations in the propagation distance, effect of bidirectional reinforcement, coupling of the sensors to the rebars, and suggestions for optimal sensor arrays are discussed in this paper based on the findings from the most recent laboratory tests.
1.1. Background and Motivation
This study is motivated by the increased demand for structural health monitoring (SHM) systems for the rapidly aging U.S. infrastructure. Steel reinforcement is used in most of these concrete structures, including buildings, bridges, and parking structures. Reinforced concrete structures are vulnerable to issues caused by corrosion, delamination, and cracking, which may adversely affect the integrity and structural capacity of the composite structure. Reinforced concrete bridge decks are particularly susceptible to corrosion and delamination due to the harsh conditions they commonly experience, including freeze–thaw cycles, de-icing salts, continuous impact from heavy traffic, and exposure to water. As of 2015, the National Bridge Inventory (NBI) indicates that 142,915 out of the 611,845 highway bridges in the U.S., or about 23 percent, are structurally deficient [
3]. It has been estimated that the annual corrosion-related repair costs for highway bridges exceed
$8.3 billion. This includes
$2 billion for bridge deck repairs [
4], with corrosion and delamination accounting for approximately 40 percent of these costs [
5].
Given the importance of these issues, there is a substantial body of literature on various methods of structural health monitoring and instantaneous assessments for bridge decks. The reader is referred to Garcia, 2016 [
6], for an extensive literature review presenting the research related to nondestructive assessment methods and structural health monitoring of reinforced concrete bridge decks; notes from a few key studies are included here.
Corrosion can lead to delamination when left unmanaged. As explained in further detail in [
2], chemical delamination forms the first stage of corrosion-related deterioration. These initial stages of corrosion temporarily improve the bond between concrete and steel. As corrosion continues to develop, the formation of iron oxides at the steel surface results in significant volumetric increase. This, in turn, creates internal pressures at the steel–concrete interface, and once the internal pressures cause the concrete to experience great enough tensile stresses, mechanical delamination is experienced.
This evolving nature of the bond between the steel and concrete presents one of the unique benefits of the proposed method, in that it has the potential to capture the entire deterioration progression. This knowledge in the form of a deterioration model can, in turn, inform design, maintenance, and repair processes for reinforced concrete and lower the large economic burden caused by corrosion- and delamination-related repairs.
The use of ultrasonic testing in the evaluation of structures is not new; however, most methods and the available testing standards (such as ASTM E494) utilize velocity readings and either direct or indirect readings from the concrete surface [
7]. The use of ultrasonic guided waves is less common, and thus far they have been typically used to evaluate the condition of the wave guide itself based on the attenuation of the propagated waves, instead of utilizing the changes in amplitude of the leaked waves. Some key ultrasonic guided wave studies in the literature are Rose (1999 and 2002), Miller, 2010, and Aranguren et al. (2013) [
8,
9,
10,
11].
1.2. Objectives
The experimental results presented in this paper are part of a larger study. This portion of the experimental study has four primary objectives in terms of improving both the theoretical foundation and practical applications of the proposed method: (1) to identify the onset and monitor the progression of corrosion products on the rebar in reinforced concrete bridge decks; (2) to examine the influence of directional and multiple layers of reinforcement on the ability of the UGWL arrangement to identify multiple types of early stage flaws; (3) to explore different attachment options and coupling gels for improved coupling conditions between the transducers and test materials (i.e., concrete and rebar); and (4) to perform pilot field trials to understand the real-life challenges associated with the process and identify new research needs related to implementation.
1.3. Significance
This study addresses several research and application gaps in the NDT of bridge decks. Currently, there are no global inspection tools for the SHM of reinforced concrete bridge decks that can identify corrosion, delamination, and cracks (i.e., examining the steel–concrete interface, steel, and concrete) at the same time with the same setup. Further, there is no NDT method with the sensitivity to detect the onset of deterioration for bridge decks; most methods can only identify issues long after they are large enough to start causing serious problems. Finally, there are few standardized ultrasonic testing (UT) methods that use energy-based measurements. Currently standardized UT methods, such as ASTM E494, use velocity measurements in the time domain rather than amplitude measurements in the frequency domain [
6].
Therefore, the significance of this project is twofold. First, this method has shown promise to detect a variety of flaws in reinforced concrete bridge decks at an earlier stage than currently available NDT methods. Second, such early detection, along with the continuous monitoring of the progression of flaws, can inform the development of deterioration models for new or recently repaired bridge decks.
2. Materials and Methods
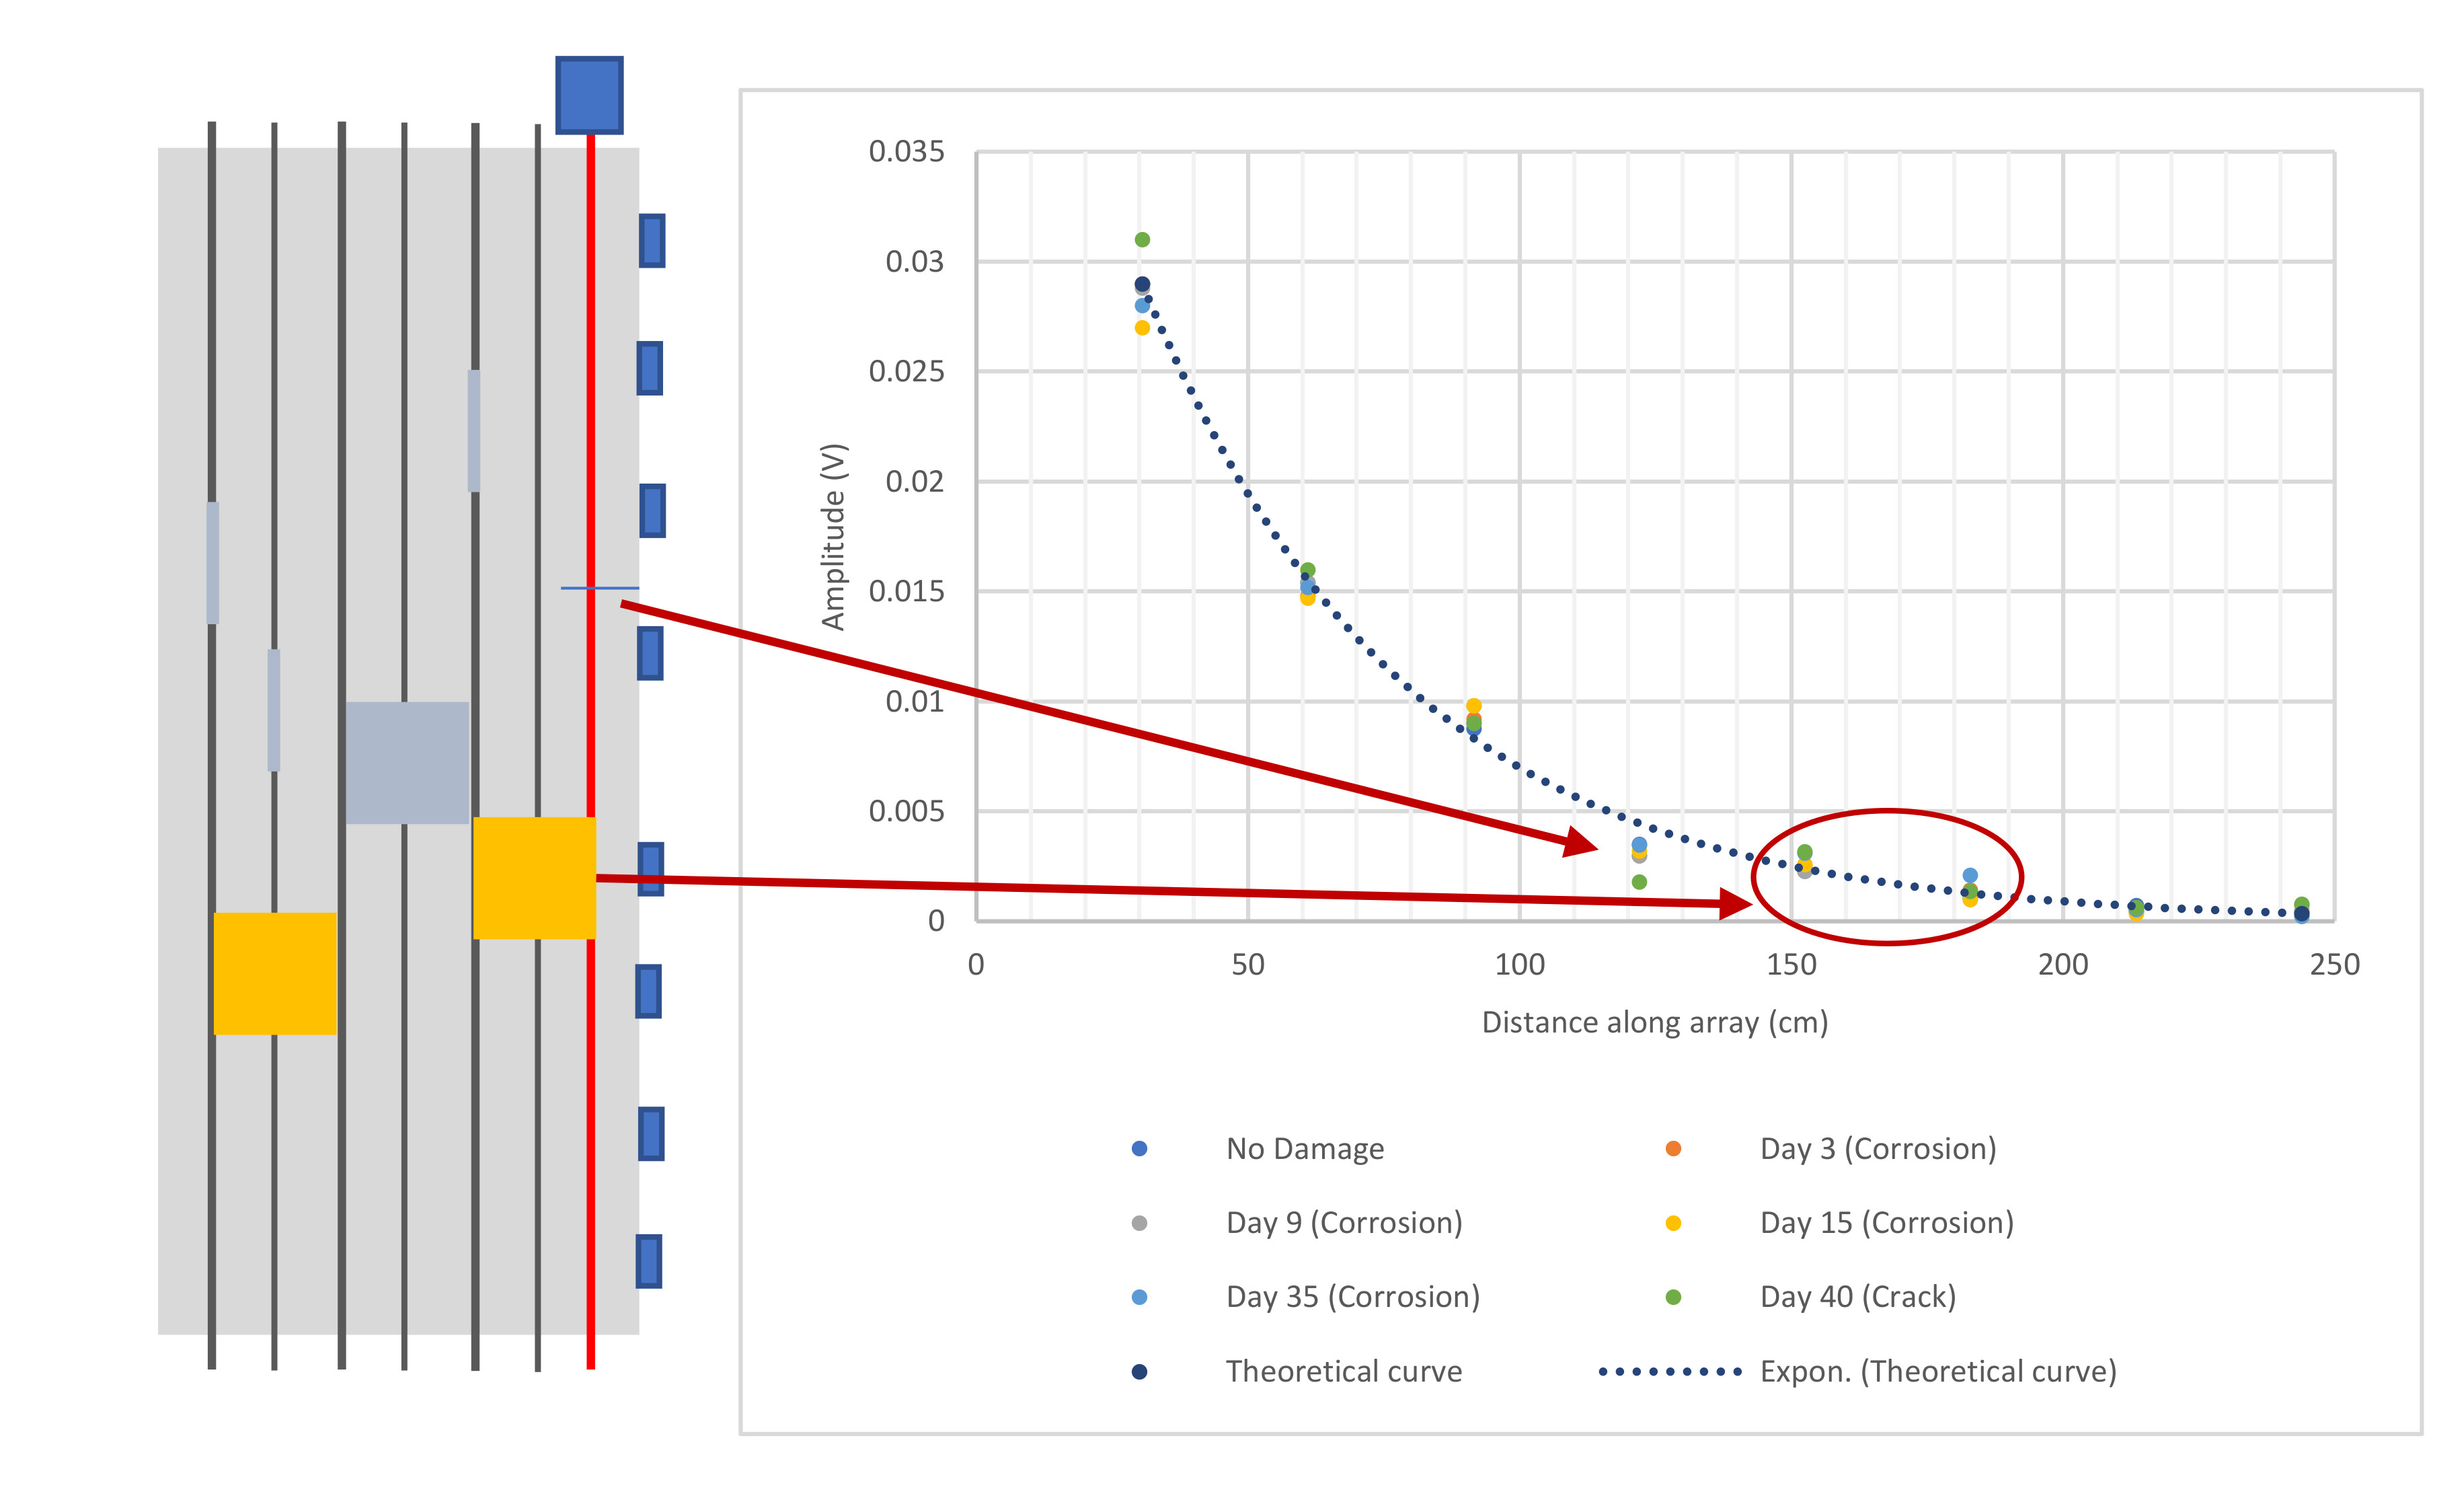
There are two unique aspects of the proposed methodology when compared to traditional ultrasonic testing. First is the utilization of the leaked energy from the ultrasonic guided waves into the surrounding concrete by coupling the transmitter to the steel rebar and receivers to the concrete surface (
Figure 1). The hypothesis behind this approach is that, with a theoretical understanding of the wave propagation in steel and the leaked-wave propagation in concrete, the types and locations of different flaws (chemical corrosion, delamination, and independent cracks in concrete) can be identified.
The second unique aspect is the utilization of the amplitude change (in the frequency domain) to monitor changes in the condition of the structure as the flaws progress. This approach is different to that in most related ultrasonic testing research, which concentrates on using velocity measurements for damage detection. The use of changes in amplitude allows for increased sensitivity to very small changes in the system and thereby allows for the detection of very early stages, or even the onset, of deterioration.
Two sets of ultrasonic equipment were used in this project: (1) the NDT 360 platform from Olson Instruments and the (2) Pulsonic Ultrasonic Pulse Analyzer 58-E4900 from Controls Group.
The experimental setup includes a transmitter (T) and receivers (R), shown in
Figure 1, which are standard 54 kHz transducers with either a 5.08 cm (2 in.) diameter or 2.54 cm (1 in.) diameter.
This paper presents the results from three sets of laboratory experiments and two pilot field implementation trials.
2.1. Setup for the Laboratory Experiments
Three sets of experiments were conducted to accomplish the objectives of this research. For all specimens, the concrete mix design used was the typical mixture used by the Nebraska Department of Transportation (NDOT) for bridge decks, designated 47BD (
Table 1). This mix also meets the criteria set out by the American Association of State Highway and Transportation Officials (AASHTO) for concrete bridge decks.
2.1.1. Specimen Set 1
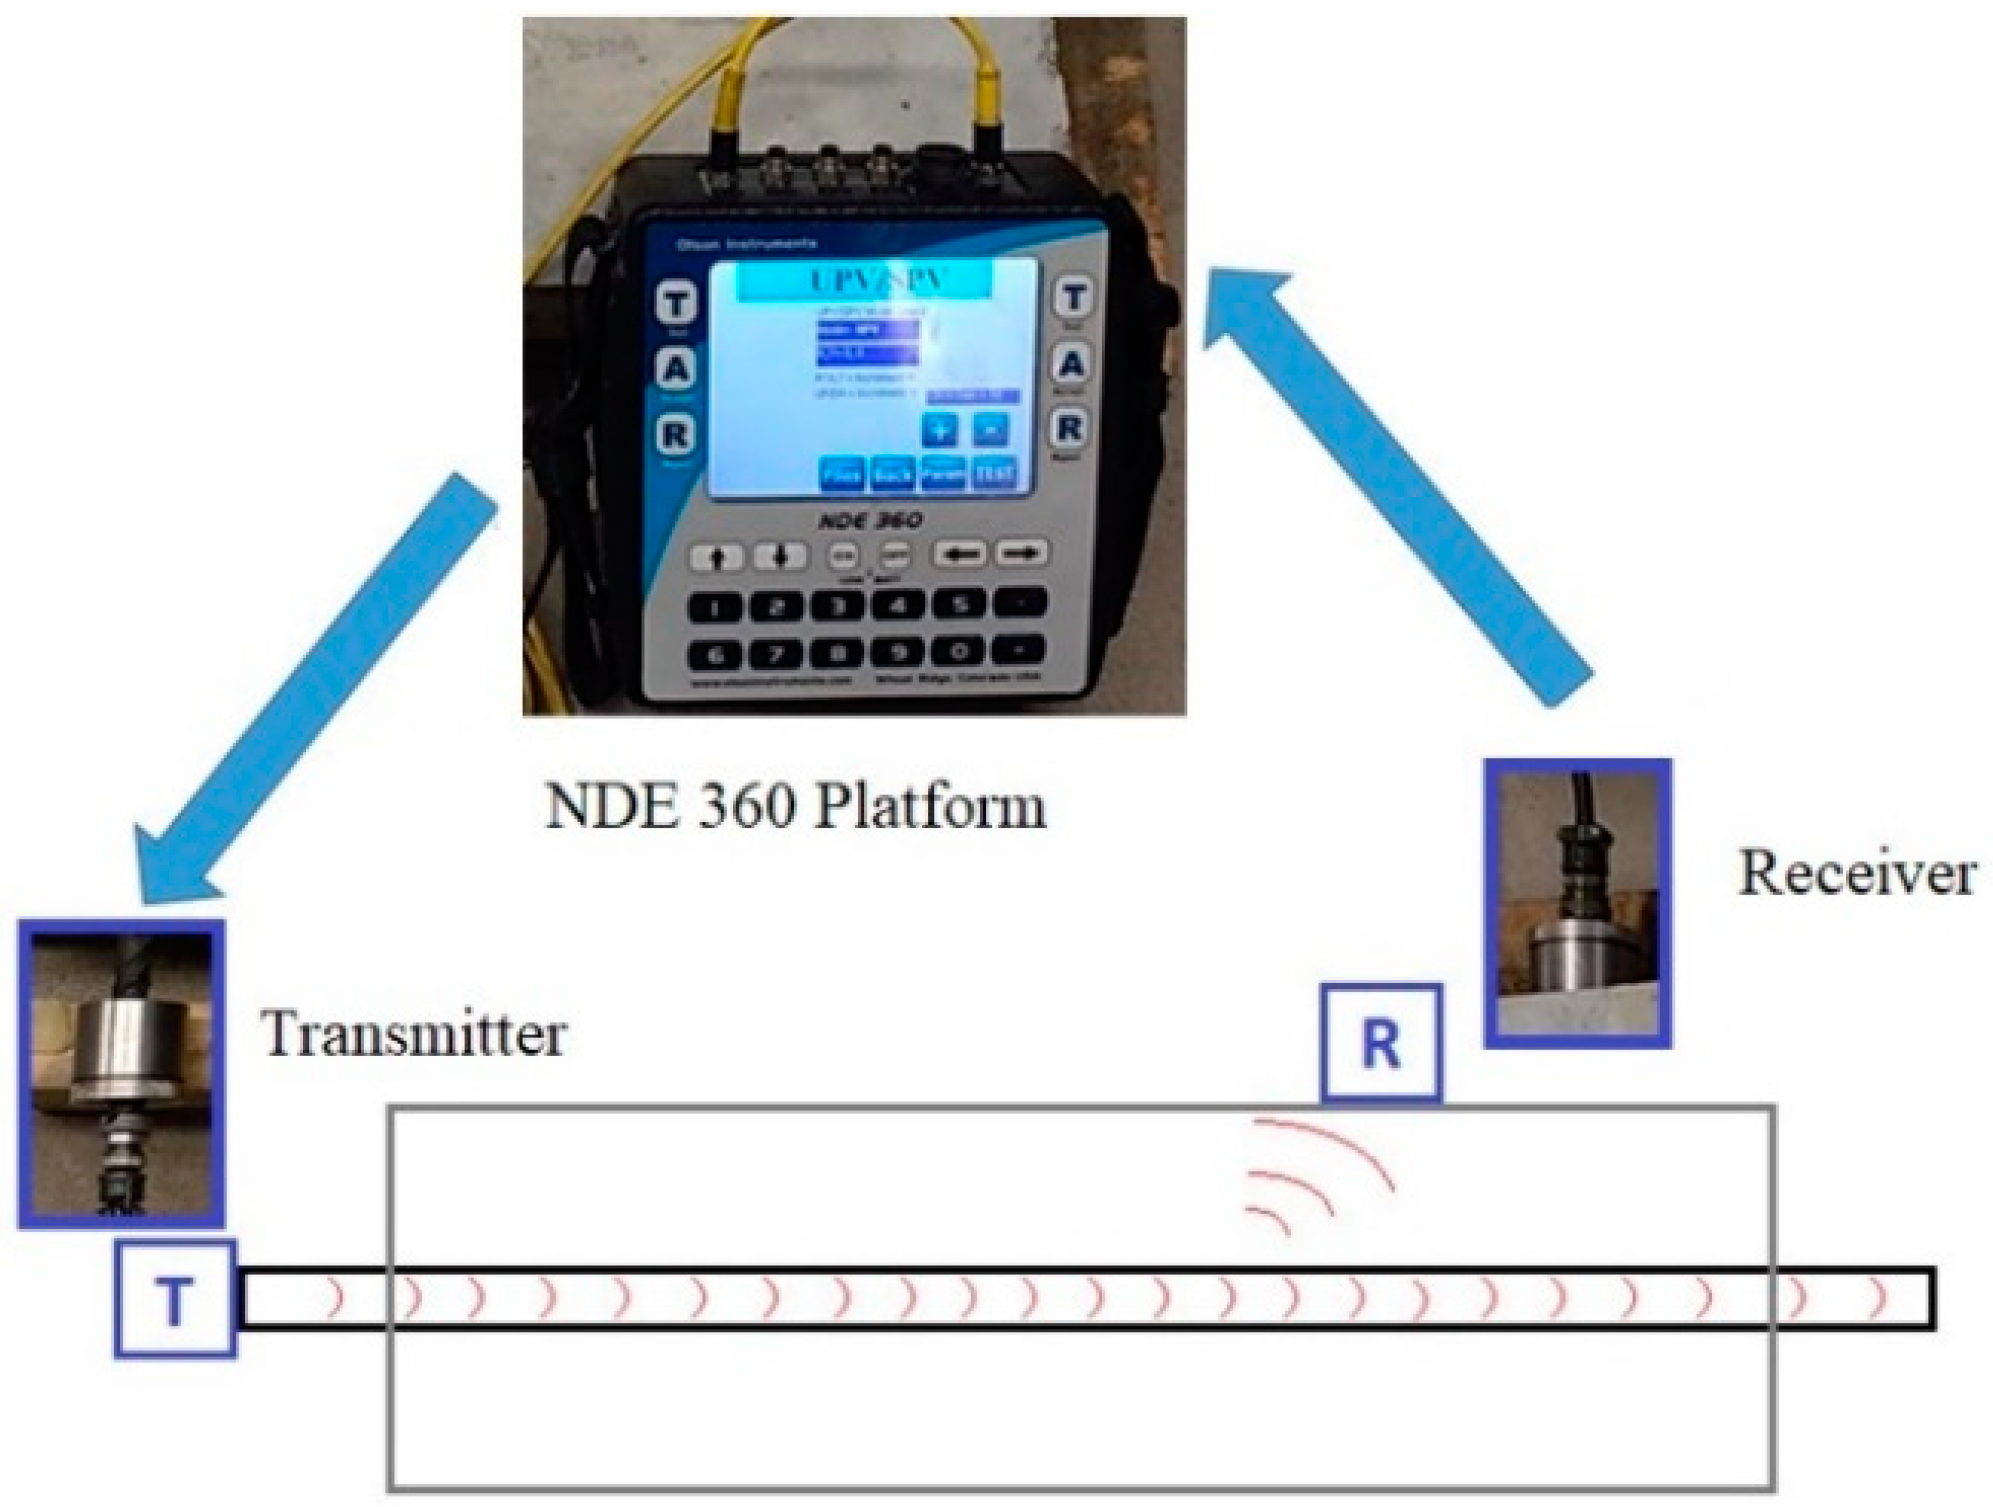
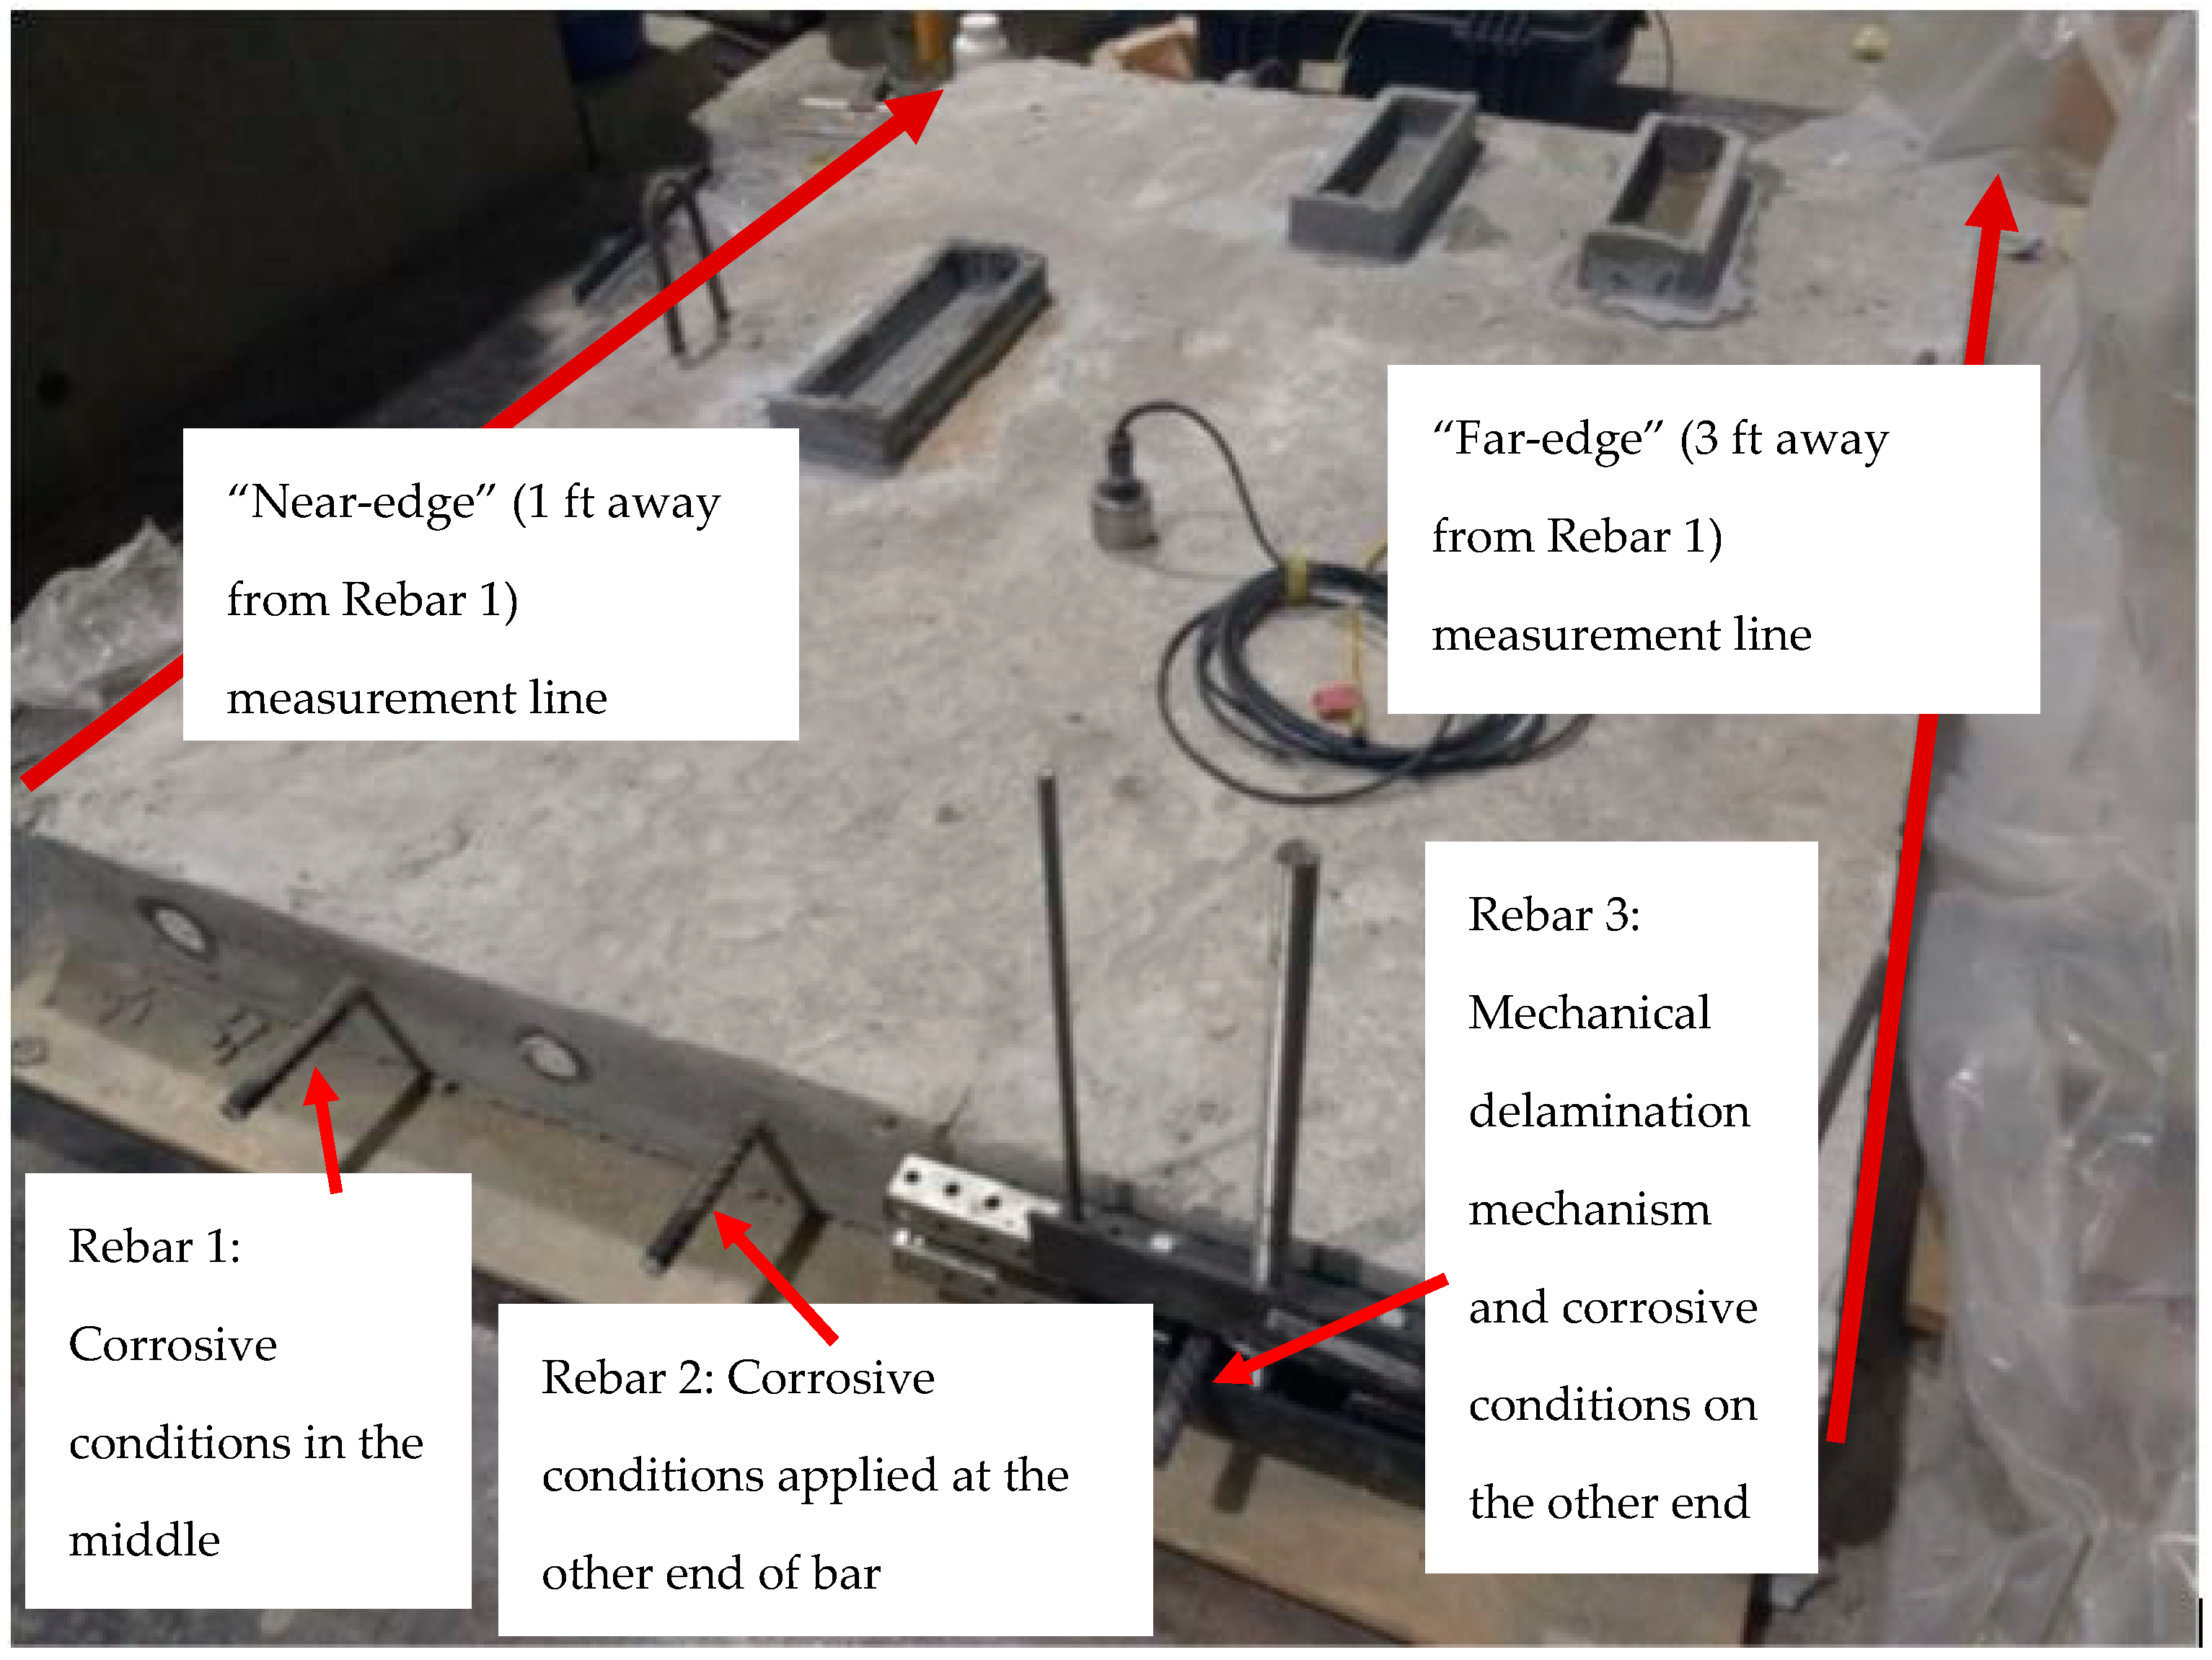
Specimen Set 1 consisted of one 152 cm × 122 cm × 12.7 cm (60 in. × 48 in. × 5 in.) concrete slab with three 16 mm (No. 5) steel reinforcing bars spaced horizontally at 30.5 cm (12 in.) and placed at the center of the slab vertically, with a 6.35 cm (2.5 in.) cover from either side (
Figure 2). This reflects the typical cover distance used by NDOT for bridge decks.
The purpose of this specimen was to investigate the capabilities of the proposed method for (1) detecting the onset of corrosion in a larger and more complex specimen than those established previously by the authors [
1,
2] and (2) detecting corrosion and delamination flaws in the same specimen.
To achieve these goals, certain regions of the slab were cast using 5 percent NaCl solution (i.e., salt water) to localize the corrosive environment. Further, to accelerate the corrosion in these regions, concrete basins of 30.5 × 7.62 × 5.08 cm (12 in. × 3 in. × 2 in.) were cast in those regions above the reinforcing bars (
Figure 2). These were filled with 5% NaCl solution to maintain a high chloride content in these regions and accelerate the corrosion process. Because the solution inevitably gets absorbed by the concrete and/or evaporates, the basins were refilled with saltwater solution every six days. The third steel reinforcing bar (the right-most bar in
Figure 2) in this specimen was used to monitor the simultaneous development of corrosion and delamination. One end of the rebar was exposed to corrosive conditions for 24 days, while the rebar was simultaneously delaminated slowly at the other end over the same time period using the mechanical device shown in
Figure 2.
2.1.2. Specimen Set 2
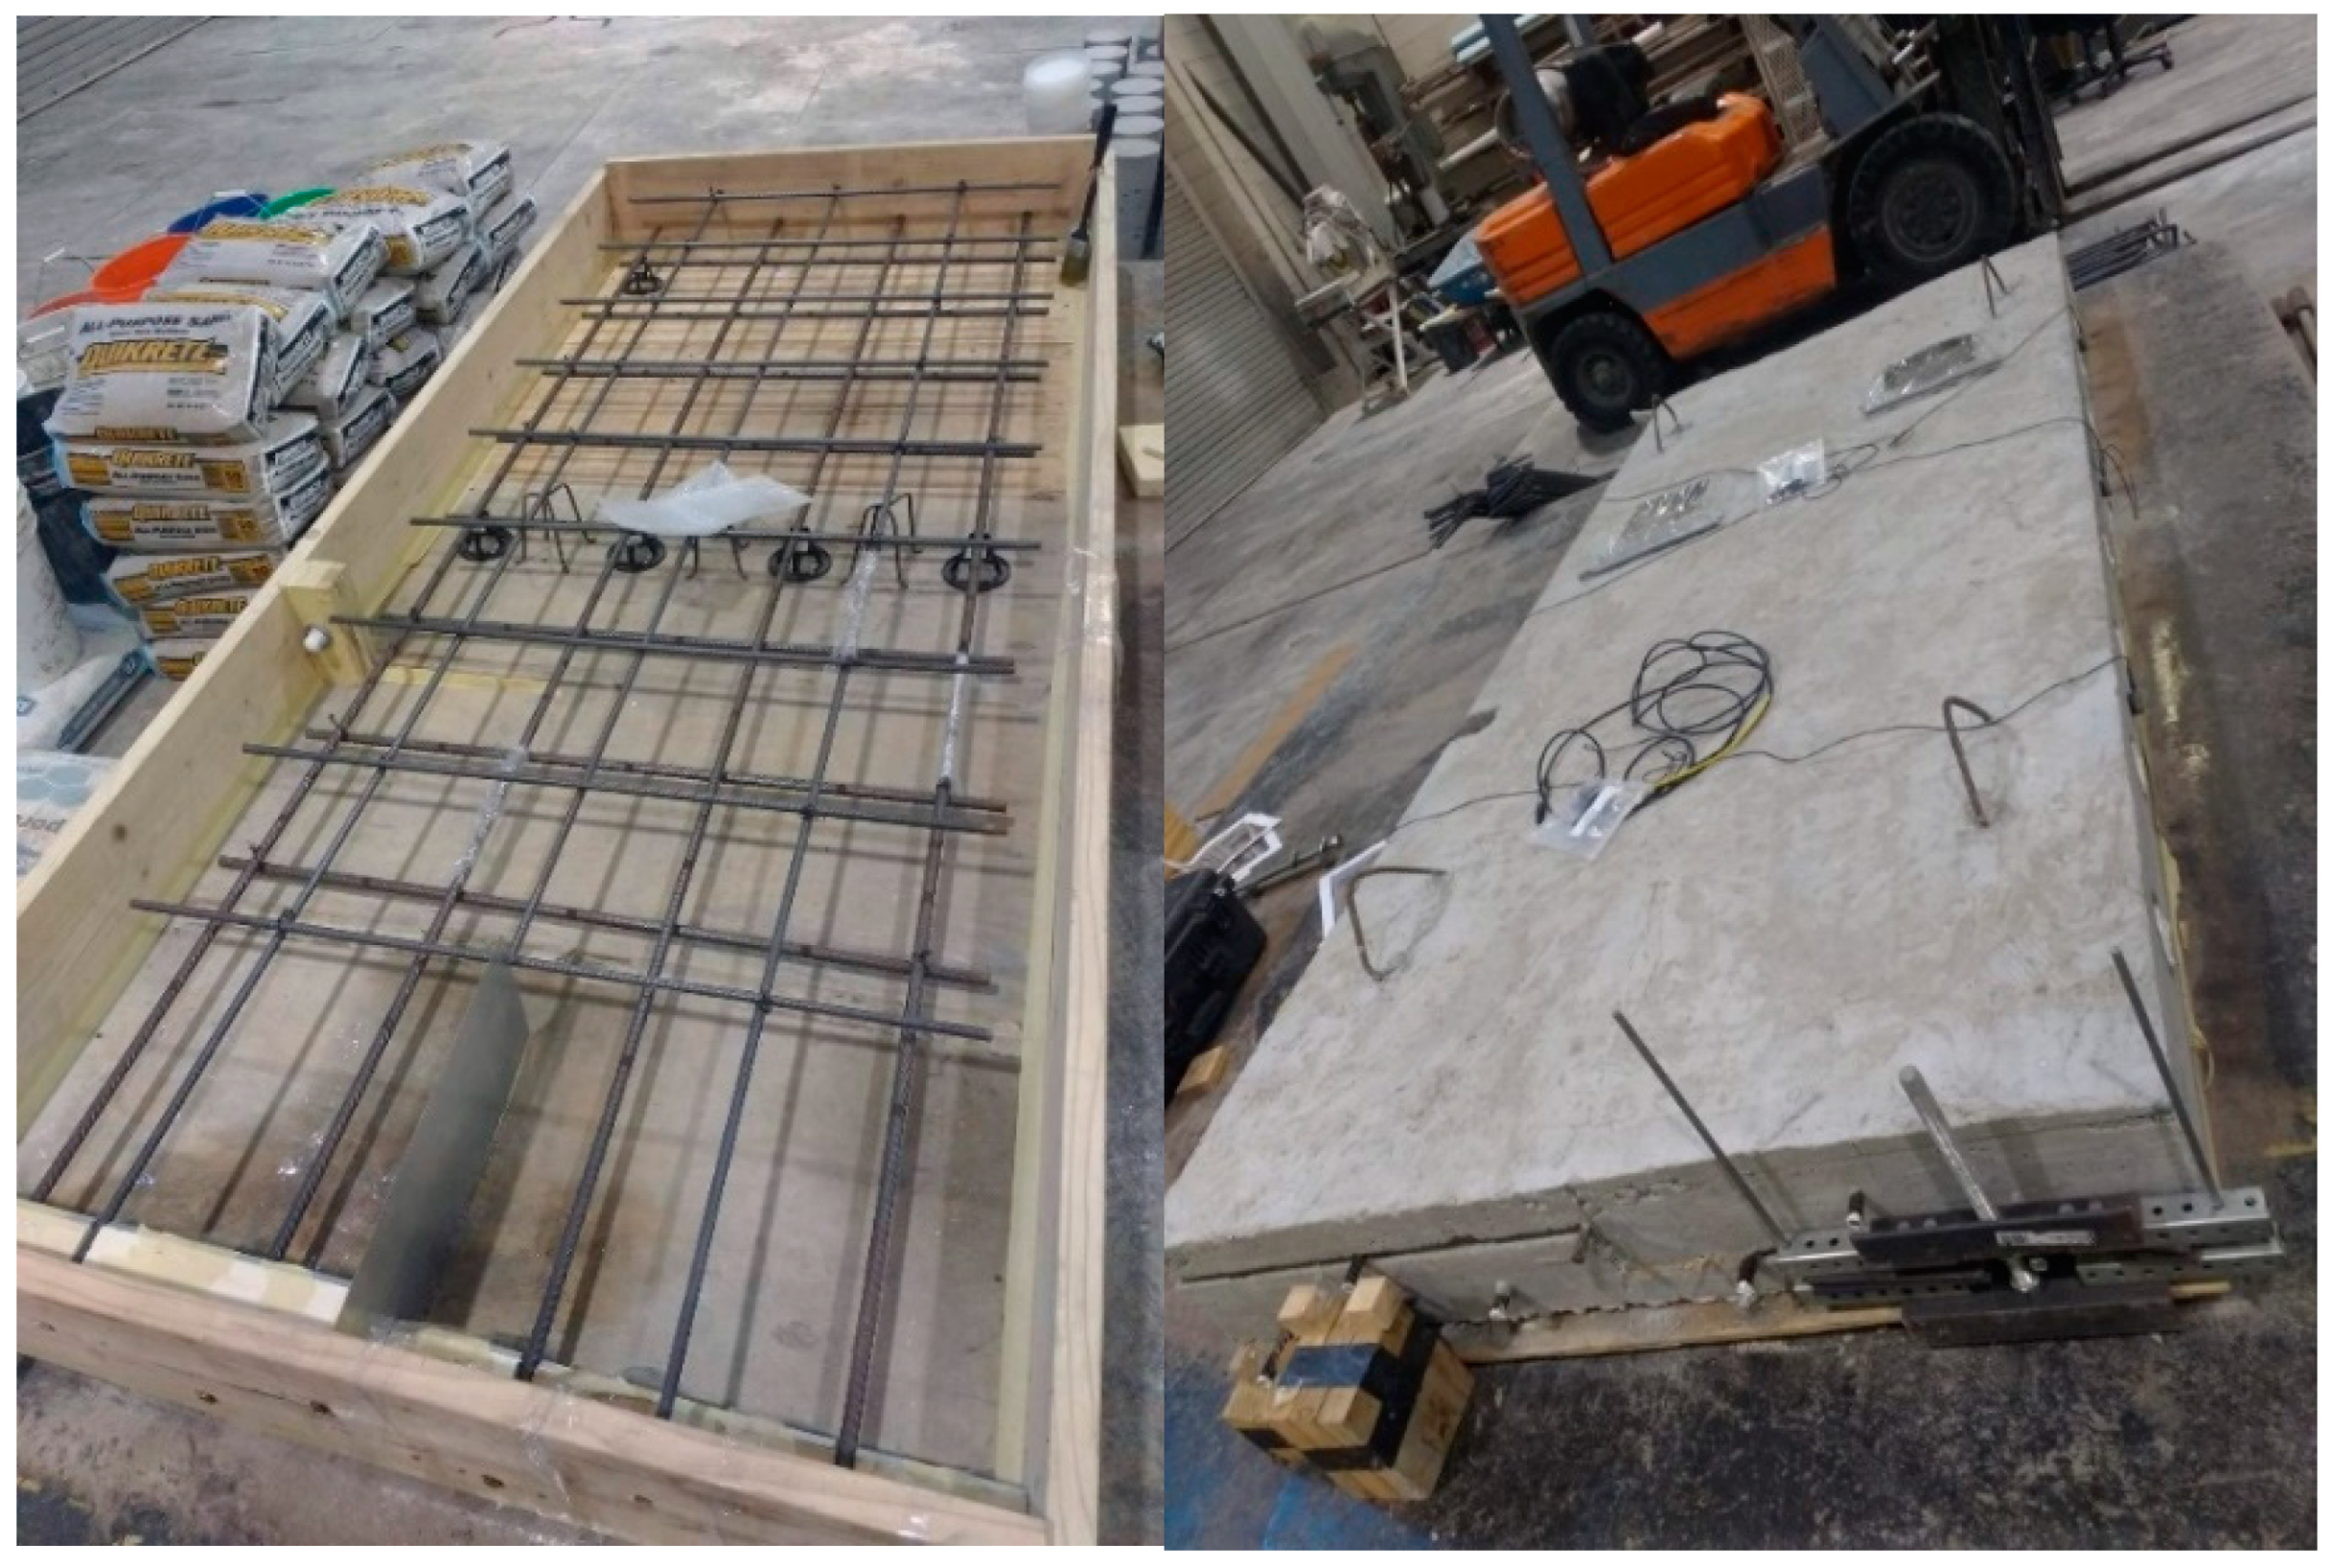
Specimen Set 2 was a larger reinforced concrete slab measuring 305 cm × 122 cm × 20.3 cm (10 ft. × 4 ft. × 8 in). This specimen was cast (1) to examine the influence of multiple layers and directions of reinforcement on the proposed UGWL method, (2) to test greater distances between the transmitter and receivers than those tested by previous experiments, and (3) to evaluate whether the proposed method can detect a variety of flaws (corrosion, delamination, and cracks) in the same specimen (
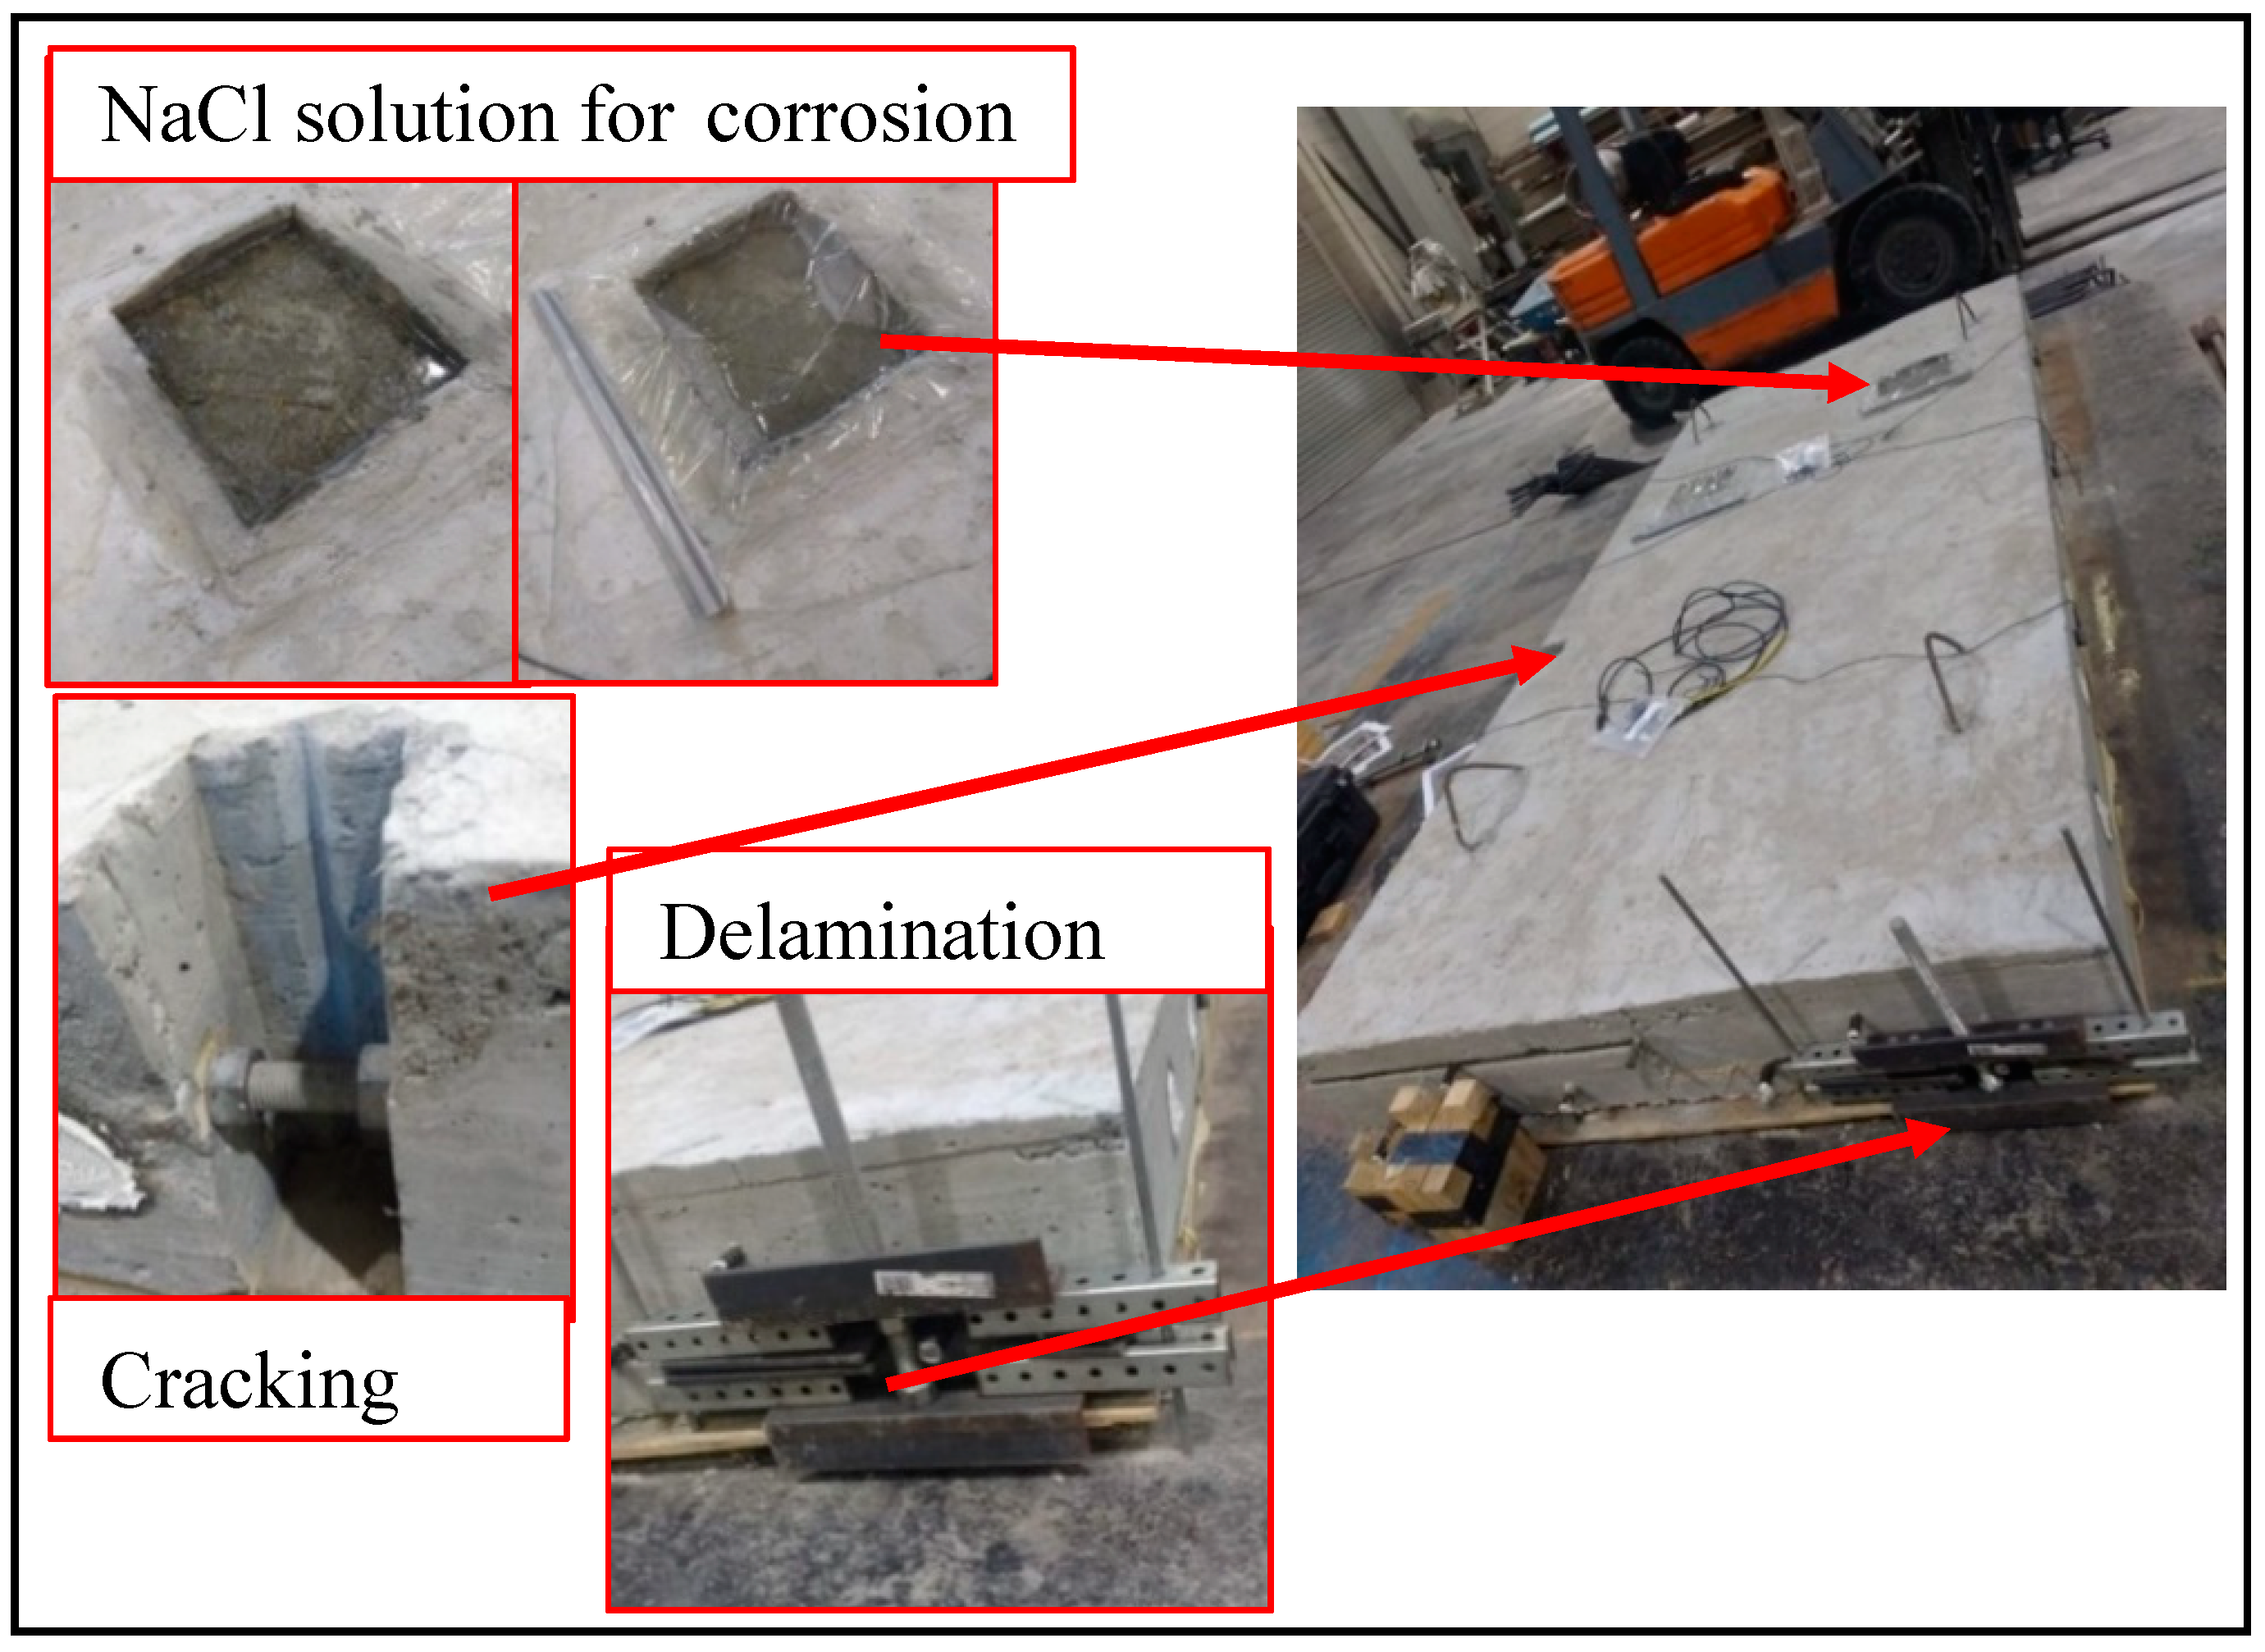
Figure 3). Each layer of reinforcement had a cover of 6.35 cm (2.5 in.) from the outer surfaces and 7.62 cm (3 in.) of vertical distance between them. The specimen contained known areas with delamination and corrosion and a mechanism to create artificial cracks, as shown in
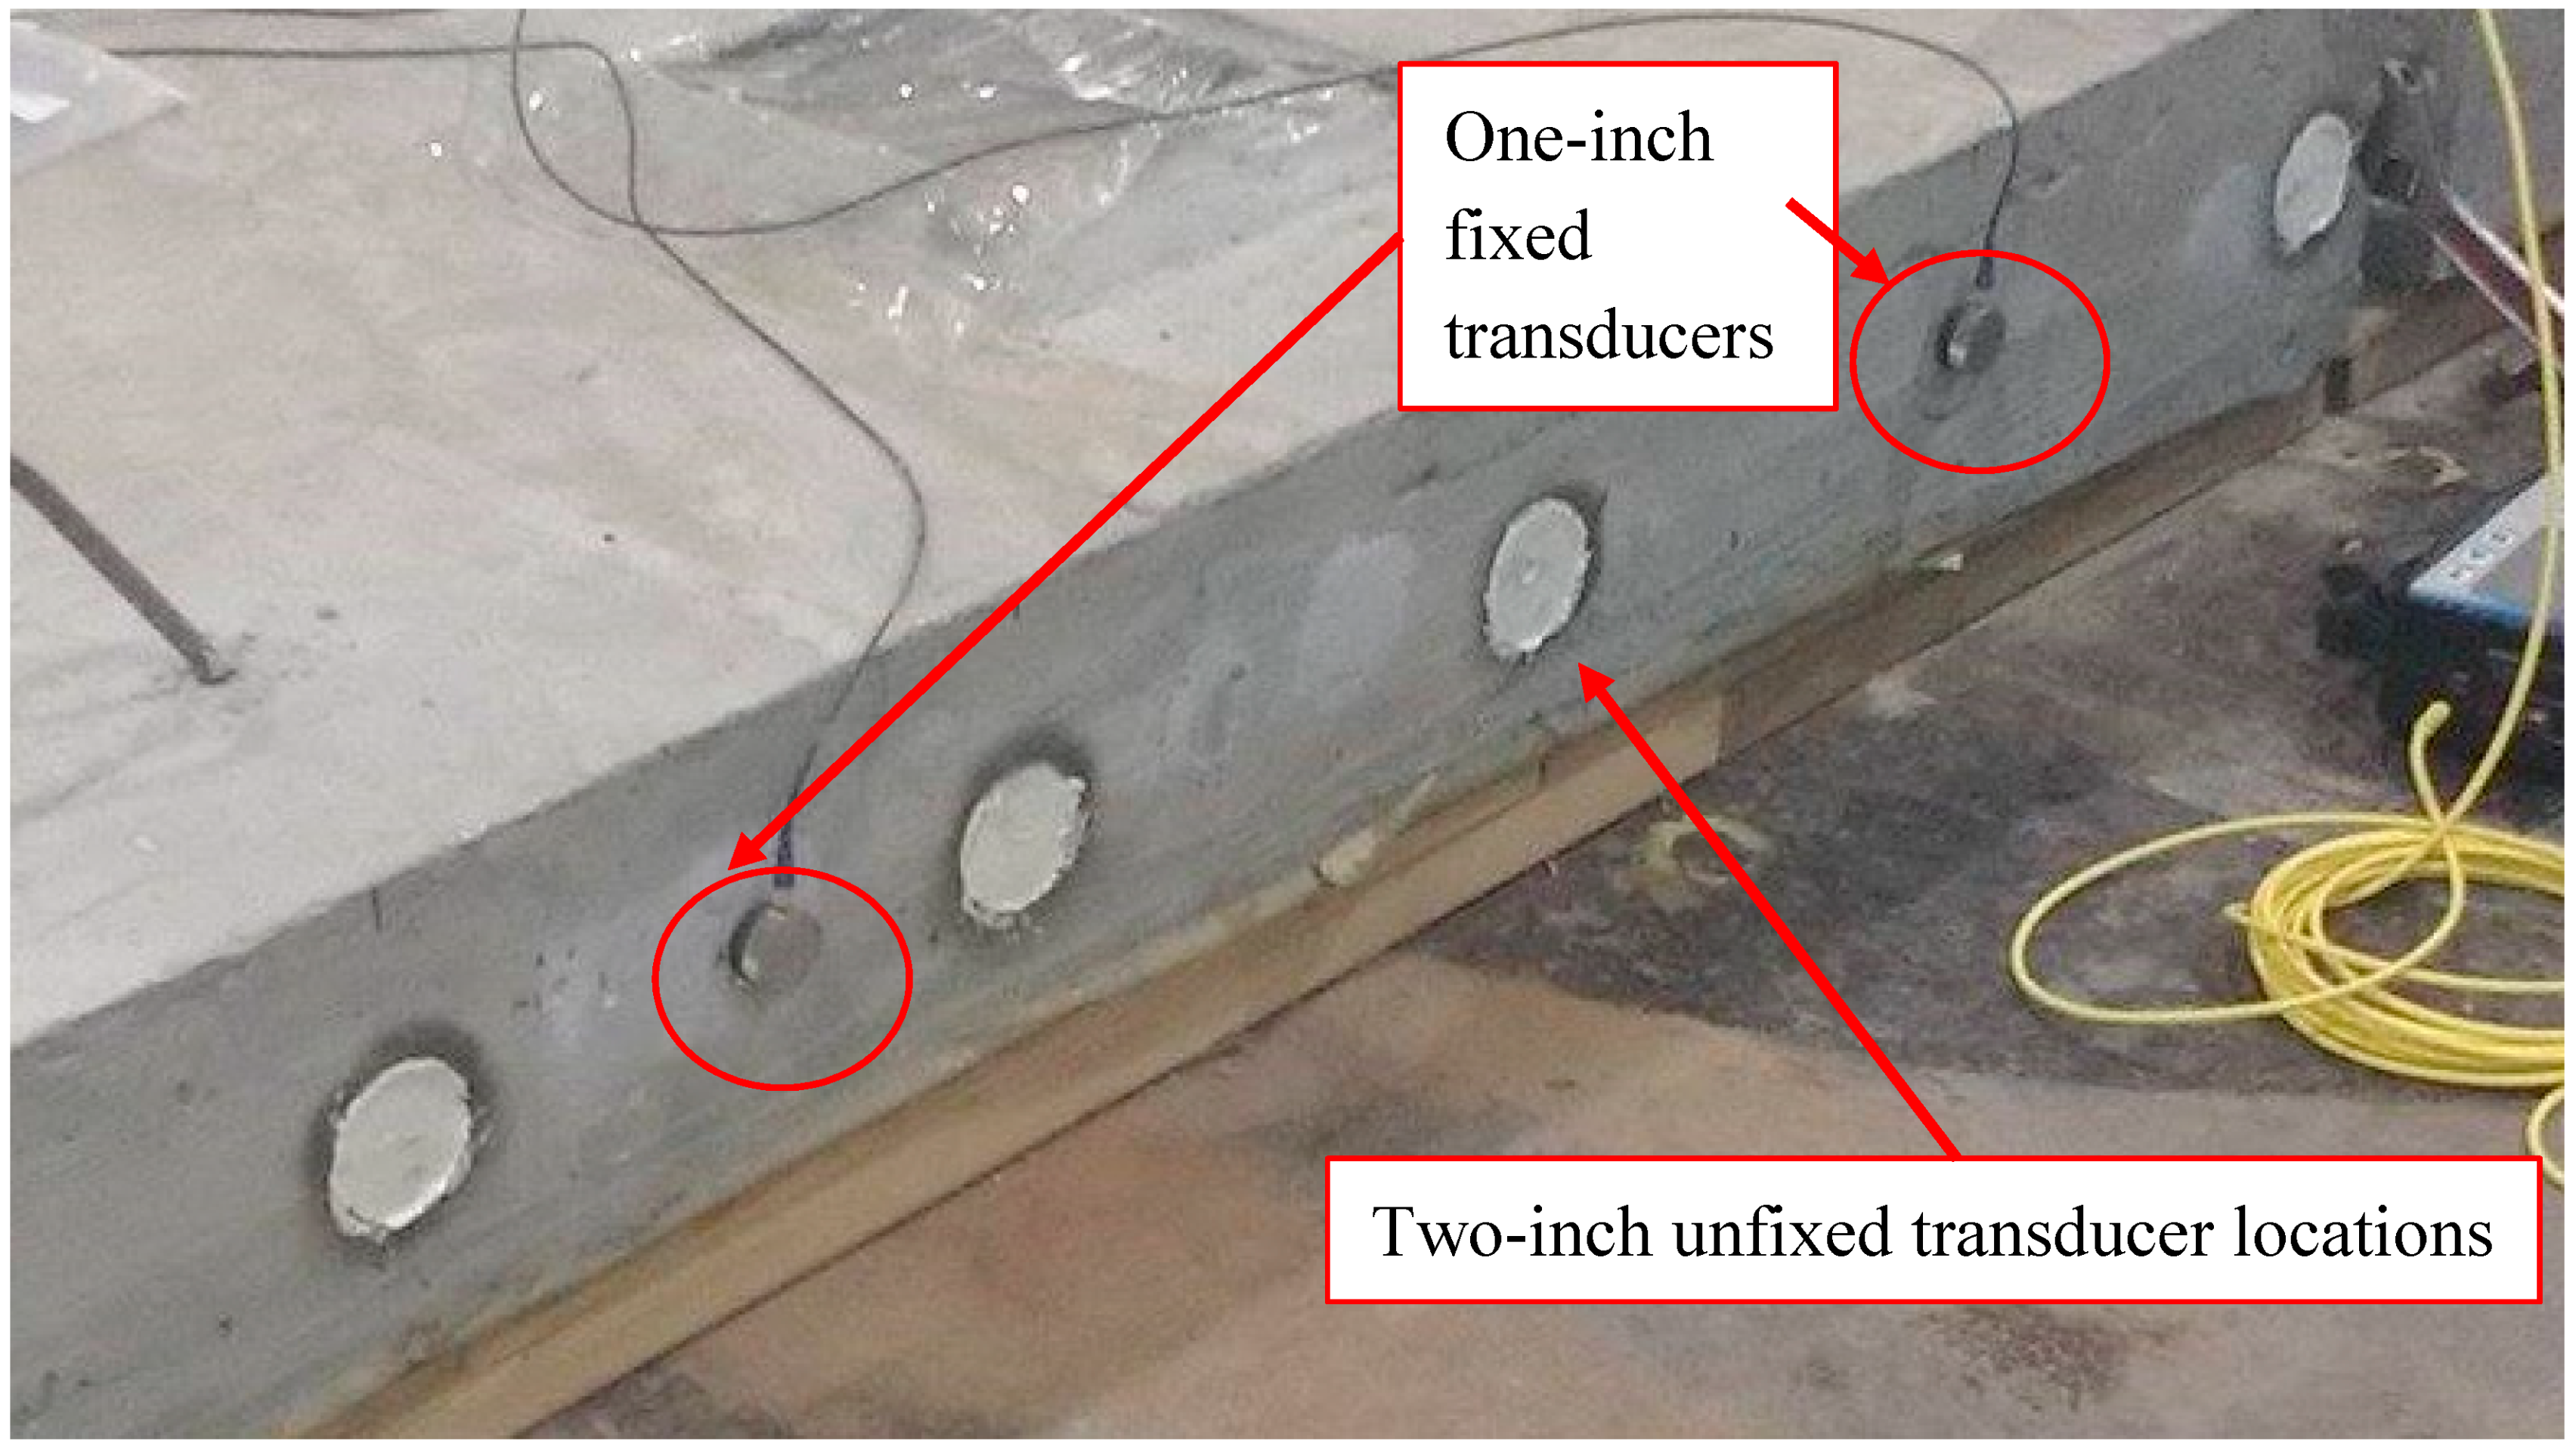
Figure 4. Artificial cracking was intended to simulate cracks perpendicular to the surface that can be caused by a variety of reasons in the field and not as a separation between the rebar and the concrete. An array of sensor locations was marked on the side of the slab as shown in
Figure 5.
2.1.3. Specimen Set 3
In real-life situations, the end of the rebar is not exposed for transmitter placement. As such, the authors explored alternative transmitter-to-rebar attachment options to ensure practical applications of the method in the future. For new bridges or bridges recently repaired, which are the most ideal cases for this method for SHM, the instrumentation should be attached before decking/re-decking. For existing bridges, a core can be drilled to the level of rebar and patched after instrumentation. Either way, the means of affixing the sensor to the rebar need to be considered both for adequate coupling and for durability of the embedded system.
Two sets of experiments were conducted to investigate alternative methods of attaching the transmitter to the rebar such that (a) the ultrasonic wave is guided into the rebar mostly longitudinally, instead of passing the bar perpendicularly and losing most of the energy into the concrete, and (b) the attachment/coupling material can not only be permanently embedded in the deck but can also allow for waves to transmit efficiently.
The two sets of experiments are as follows: First, in order to investigate different sensor-to-rebar attachment materials for improved coupling, laboratory experiments were conducted on a single reinforcing bar (Specimen Set 3a). Second, bars embedded in concrete with one end cut into different angles were studied (Specimen Set 3b).
Specimen Set 3a
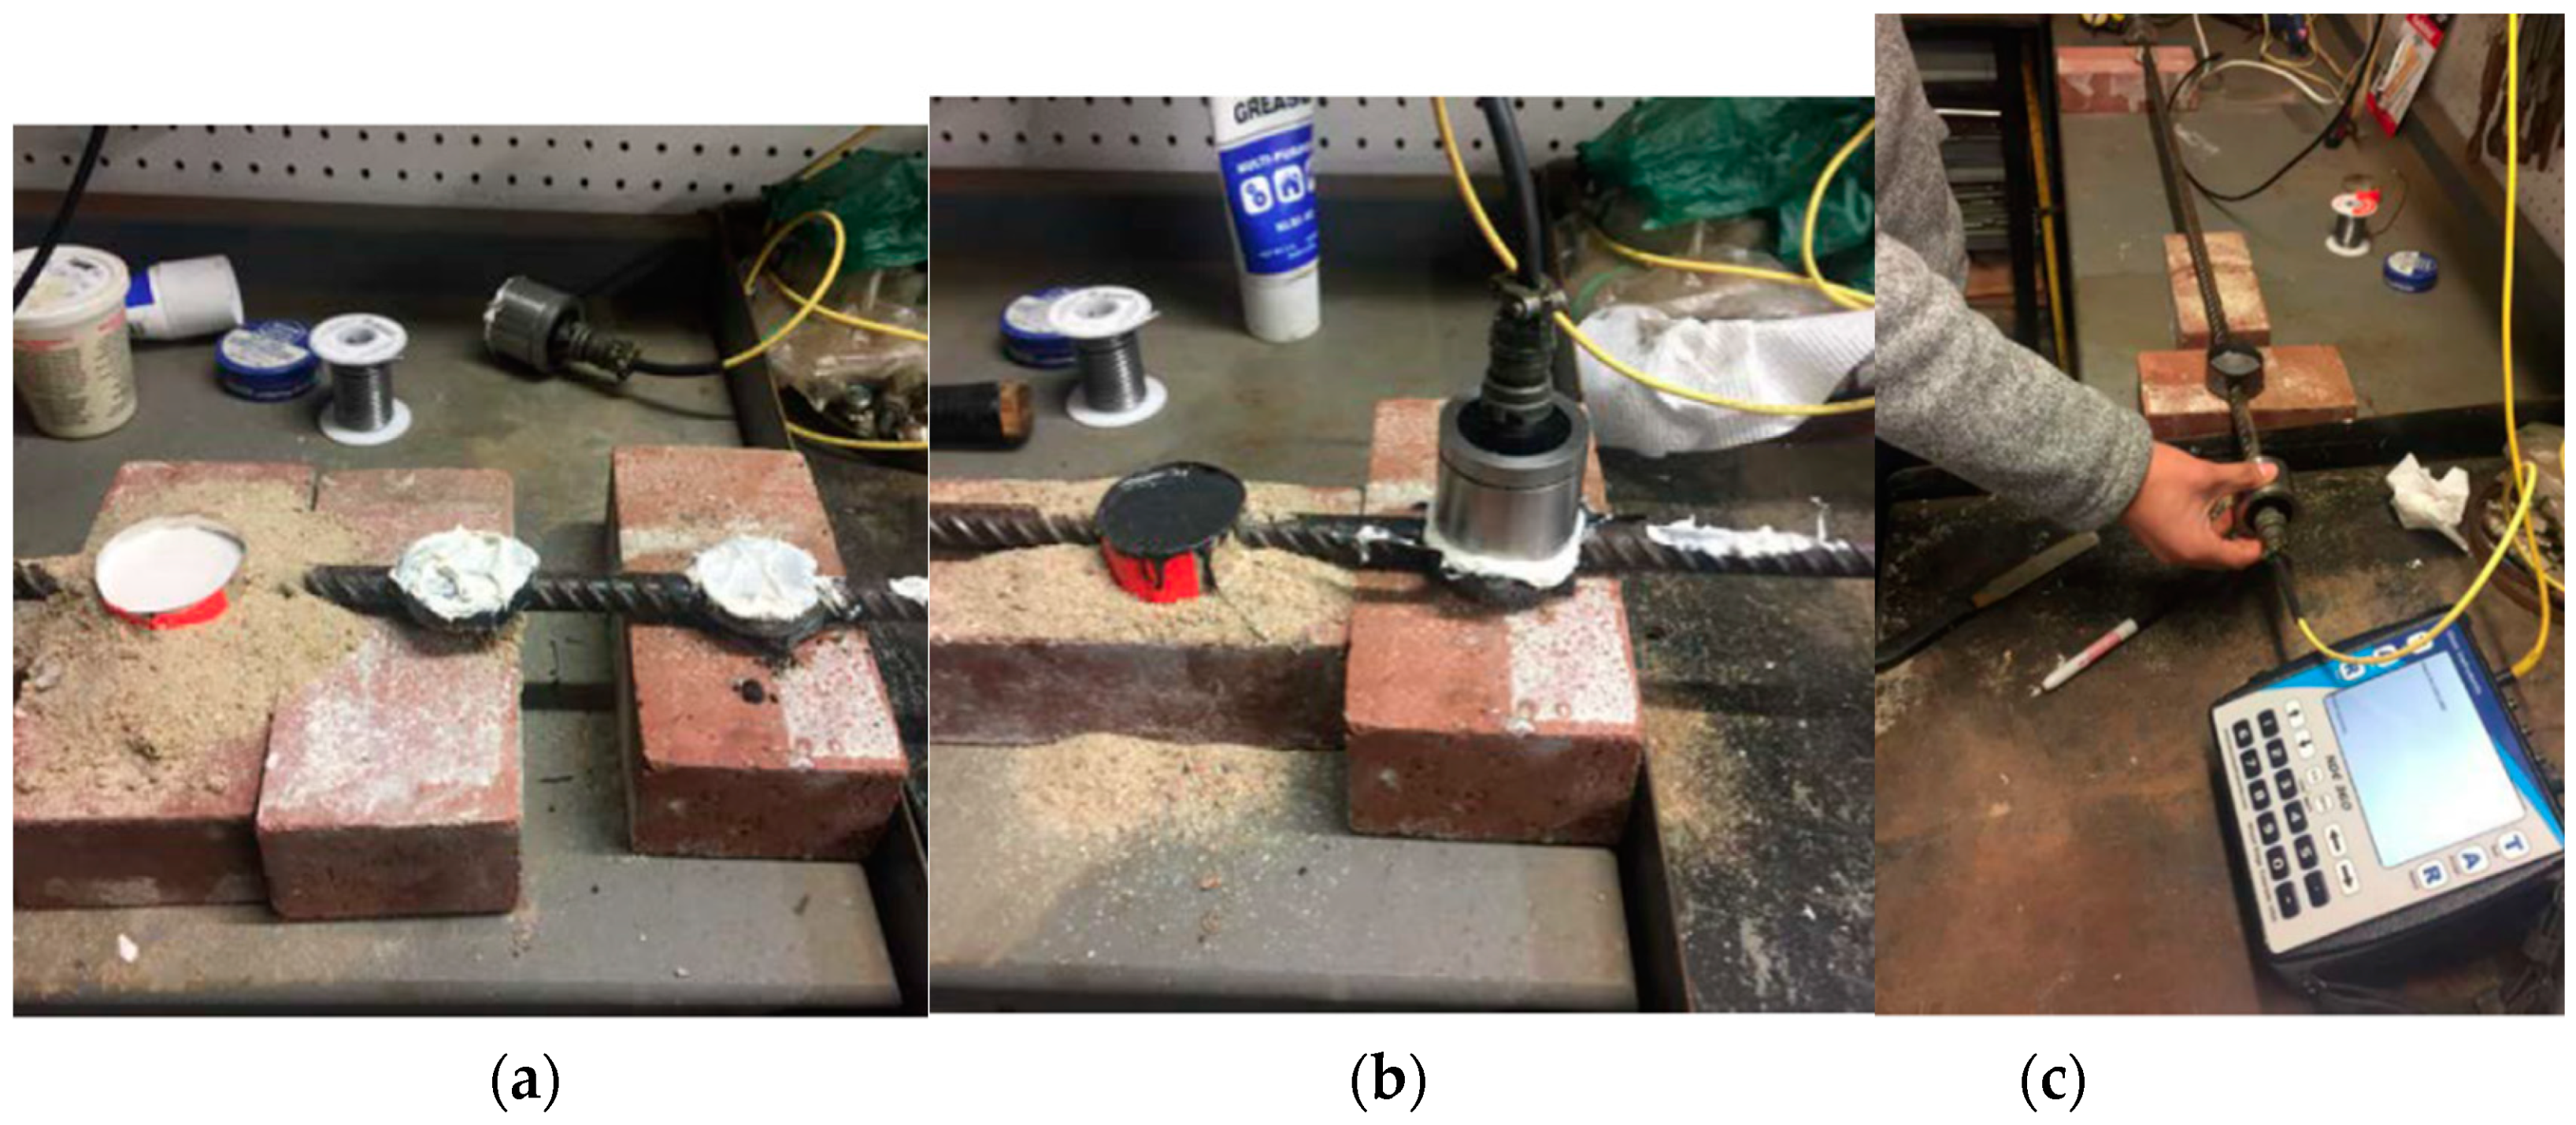
In order to investigate different sensor-to-rebar attachment materials for improved coupling, laboratory experiments were conducted using a 16 mm (Number 5) reinforcing bar. Energy was transmitted into the bar using the following five approaches (
Figure 6):
The transmitter was coupled directly to the end of the rebar;
A 5.1 cm (2 in.) section of the rebar was ground flat, and the sensor was attached onto the rebar using a typical grease couplant;
A lead solder pad was created, where a sheet metal form was placed over the bar; sand was placed around the form as a seal to prevent solder leakage, and lead solder was melted onto the pad with a torch. The pad was filed flat after cooling;
A seat for the transmitter was created using steel-filled JB Weld epoxy, poured into a form around the bar; and
A seat for the transmitter was created using Hydrocal gypsum cement, poured into a form around the bar.
Signals were recorded using an Olson Instruments NDE 360 ultrasonic system. The transducers measured 5 cm (2 in.) in diameter and operated at a center frequency of 50 kHz. The receiving transducer was attached to the bar end using hot-melt glue. The transmitter was coupled using white lithium grease at each transmitter station. For each trial, the recorded waveform energy was measured as the percentage of full scale normalized against the system’s peak voltage input. This approach permitted simple comparisons of waveforms recorded using each coupling approach.
Specimen Set 3b
Specimen Set 3b comprised three reinforced concrete slabs that each measured 91.4 cm × 45.7 cm × 12.7 cm (36 × 18 × 5 in.) as shown in
Figure 7. These slabs were cast with a 13 mm (No. 4) rebar embedded at the center slab cross section.
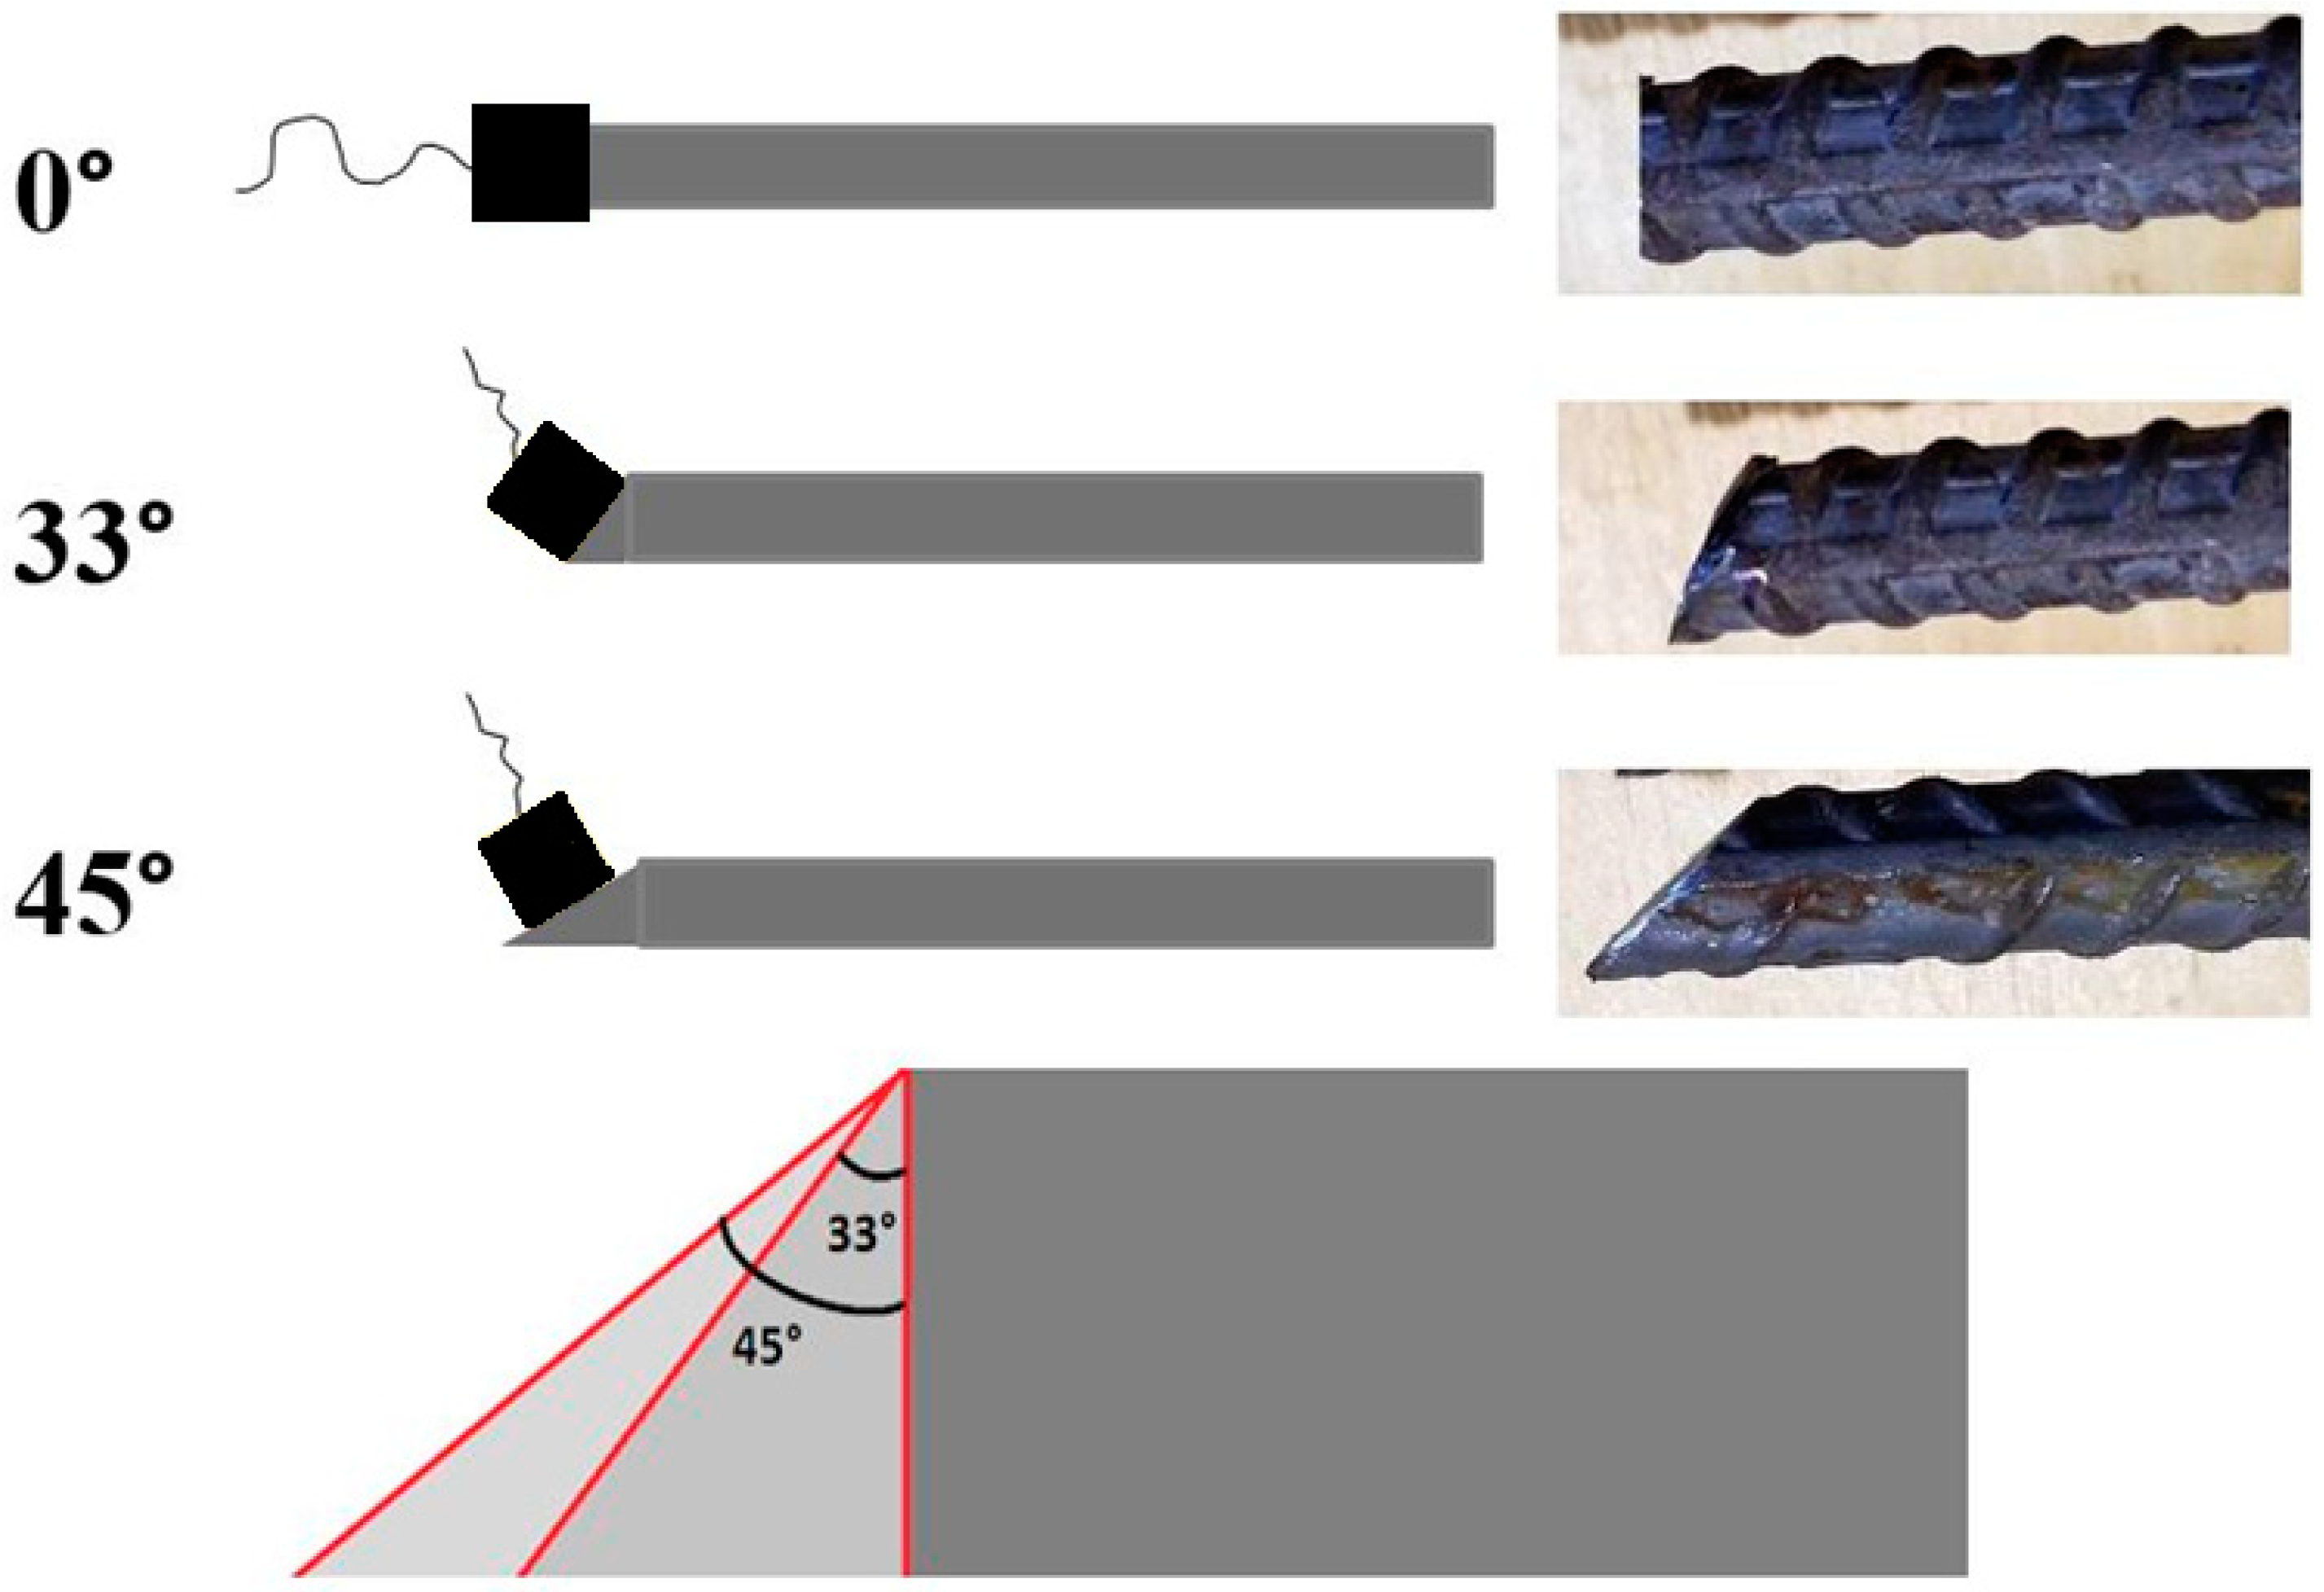
The purpose of this set of specimens was twofold: (1) to investigate via UGWL energy transmission with different bar end angles: 0 degrees, 33 degrees, and 45 degrees, cut with reference to the vertical axis, to simulate different transmitter-to-rebar attachment seat angles from the top of the bar (
Figure 8); and (2) to compare two couplants to improve the coupling of the sensors to the test materials: Ultragel II from Magnaflux and White Lithium Grease from Lucas Oil Products.
2.2. Pilot Field Implementations
Two field trials have taken place to date. The first field trial was conducted early in the project to identify the capabilities and challenges for the proposed method in an existing bridge scenario. The second trial involved embedment of the transmitter inside a new bridge under construction to continuously monitor the deck for any changes in the long term. Images and observations from these trials are presented in the related results section.
3. Results
Results from the laboratory and field experiments are presented in this section in the order that the tasks were explained in the previous section.
3.1. Laboratory Specimen Set 1—Results
Specimen Set 1 (
Figure 2) was cast to determine the proposed method’s capabilities to detect corrosion and delamination occurring simultaneously on the same rebar. Ultrasonic monitoring of this specimen began 28 days after casting and at that time, salt water was placed in the basins. As such, the 0-day reference for corrosion monitoring is essentially the 28th day of curing. Measurements were taken every three days.
Two steel bars were monitored for the onset of corrosion: Rebar 1, where the corrosive condition is in the middle of the bar, and Rebar 2, where the corrosive condition is at the end (
Figure 2).
First, the ultrasonic waves were transmitted from the end of Rebar 1 and the leaked waves were detected from an array of sensors first on the near edge (1 ft. away from Rebar 1 as shown in
Figure 2) and then on the far edge (3 ft. away from Rebar 1 as shown in
Figure 2). The near-end and far-end results are presented in
Figure 9 and
Figure 10, respectively, for zero corrosion (Day 0) and at Day 24.
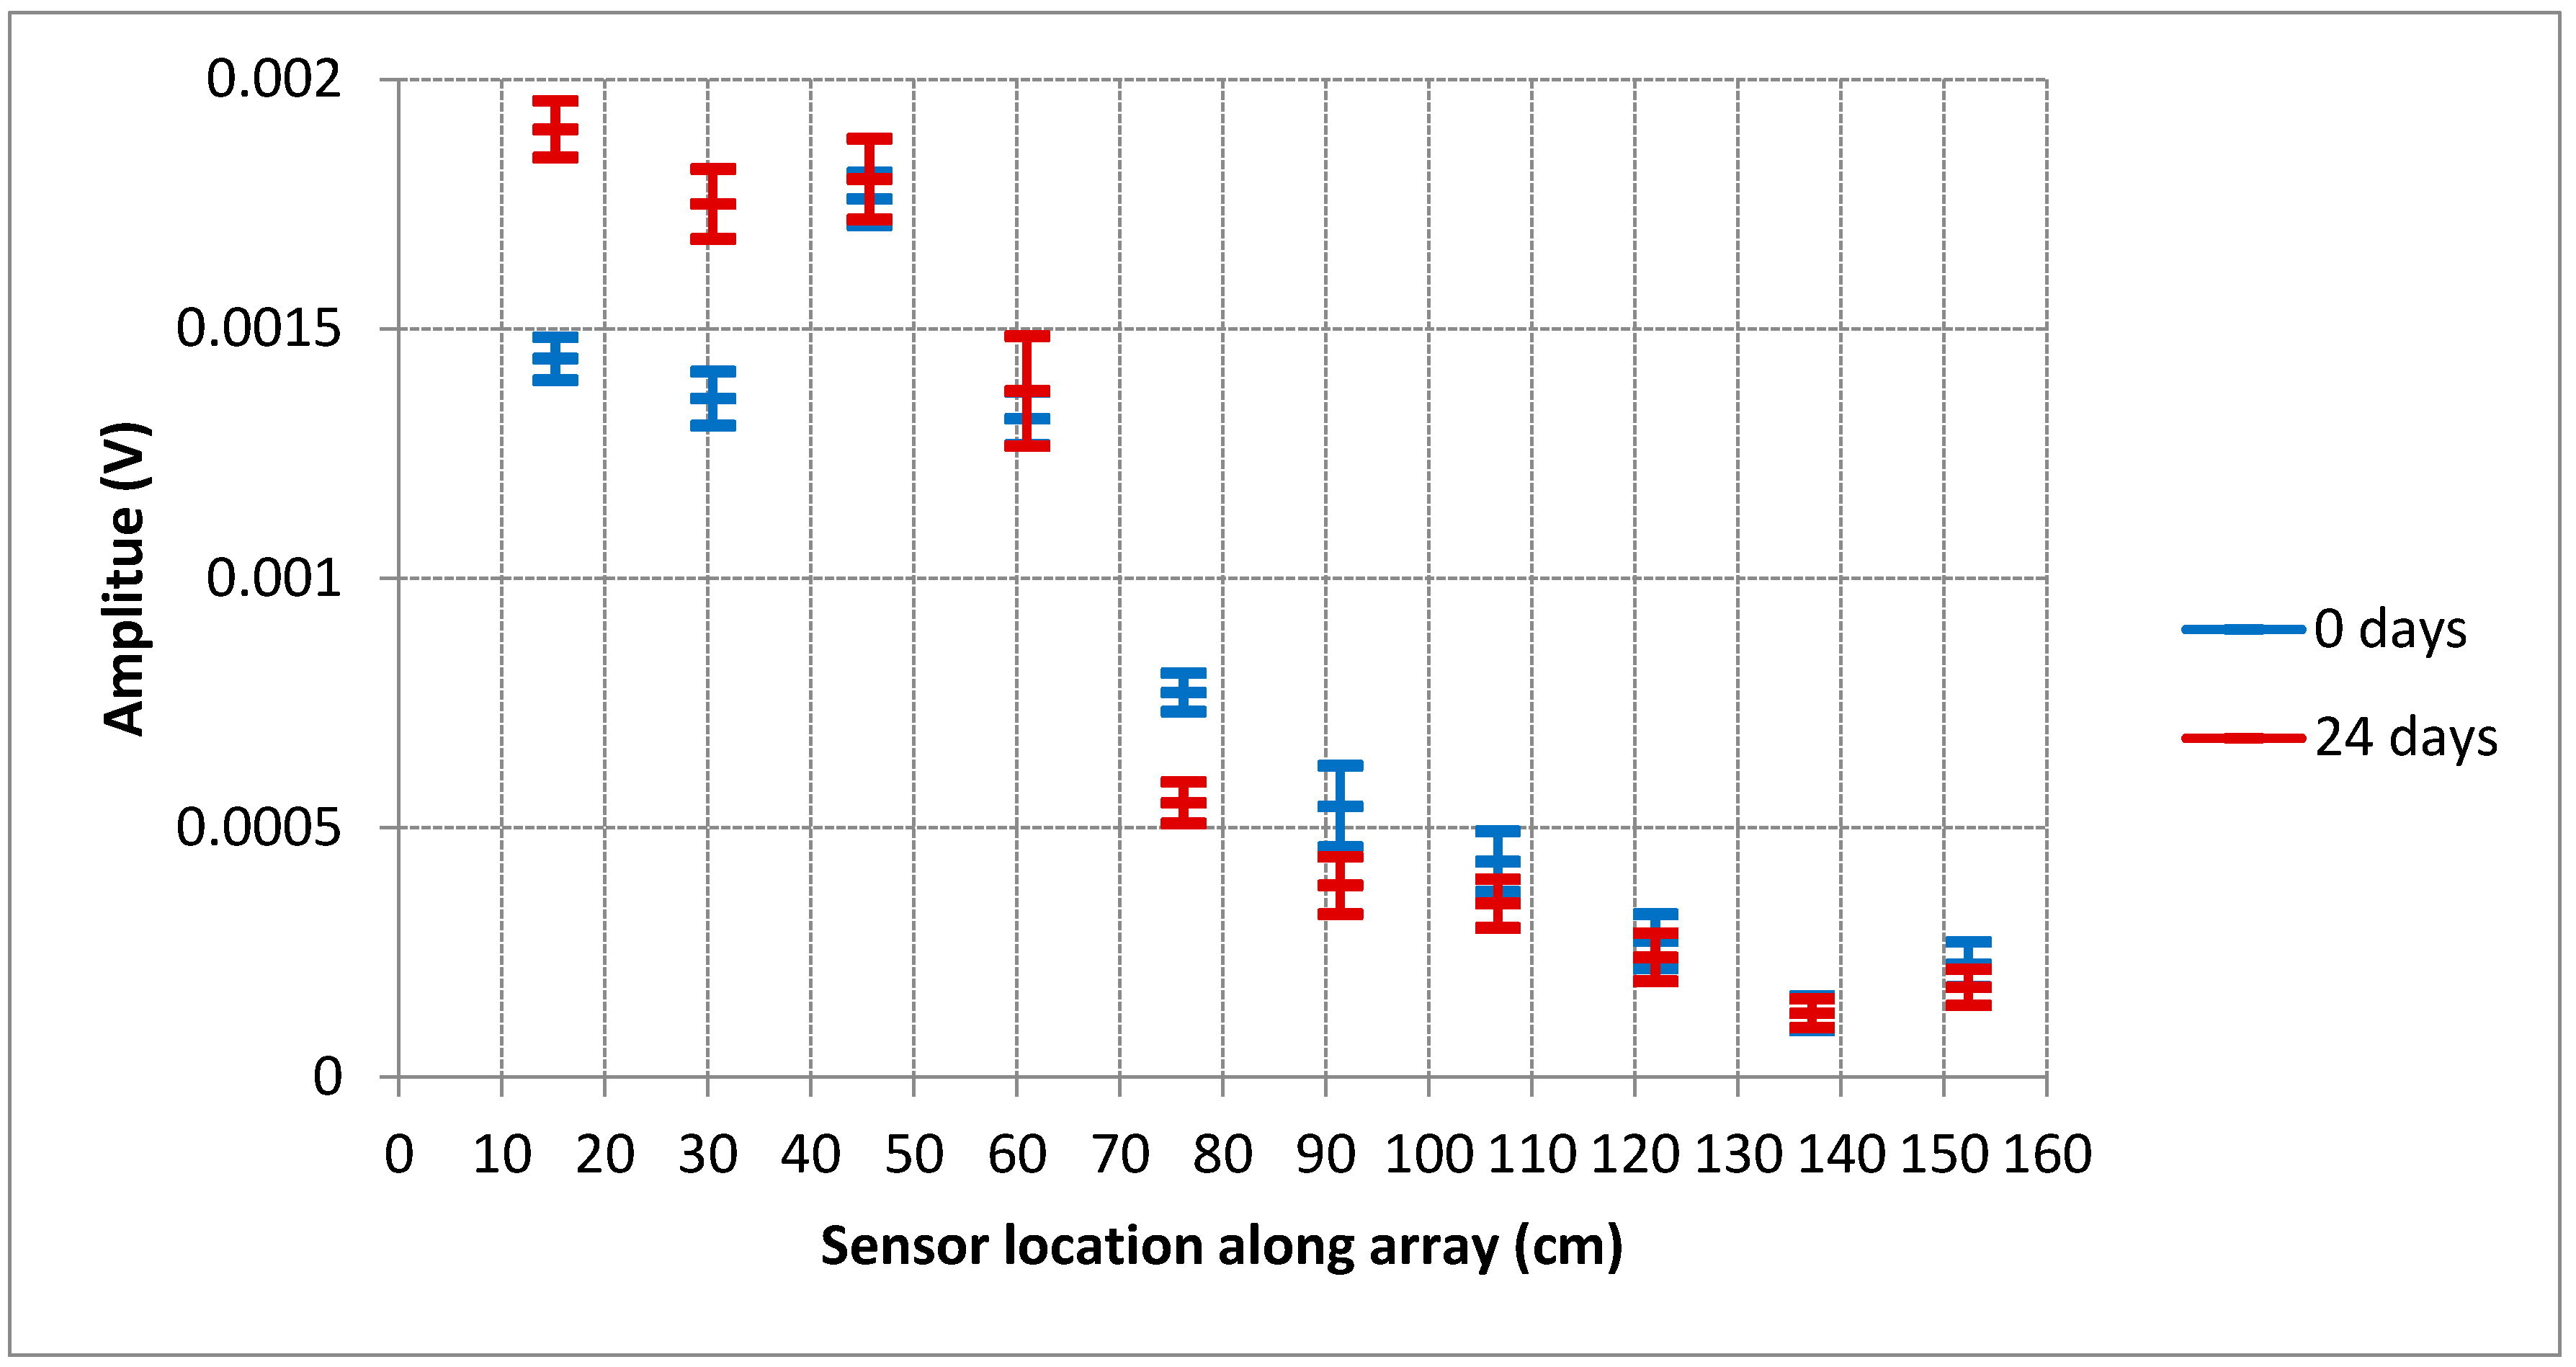
The 24th day results (
Figure 9) from the sensor array located at the near edge (30.48 cm or 1 ft. away from Rebar 1) follow a typical attenuation of signals in an exponential curve, as expected, and show only a slight change in signal amplitudes at roughly the 60 cm (23.6 in.) measurement point. The slightly increased amplitude correlates to the location of the start of the corrosion basin roughly at 46 cm (18 in.). The actual location and the detected location are essentially the same when the leakage angles are considered, which are between 24 and 42 degrees.
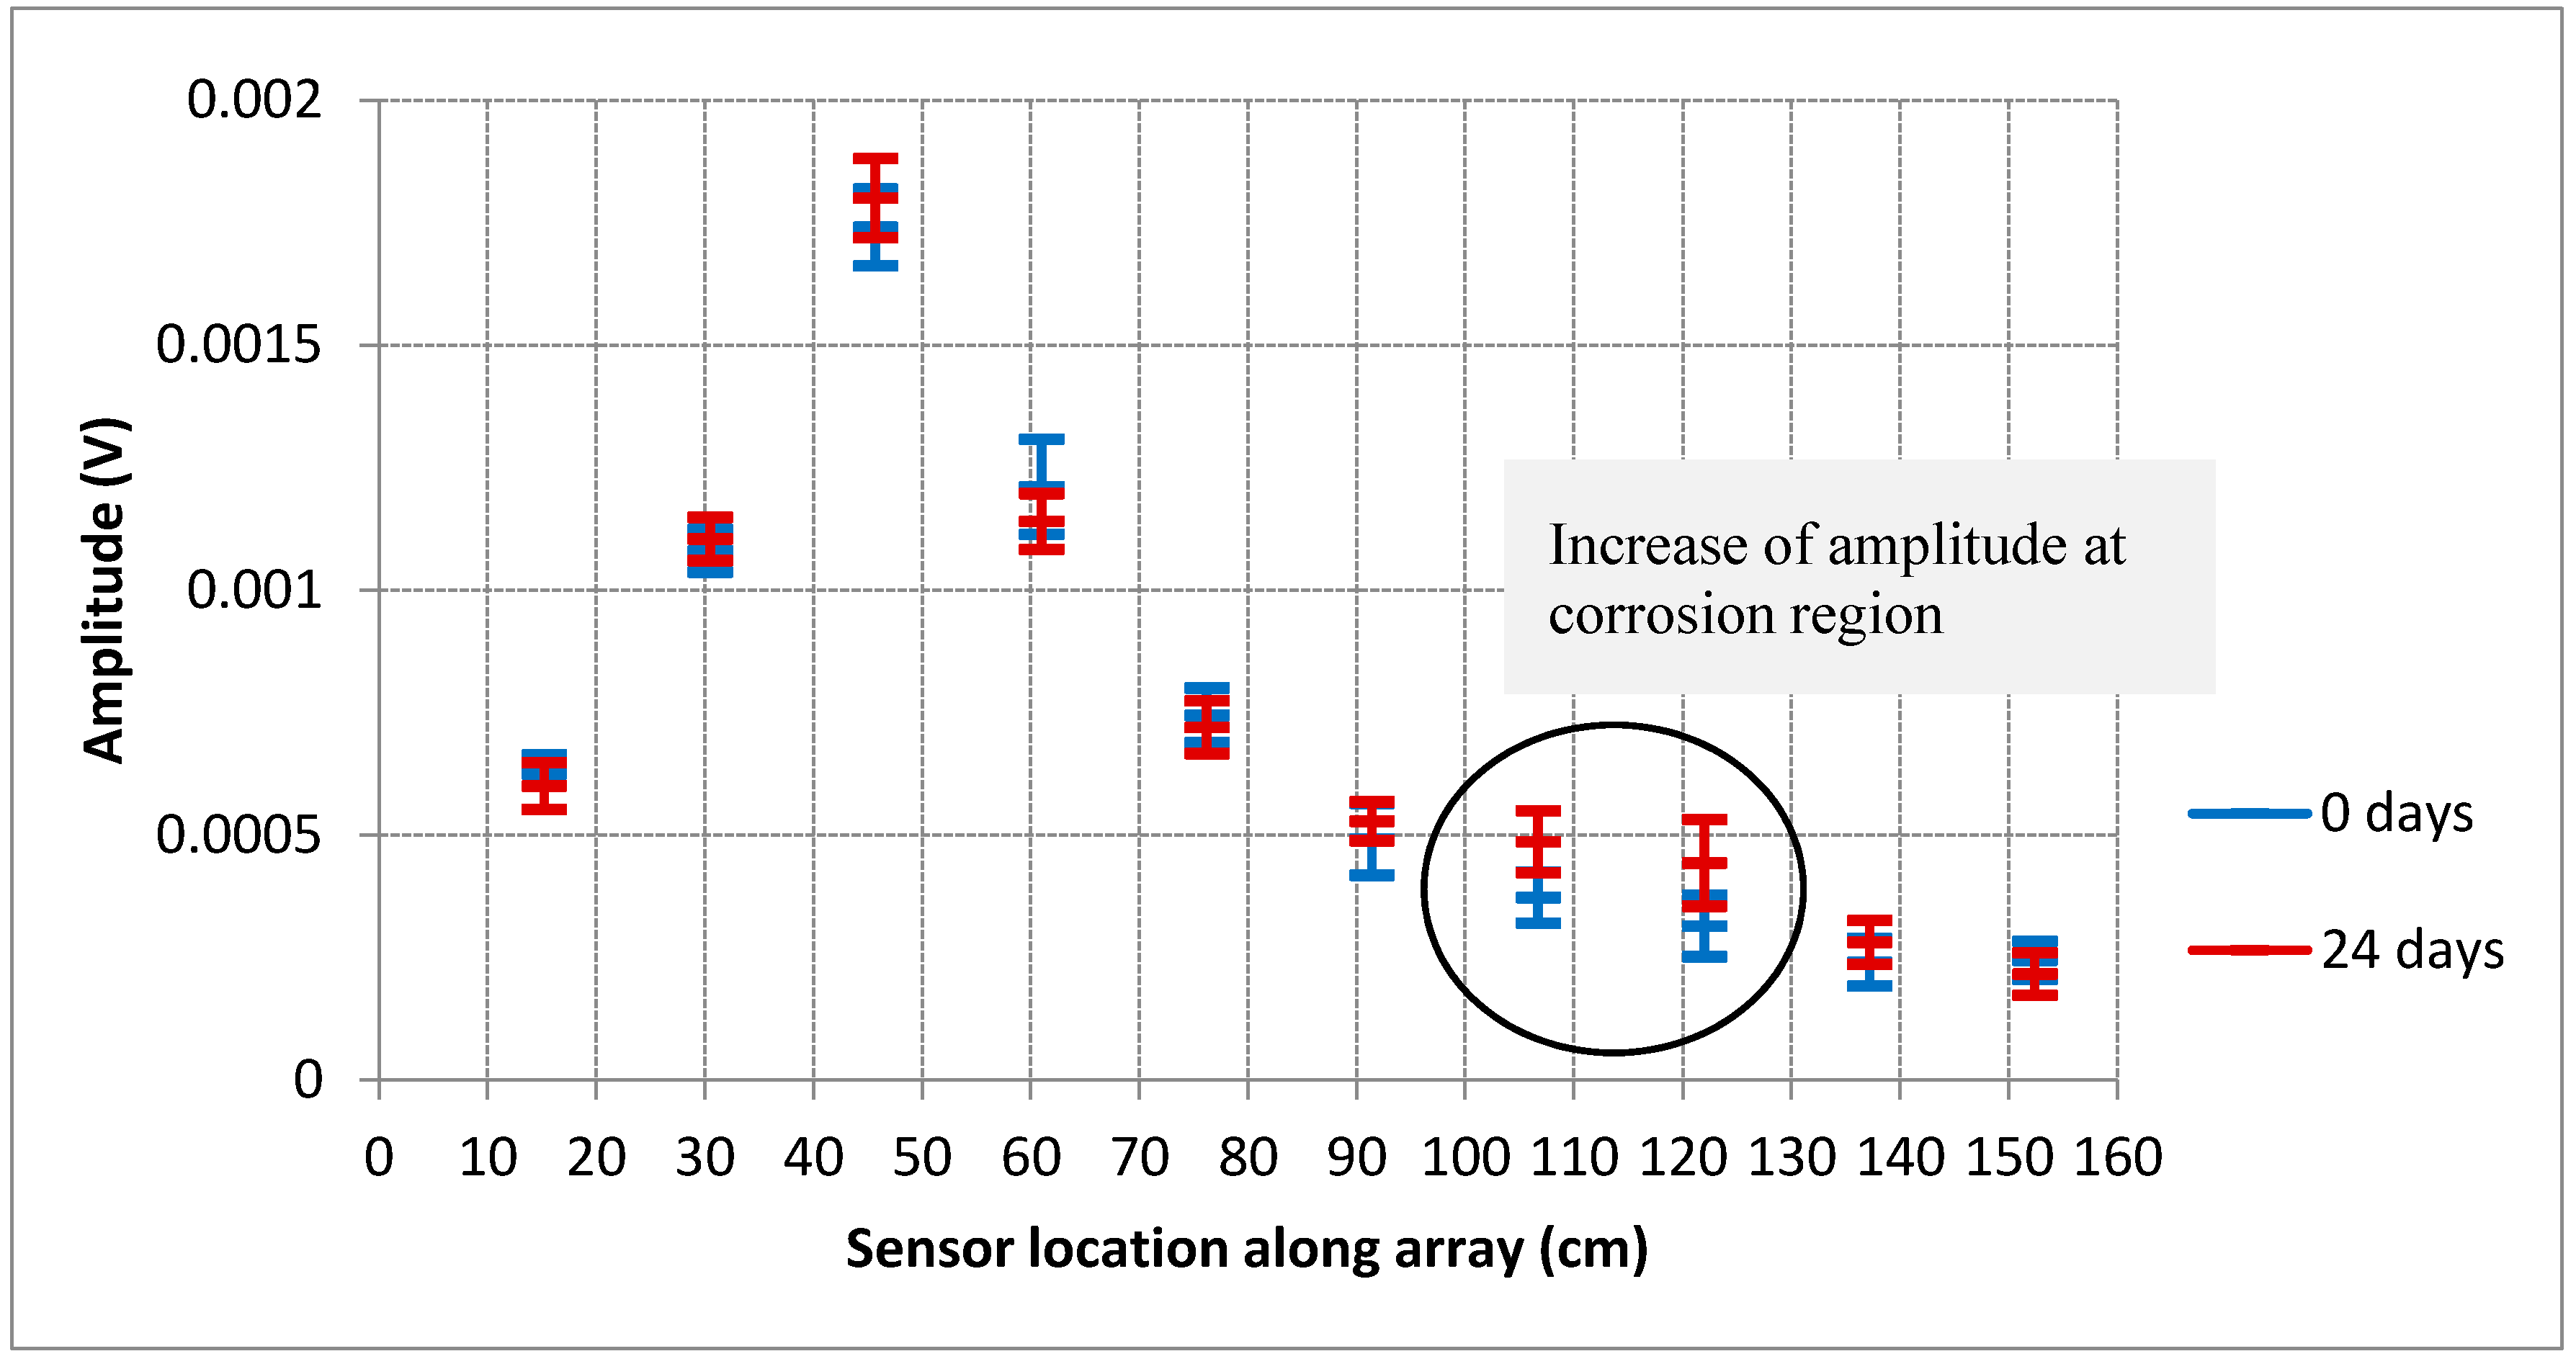
Figure 10 presents the results for the array of sensors placed at the far edge, and while the signals are, in general, only 28% of those obtained from the near end, a more obvious increase of amplitude at 107 cm (42 in.) and 122 cm (48 in.) along the array is observed. These locations also correspond to the corrosive region in the middle, considering the leakage angle, which is explained in the next section.
3.1.1. Consideration of Leakage Angle to Identify Locations of Flaws
Theoretically, the leaked bulk waves will propagate in two forms: longitudinal and shear waves. The leakage angle (or angle of refraction) may be theoretically calculated based on Snell’s law which describes the relationship between angles of incidence and refraction when referring to waves passing through a boundary of two different media. The leakage angles for longitudinal and shear waves are calculated as 42 and 24 degrees, respectively [
7]. This means that in
Figure 10, for an array placed 91.44 cm (3 ft.) away from the bar used as the wave guide, there will be roughly a lag of 40 to 82 cm (16 to 32 inches) for signals associated with any localized flaws along the rebar. Given that the corrosive region is in the middle of the bar, roughly from 46 to 76 cm (18–30 in.) of the 152 cm (60 in.) long specimen, the expected locations of signal change for the leaked wave amplitudes range between 86 cm and 128 cm (34 to 50.4 in.). The most clearly detected increase of signal is at 122 cm (48 in.), which translates to a leakage angle of 26.6 degrees, well within the 24-to-42-degree range previously established. For
Figure 9, where the signals are received at the near end of the concrete and the corrosive region starting around 46 cm (18 in.) from the corrosive region, the detected increase at 60 cm (23.6 in.) corresponds roughly to a leakage angle of 24 degrees.
Then the transmitter was placed on Rebar 2, which has a corrosion region at the start, roughly between 5 and 35.5 cm (2–14 in.) from the transmitter end (
Figure 2). Considering a leakage angle of 24 degrees, this corresponds to a corrosive region detection range as far as 63 cm (24.7 in.). As can be seen in
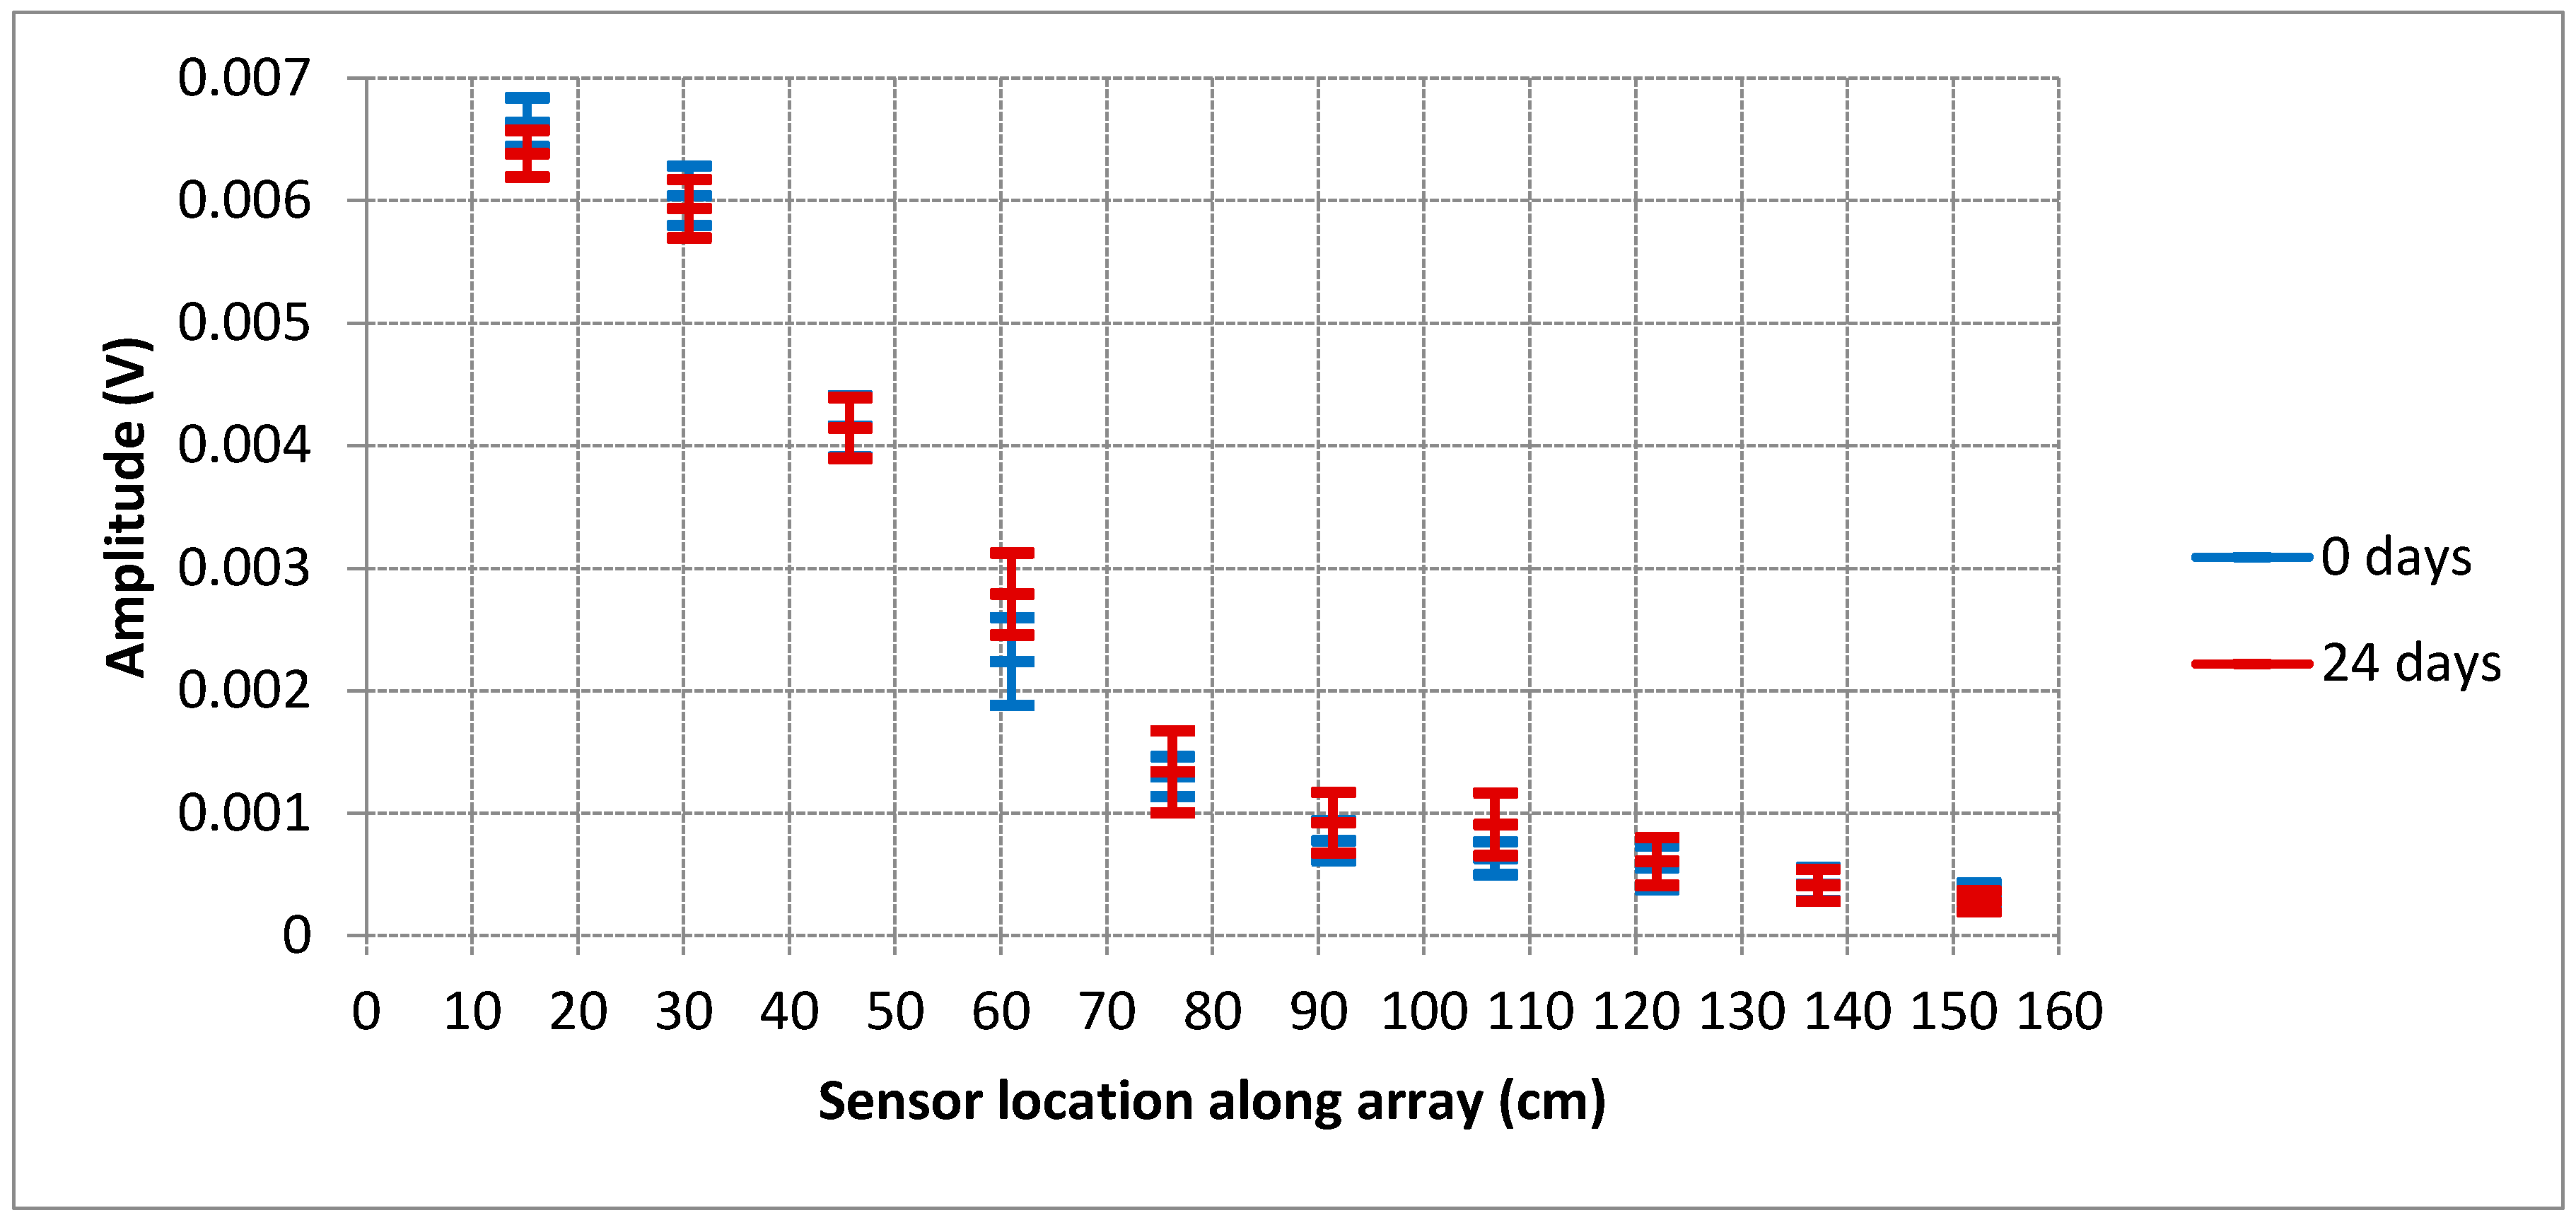
Figure 11, the leaked wave amplitudes are considerably higher for the first four measurement points (until 61 cm from the end) for 24th day measurements compared to previous (0-day) readings, and they show a decrease from 76 cm onwards. The increase in amplitudes in the corrosion region is attributed to the improved bond between concrete and steel. It should also be noted that the velocity of ultrasonic waves through saturated concrete is greater than their velocity through dry concrete. Consequently, the attenuation can be less than the attenuation within dry concrete, keeping the readings from the concrete surface high. This can explain the fluctuations in the 0-day data in
Figure 11. The decrease in amplitude of the guided wave after the corrosive region is also expected, as a significant portion of the guided wave already refracted into the surrounding concrete through the corrosion region.
This observation, namely, decreased amplitudes of energy transmitted through the wave guide in a steel member subject to corrosion, agrees with what has been found in previous studies, such as the work done by Miller [
8].
3.1.2. Simultaneous Monitoring of Corrosion and Delamination
The specimen shown in
Figure 2 was also used to monitor the progression of corrosion and delamination simultaneously. Rebar 3 was exposed to corrosive conditions at one end while simultaneously being slowly delaminated on the other end of the rebar, over the same time period of 24 days. The guided waves were generated along the rebar from both ends.
Figure 12 and
Figure 13 show the amplitudes of the array of sensors that was located 30.5 cm (1 ft.) away from the embedded reinforcing bar, with the guided waves transmitted along the rebar from the end with corrosive condition and from the end with applied delamination, respectively.
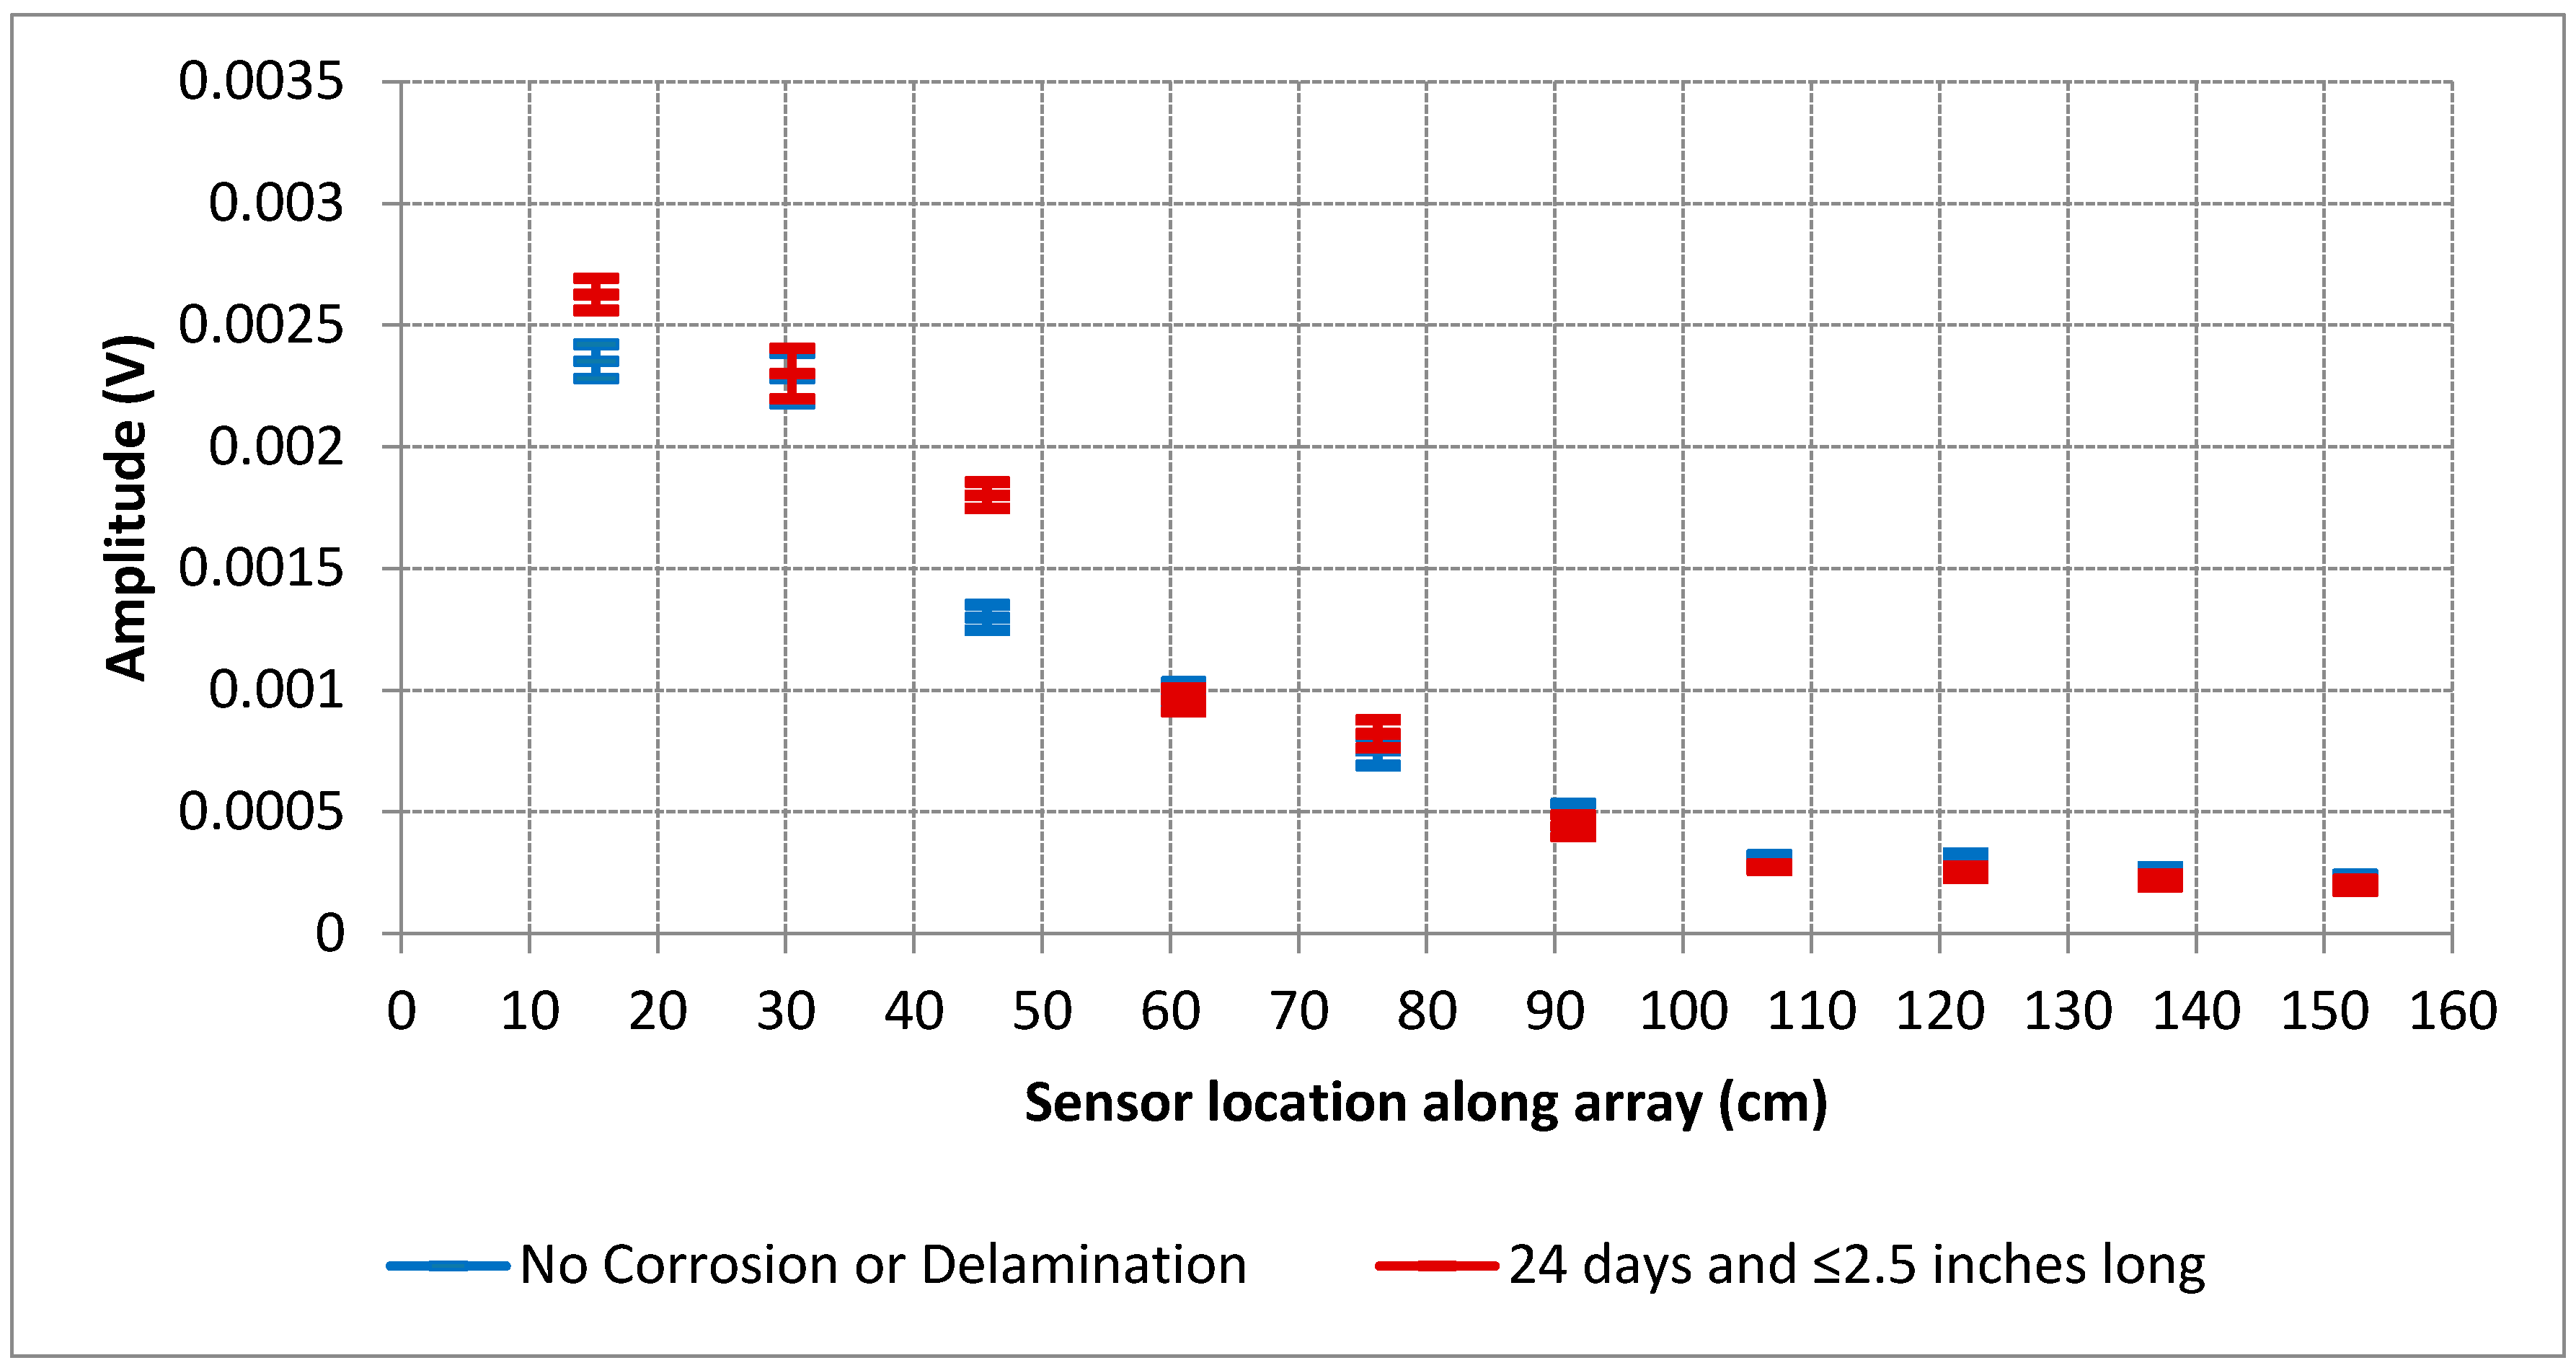
In
Figure 12, an increase in the amplitudes can be observed through the corrosive region, and the amplitudes decrease beyond that. The delamination at the steel–concrete interface was 2.5 inches long at the 24-day measurements, and it can be seen in
Figure 12 that it is difficult to discern the effect of the delamination
after the corrosion-related decrease in amplitudes.
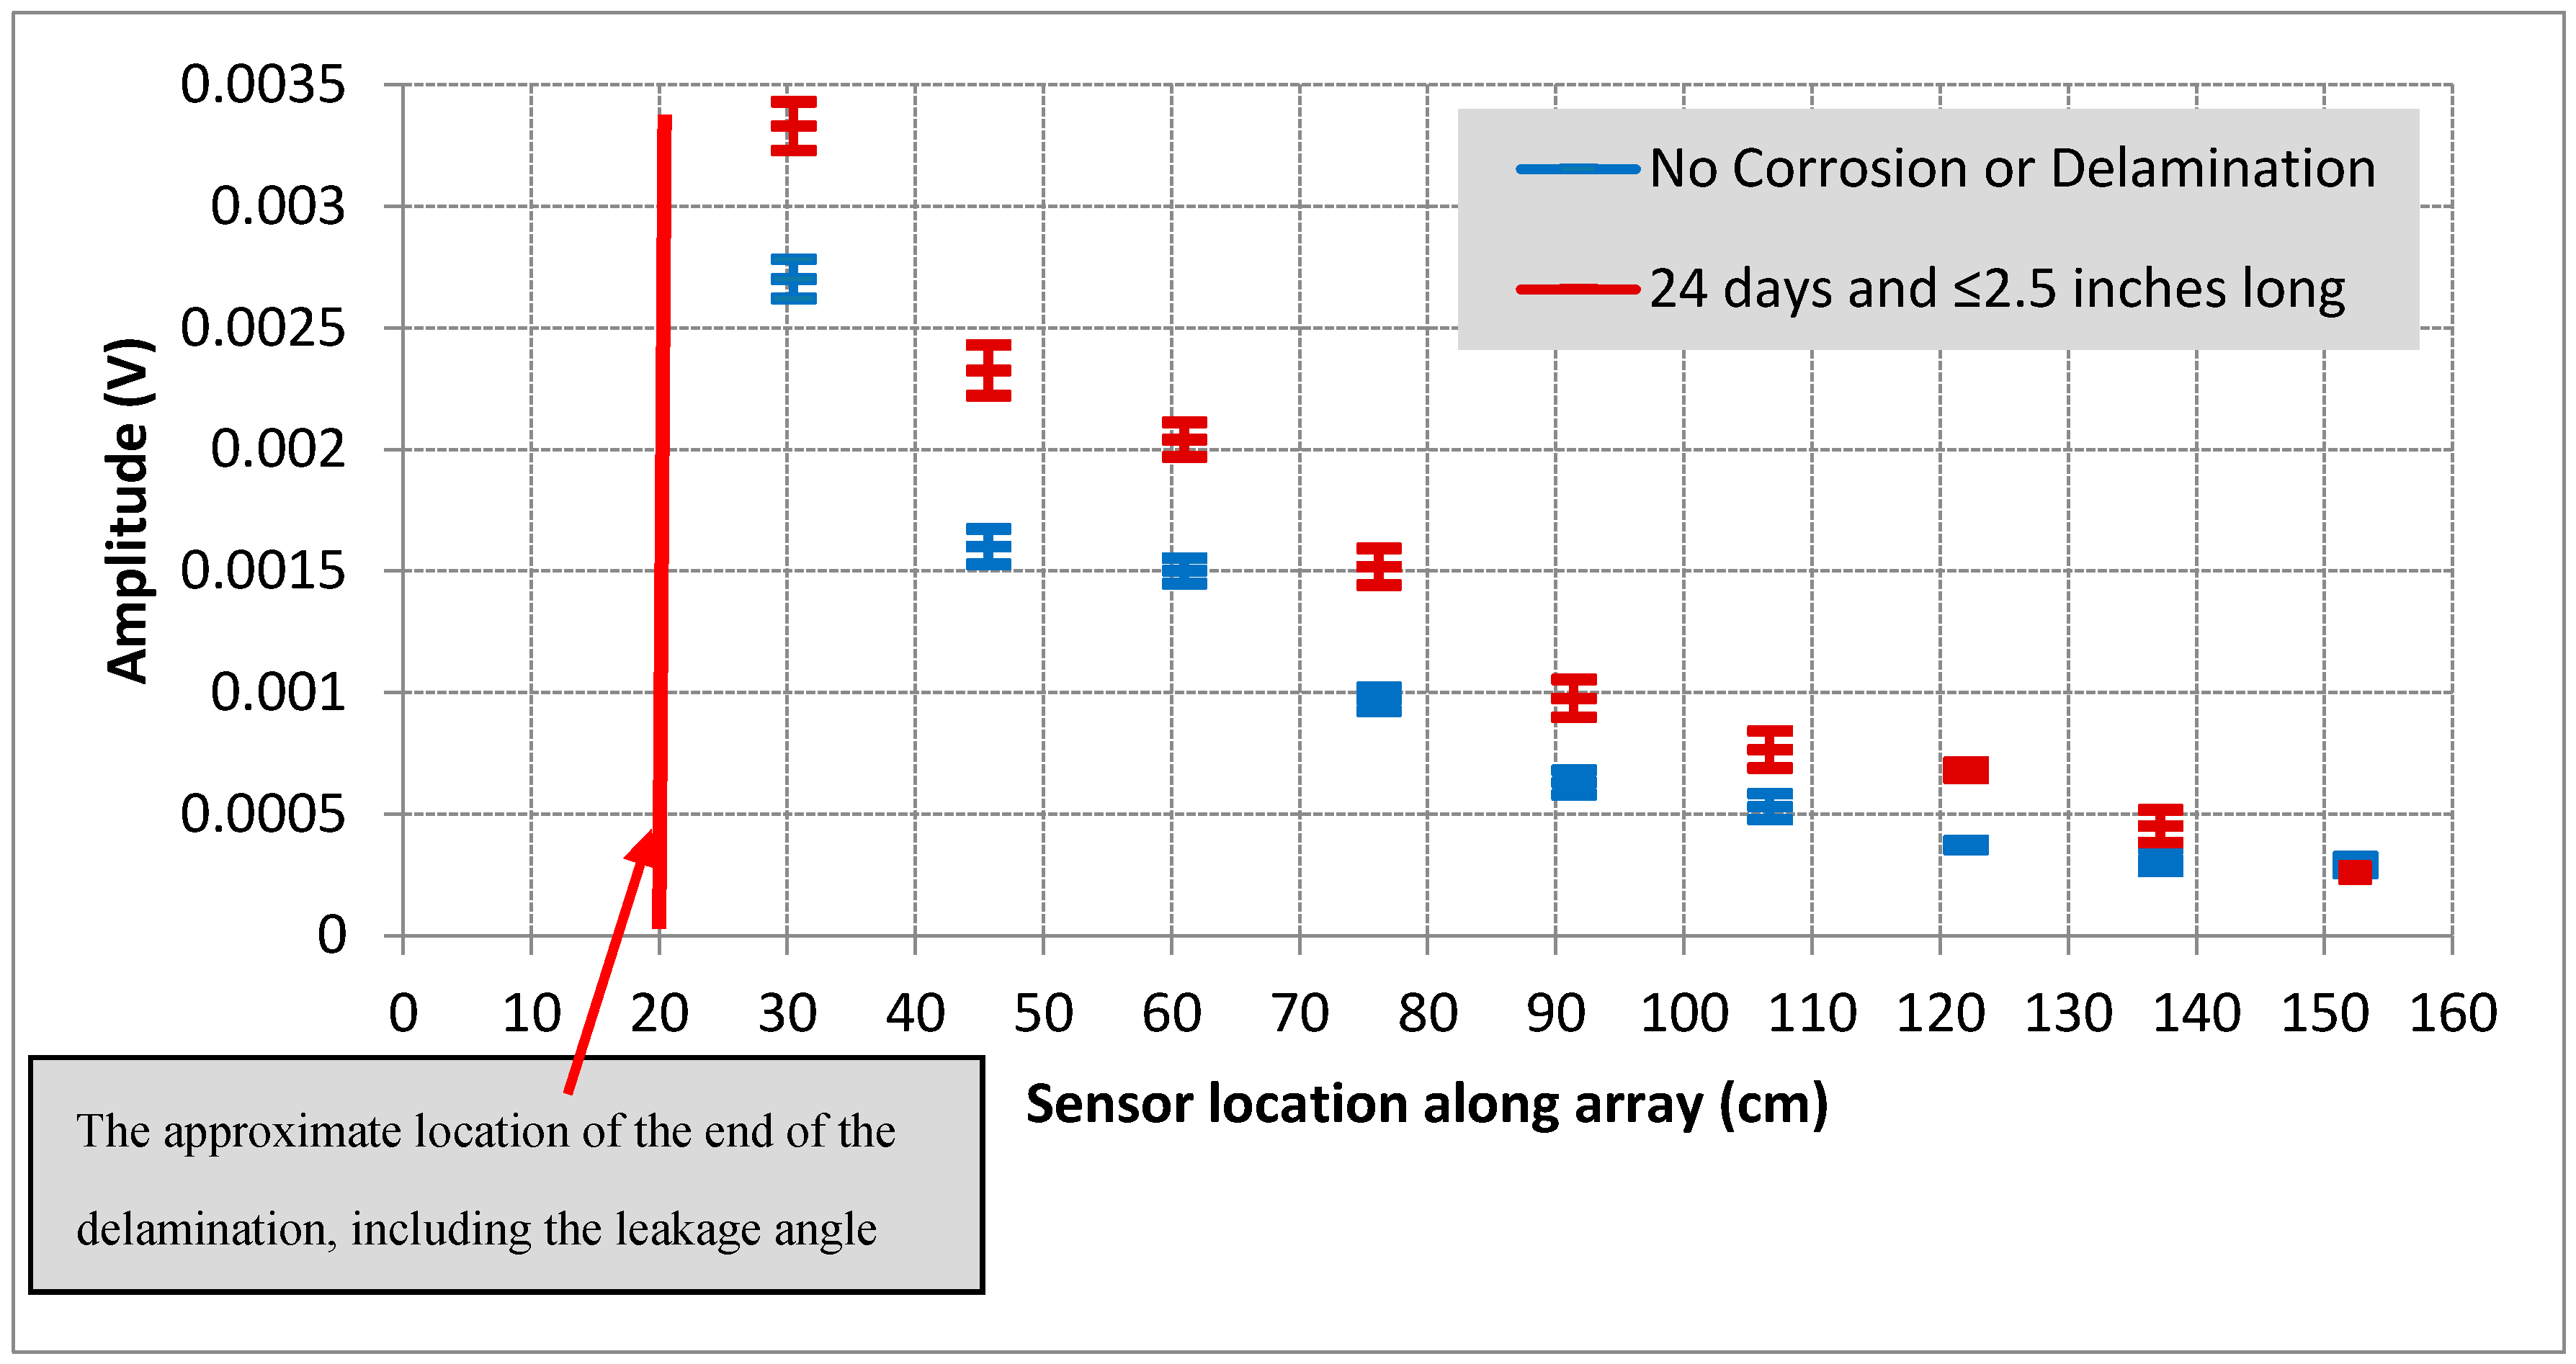
On the other hand, when the guided wave originated at the delamination end, the development of delamination caused significant increases in the leaked waves’ amplitude monitored by any sensor located beyond the 6.35 cm (2.5 in.) long delamination, which corresponds to 20–34 cm (7.8–13.3 in.) considering the leakage angles of 24 to 42 degrees (
Figure 13). This is because the energy stays in the wave guide when the connection with concrete is lost, producing no leakage. Once the location of the delamination is passed, there is more energy to leak into the surrounding concrete, increasing the amplitude of the readings. Also, the measurement points start at 30 cm from this end, due to the mechanism placed to create the delamination (
Figure 2). Given that there were also corrosive conditions applied to the steel bar on the other end, the results shown in
Figure 13 illustrate that at the start of the corrosive region, at 122 cm (48 inches) along the array, the amplitude appeared to increase more than at the other sensors. More notably, after the initial apparent increase, the amplitudes of the sensors beyond that saw decreases relative to the rest of the array, since the guided wave had already attenuated significantly by the time it reached the corrosive region. The variation in percent change in amplitude along the array is as follows: the percent increase in amplitude monitored by the sensor located at the start of the corrosive region spiked to 82%, while the rest of the sensors somewhat consistently increased around 40 to 60%.
3.2. Laboratory Specimen Set 2—Results
The primary purpose of this longer (3 m or 10 ft.) specimen was to test at increased distances between the transmitter and receivers (
Figure 3). Previous work investigated the propagation of the guided waves and the measured data (the leaked energy) over a maximum distance of 1.5 m (5 ft.), and the length of this specimen doubles that distance. A secondary purpose of the specimen set was to examine the influence of multiple layers and direction of reinforcement on the UGWL method. Finally, the specimen was used to evaluate whether the proposed method can detect a variety of flaws (corrosion, delamination, and cracks) in the same specimen.
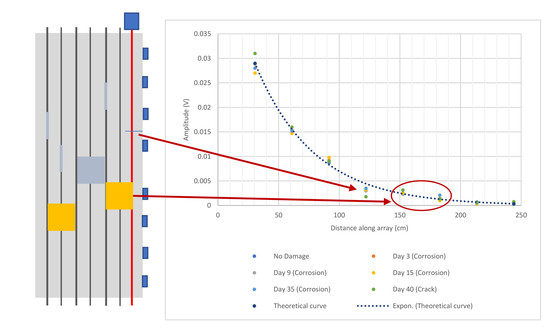
Illustrations of Specimen 2 (photos in
Figure 3 through
Figure 5) are shown on the left side of
Figure 14 and
Figure 15. In these drawings, the dark grey represents delamination and the yellow represents corroded areas. The reinforcing bar colored red in each figure indicates the reinforcing bar tested, and the blue boxes denote the transducer locations for the respective amplitude versus distance plots. The data points plotted in
Figure 14 and
Figure 15 are averages of five readings.
In
Figure 14 and
Figure 15, a theoretical curve is included. This curve was established using Equation (1). When guided wave attenuation is considered, the attenuation coefficient (α) describes the weakening of the signal due to scattering and absorption, and can also be considered as the decay of power or intensity of a sound wave [
8]. This is defined by Equation (1):
where
Ai and
A0 are the decreased and initial amplitudes, respectively, and
z −
z0 is the distance the wave travels through the material.
In this study, when determining the attenuation coefficient of the guided wave,
z −
z0 is the distance that the ultrasound travels in the embedded steel bar (i.e., the distance between the transmitter and receiver located at the ends of the embedded bar). When determining the attenuation of the leaked waves,
z −
z0 is the distance between the points along the array in the
z-direction or the distance between arrays in the leakage angle direction. The attenuation coefficient can be determined by Equation (2) and typically uses the unit Np/m, which can be converted to dB/m using Equation (3).
Figure 14 shows the results of the array of 1 inch transducers and displays the expected result of the increase in amplitude readings that occurs after (i.e., at the second sensor point) due to the artificially inserted delamination, in the form of a laminate wrapped around the rebar. As can be seen, given such a permanent interruption between the wave guide and the surrounding material, consistently higher amplitudes of leaked waves are detected in the sensor after the rebar. This is attributed to the fact that in the delamination region, more of the energy remains in the wave guide.
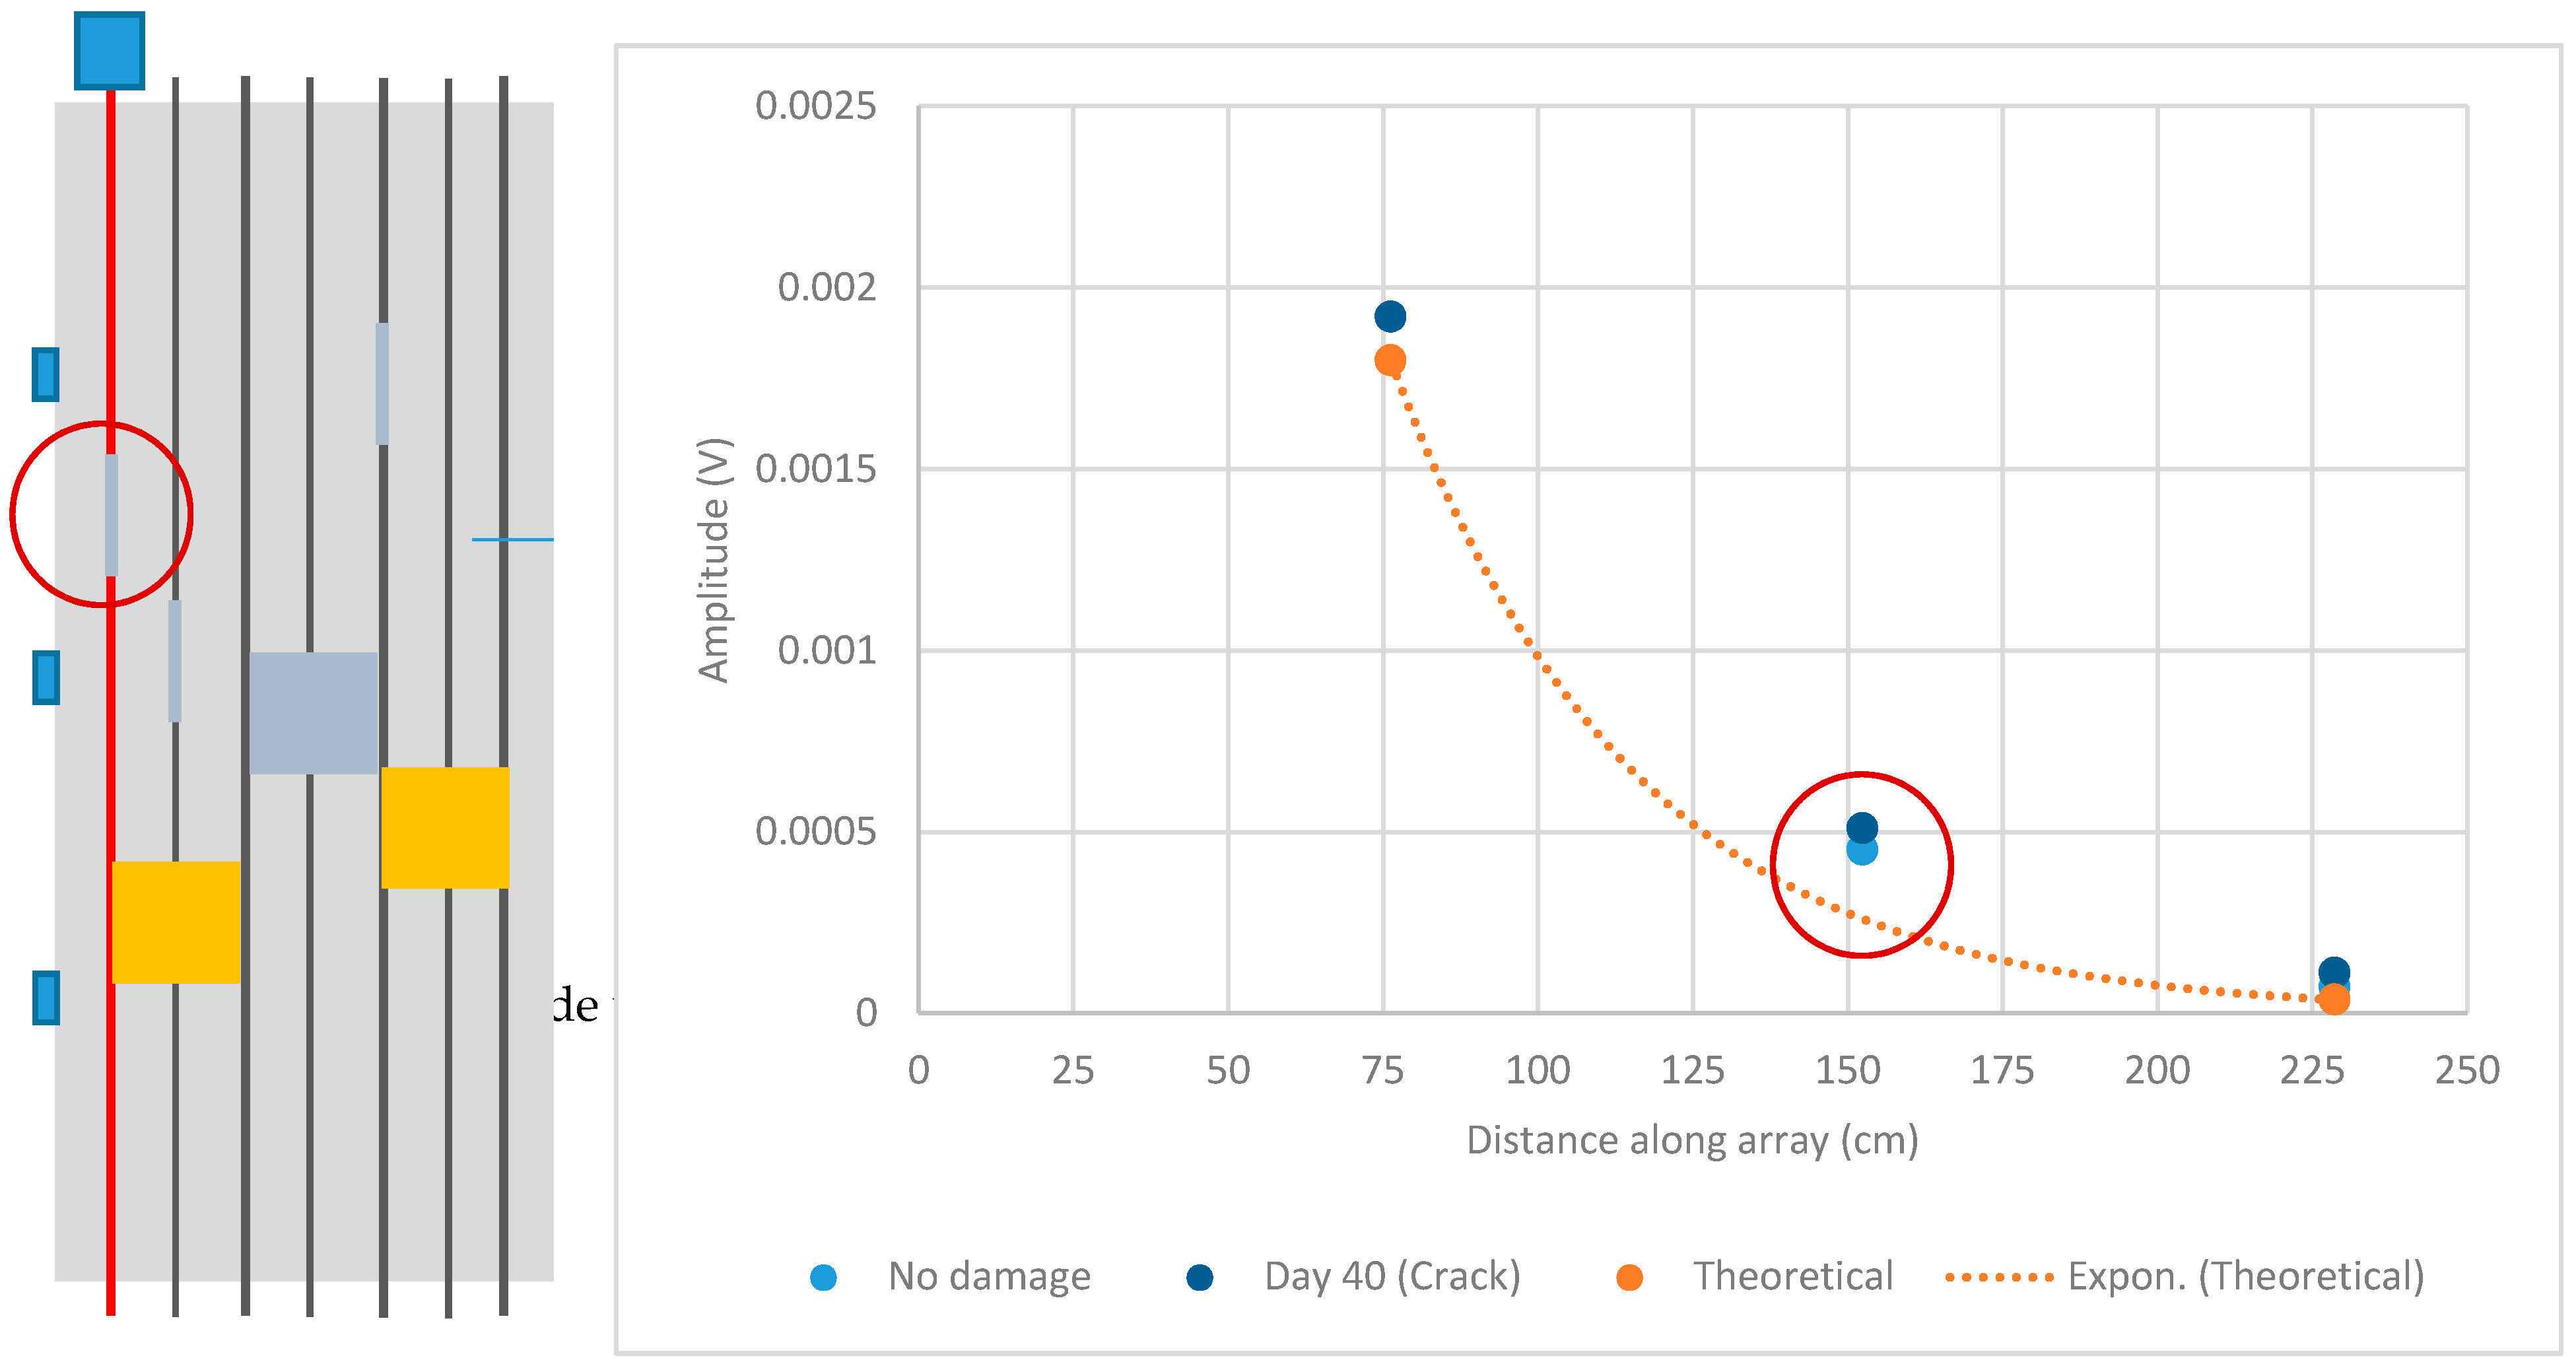
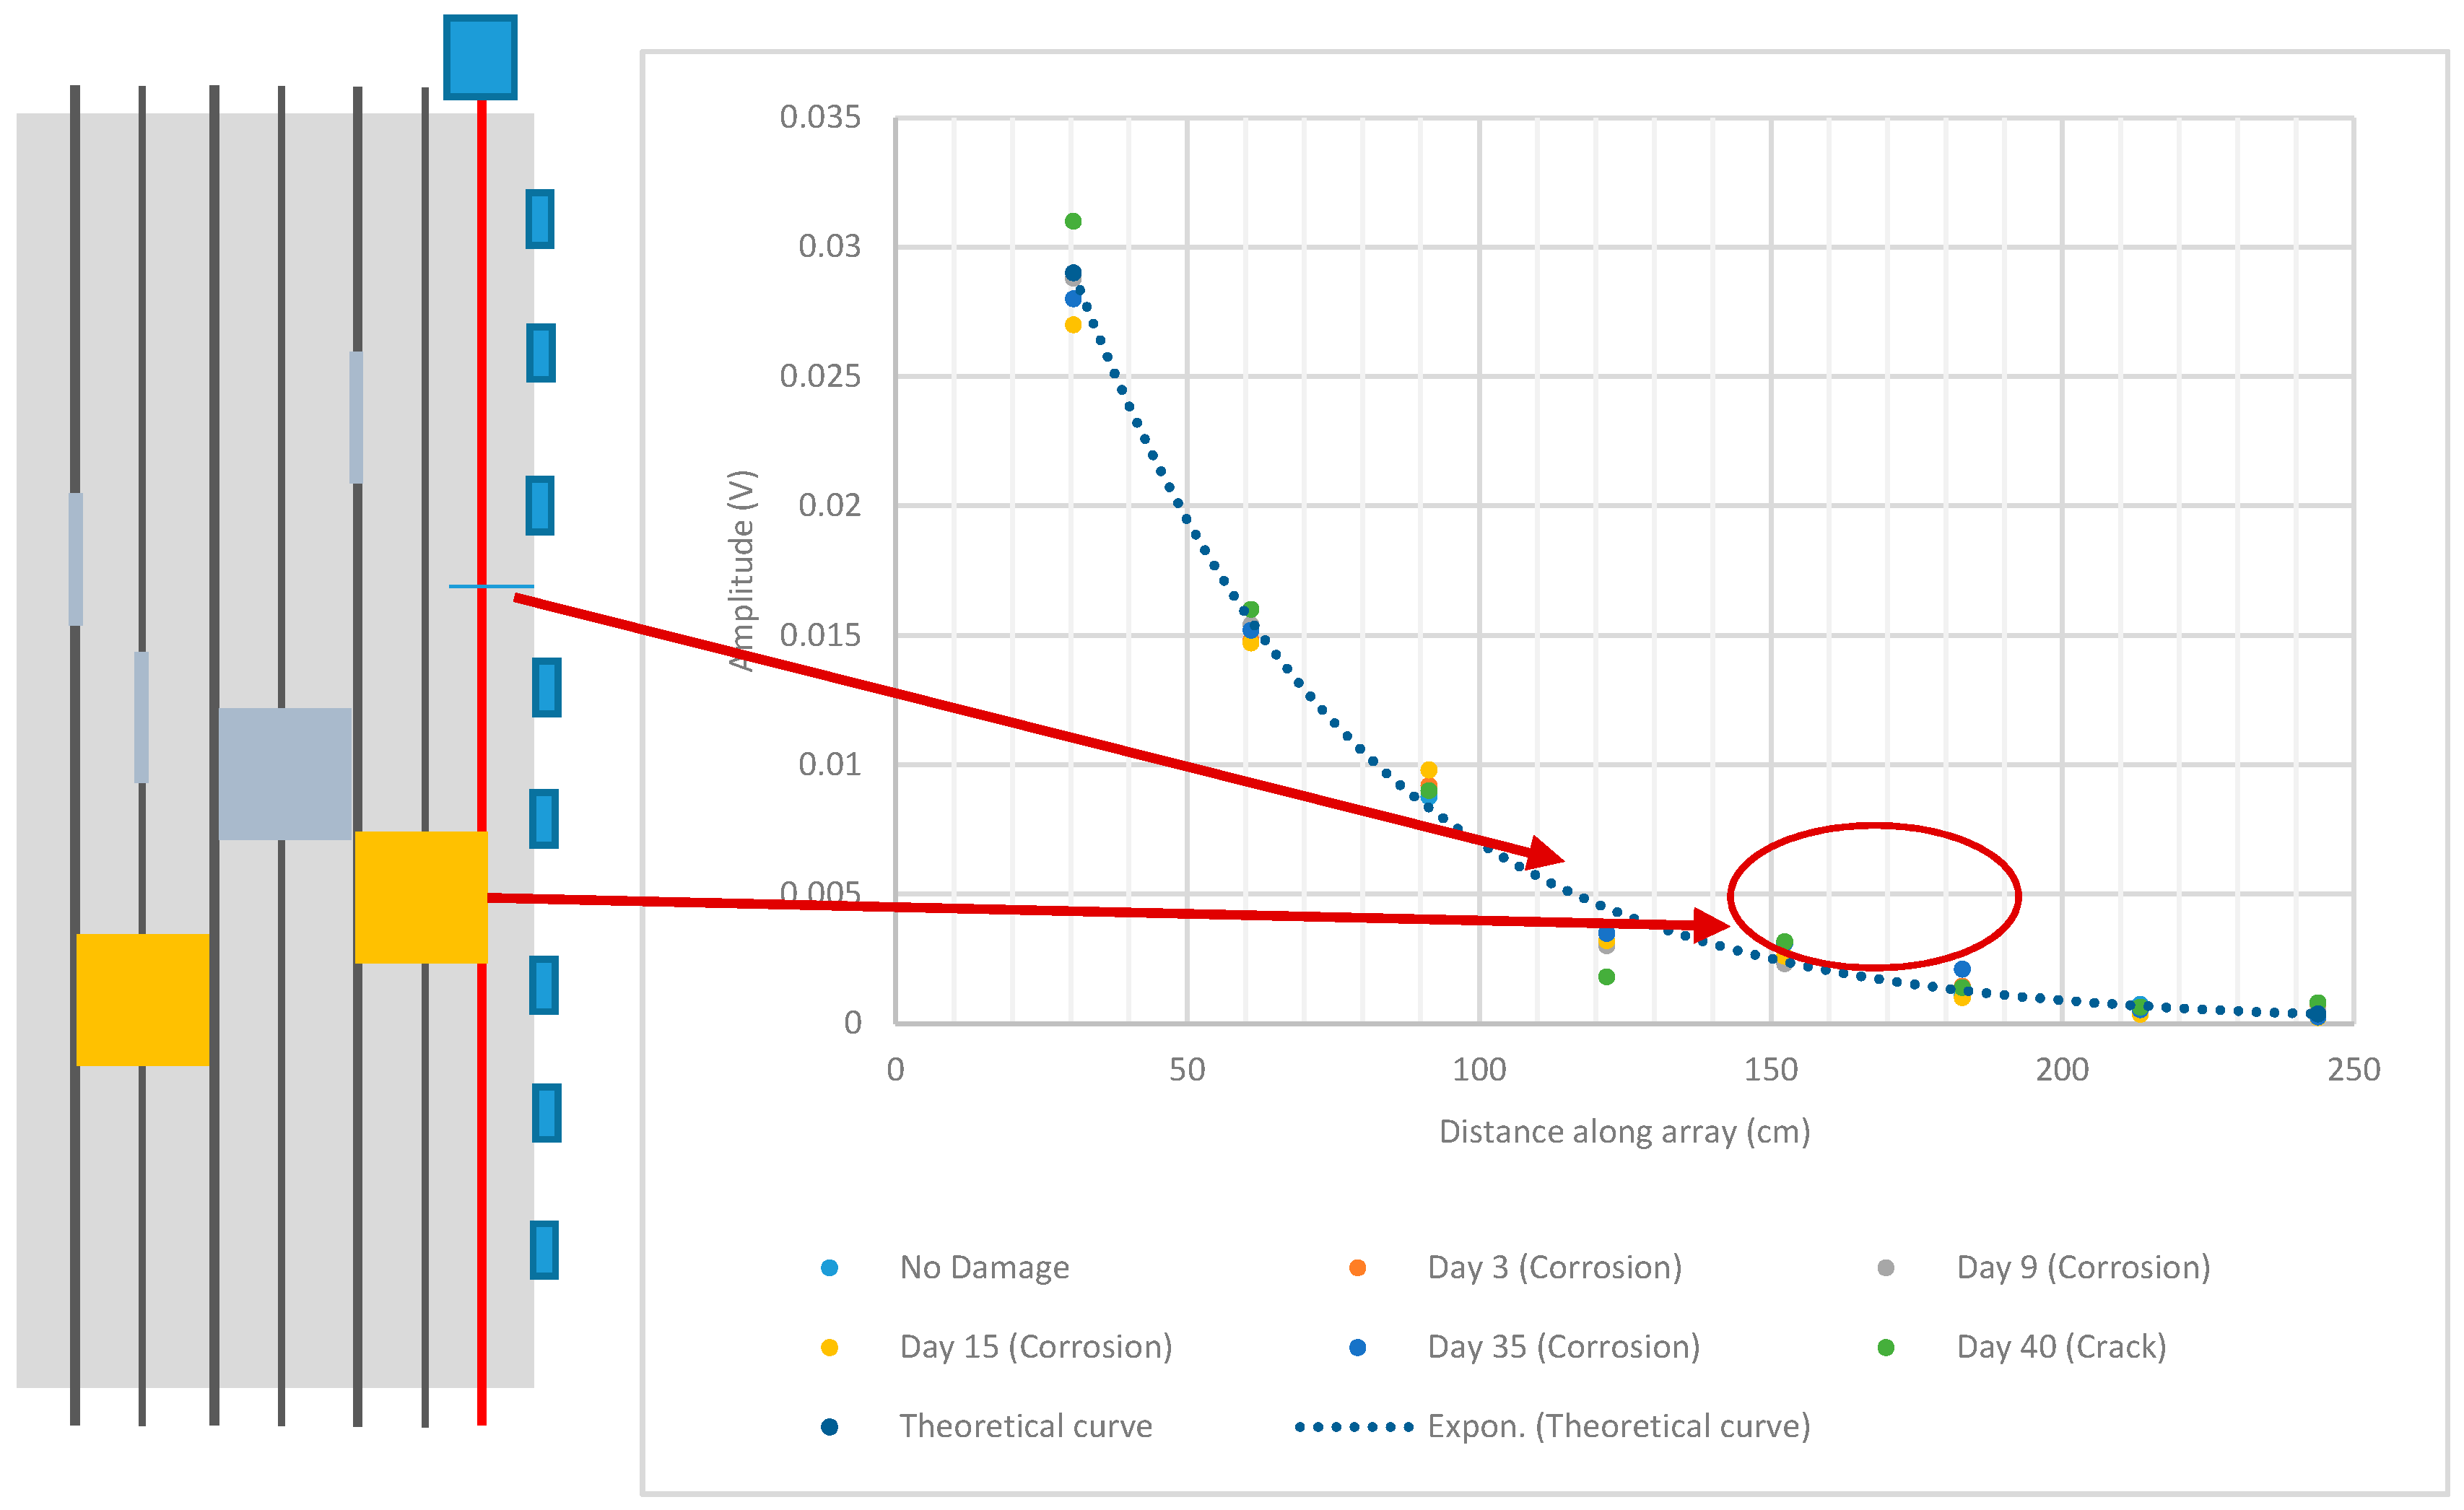
Sample results of the array using the 2 inch transducer are shown in
Figure 15 for the case when the right-most rebar is used as a wave guide. This experiment was intended to investigate the ability of the method to identify a crack in the concrete simultaneous with corrosion progression. The impact of the embedded crack is attributed to the amplitudes detected by the sensor located roughly at 122 cm (48 in.), which are consistently lower than the theoretical values. The detection of the corrosion region (which is expected to change over time) is more difficult. A slight increase in amplitudes was detected by the sensors located roughly at 152 cm (60 in.) and 183 cm (72 in.). This uncertainty is attributed to (i) the energy already having attenuated significantly by this point and the amplitudes already being very small, and (ii) the positioning of the sensors possibly not being optimal when the leakage angles are considered.
The generation of gradually increasing delamination and cracking attempts for this specimen were unsuccessful, because with two layers of reinforcement, the slab was too strong to induce cracking or delamination manually. However, the main goals of this specimen were achieved: all three types of flaws (delamination inserted around bars, independent cracking, and corrosion on bars) were detected despite the presence of two layers of reinforcement. In addition, receivers placed up to 304.8 cm (10 ft.) away from the transmitter location were still producing reasonable amplitude readings despite significant attenuation.
3.3. Laboratory Specimen Set 3—Results
In field conditions, the end of the rebar in a bridge deck will not be exposed and the transmitter will need to be either embedded during construction (new structures) or installed after coring down to the rebar. Either way, there needs to be a means of attachment that is durable and can transfer the ultrasonic waves efficiently. Further, while ideally the guided waves would be transmitted from one end of the rebar via a sensor placed parallel to the rebar, in field conditions, the approach will be from the top at 90 degrees, unless an angled seat is designed. Specimen Sets 3a and 3b were used to investigate the attachment material and attachment angles, respectively.
3.3.1. Specimen Set 3a Results
Specimen Set 3a comprised a single bar used to test various ideas for the attachment of the transmitter to the rebar in field conditions, as explained in
Section 2.1.3 and shown in
Figure 6. According to the experimental results (
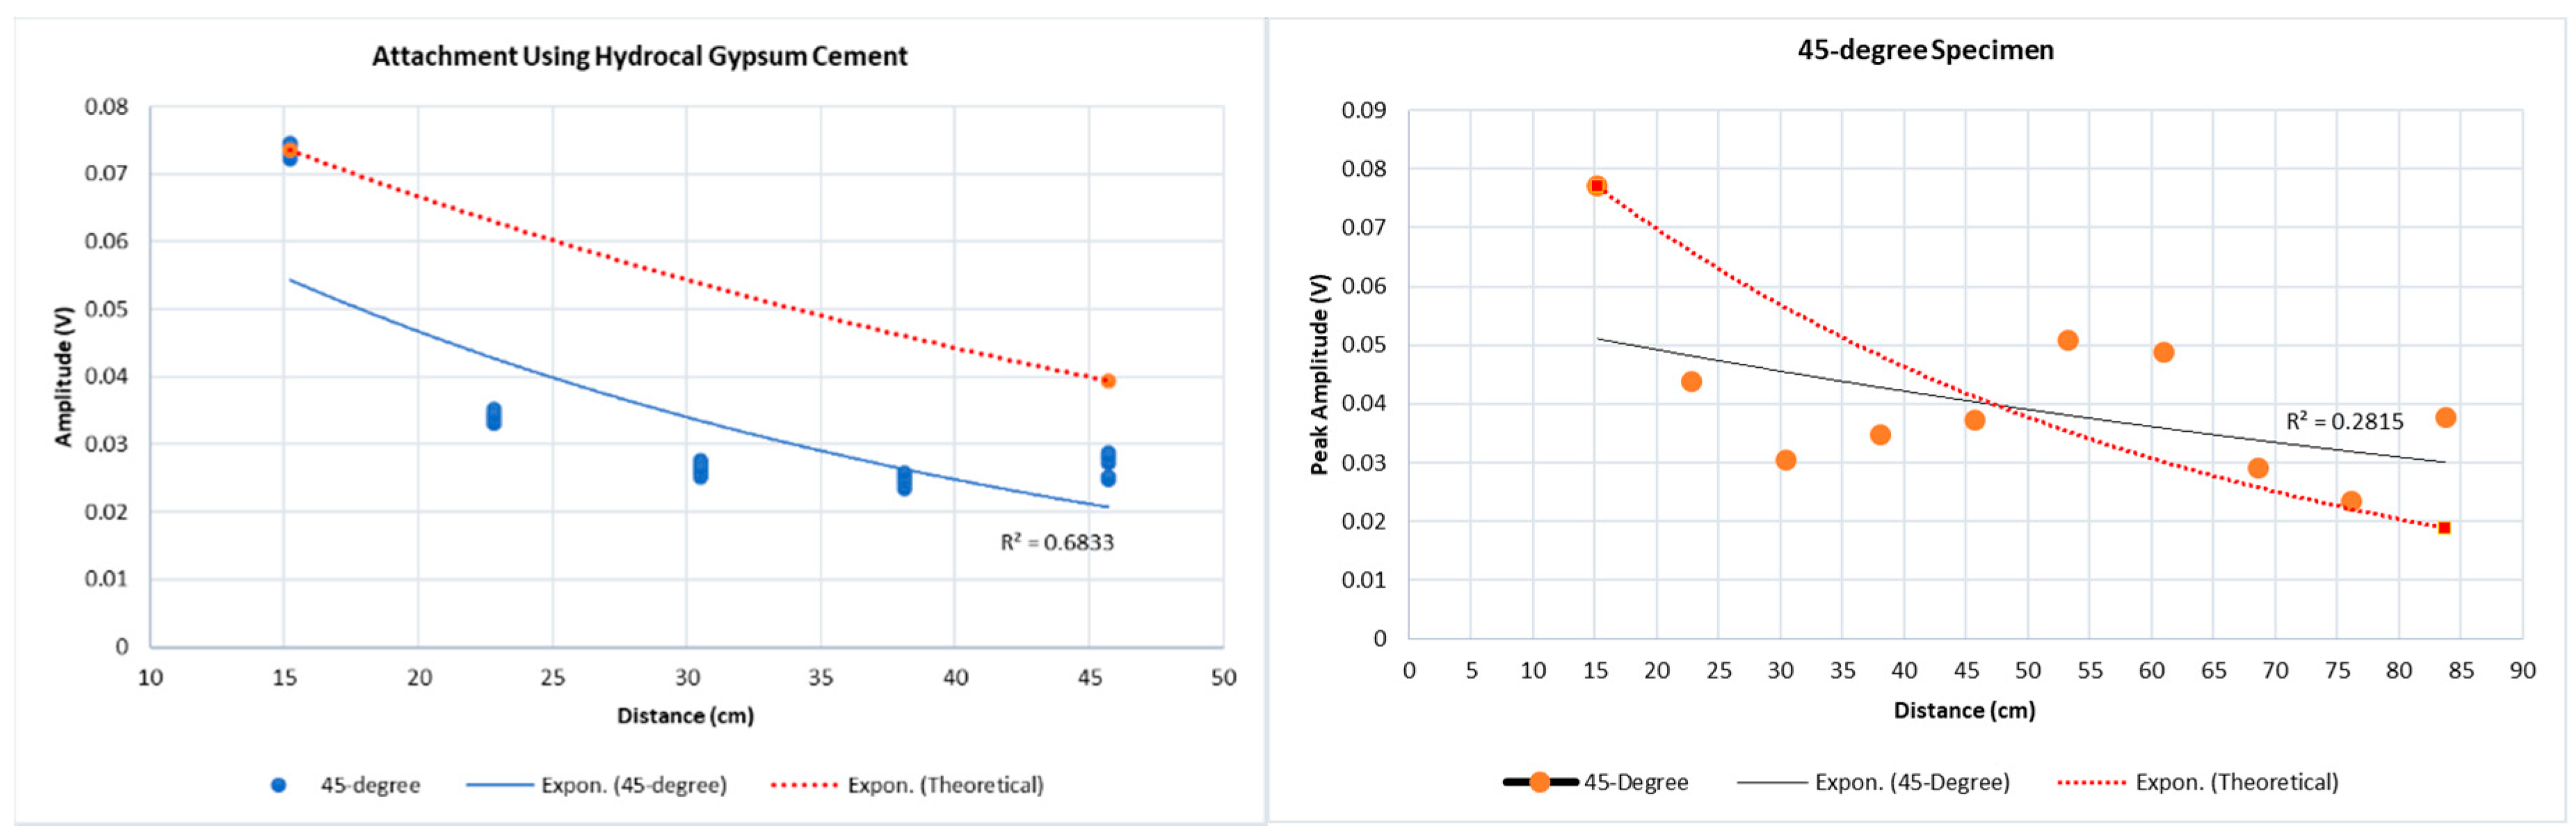
Table 2), the maximum energy transfer was achieved when the transmitter was coupled directly to the end of the rebar, which represents the original lab setup and aligns with the optimal wave propagation expected with wave guides. The second-greatest amplitude measurements were achieved using Hydrocal gypsum cement, despite perpendicular attachment to the rebar. This material also has a short curing time of approximately 20 min; therefore, it will not cause significant delays during field testing.
3.3.2. Specimen Set 3b Results
Specimen Set 3b comprised three reinforced concrete slabs that measured 91.4 cm × 45.7 cm × 12.7 cm (36 × 18 × 5 in.), as shown in
Figure 7. Several experimental parameters were studied using these specimens.
Effect of Transmitter Angle with Respect to the Wave Guide
One of the purposes of these specimens was to investigate the amount of energy transfer with different bar end angles, to identify a feasible angle to attach a sensor to a rebar from the top with an angled seat, yet still achieve the guided wave phenomenon to a reasonable degree. For this purpose, the ends of the rebar were cut at 0, 33, and 45 degrees to simulate angled transmitter-to-rebar attachment scenarios.
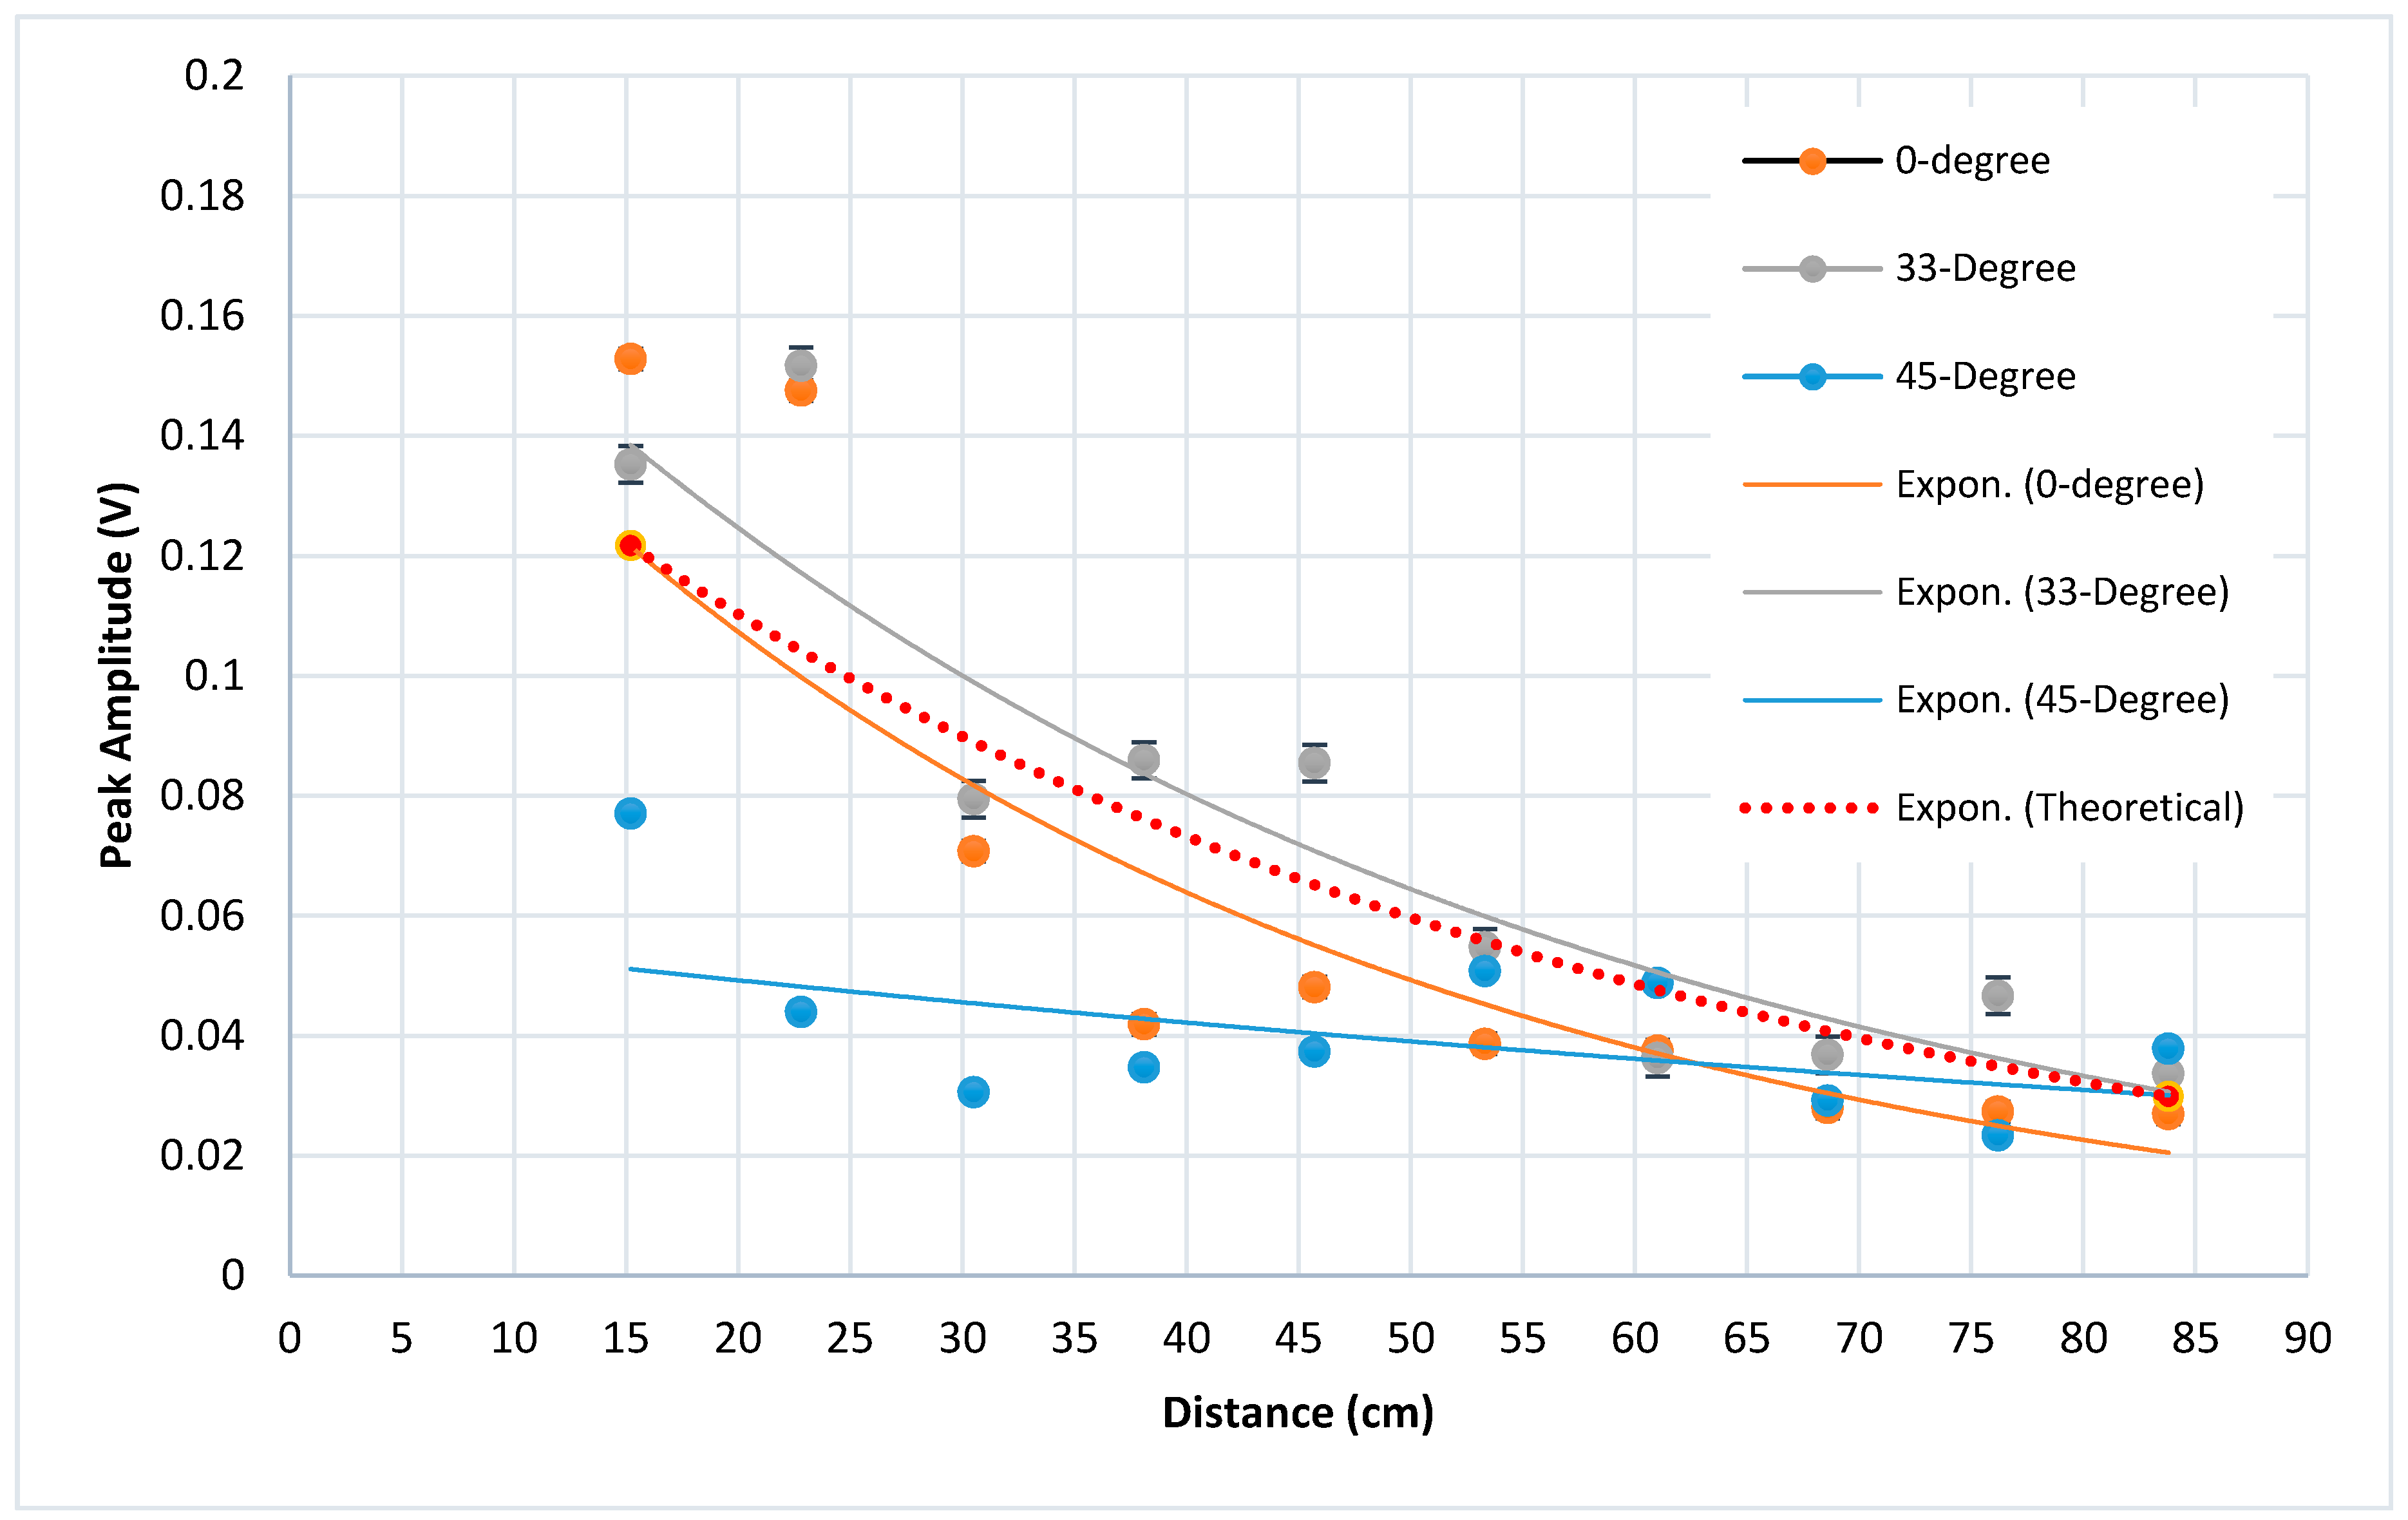
Figure 16 shows a combined plot obtained for these specimens with both data points and their exponential trendlines, as well as a theoretical curve. The theoretical curve was obtained using Equations (1)–(3). An upper boundary of attenuation coefficient was utilized in this case, based on previous work done by Garcia, 2016 [
6], where it was found that the dimensions of the specimen tested are an important factor. In fact, the smaller the dimensions of the specimen, the more likely it is for the reflection within the concrete to be detected by the sensors. This, in turn, results in higher amplitude readings at the starting end of the guided wave and, thus, a higher attenuation coefficient. Instead of a variable coefficient, considering the smaller size of these specimens, a high attenuation coefficient is used in
Figure 16. In addition, the larger variation of readings when the transmitter and the receiver are closer is also attributed to reflections. The generated ultrasonic waves would include both shear and longitudinal wave components. While the initial reading points can receive leaked energy and reflections from both wave forms, as the energy attenuates, later measurement locations along the array are more likely to receive only the leakage from longitudinal waves.
As expected, maximum energy transfer was achieved with the 0 degree specimen with a peak amplitude around 0.15 V. The 33 degree specimen provided comparable peak amplitudes (around 0.14 V) but greater scatter due to the fact that additional modes of ultrasonic waves were excited that led to additional reflections of the leaked waves from the boundaries of the wave guide. In the case of the 45 degree specimen, much less energy was transmitted longitudinally, resulting in much lower amplitudes detected from the concrete surface along the array. Given the significant loss of energy in this setup along with highly scattered data, this angle of attachment (45 degrees) was concluded to be infeasible for field applications. A 33 degree angle or lower appears to be optimal—a compromise between feasible attachment on a horizontal rebar and maintaining most of the energy longitudinally in the wave guide. However, further work will take place in future phases of this project to investigate other angles between 0 and 33 degrees.
Effect of Couplant
Two different couplants to connect the sensors to the materials (steel or concrete) were studied: (1) Ultragel II from Magnaflux and (2) White Lithium Grease (WLG) from Lucas Oil Products.
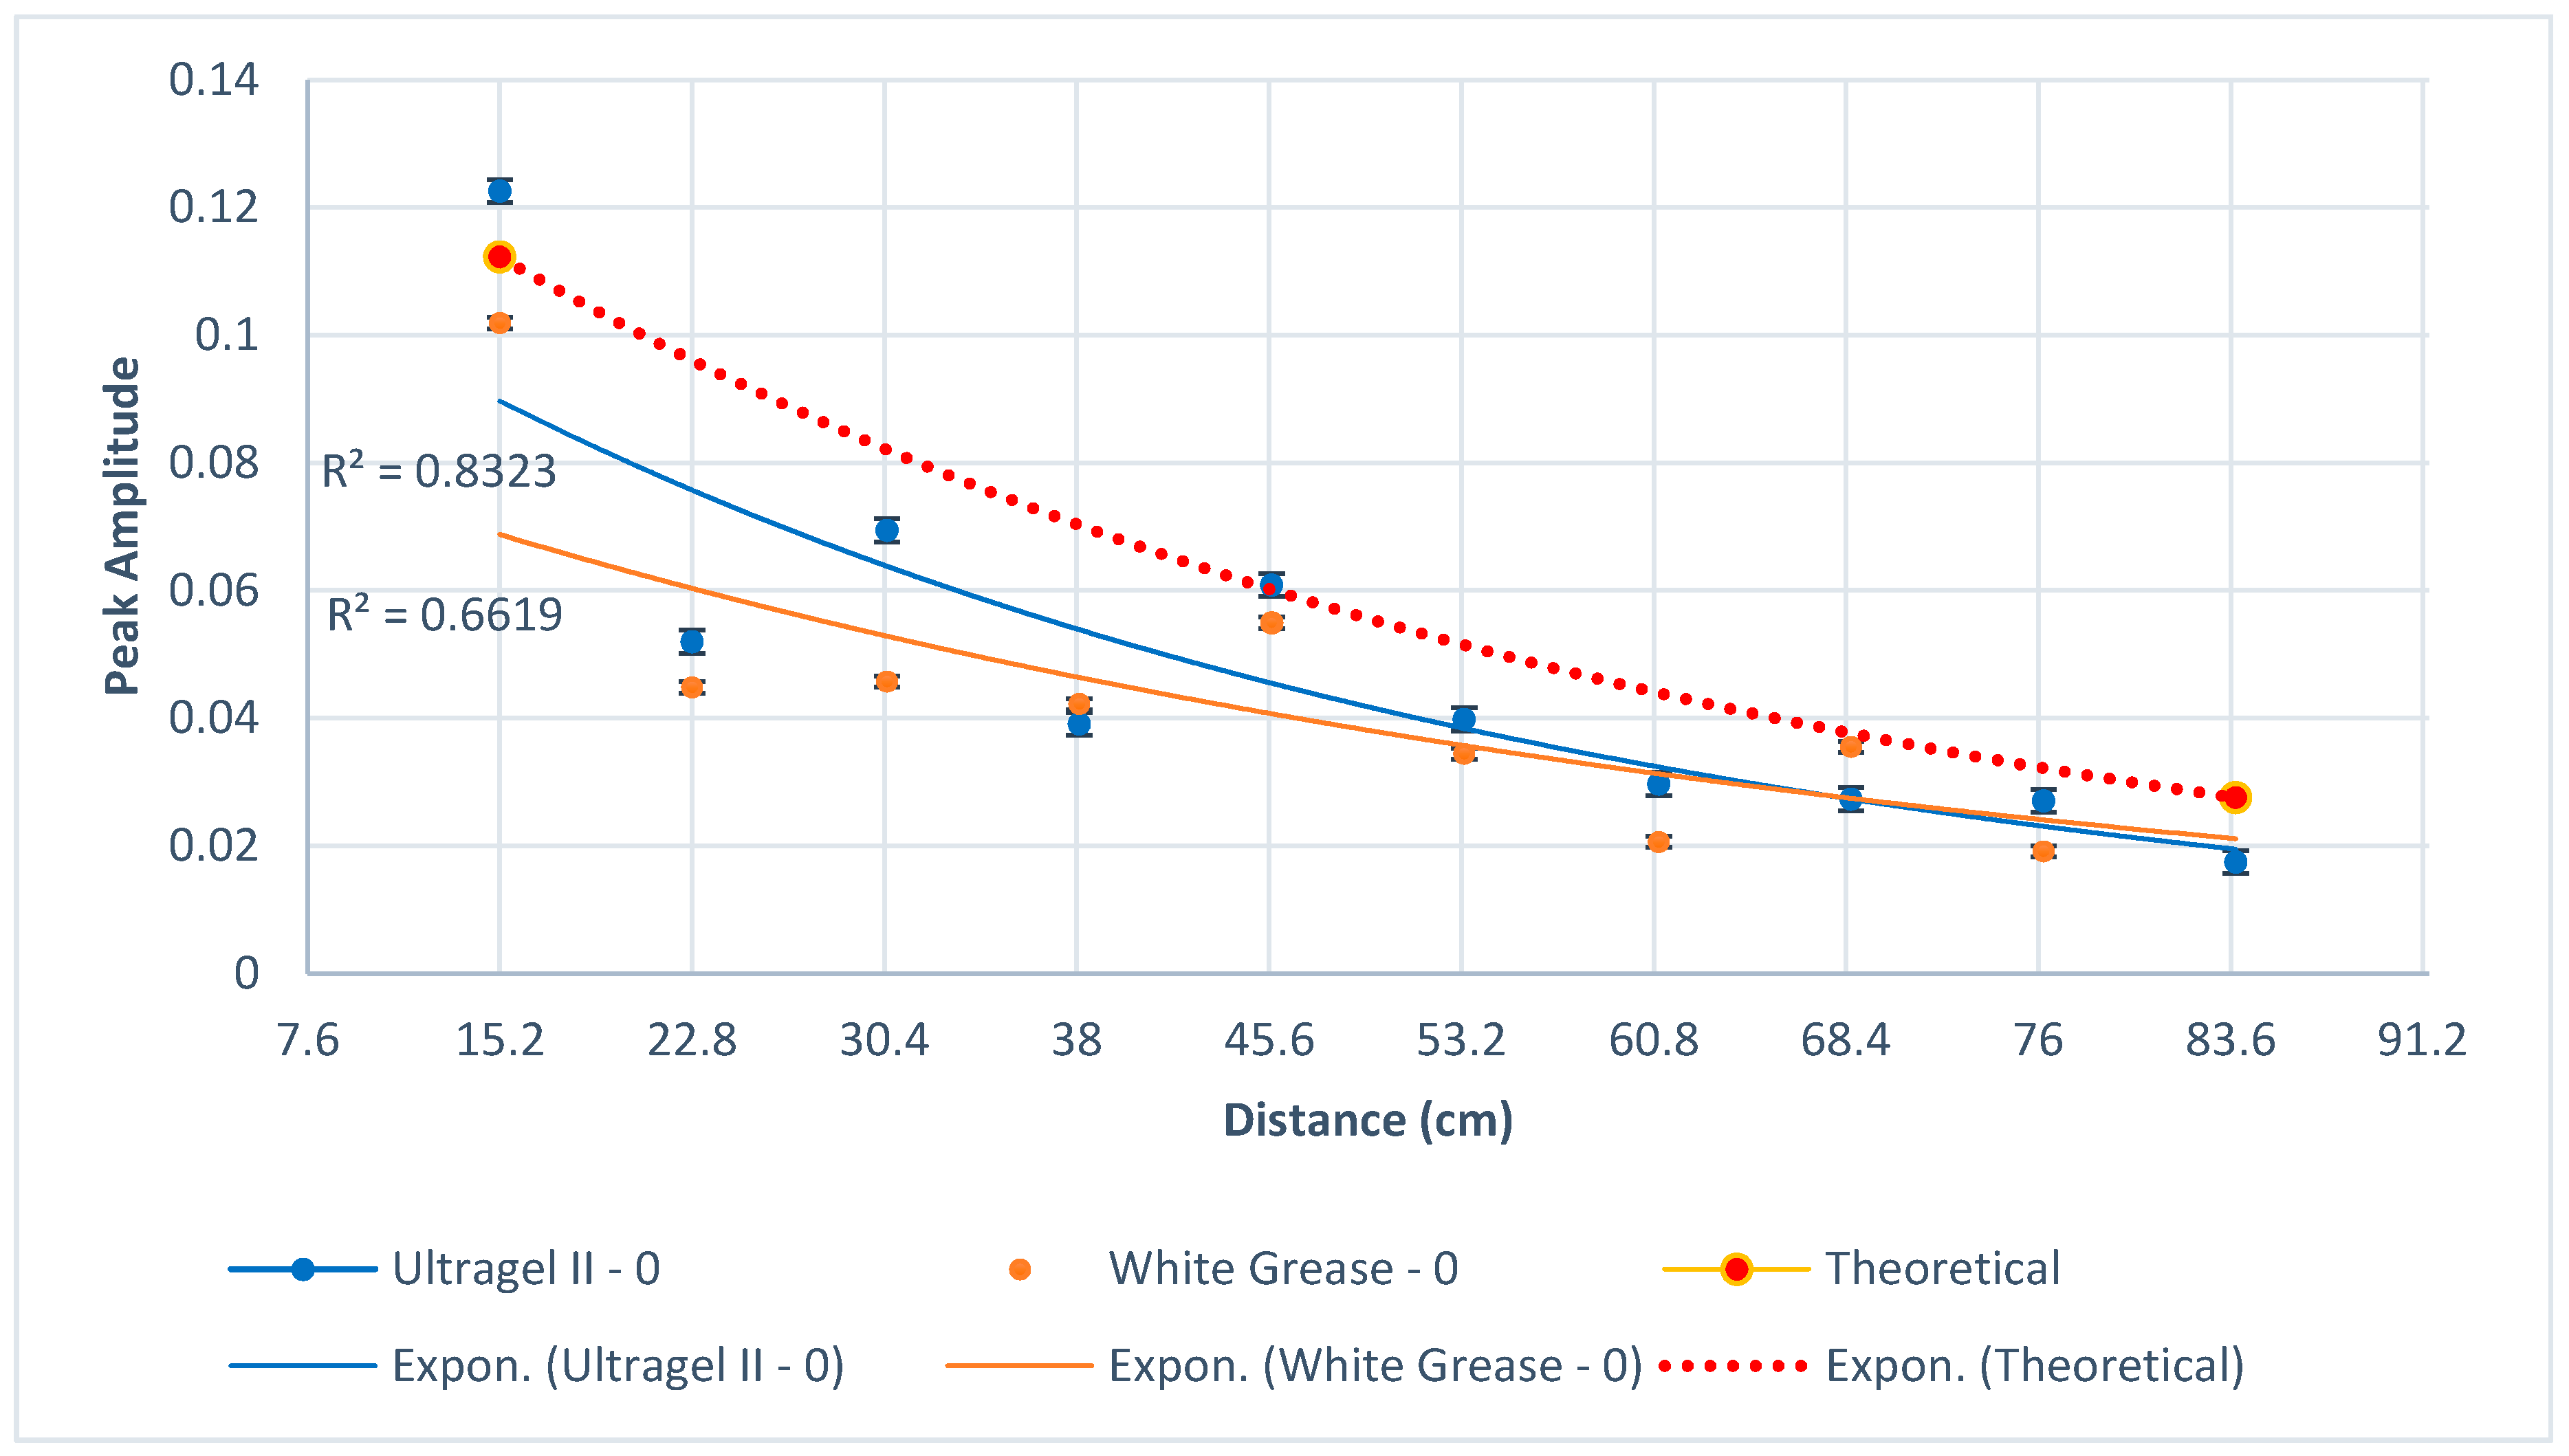
It can be seen in
Figure 17 that not only are the peak amplitudes for coupling with Ultragel II slightly higher than those with WLG, but the exponential curve is also closer to the theoretical curve. Further, the R-squared value for an exponential trendline is higher for Ultragel II. Another advantage of Ultragel II is that it can be easily wiped off the surface compared to White Lithium Grease. On the other hand, each data point in
Figure 17 represents 20 trials, and it should be noted that the standard deviation for each test location was slightly higher with Ultragel II (0.0018 versus 0.0008 for WLG); this is likely because it is less sticky than WLG and creates more room for user errors when measurements are repeated. Therefore, care should be taken to ensure consistent measurements with Ultragel II. In conclusion, the difference is not very significant, and either couplant can be used in this method; however, Ultragel II appears to be slightly more efficient.
Lab Experiment to Replicate Field Conditions
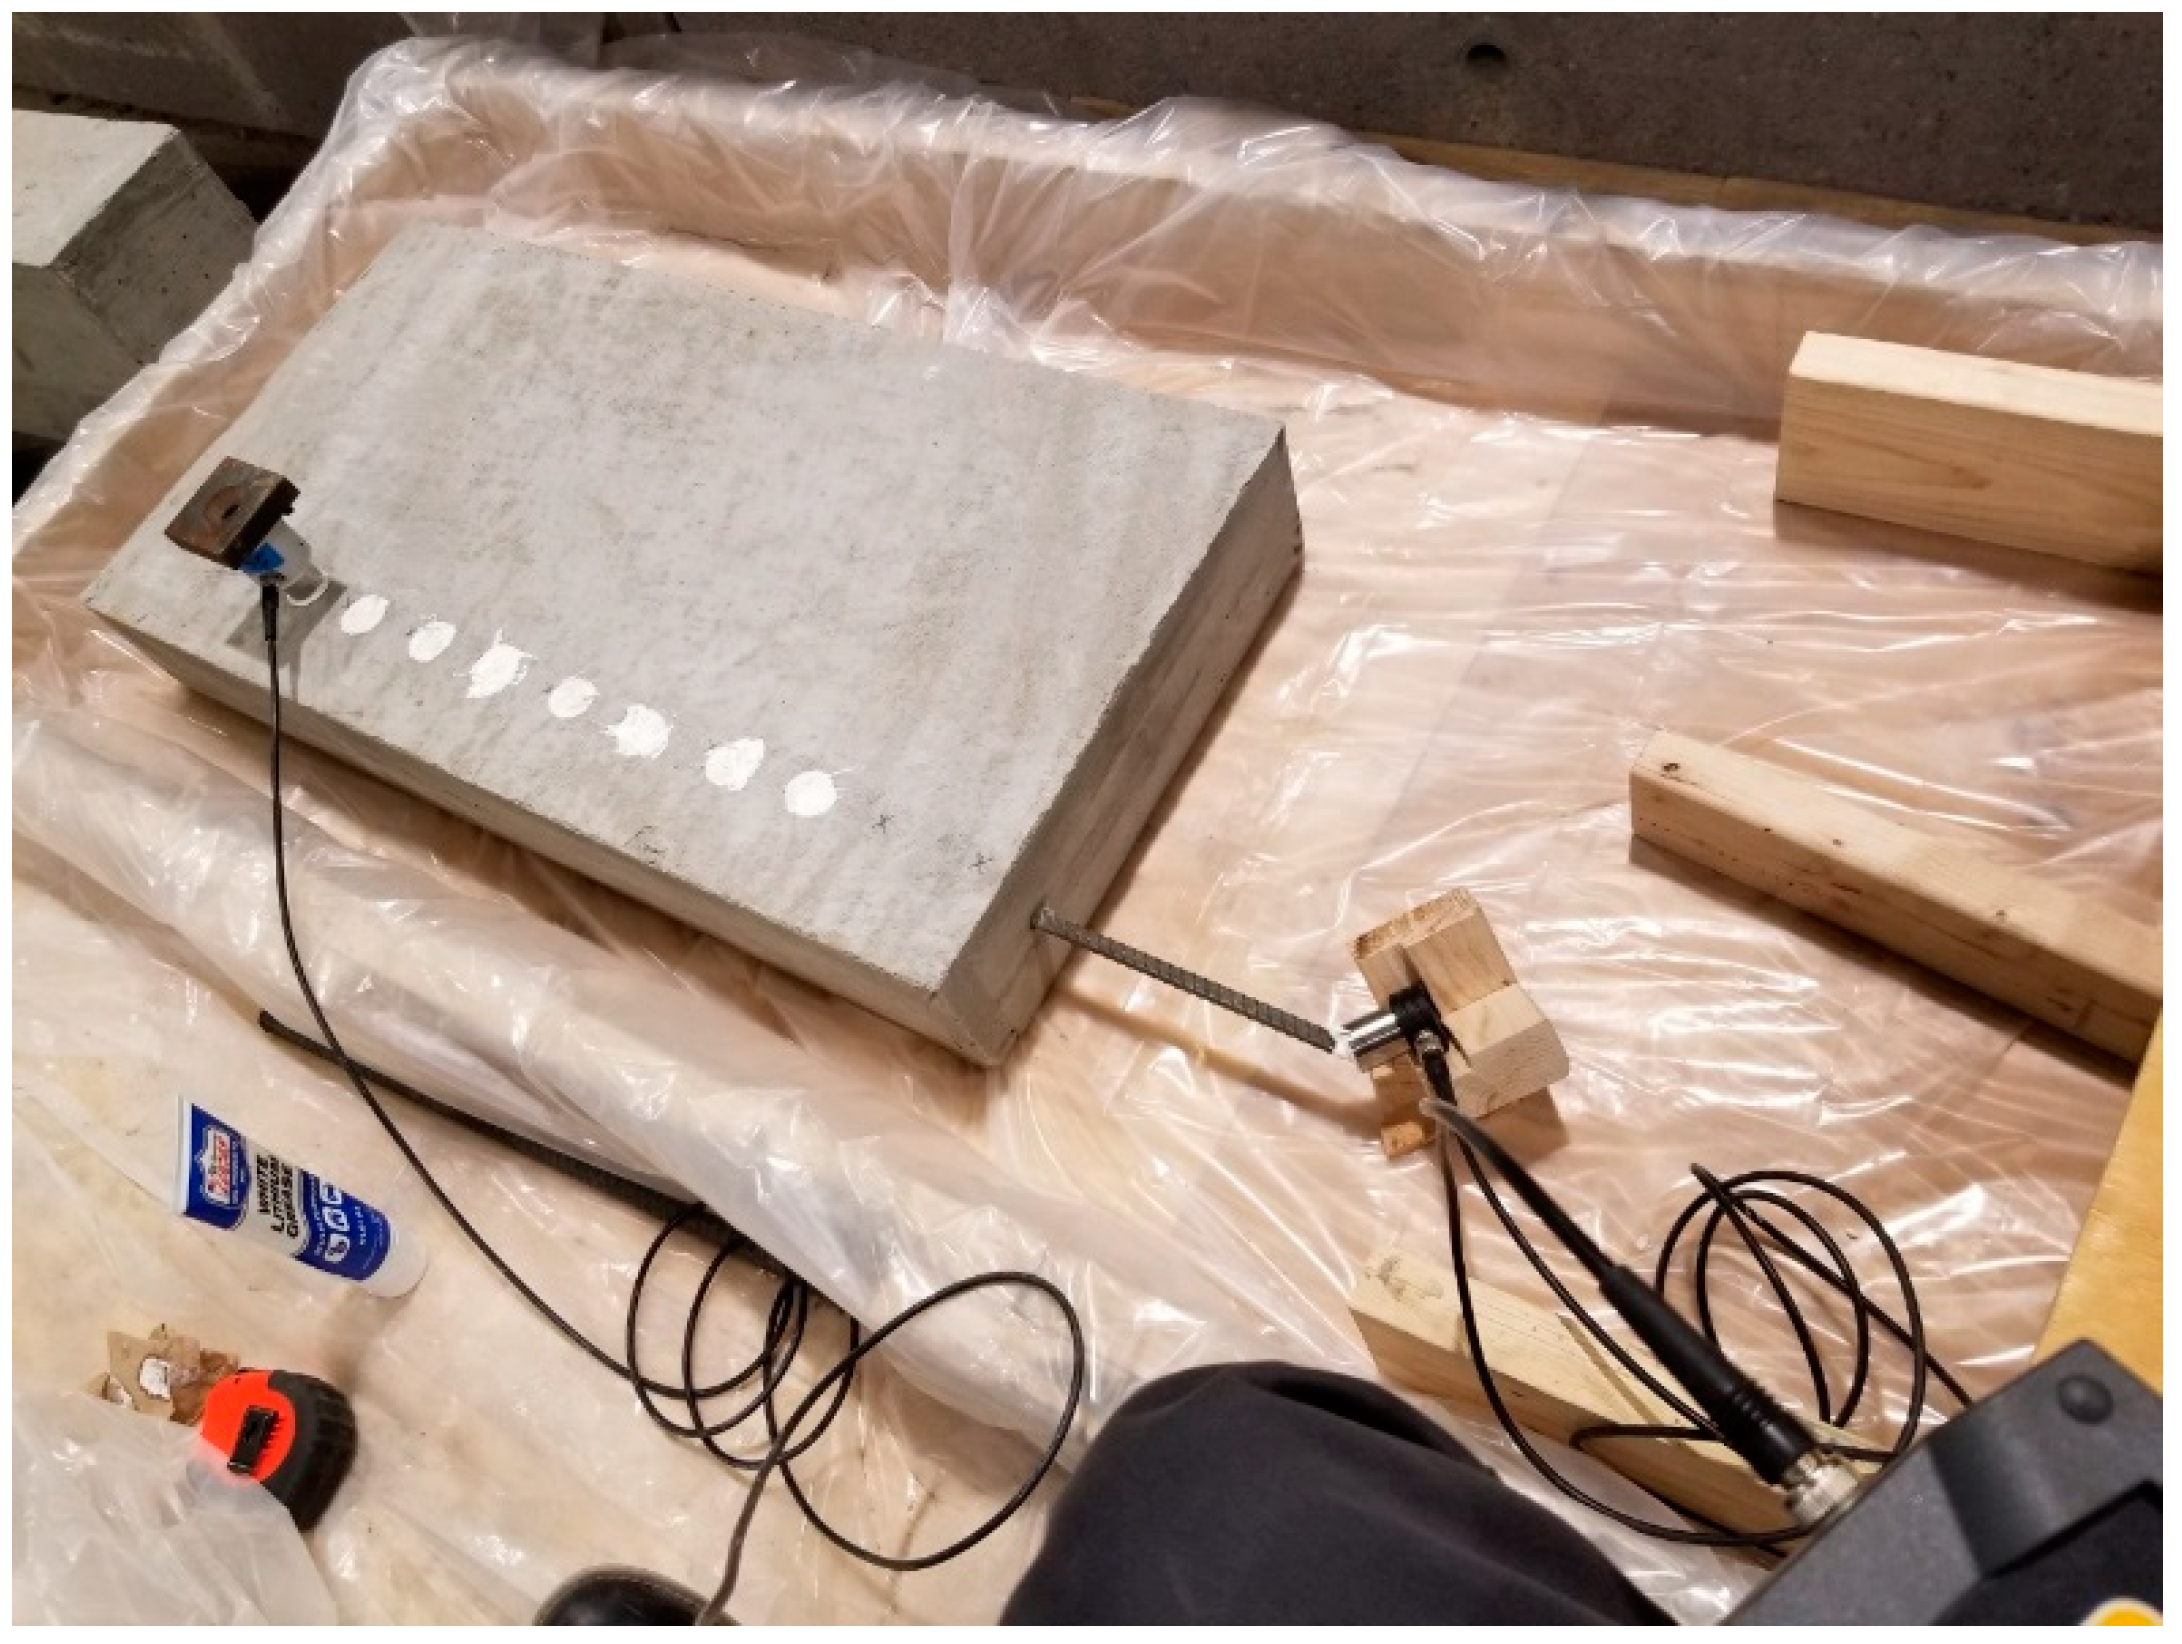
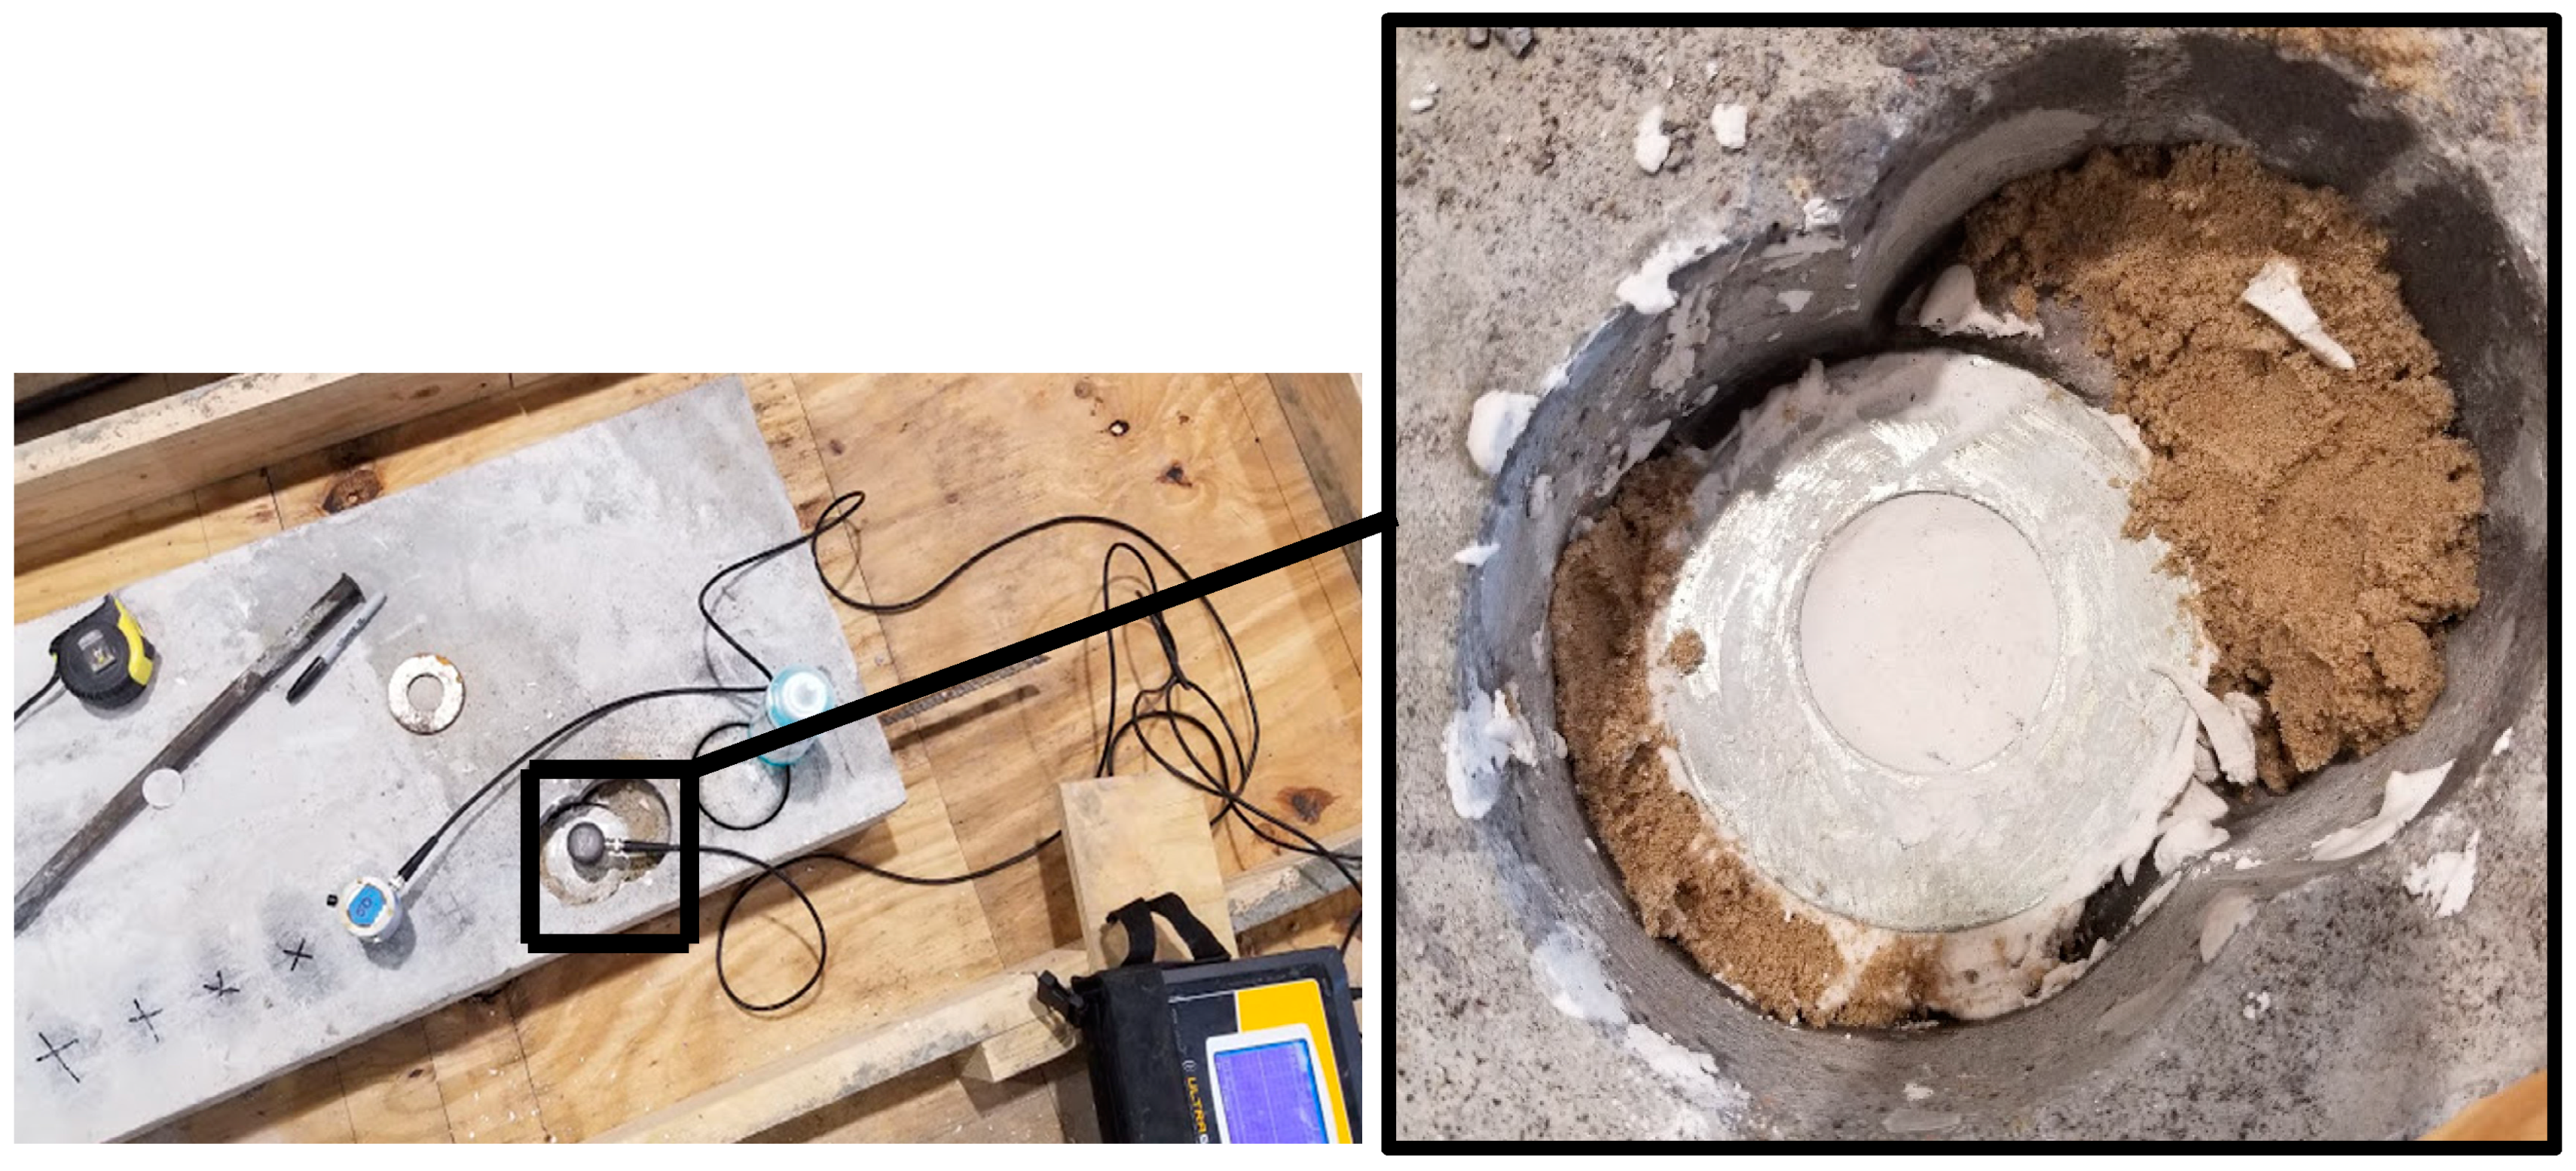
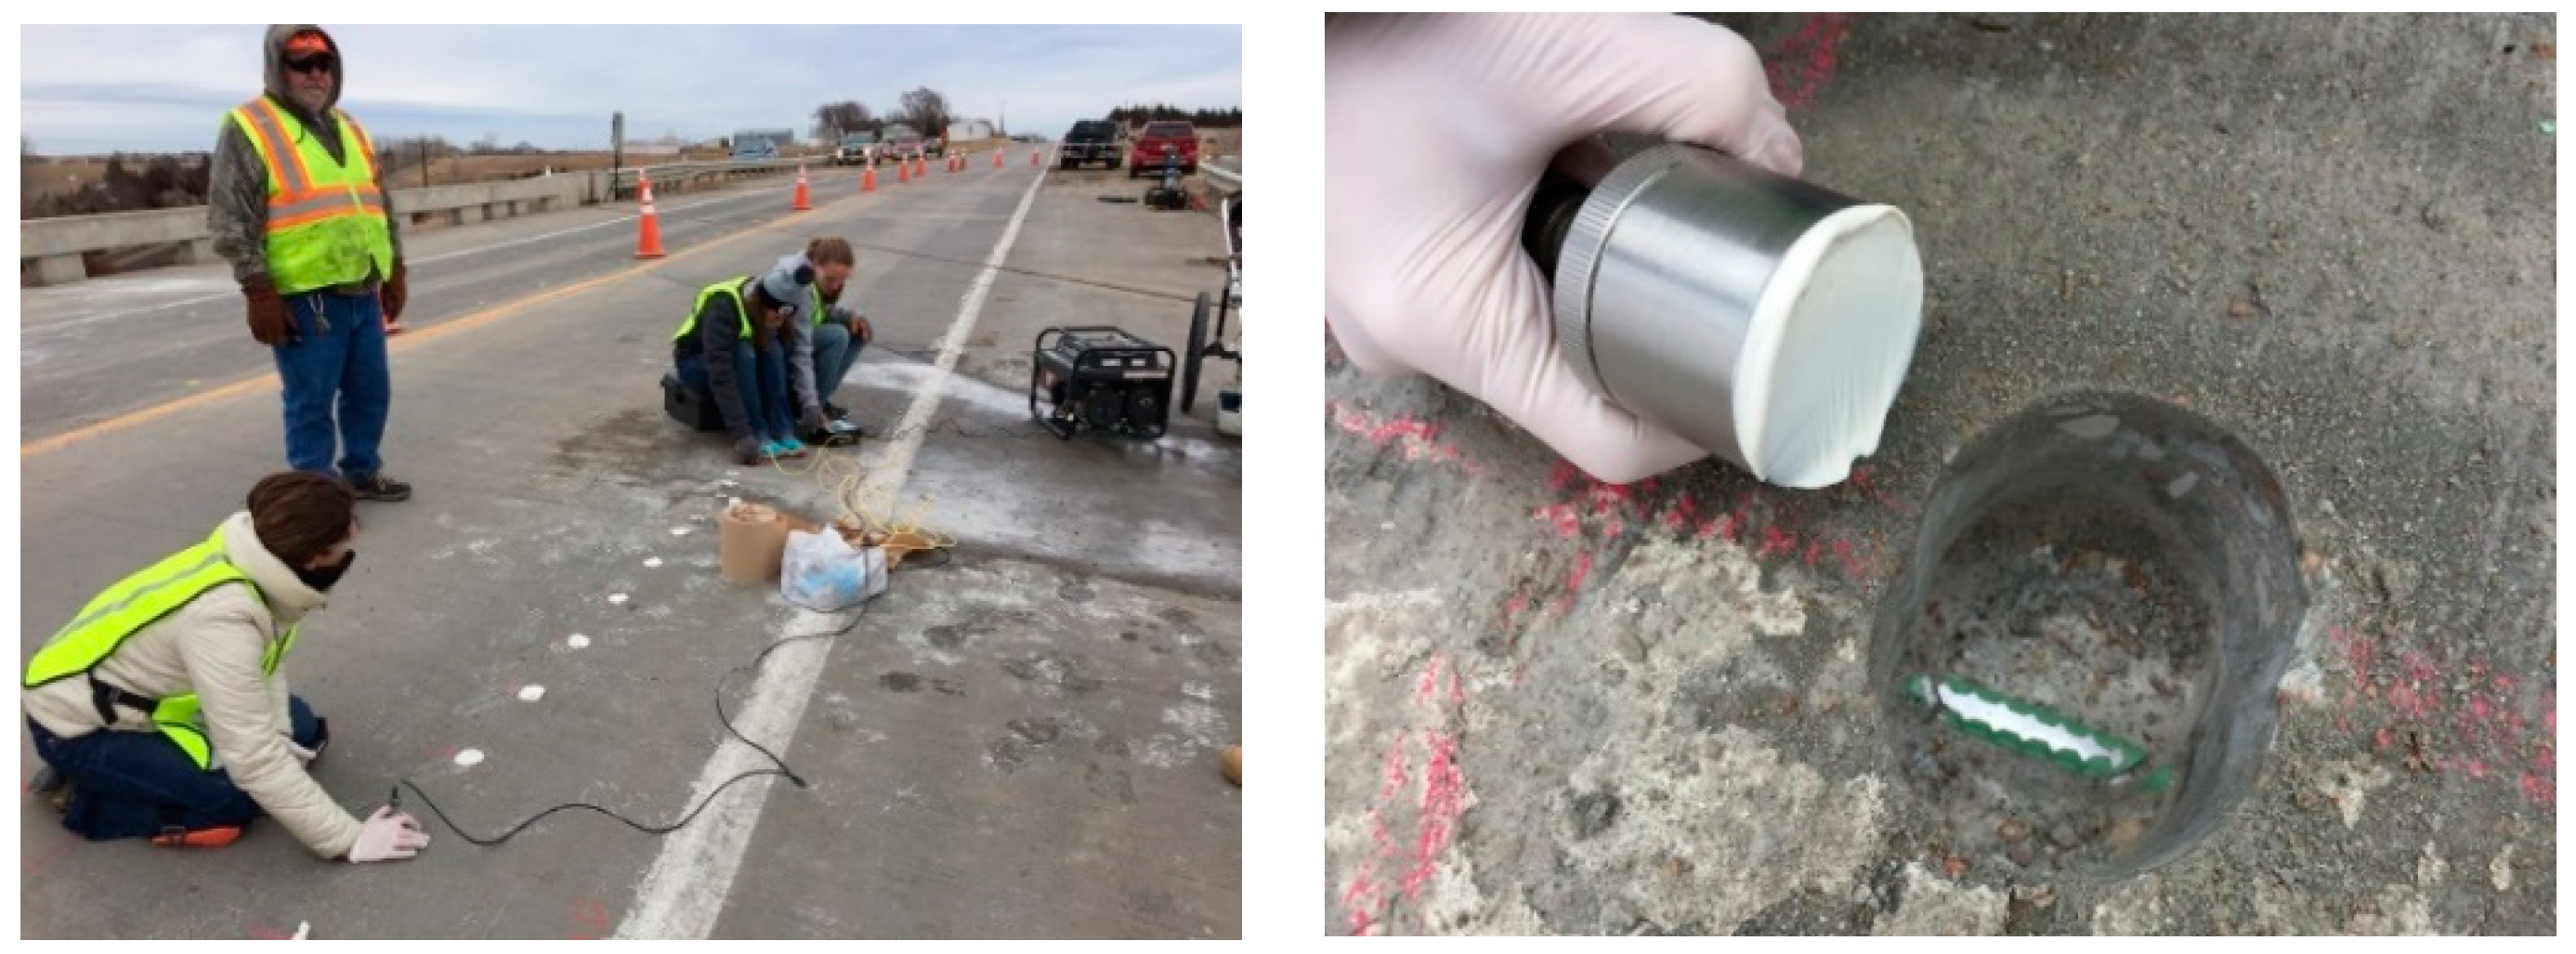
The 45 degree test specimen was cored to the rebar level using a hitch mounted core drill; then, the top surface of the rebar was ground flat and a seat was created using the Hydrocal gypsum paste to replicate the gypsum seat attachment that would be made in the field (
Figure 18). The ultrasonic pulses were transmitted from this point and monitored using receivers at five equally spaced spots on the top surface of the specimen along the rebar.
The results for this experiment are shown in
Figure 19 in comparison to the original data from the 45 degree specimen. As can be seen, coupling perpendicular to the bar with gypsum (
Figure 19, left) actually works better than the end of rebar with a 45 degree angle, given the better fit with an exponential curve and the theoretical curve, as well as similar peak amplitudes to those observed when sending the energy from the end of the wave guide (
Figure 19, right). This is attributed to two factors: (1) it is difficult to be consistent when a larger-diameter transmitter is placed on the inclined, smaller-diameter cross section of the rebar; and (2) Hydrocal gypsum is a very efficient couplant for ultrasonic waves.
Based on these two stages of testing (rebar only and within concrete), the use of a Hydrocal quick-setting gypsum cement seat with an angle lower than 45 degrees is recommended for field applications.
4. In Situ Bridge Deck Trials
Observations from two in situ bridge deck implementations are discussed in this section.
4.1. Emerald Bridge: Existing Bridge/Instantaneous Measurement Pilot Study
The first bridge deck trial took place in the earlier stages of the project to understand the challenges that must be researched further to implement the proposed method in the field. This pilot test was conducted on bridge S006 30574 of the Nebraska Highway System, located near the town of Emerald (henceforth referred to as the “Emerald Bridge”). There were two testing locations: one in the north lane and one in the south lane. At each location, the concrete was cored to the level of the top rebar, and the surface of the rebar was ground to create a smooth and flat surface for better coupling (
Figure 20). Two types of sensors, one of 2.5 cm (1 in.) and one of 5 cm (2 in.) diameter, and WLG as couplant were used.
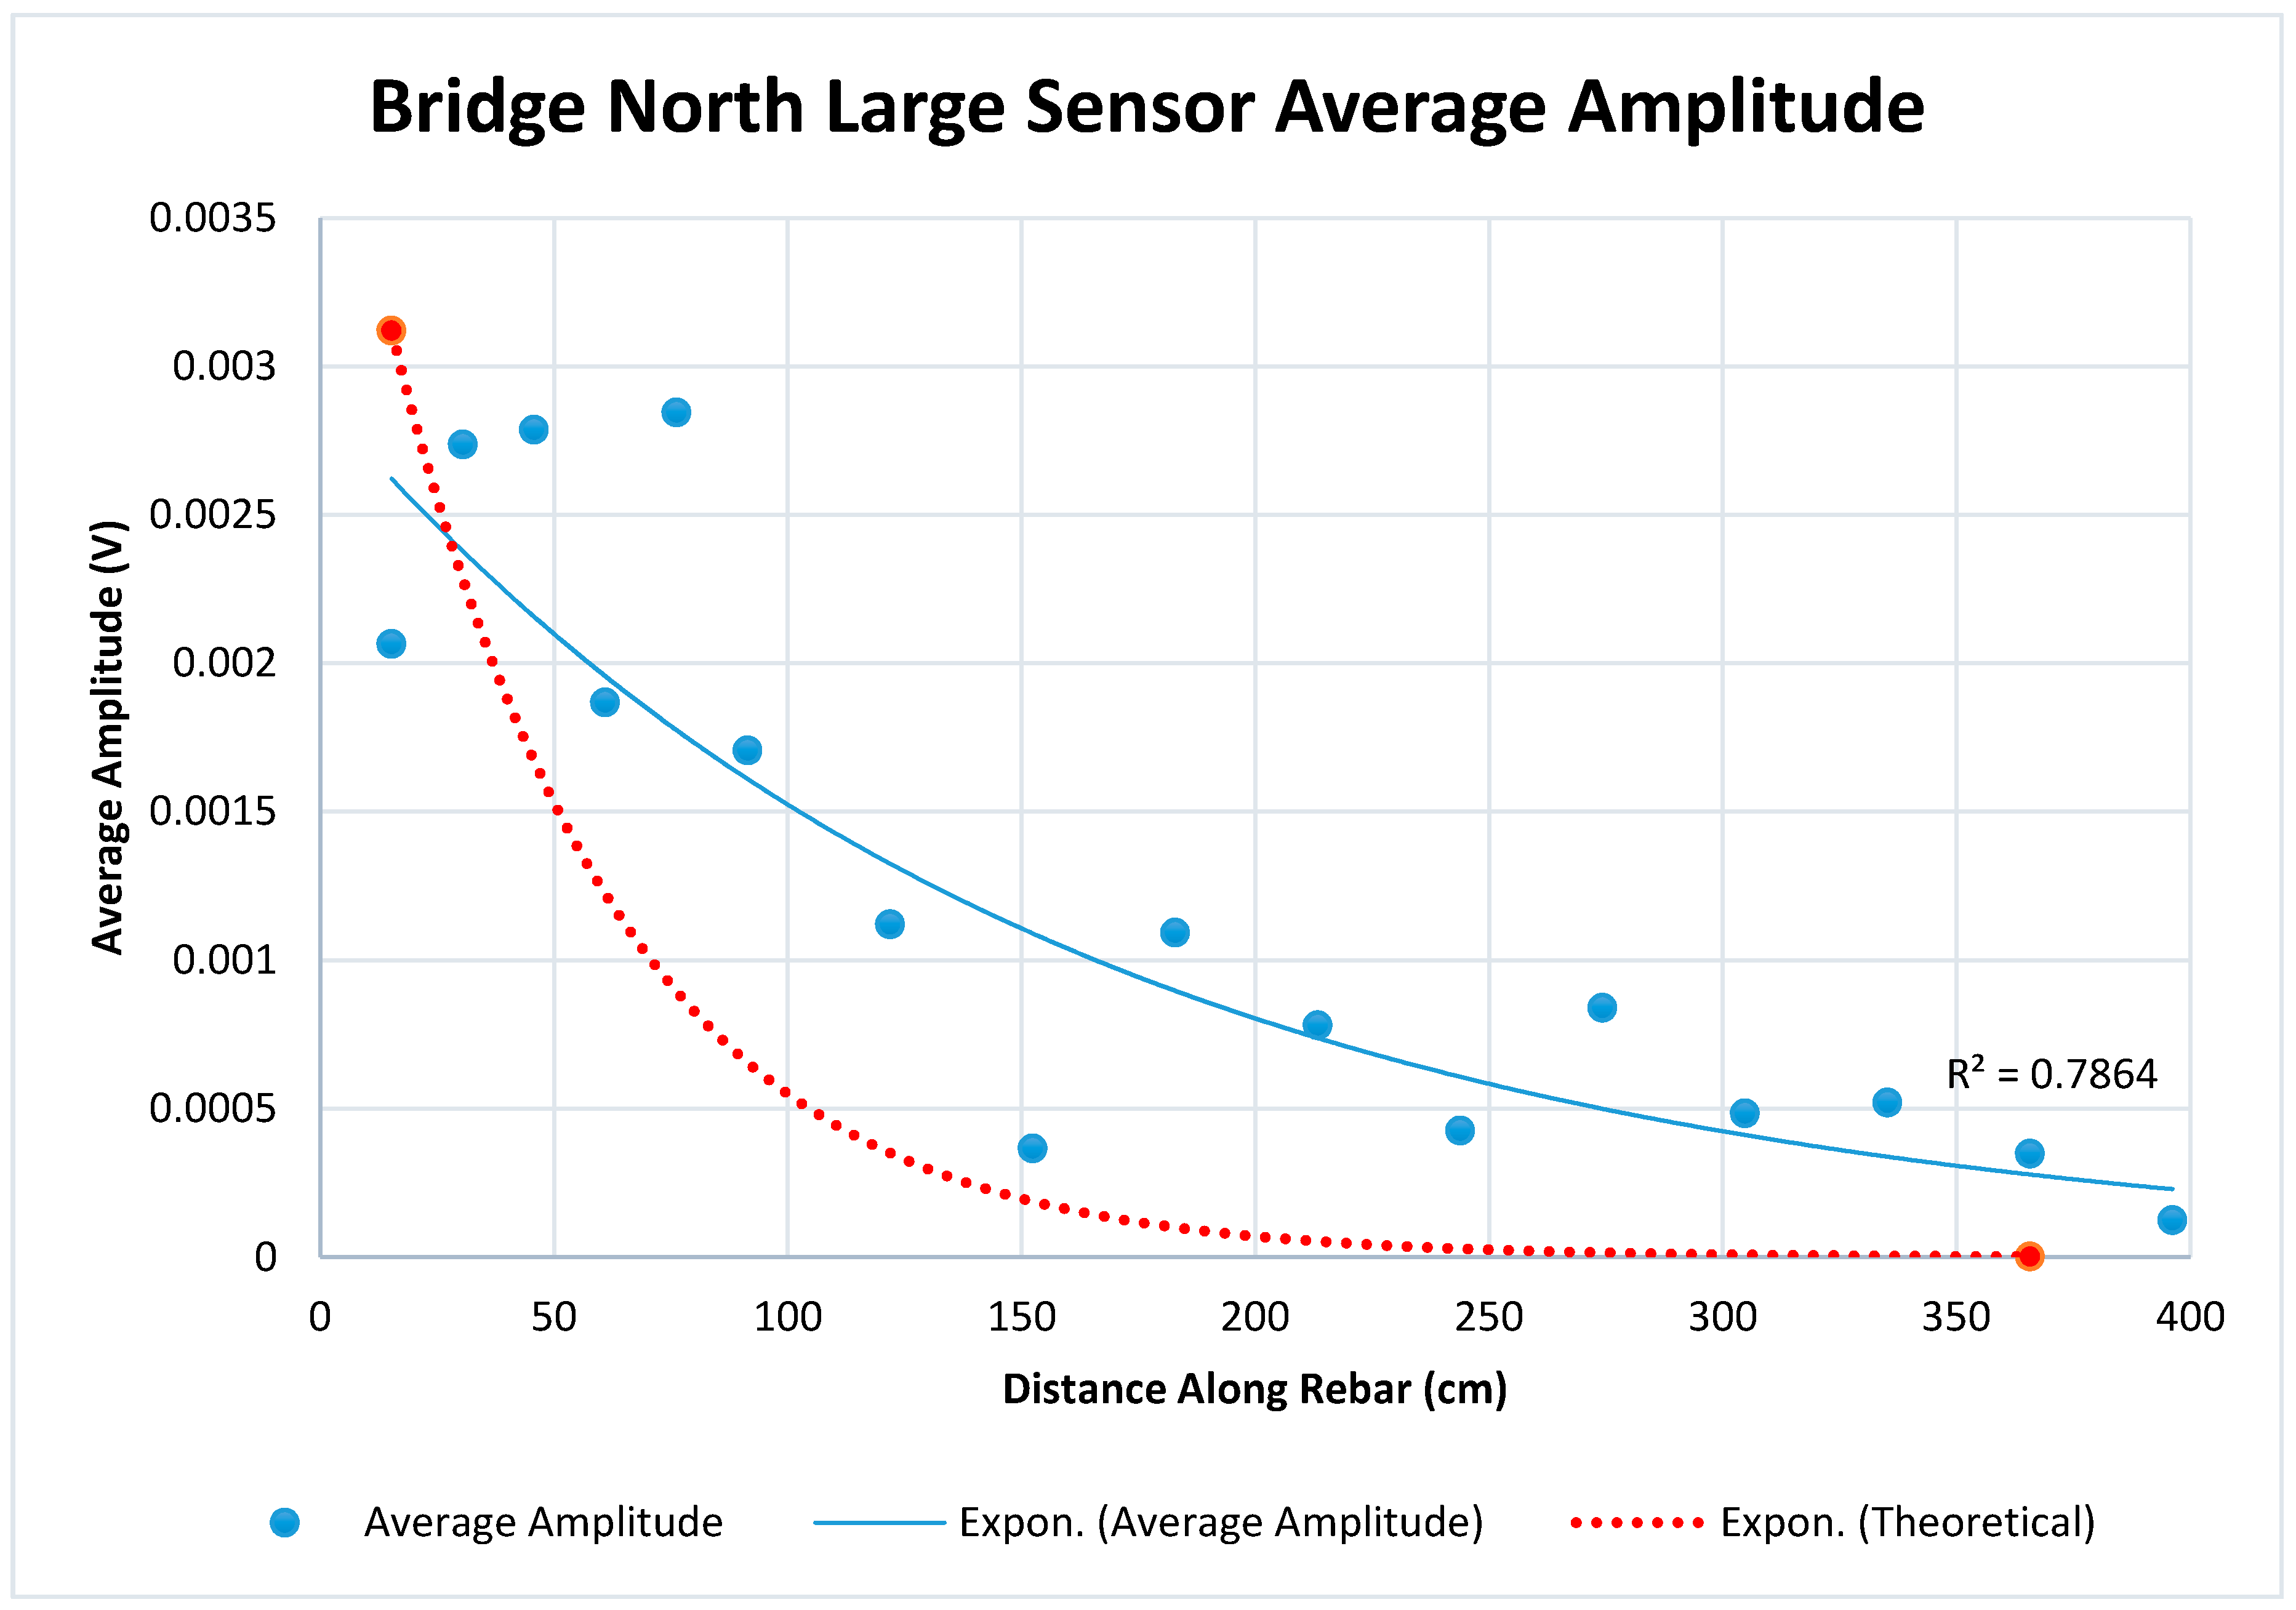
Figure 21 shows the average results (for five readings at each point) for the 5 cm diameter sensor on the north lane. The amplitudes from the smaller sensor were too low to be useful, and it is not recommended for field use without an amplifier. The results from the south lane are very similar; thus, for brevity, they are not represented here.
Observations from this field implementation include the following:
Signals recorded using the 2.5 cm (1 in.) sensor were very weak, even though this approach had worked in the lab.
The 5 cm sensor could collect data up to 427 cm (14 ft.) away from the transmitter, which is greater than the largest distance that was achieved in the lab (limited by specimen size).
Placing the receiver array directly aligned with the bar (from the top of the concrete) resulted in stronger readings than setting them up at an offset.
While signals were great enough to detect, with a perpendicular-to-bar attachment, all of the transmitted energy does not transmit into the rebar in this layout, and other (flexural) modes are excited in addition to longitudinal waves. As a result, the interpretation of data is relatively difficult with very small amplitudes. As such, a mechanism that directs the signal to a direction close to parallel to the rebar needs to be innovated; this was addressed by Specimen Set 3, discussed in the previous section.
Finally, without baseline data, these instantaneous measurements cannot conclusively reveal any flaws in the bridge deck. If the same rebar/locations on the bridge deck were to be tested regularly after this first data set, significant deviations could point out deterioration progression. Hence, the strength of the method is as a continuous monitoring tool, or SHM technique, where small changes due to new or progressing flaws can be detected as the bridge deck ages, but not as an instantaneous inspection method (such as ground penetrating radar, etc.). However, if a significant data pool can be established from various bridge decks with different conditions and over long periods, a quantitative correlation of amplitudes to verified anomalies can be made and the method can also be used for instantaneous inspections of reinforced concrete bridge decks in the future.
4.2. Valparaiso Bridge: New Bridge Deck/Continuous Monitoring Field Study
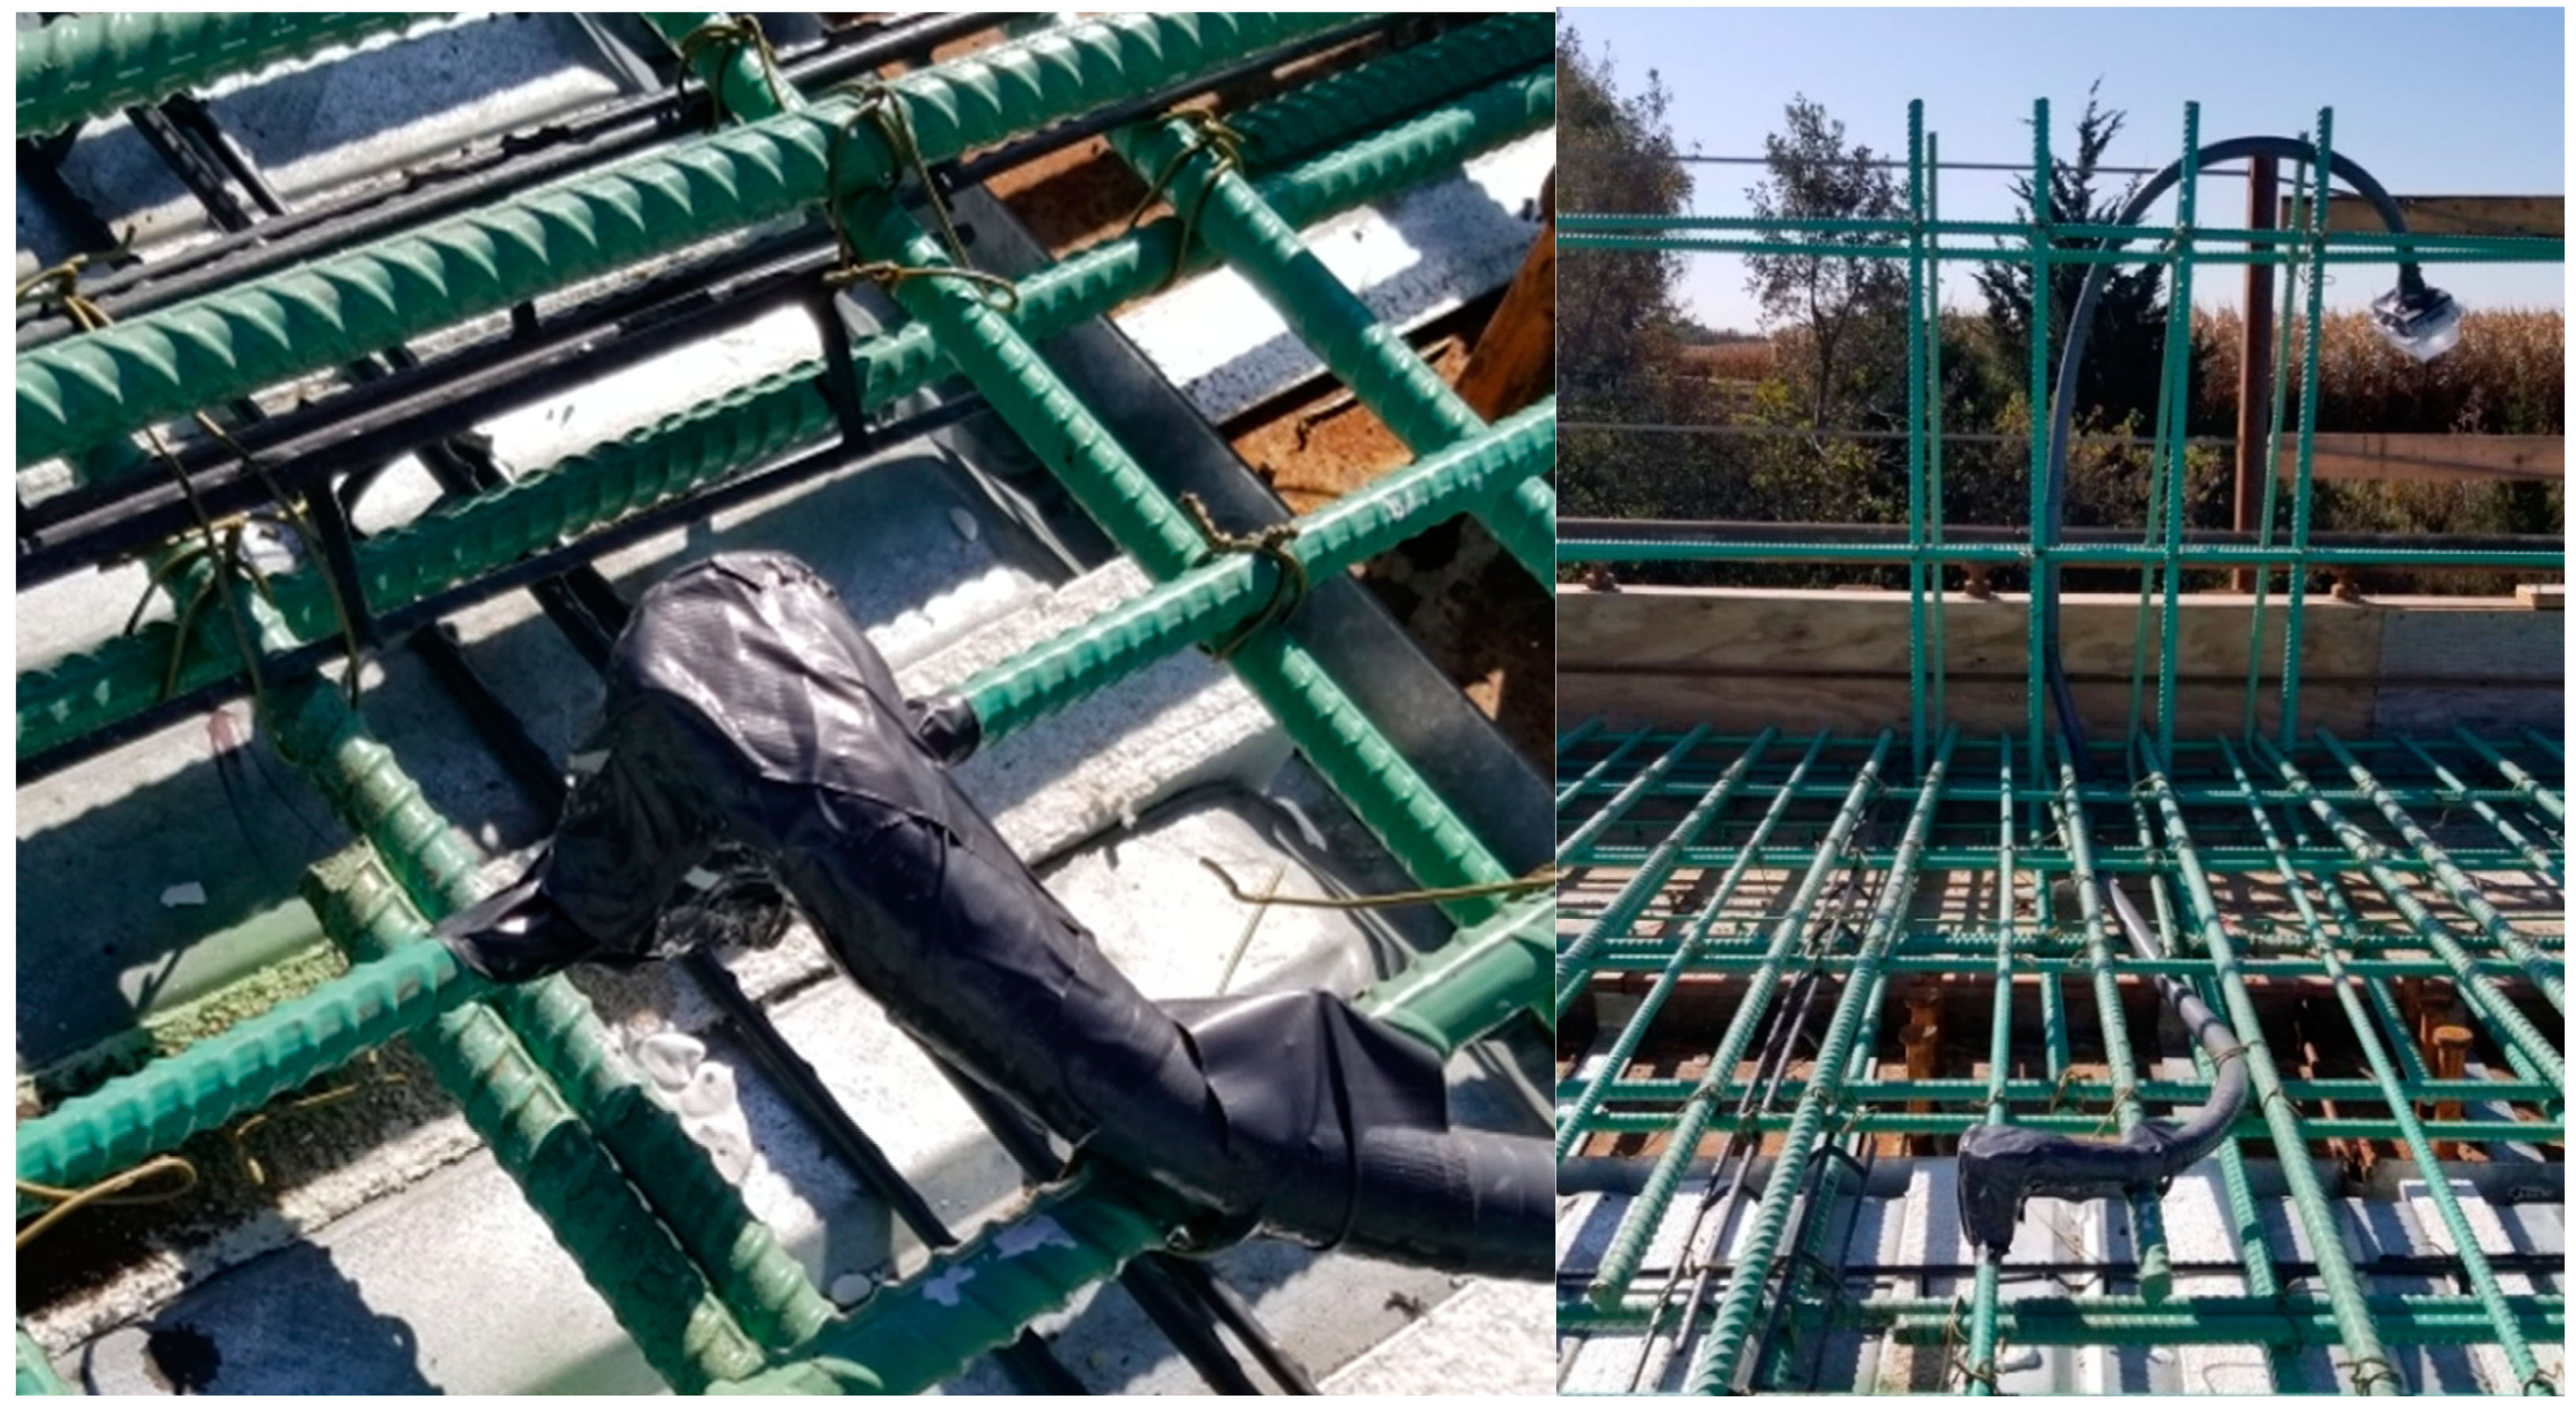
Another field study was performed on the Dwight East Bridge near Valparaiso, Nebraska (henceforth referred to as the “Valparaiso Bridge”). In this study, a sensor was attached to a Number 4 transverse, epoxy-coated rebar on the west side of the bridge deck as shown in
Figure 22. Hydrocal gypsum cement was applied onto the rebar to facilitate permanent attachment of the transmitter to the rebar at that location, and the attachment was wrapped in water-proof duct tape. A BNC RG58 coaxial cable was connected to the sensor at one end, and the other end of the cable was enclosed inside a water-proof box to stay outside on the side of the bridge as shown in
Figure 22. After the arrangement was made, the concrete was poured.
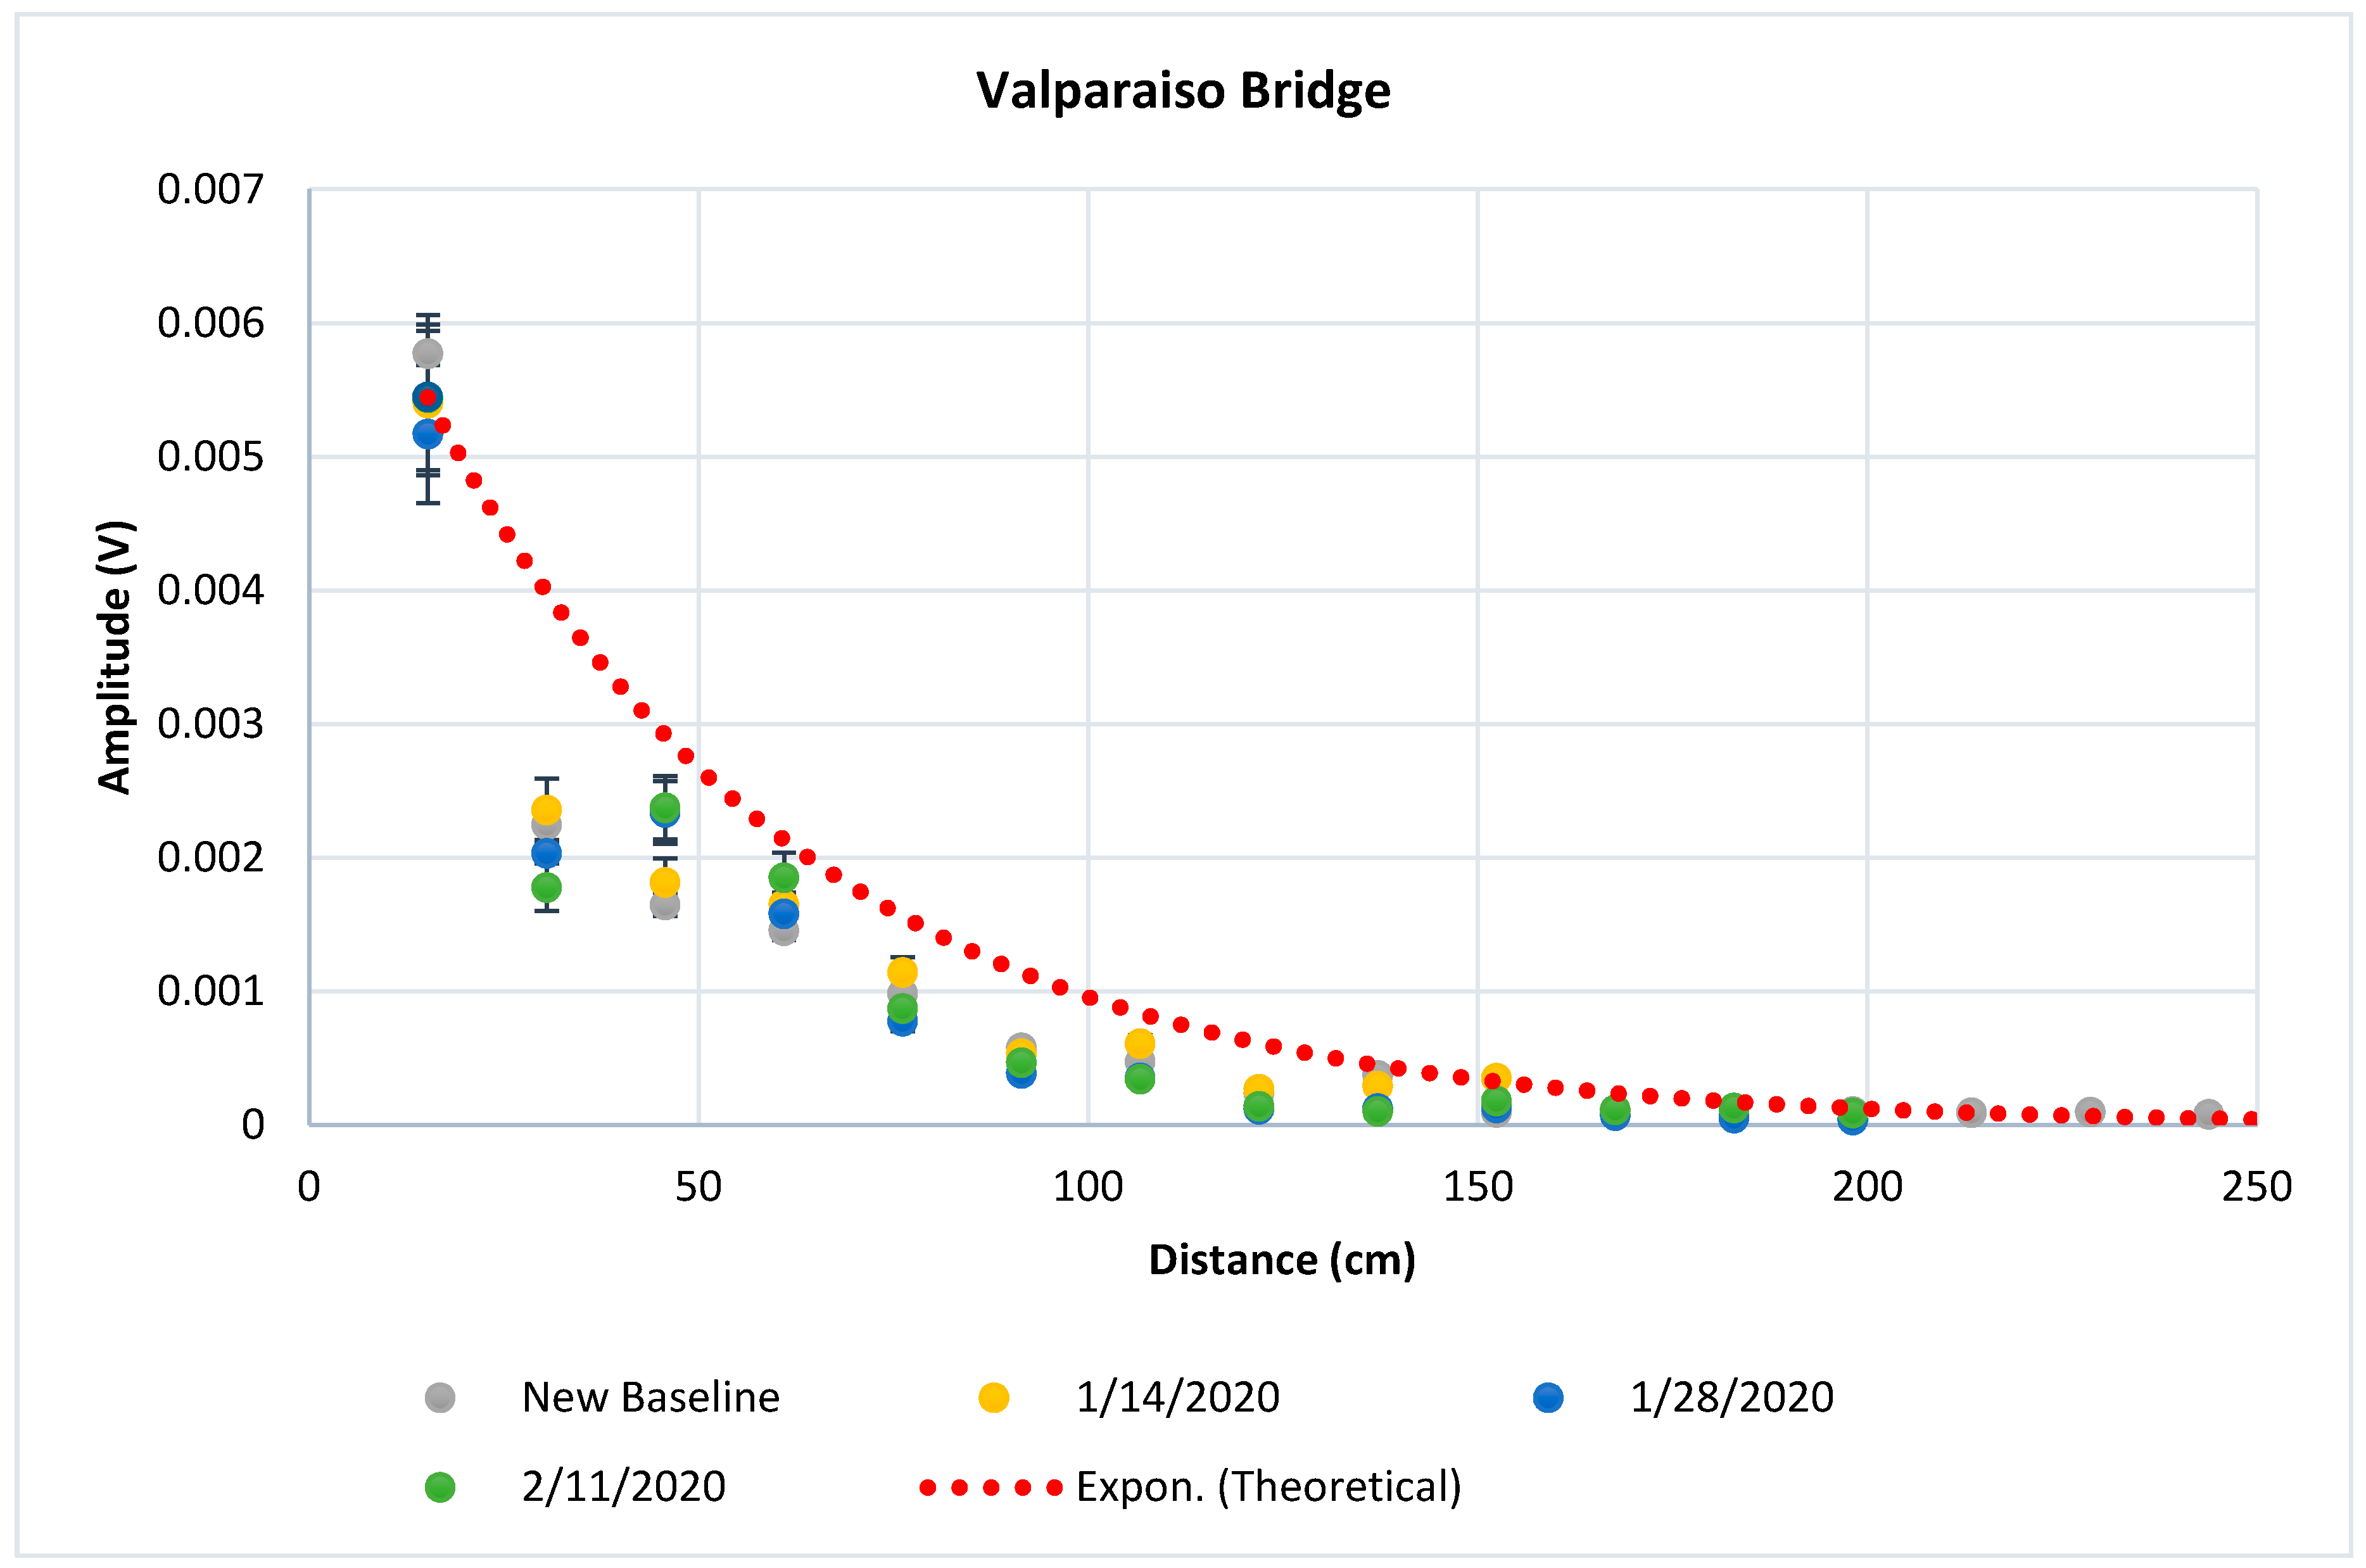
After the curing was complete and the bridge was ready for monitoring, the first set of data (baseline) was collected. The transmitter is located approximately 196 cm (77 in.) from the edge of the bridge, which is the first point for which the measurements are taken. The testing was done along the rebar on the bridge in the transverse direction, covering a full lane and part of the other lane, making a coverage length of 427 cm (14 ft.). Ten data points were collected for each test location for the first few points, where the distance between the transmitter and the receiver is less. This is because the ultrasonic measurements are more sensitive for a shorter distance of travel. For other test locations, as the distance between the transmitter and the receivers increased, five sets of readings were collected for each test location.
Figure 23 shows a combined plot of the data that were collected on different dates along with the baseline data. As expected, in each set, the wave energy attenuates exponentially as the distance between the transmitter and receiver increases. The amplitudes decrease substantially after 91 cm (36 in.), rendering the remaining readings too small for monitoring for small changes. A signal amplifier, if one that matches the appropriate frequency range can be located, may help in the future to increase the gains. In addition, as can be seen in
Figure 22, the transmitter is located close to the intersection of longitudinal and transverse bars, potentially attenuating some energy in both directions and causing the reduced measurement distance in comparison to the Emerald Bridge. Future studies will try to identify locations that are farther from rebar intersections, if possible.
This bridge will continue to be monitored as a long-term SHM study, ideally over a few years, as near-term deterioration is not expected in this brand-new bridge with epoxy-coated bars. In the future, an additional site will also be instrumented—this time ideally a patching project on an older bridge, where some deterioration may occur sooner, and the method can inform the deterioration progression and durability of such repair projects.
5. Conclusions
The lab experiments and pilot field studies herein resulted in valuable findings and improvements for the proposed UGWL method for monitoring the health of reinforced concrete bridge decks.
This paper presents the latest improvements on a novel ultrasonic structural health monitoring method based on ultrasonic guided wave theory. The method uses the steel rebar as a wave guide and measures the leaked energy from the surface of the concrete with an array of sensors; it is named the ultrasonic guided wave leakage method, or UGWL method. Based on the experimental work presented in this paper, the following conclusions can be drawn:
The proposed ultrasonic testing method is a powerful new approach for detecting the onset and progression of corrosion. In addition to detecting the onset of corrosion, the method is capable of locating the corroded region, with careful consideration of leakage angles, as well as the location of the rebar with respect to the receiver array setup. This is significant because the early detection of corrosion activity, as well as identifying its location along the rebar, can help DOTs either take early precautions of maintenance or develop closer monitoring plans for those locations.
The Specimen 1 results also point out the potential of the proposed method in the detection of multiple flaws, such as delamination and corrosion, occurring at different locations along the same rebar, with a single setup.
The Specimen 2 results showed that even with two layers of bidirectional reinforcement, flaws can be detected with this method, with careful consideration of the transmitter and sensor locations.
Previous work investigated the propagation of the guided waves and the measured data (the leaked energy) over a maximum distance of 1.5 m (5 ft.), and the length of this specimen doubled that distance. The Specimen 2 results demonstrated that, in ideal lab conditions (with the transmitter attached at the end of the rebar transmitting all of the energy longitudinally into the wave guide), meaningful readings can be achieved up to 3.0 m (10 ft.), limited by the size of the specimen.
The Specimen 2 experiments also demonstrated that it may be possible to differentiate between delamination and early corrosion, based on the increase and decrease of amplitudes.
With Specimen 3, the use of different bar end angles created a practical lab experiment to test various angles for transmitter-to-rebar attachments. While a 45 degree angle resulted in amplitudes of leaked wave measurements that were too low, a 33 degree angle provided promising results for the UGWL method. It should be noted, however, that when an angled attachment is used, the data interpretation should consider variations in the ultrasonic modes excited, as well as reflections from the boundaries.
Among the attachment materials tested, gypsum affected the efficiency of the energy transfer the least, and due to its inexpensive and fast-setting nature, it is recommended for future use as the binder of choice to connect transmitters to embedded rebars. It should be weather-protected when embedded in concrete.
In terms of couplants, the difference between White Lithium Grease and Ultragel II is not very significant, and either couplant can be used in this method. However, Ultragel II appears to be slightly more efficient in terms of transmitting the energy into the system and receiving the leaked energy from the surface of the concrete.
Field testing trials show great potential for the proposed method as an SHM tool, granted that a durable and efficient embedded attachment method is developed. However, a larger data pool is needed for its use as an instantaneous assessment tool.
The tests in this study showed that epoxy-coated bars still work with wave propagation in a similar manner to uncoated ones, which presents a significant advantage over the half-cell potential (HCP) method commonly used in corrosion detection. It is important to use caution, however, to repair the epoxy coating after grinding for the attachment to ensure that the method remains nondestructive and does not create vulnerable points along the rebar for corrosion.
Based on the lab experiments as well as the pilot field trial presented here, the following setup on a bridge can be recommended:
- o
Up to 427 cm (14 ft.) of detection range can be attempted, given strong signals up to 305 cm (10 ft.) in the lab and 427 cm (14 ft.) in the field in these tests.
- o
Based on the lab results, laterally, receivers located up to 91.5 cm (3 ft.) away from the bar with the transmitter can be investigated, with careful consideration to the angles of leaked waves. However, in reality, the condensed grid of bidirectional reinforcement in bridge decks will likely make it difficult to get useful data from sensor arrays located anywhere other than directly above a rebar.
- o
If relatively accurate location of flaws is desired, a grid of sensors located every 15 cm (6 in.) along the rebar with the transmitter is recommended.
Two key significant and long-term potentials of this method compared to other NDT methods are apparent: (1) very early detection and continuous monitoring of the progression of multiple flaws (corrosion and delamination) with a single setup and (2) the ability to identify the rate and patterns of deterioration in bridge decks from the first sign of corrosion to a detrimental level of delamination (i.e., the level where there would be a need for deck replacement). With such a bridge deck deterioration model, DOTs would save funds by avoiding unnecessarily overlaying a healthy bridge.
6. Discussion
The work presented in this phase of the project prompted further areas of investigation, some of which are being explored by the authors at the time of writing of this article.
Sensor-to-bar attachments at angles of between 0 and 33 degrees should be studied to identify the optimal compromise between data quality and ease of implementation during field implementations.
The combination of gypsum and angled attachment should be studied both in the lab and in the field for efficiency and durability.
Further lab experiments can be done to achieve gypsum attachment directly on the epoxy bar without grinding the bar to achieve a flat and smooth spot.
Further lab experiments can be done to improve the data pool achieved in this study and further confirm the conclusions. Quantitative correlation of the severity of any flaw to the UGWL data is a desired future outcome of this project.
Long-term data from several successful field implementations would lead to the development of highly accurate deterioration models for reinforced concrete bridge decks.
Author Contributions
Conceptualization, E.E., E.G. and M.S.; Investigation, E.E., E.G., A.S.A. and M.S.; Methodology, E.E. and M.S.; Project administration, E.E. and E.G.; Supervision, E.E.; Writing-Original Draft Preparation, E.E.; Writing-Review & Editing, E.E., E.G., A.S.A. and M.S. All authors have read and agreed to the published version of the manuscript.
Funding
This research was funded by the Nebraska Department of Transportation (NDOT), project numbers M066 and M086. Any opinions presented in this paper reflect those of the authors and do not necessarily represent those of the funding agency.
Acknowledgments
The authors also present their deepest gratitude to various undergraduate researchers who participated in this research program: Kelsey Stithem, Monica Houck, Mitchael Sieh, Dylan Thompson, Ben Schnatz, and Uziel Ramos.
Conflicts of Interest
The authors declare no conflict of interest.
References
- Garcia, E.; Erdogmus, E.; Schuller, M.; Harvey, D. Novel Method for the Detection of Onset of Delamination in Reinforced Concrete Bridge Decks. J. Perform. Constr. Facil. 2017, 31, 04017102. [Google Scholar] [CrossRef]
- Garcia, E.; Erdogmus, E.; Schuller, M.; Harvey, D. Detecting Onset of Different Types of Flaws in Reinforced Concrete. ACI Mater. J. 2019, 116, 73–82. [Google Scholar] [CrossRef]
- FHWA. Deficient Bridges by State and Highway System—National Bridge Inventory—Bridge Inspection—Safety—Bridges & Structures—Federal Highway Administration. 2004. Available online: https://www.fhwa.dot.gov/bridge/nbi/no10/defbr14.cfm (accessed on 9 September 2015).
- Cui, J. Multiple Sensor Periodic Nondestructive Evaluation on Concrete Bridge Deck Maintenance. Ph.D. Thesis, University of Vermont, Burlington, VT, USA, 2012. [Google Scholar]
- Yunovich, M.; Thompson, N.G.; Balvanyos, T.; Lave, L. Corrosion Cost and Preventive Strategies in the United States, Appendix D—Highway Bridges; Publication FHWA-RD-01-157; Federal Highway Administration: Washington, DC, USA, 2001.
- Garcia, E.V.C. Identifying the Onset, Type, and Location of Deterioration in Reinforced Concrete Using Ultrasonic Testing. Ph.D. Thesis, University of Nebraska-Lincoln, Lincoln, NE, USA, 2016. [Google Scholar]
- ASTM International. ASTM E494-10 A. Standard Practice for Measuring Ultrasonic Velocity in Materials. Annual Book of ASTM Standards; ASTM International: West Conshohocken, PA, USA, 2010. [Google Scholar]
- Rose, J.L. Ultrasonic Waves in Solid Media; Cambridge University Press: Cambridge, UK; New York, NY, USA, 1999. [Google Scholar]
- Rose, J.L. A baseline and vision of ultrasonic guided wave inspection potential. J. Press. Vessel Technol. 2002, 124, 273–282. [Google Scholar] [CrossRef]
- Miller, T. Nondestructive Inspection of Corrosion and Delamination at the Concrete-Steel Reinforcement Interface. Ph.D. Thesis, The University of Arizona, Tucson, AZ, USA, 2010. [Google Scholar]
- Aranguren, G.; Monje, P.M.; Cokonaj, V.; Barrera, E.; Ruiz, M. Ultrasonic wave-based structural health monitoring embedded instrument. Rev. Sci. Instrum. 2013, 84, 125106. [Google Scholar] [CrossRef]
Figure 1.
Ultrasonic experimental setup.
Figure 1.
Ultrasonic experimental setup.
Figure 2.
Specimen Set 1—the applied corrosion and delamination conditions.
Figure 2.
Specimen Set 1—the applied corrosion and delamination conditions.
Figure 3.
Specimen Set 2 formwork and bars before casting (left) and the final specimen (right).
Figure 3.
Specimen Set 2 formwork and bars before casting (left) and the final specimen (right).
Figure 4.
Specimen Set 2 and various areas of artificially introduced flaws.
Figure 4.
Specimen Set 2 and various areas of artificially introduced flaws.
Figure 5.
Specimen Set 2 sensor locations.
Figure 5.
Specimen Set 2 sensor locations.
Figure 6.
Attachment options: (a) Right to left: coupling via a solder pad, coupling via an epoxy pad curing in sheet metal form, and gypsum cement poured into sheet metal form; (b) Right to left: ground rebar and coupling with white grease, solder and epoxy pads fully cured; (c) Transmitter at the end of the rebar.
Figure 7.
One of the Specimen Set 3 slabs, showing sensor locations.
Figure 7.
One of the Specimen Set 3 slabs, showing sensor locations.
Figure 8.
Bar end angles.
Figure 8.
Bar end angles.
Figure 9.
Amplitude of leaked waves versus sensor location plot for Specimen 1, with the transmitter on the corroded bar (Rebar 1: corrosion in the middle) and receivers 30.48 cm (1 foot) away from the bar.
Figure 9.
Amplitude of leaked waves versus sensor location plot for Specimen 1, with the transmitter on the corroded bar (Rebar 1: corrosion in the middle) and receivers 30.48 cm (1 foot) away from the bar.
Figure 10.
Amplitude of leaked waves versus sensor location plot for Specimen 1, with the transmitter on the corroded bar (Rebar 1) and receivers 91.44 cm (3 ft.) away from the bar (note that the vertical scale of this plot is 2/7 or 28% that of the plot in
Figure 9).
Figure 10.
Amplitude of leaked waves versus sensor location plot for Specimen 1, with the transmitter on the corroded bar (Rebar 1) and receivers 91.44 cm (3 ft.) away from the bar (note that the vertical scale of this plot is 2/7 or 28% that of the plot in
Figure 9).
Figure 11.
Results for corrosive conditions at the beginning of the rebar (Rebar 2) and the measurement array at the concrete edge, 61 cm (2 feet) away from the bar horizontally.
Figure 11.
Results for corrosive conditions at the beginning of the rebar (Rebar 2) and the measurement array at the concrete edge, 61 cm (2 feet) away from the bar horizontally.
Figure 12.
Corrosion and delamination test—Rebar 3: Transmitter located on the corrosion end and receiver array on the concrete edge 30.48 cm (1 ft.) away from the wave guide.
Figure 12.
Corrosion and delamination test—Rebar 3: Transmitter located on the corrosion end and receiver array on the concrete edge 30.48 cm (1 ft.) away from the wave guide.
Figure 13.
Corrosion and delamination test—Rebar 3: Transmitter located on the delamination end and receivers on the concrete edge 30.48 cm (1 ft.) away from the wave guide.
Figure 13.
Corrosion and delamination test—Rebar 3: Transmitter located on the delamination end and receivers on the concrete edge 30.48 cm (1 ft.) away from the wave guide.
Figure 14.
Amplitude versus distance plot for Specimen Set 2 using 1 inch transducers as sensors (an array of three sensors on the left side of slab) when the transmitter is placed on the far-left rebar.
Figure 14.
Amplitude versus distance plot for Specimen Set 2 using 1 inch transducers as sensors (an array of three sensors on the left side of slab) when the transmitter is placed on the far-left rebar.
Figure 15.
Amplitude versus distance plot for Specimen Set 2 using 2 inch transducers as sensors (array of eight sensors) when the transmitter is placed on the far-right rebar.
Figure 15.
Amplitude versus distance plot for Specimen Set 2 using 2 inch transducers as sensors (array of eight sensors) when the transmitter is placed on the far-right rebar.
Figure 16.
Comparison of the peak amplitudes and attenuation curves for the 0, 33, and 45 degree specimens.
Figure 16.
Comparison of the peak amplitudes and attenuation curves for the 0, 33, and 45 degree specimens.
Figure 17.
Plot obtained from the 0 degree specimen for comparison between Ultragel II and White Lithium Grease.
Figure 17.
Plot obtained from the 0 degree specimen for comparison between Ultragel II and White Lithium Grease.
Figure 18.
Hydrocal gypsum cement placed on top of the rebar to improve the coupling condition.
Figure 18.
Hydrocal gypsum cement placed on top of the rebar to improve the coupling condition.
Figure 19.
Left: Measurements from the cored 45 degree specimen with transmitter attached perpendicularly to the bar with Hydrocal gypsum (as shown in
Figure 18). Right: Measurements from the 45 degree specimen with transmitter coupled with WLG at a 45 degree angle to the longitudinal axis of the rebar from the end.
Figure 20.
Images from pilot field work.
Figure 20.
Images from pilot field work.
Figure 21.
Sample results from Emerald Bridge pilot field testing.
Figure 21.
Sample results from Emerald Bridge pilot field testing.
Figure 22.
Valparaiso Bridge instrumentation. Left: gypsum seat attachment of the ultrasonic transmitter wrapped in duct tape. Right: the sensor cable was protected in protective plastic pipe and ran to the shoulder of the bridge.
Figure 22.
Valparaiso Bridge instrumentation. Left: gypsum seat attachment of the ultrasonic transmitter wrapped in duct tape. Right: the sensor cable was protected in protective plastic pipe and ran to the shoulder of the bridge.
Figure 23.
Baseline data versus other days for Valparaiso Bridge.
Figure 23.
Baseline data versus other days for Valparaiso Bridge.
Table 1.
Properties of the 47BD Mix Design used by the Nebraska Department of Transportation (NDOT).
Table 1.
Properties of the 47BD Mix Design used by the Nebraska Department of Transportation (NDOT).
| Designation | Total Cementitious Material Min. (lb/cy) | Total Aggregate (lb/cy) | Air Content Range (%) | Maximum Water/Cement Ratio (lb/lb) | Minimum Required Strength (psi) |
|---|
| AASHTO Bridge Specification | 611 | 1.0-No.4 | 6 ± 1.5 | 0.49 | 4.00 |
| 47BD NDOT | 658 | 1.0-No.4 | 6.0–8.5 | 0.42 | 4.00 |
Table 2.
Results of Specimen Set 3a experiments.
Table 2.
Results of Specimen Set 3a experiments.
| Transmitter Position | Path Length (m) | % Full Scale |
|---|
| End of bar | 1 | 43 |
| Flat ground area | 0.94 | 4.6 |
| Lead solder pad | 0.86 | 18 |
| Steel-filled JB Weld epoxy | 0.746 | 23 |
| Hydrocal gypsum | 0.63 | 32 |
© 2020 by the authors. Licensee MDPI, Basel, Switzerland. This article is an open access article distributed under the terms and conditions of the Creative Commons Attribution (CC BY) license (http://creativecommons.org/licenses/by/4.0/).


