
Analysis of Road Users’ Risk Behaviors in Different Travel Modes: The Bangkok Metropolitan Region, Thailand


Abstract
:1. Introduction
2. Literature Review
2.1. Impact of Driver Behavior on Road Safety
2.2. Risk Behaviors of Road Users in Different Travel Modes
3. Methodology
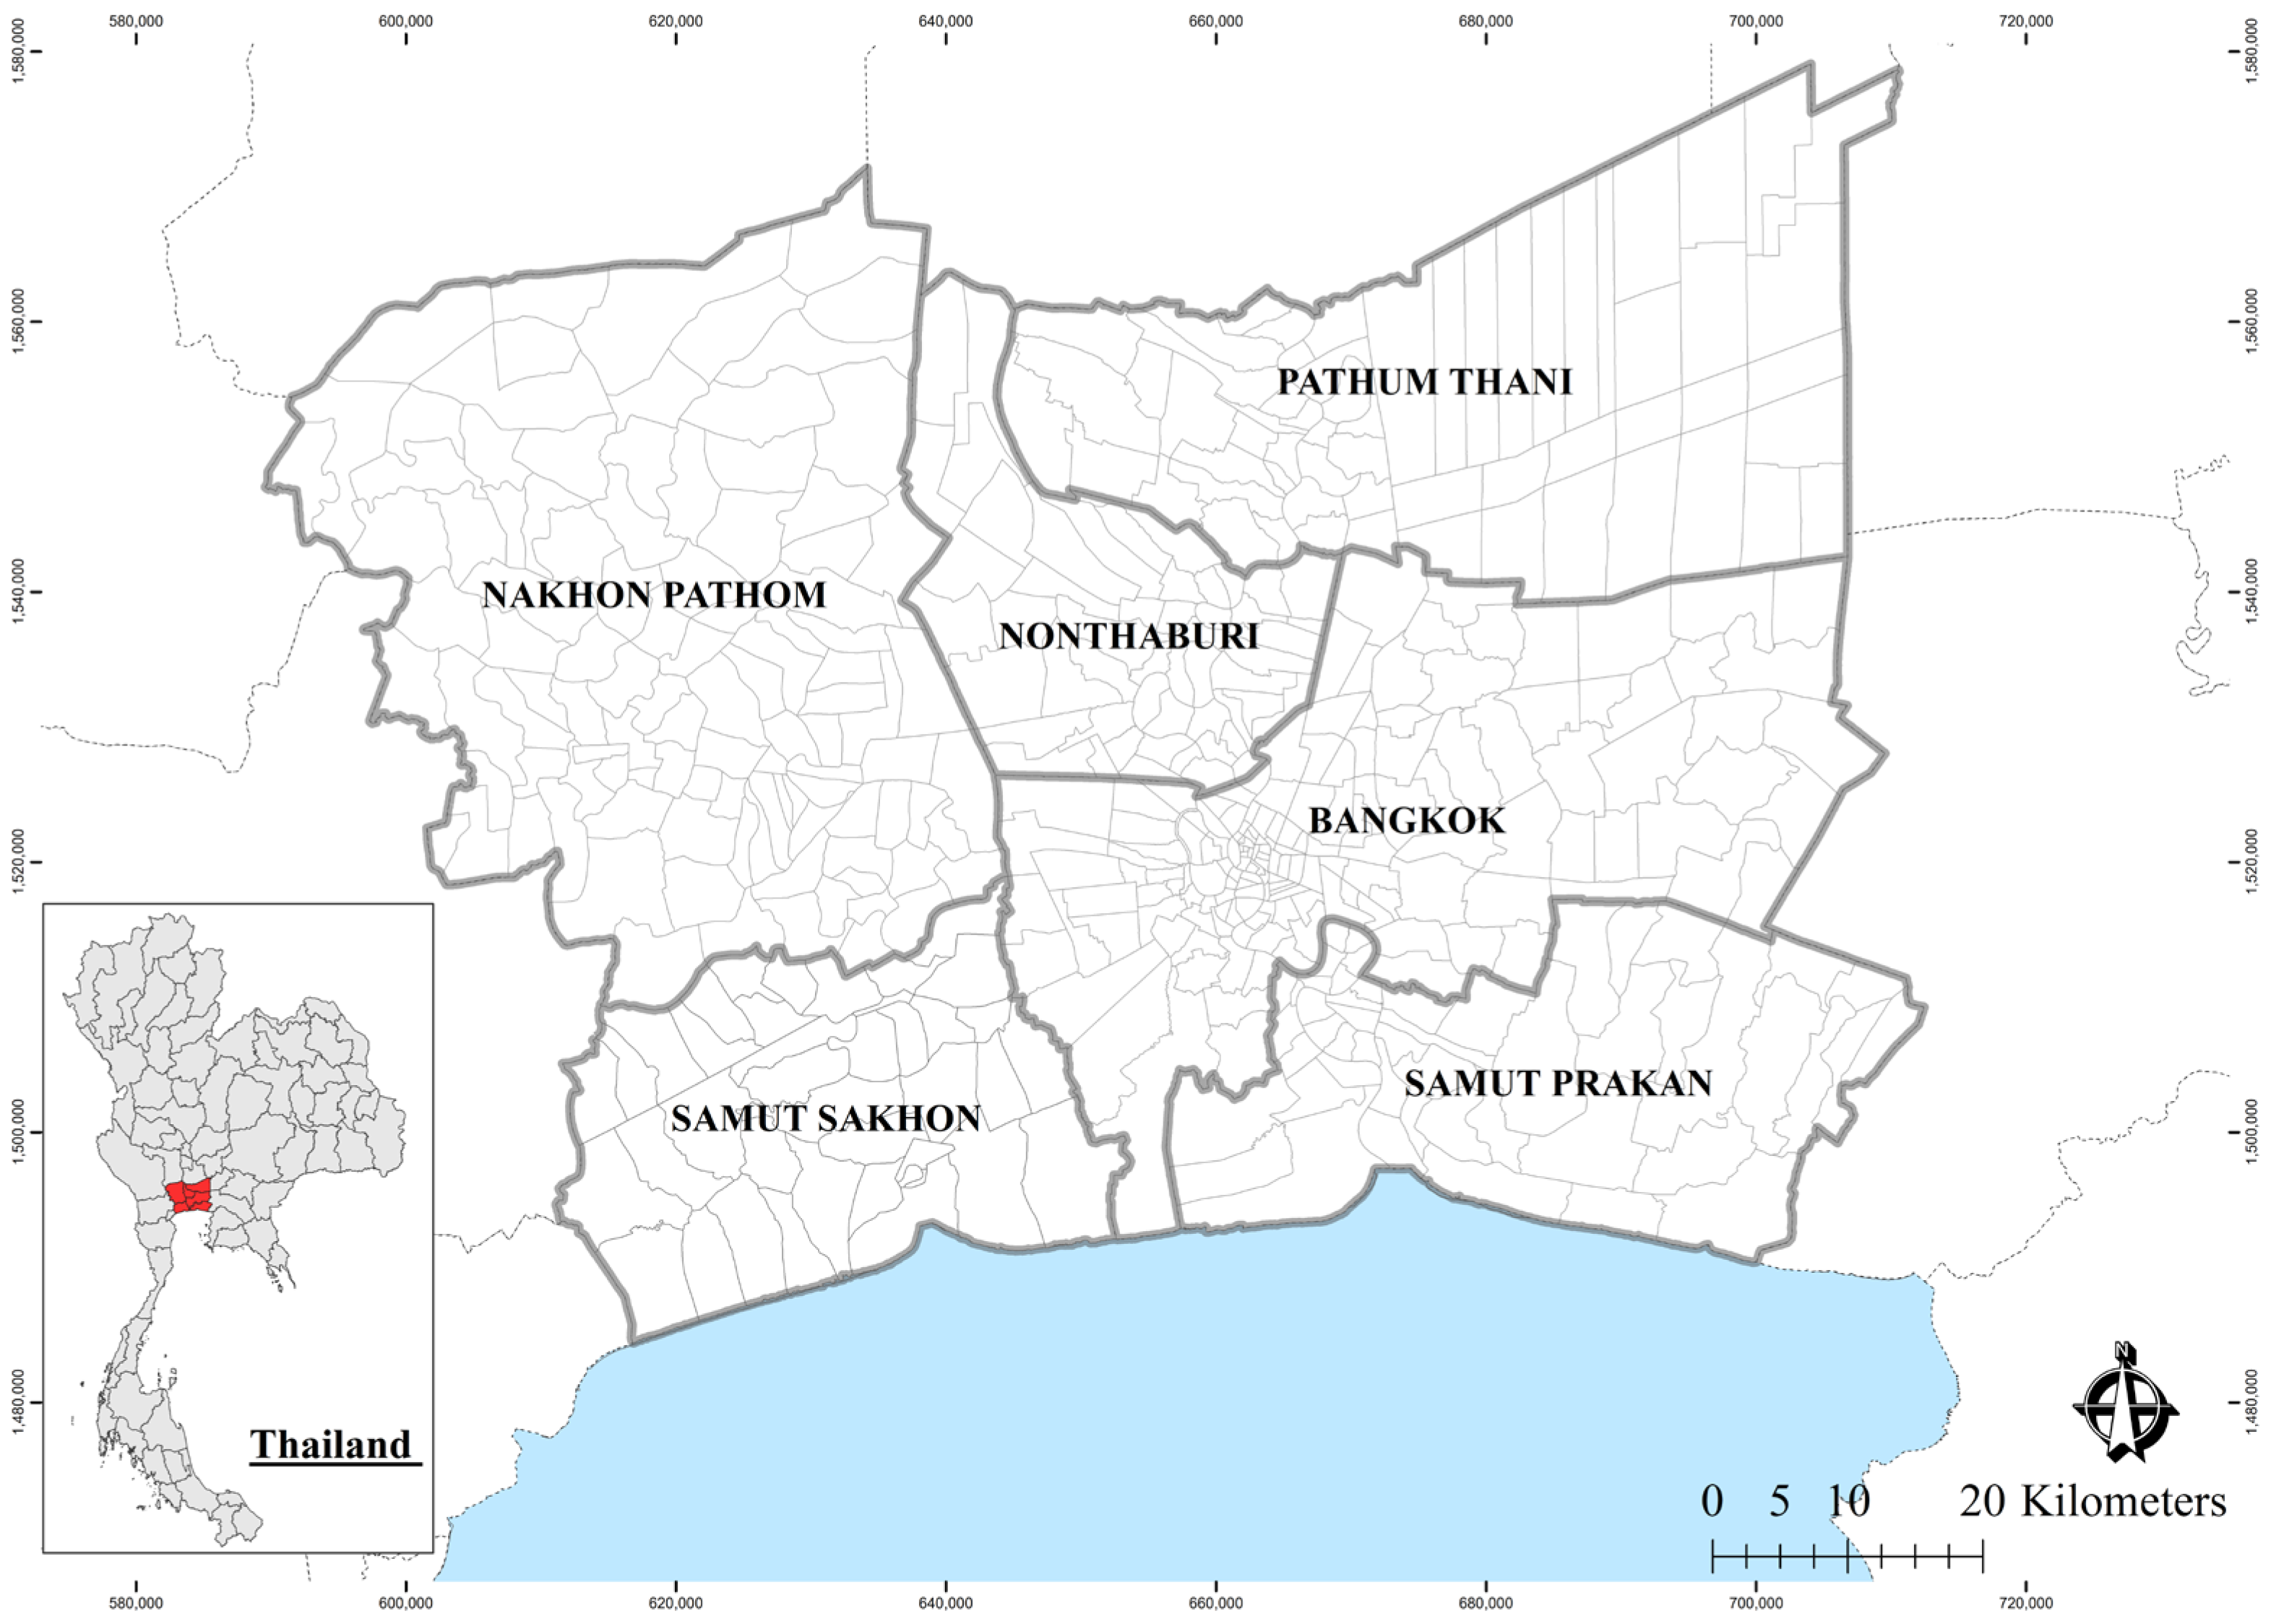
3.1. Study Area
3.2. Data Collection
- Screen respondents to include only those who have driven or ridden on the roads within the study area within the last year.
- Obtain consent from the respondents.
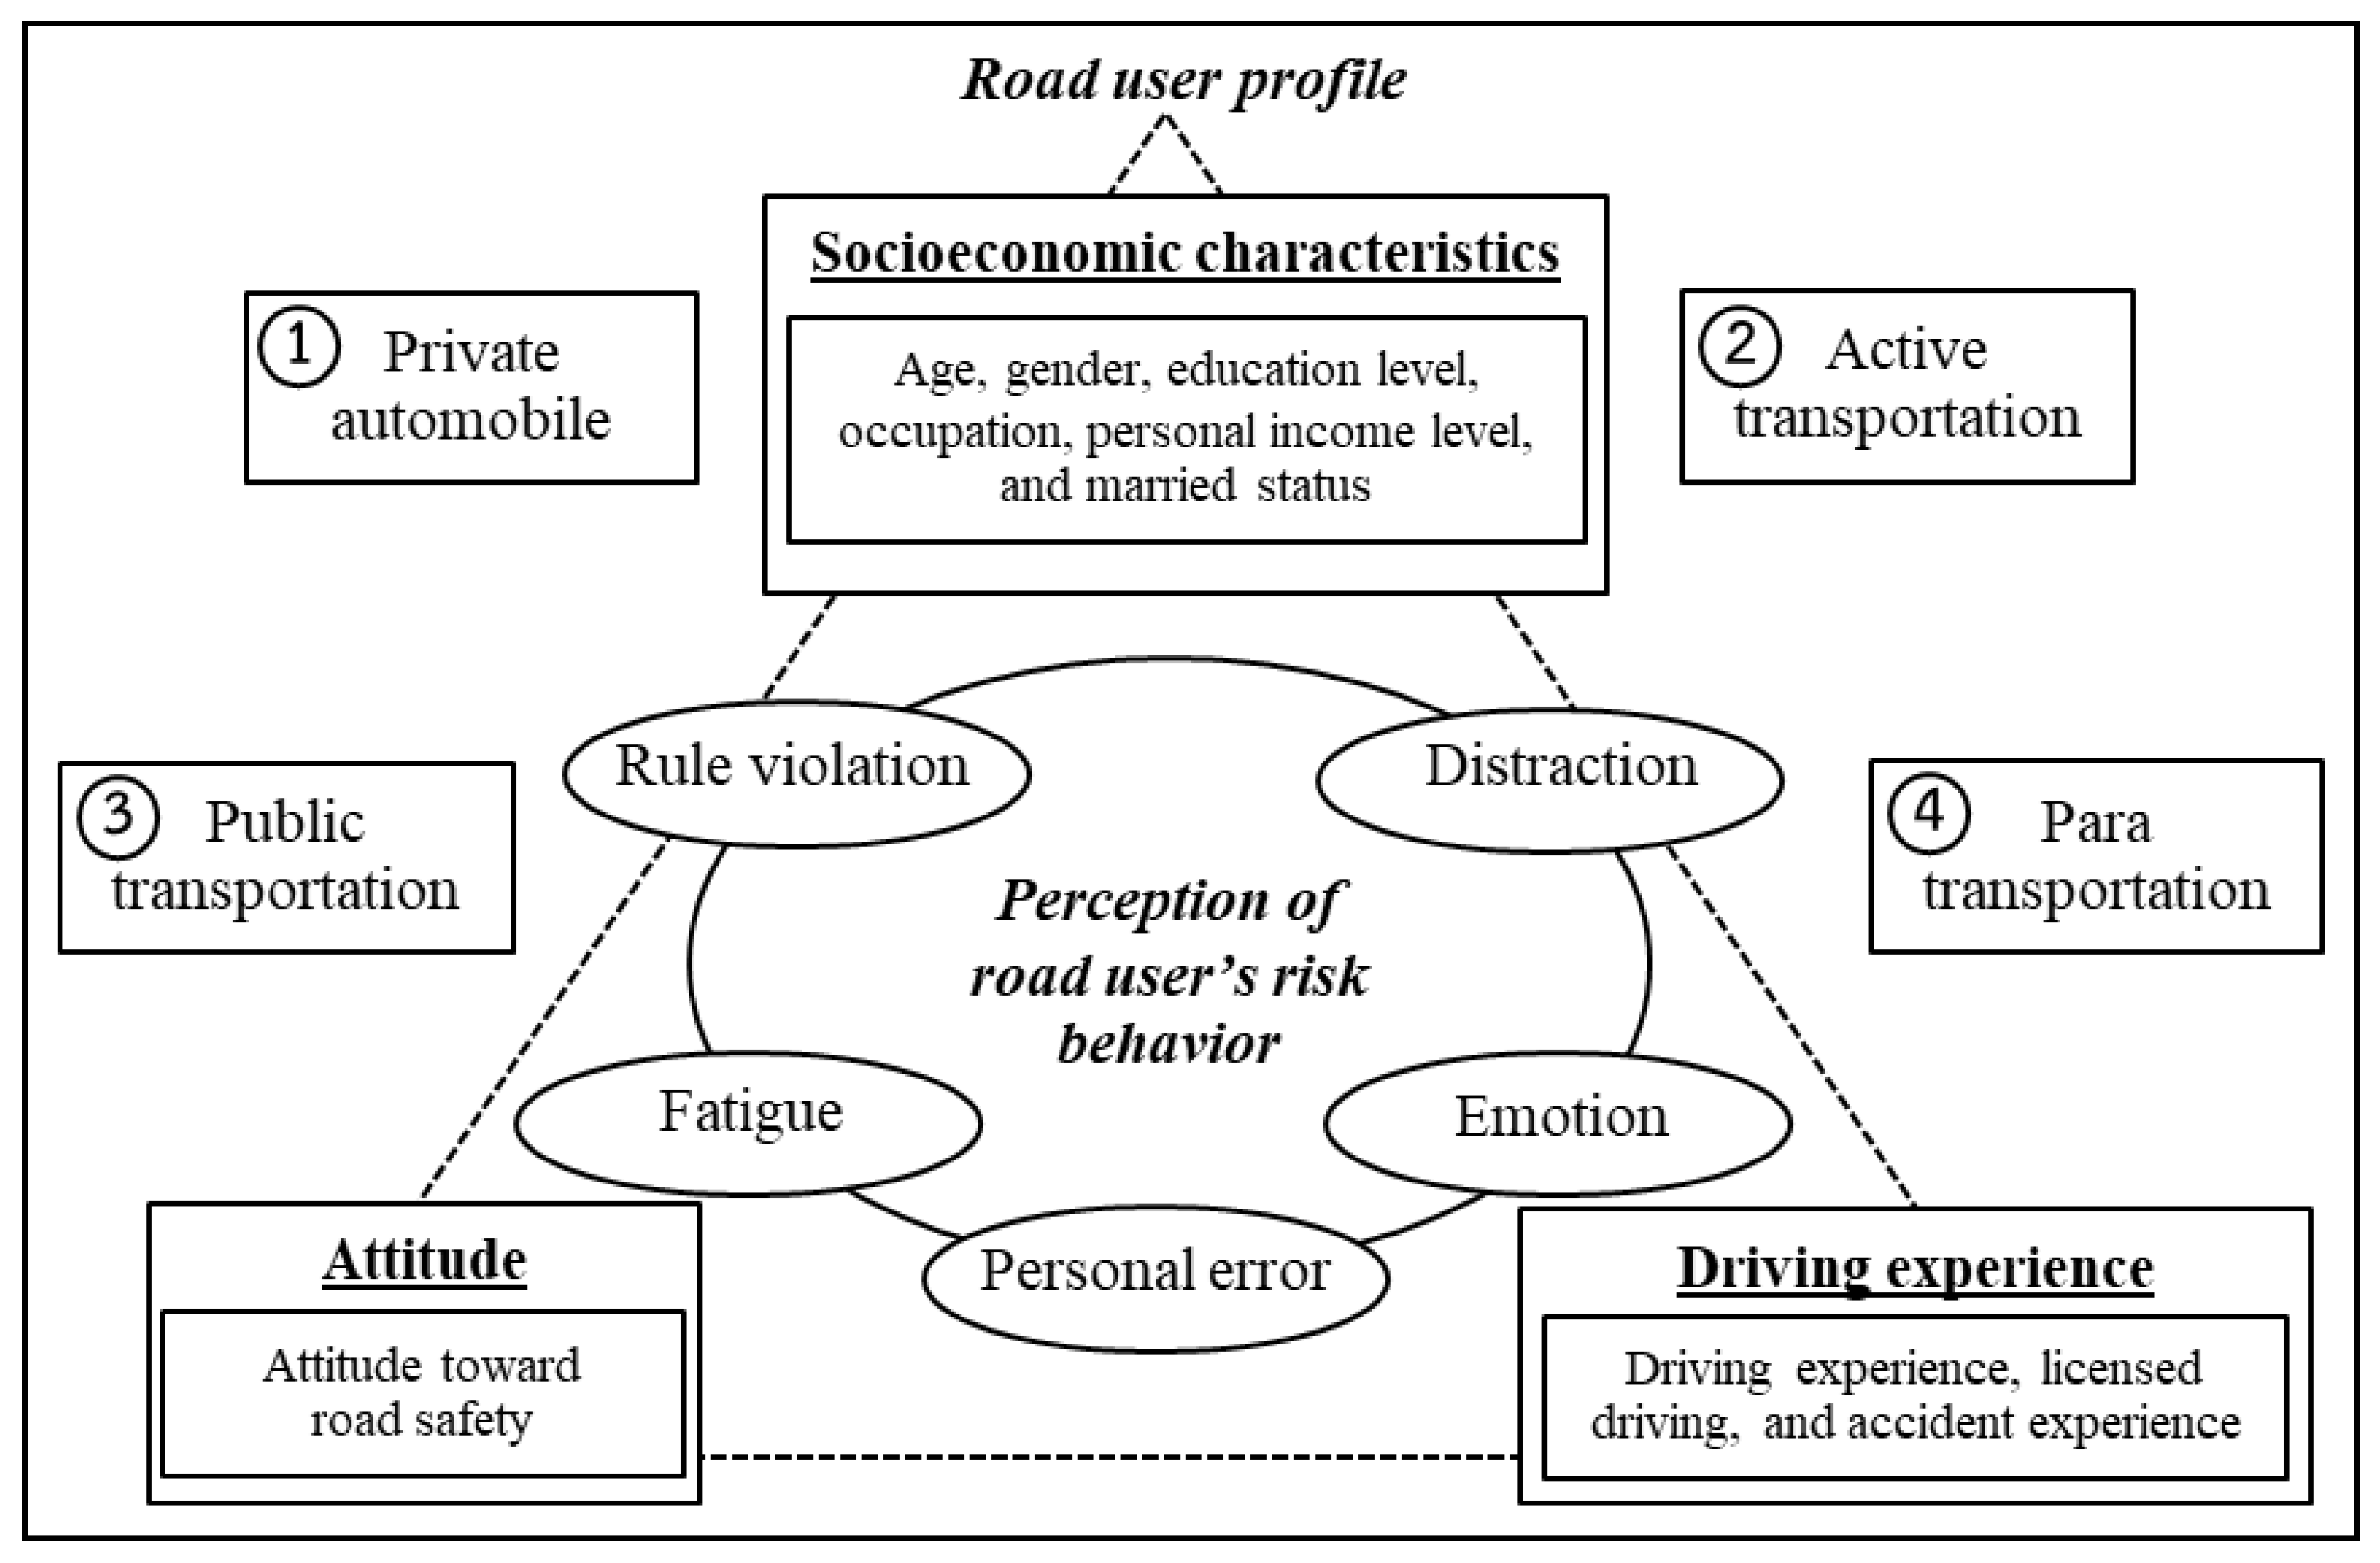
- Construct road user profiles: socioeconomic characteristics (age, gender, education level, occupation, personal income level, and married status), attitude toward road safety, and driving experience (driving experience, possession of driving license, and accident experience).
- Assess their risk behavior perception: rule violation behaviors (illegal crossing, opposing driving lane usage, riding a motorcycle on a sidewalk, illegal U-turn, speeding, not slowing down in critical zones, illegal parking, running a red light, not using a seatbelt, overloading, driving after drinking alcohol, and not using a helmet), distraction behaviors (using a cell phone, listening to music, and smoking or eating while driving), fatigue (driving while taking drugs which can cause drowsiness), emotion (driving while aggressive or angry), and finally, personal errors (close following, not turning lights on, braking suddenly, driving so as to interfere with other vehicles).
3.3. Analysis
4. Results
4.1. Socioeconomic Profile
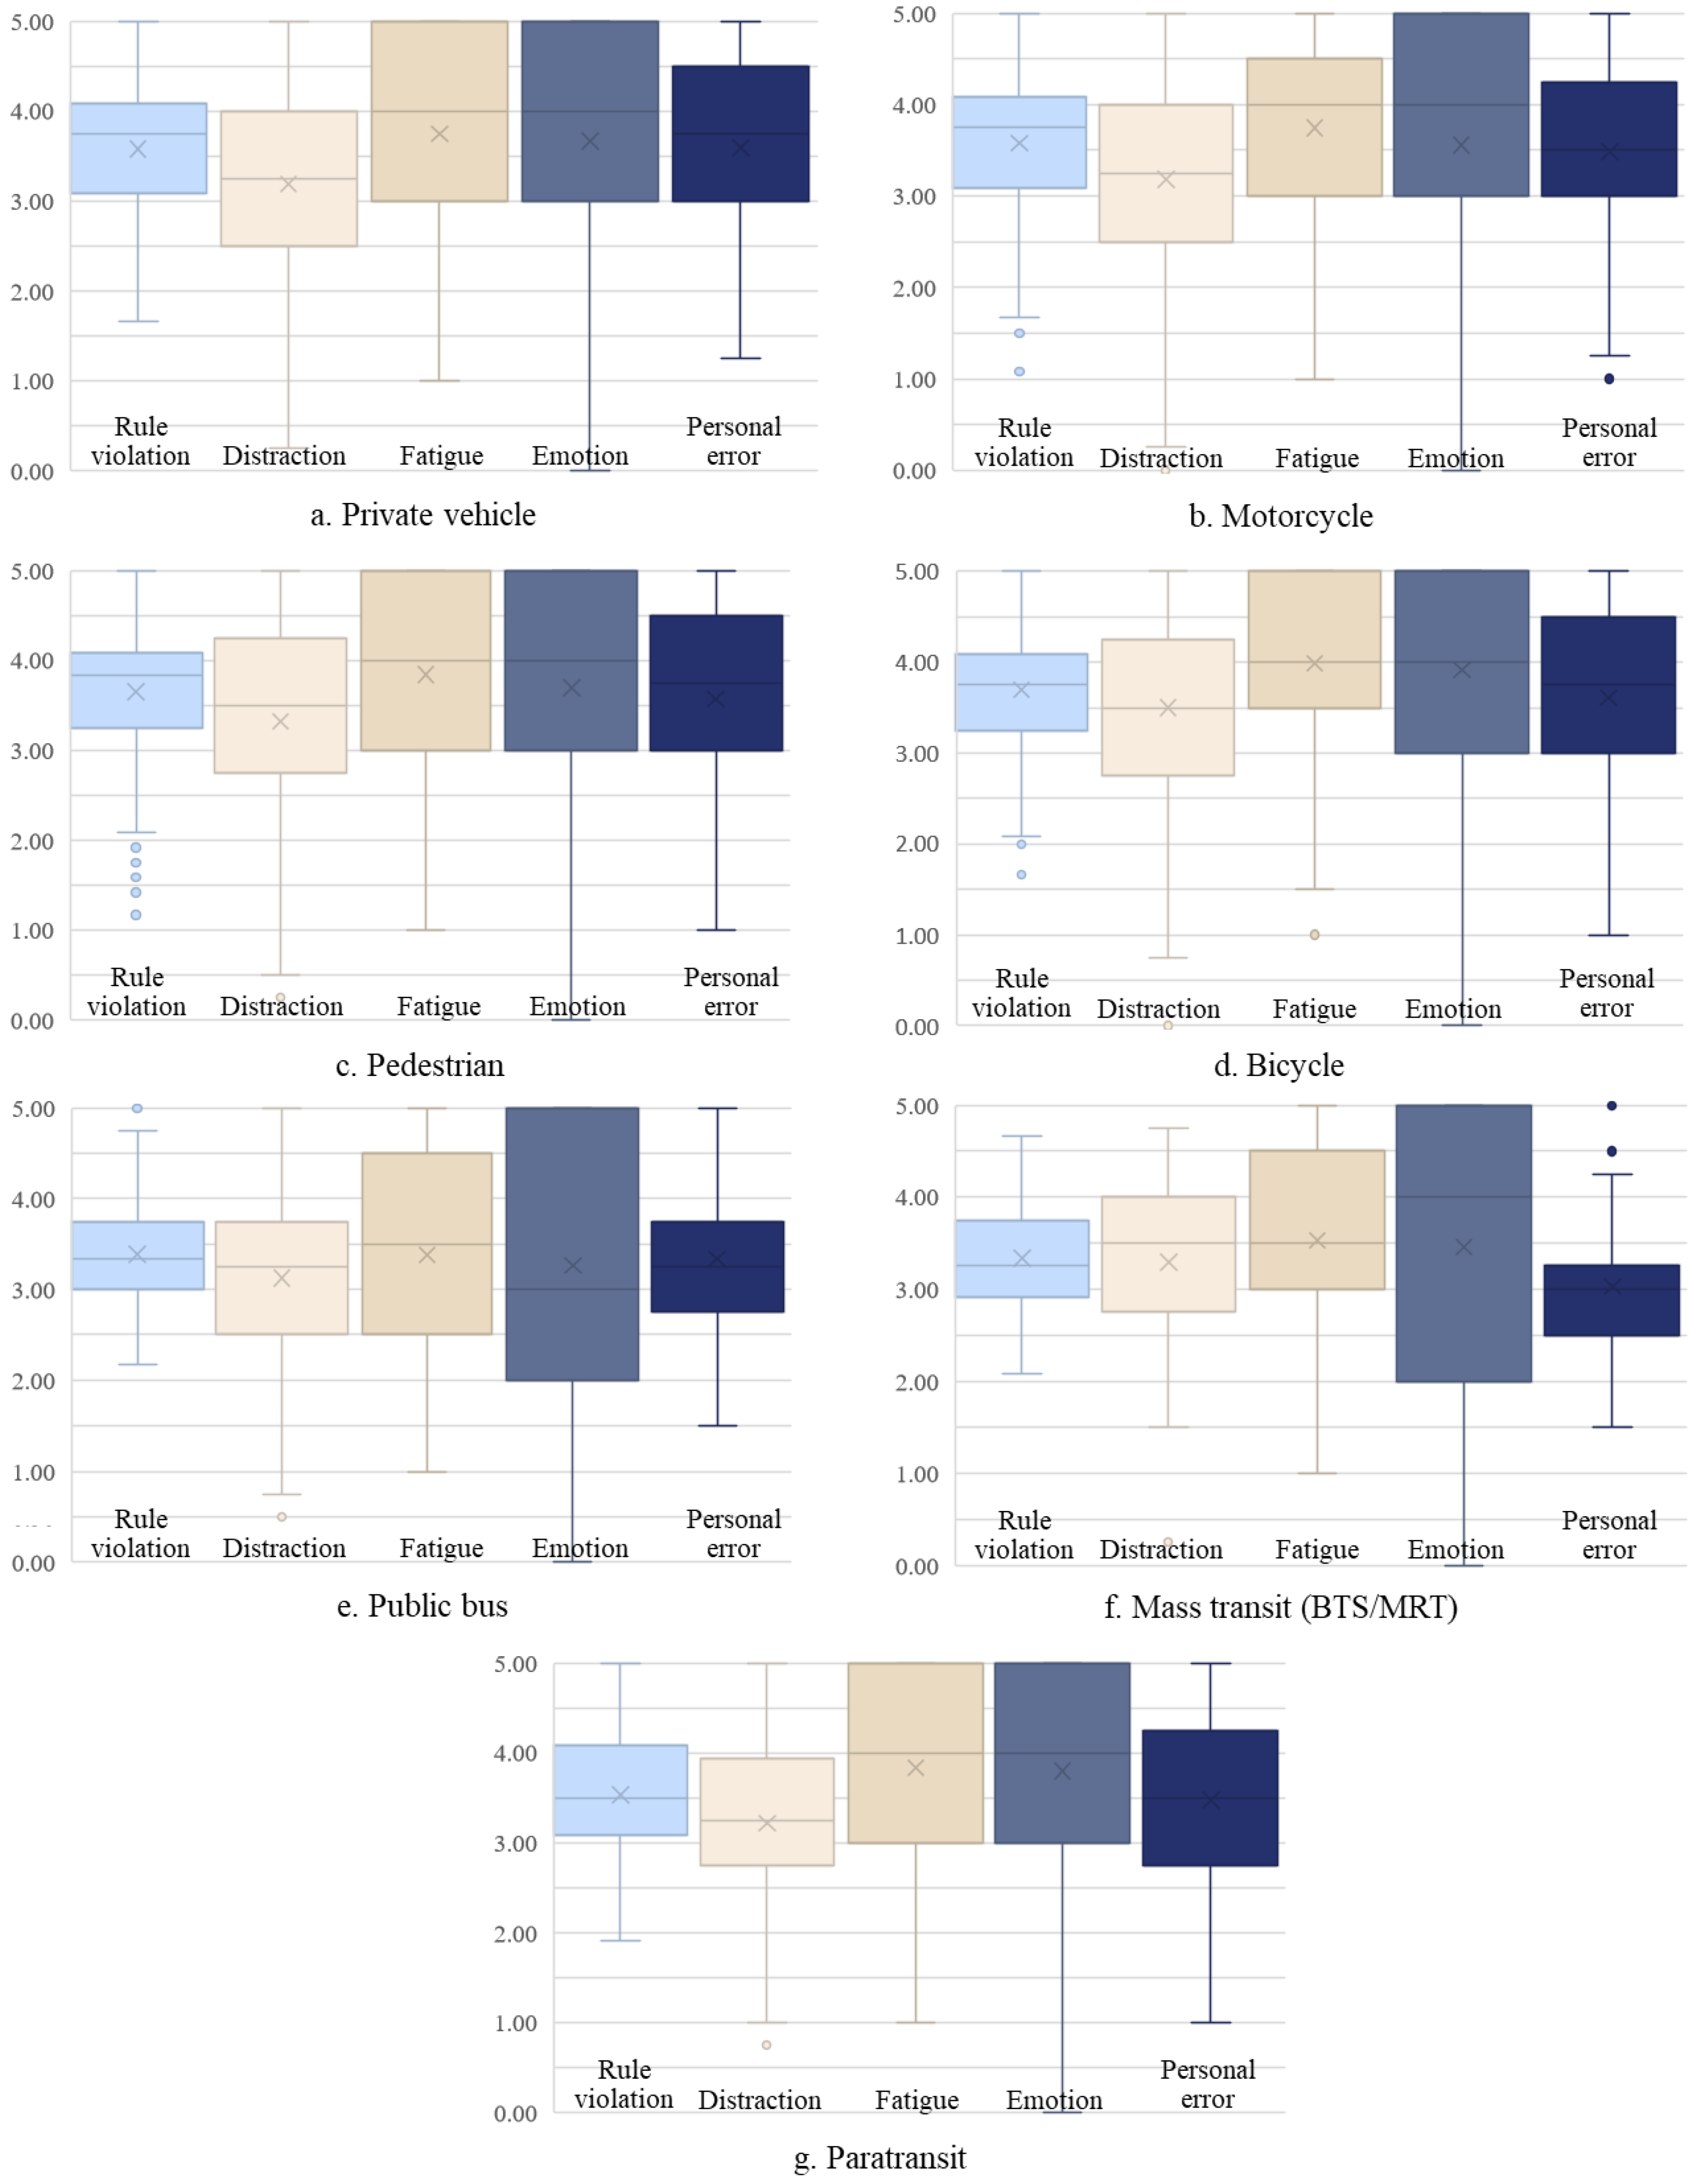
4.2. Perception of Risk Behaviors and Travel Modes
- Rule violation;
- Distraction (using a cell phone, listening to music, driving while smoking or eating);
- Fatigue (due to taking drugs, driving when sleepy);
- Emotion (when angry or aggressive);
- Personal error (following too closely, no use of turn signal, interfering with other vehicles).
4.3. Risk Behavior on Differences in Travels Modes
5. Discussion
6. Conclusions
Author Contributions
Funding
Institutional Review Board Statement
Informed Consent Statement
Data Availability Statement
Acknowledgments
Conflicts of Interest
References
- Eid, M.; Larsen, R. The Science of Subjective Wellbeing; The Guilford Press: New York, NY, USA; London, UK, 2008. [Google Scholar]
- Santacreu, A. Safer City Streets Global Benchmarking for Urban Road Safety. In International Transport Forum Working Document; OECD Publishing: Paris, France, 2018. [Google Scholar]
- IRTAD. Road Safety Annual Report 2014; International Traffic Safety Data and Analysis Group: Paris, France, 2014. [Google Scholar]
- Tournier, C.; Charnay, P.; Tardy, H.; Chossegros, L.; Carnis, L.; Hours, M. A few seconds to have an accident, a long time to recover: Consequences for road accident victims from the ESPARR cohort 2 years after the accident. Accid. Anal. Prev. 2014, 72, 422–432. [Google Scholar] [CrossRef]
- Ashkanani, H.R. The relationship between religiosity and subjective well-being: A case of Kuwaiti car accident victims. Traumatology 2009, 15, 23–28. [Google Scholar] [CrossRef]
- Kovacevic, J.; Fotez, I.; Miskulin, I.; Lesic, D.; Miskulin, M.; Berlancic, T.; Vukoja, I.; Candrlic, S.; Palenkic, H.; Candrlic, M. Different Patterns of Mental Health Outcomes among Road Traffic Crash Survivors: A Prospective Cohort Study. Int. J. Environ. Res. Public Health 2021, 18, 1564. [Google Scholar] [CrossRef] [PubMed]
- World Health Organization. Road Traffic Injuries. 2022. Available online: https://www.who.int/news-room/fact-sheets/detail/road-traffic-injuries (accessed on 1 January 2023).
- World Health Organization. Decade of Action for Road Safety 2021–2030. 2021. Available online: https://www.who.int/teams/social-determinants-of-health/safety-and-mobility/decade-of-action-for-road-safety-2021-2030 (accessed on 1 January 2023).
- Mannering, F.L.; Shankar, V.; Bhat, C.R. Unobserved heterogeneity and the statistical analysis of highway accident data. Anal. Methods Accid. Res. 2016, 11, 1–16. [Google Scholar] [CrossRef]
- Scholes, S.; Wardlaw, M.; Anciaes, P.; Heydecker, B.; Mindell, J.S. Fatality rates associated with driving and cycling for all road users in Great Britain 2005–2013. J. Transp. Health 2018, 8, 321–333. [Google Scholar] [CrossRef]
- Aldred, R.; Johnson, R.; Jackson, C.; Woodcock, J. How does mode of travel affect risks posed to other road users? An analysis of English road fatality data, incorporating gender and road type. Inj. Prev. 2020, 27, 71–76. [Google Scholar] [CrossRef]
- Teschke, K.; Harris, M.A.; Reynolds, C.C.O.; Shen, H.; Cripton, P.A.; Winters, M. Exposure-based Traffic Crash Injury Rates by Mode of Travel in British Columbia. Can. J. Public Health 2013, 104, e75–e79. [Google Scholar] [CrossRef] [PubMed]
- Bouaoun, L.; Haddak, M.M.; Amoros, E. Road crash fatality rates in France: A comparison of road user types, taking account of travel practices. Accid. Anal. Prev. 2015, 75, 217–225. [Google Scholar] [CrossRef] [PubMed]
- Mindell, J.S.; Leslie, D.; Wardlaw, M. Exposure-based, ‘like-for-like’ assessment of road safety by travel mode using routine health data. PLoS ONE 2012, 7, e50606. [Google Scholar] [CrossRef] [PubMed]
- Cordellieri, P.; Baralla, F.; Ferlazzo, F.; Sgalla, R.; Piccardi, L.; Giannini, A.M. Gender Effects in Young Road Users on Road Safety Attitudes, Behaviors and Risk Perception. Front. Psychol. 2016, 7, 1412. [Google Scholar] [CrossRef]
- World Health Organization. Global Status Report on Road Safety. 2018. Available online: https://www.who.int/publications/i/item/9789241565684 (accessed on 1 January 2023).
- Petridou, E.; Moustaki, M. Human factors in the causation of road traffic crashes. Eur. J. Epidemiol. 2001, 16, 819–826. [Google Scholar] [CrossRef] [PubMed]
- Mousavi Bazzaz, M.; Zarifian, A.; Emadzadeh, M.; Vakili, V. Driving Behaviors in Iran: A Descriptive Study Among Drivers of Mashhad City in 2014. Glob. J. Health Sci. 2015, 7, 39–45. [Google Scholar] [CrossRef] [PubMed]
- Zhao, X.; Xu, W.; Ma, J.; Li, H.; Chen, Y. An analysis of the relationship between driver characteristics and driving safety using structural equation models. Transp. Res. Part F Traffic Psychol. Behav. 2019, 62, 529–545. [Google Scholar] [CrossRef]
- Useche, S.; Montoro, L.; Alonso, F.; Tortosa, F. Does Gender Really Matter? A structural equation model to explain Risky and Positive Cycling Behaviors. Accid. Anal. Prev. 2018, 118, 86–95. [Google Scholar] [CrossRef] [PubMed]
- Jafarpour, S.; Rahimi-Movaghar, V. Determinants of risky driving behavior: A narrative review. Med. J. Islam. Repub. Iran. 2014, 28, 142. [Google Scholar] [PubMed]
- Hassen, A.; Godesso, A.; Abebe, L.; Girma, E. Risky driving behaviors for road traffic accident among drivers in Mekele city, Northern Ethiopia. BMC Res. Notes 2011, 4, 535. [Google Scholar] [CrossRef]
- Ellison, A.B.; Greaves, S.P.; Bliemer, M.C.J. Driver behavior profiles for road safety analysis. Accid. Anal. Prev. 2015, 76, 118–132. [Google Scholar] [CrossRef]
- Machin, M.A.; Plint, J.E. Understanding the unique contribution of aversion to risk taking in predicting drivers’ self-reported speeding. In Driver Behavior and Training; Dorn, L., Ed.; Ashgate: Amsterdam, The Netherlands, 2010; pp. 61–73. [Google Scholar]
- Shaaban, K.; Muley, D.; Mohammed, A. Modeling pedestrian gap acceptance behavior at a six-lane urban road. J. Transp. Saf. Secur. 2021, 13, 842–859. [Google Scholar] [CrossRef]
- Heath, Y.; Gifford, R. Extending the theory of planned behavior: Predicting the use of public transportation. J. Appl. Soc. Psychol. 2002, 32, 2154–2189. [Google Scholar] [CrossRef]
- Waseela, M.; Laosee, O. Determinants of road traffic injury among adult motorcyclists in Malé, Maldives. Asia Pac. J. Public Health 2015, 27, 277–285. [Google Scholar] [CrossRef]
- Arafa, A.; Ahmed Senosy, S. Age-related differences in driving behaviors among non-professional drivers in Egypt. PLoS ONE 2020, 15, e0238516. [Google Scholar] [CrossRef] [PubMed]
- McCartt, A.T.; Leaf, W.A.; Witkowski, T.L.; Solomon, M.G. Evaluation of the Aggression Suppression Program, Milwaukee Wisconsin U.S. Department of Transportation; National Highway Traffic Safety Administration: Washington, DC, USA, 2001. [Google Scholar]
- Ansar, M.S.; Ma, Y.; Chen, S.; Tang, K.; Zhang, Z. Investigating the trip configured causal effect of distracted driving on aggressive driving behavior for e-hailing taxi drivers. J. Traffic Transp. Eng. 2021, 8, 725–734. [Google Scholar] [CrossRef]
- Parker, D.; Reason, J.T.; Manstead, A.S.R.; Stradling, S.G. Driving errors, driving violations and accident involvement. Ergonomics 1995, 38, 1036–1048. [Google Scholar] [CrossRef] [PubMed]
- Sayed, I.; Abdelgawad, H.; Said, D. Studying driving behavior and risk perception: A road safety perspective in Egypt. J. Eng. Appl. Sci. 2022, 69, 22. [Google Scholar] [CrossRef]
- Al-Rousan, T.M.; Umar, A.A.; Al-Omari, A.A. Characteristics of Crashes Caused by Distracted Driving on Rural and Suburban Roadways in Jordan. Infrastructures 2021, 6, 107. [Google Scholar] [CrossRef]
- Von Neumann, J.; Morgenstern, O. Theory of Games and Economic Behavior, 2nd ed.; Princeton University Press: Princeton, NJ, USA, 1947. [Google Scholar]
- Rosenbloom, T.; Shahar, A.; Elharar, A.; Danino, O. Risk perception of driving as a function of advanced training aimed at recognizing and handling risks in demanding driving situations. Accid. Anal. Prev. 2008, 40, 697–703. [Google Scholar] [CrossRef]
- Fishbein, M.; Ajzen, I. Predicting and Changing Behavior: The Reasoned Action Approach; Taylor & Francis: New York, NY, USA, 2010. [Google Scholar]
- Ajzen, I. The theory of planned behavior. Organ. Behav. Hum. Decis. Process. 1991, 50, 179–211. [Google Scholar] [CrossRef]
- World Bank Country and Lending Groups. Country Classification. 2021. Available online: https://datahelpdesk.worldbank.org/knowledgebase/articles/906519-world-bank-country-and-lending-groups (accessed on 1 January 2023).
- Iamtrakul, P.; Hokao, K. The study of Urbanization patterns and their impacts on road safety. Lowl. Technol. Int. 2012, 14, 60–69. [Google Scholar]
- Department of Diseases Control. Road Accident Situation in Thailand. 2021. Available online: https://ddc.moph.go.th/uploads/publish/1359020221215035948.pdf (accessed on 1 January 2023).
- Department of Diseases Control. Road Traffic Fatalities Data. 2022. Available online: https://data.go.th/th/dataset/rtddi (accessed on 1 January 2023).
- Chayphong, S.; Iamtrakul, P. Effects of Age on Urban Road Traffic Accident Using GIS: A Case Study of Bangkok Metropolitan Area, Thailand. Lect. Notes Civ. Eng. 2023, 279, 542–546. [Google Scholar]
- Iamtrakul, P.; Pimonsathean, P. Impact of urban factors on road accident in Bangkok, Thailand. Lowl. Technol. Int. 2010, 12, 30–40. [Google Scholar]
- Office of Transport and Traffic Policy and Planning. Road Accident Situation Analysis Report of the Ministry of Transport 2021. 2021. Available online: https://www.otp.go.th/uploads/tiny_uploads/PDF/2565-09/25650919-ReportExcident-2565.pdf (accessed on 1 January 2023).
- Almgren, A. Using Multiple Linear Regression to Estimate Customer Profitability in Consumer Credits. 2021. Available online: https://www.diva-portal.org/smash/get/diva2:1652415/FULLTEXT01.pdf (accessed on 1 January 2023).
- Fuller, W.A.; Stephens, V.W. Introduction to Statistical Time Series, 3rd ed.; John Wiley and Sons: New York, NY, USA, 1999. [Google Scholar]
- Menard, S. Applied Logistic Regression Analysis, 2nd ed.; SAGE Publications Inc.: London, UK, 2001. [Google Scholar]
- James, G.; Witten, D.; Hastie, T.; Tibshirani, R. An Introduction to Statistical Learning: With Applications in R, 1st ed.; Springer: Berlin/Heidelberg, Germany, 2013. [Google Scholar]
- Michael, H.K.; Christopher, J.N.; John, N.; William, L. Applied Linear Statistical Models, 5th ed.; McGraw-Hil: Boston, MA, USA, 2005. [Google Scholar]
- Rella Riccardi, M.; Galante, F.; Scarano, A.; Montella, A. Econometric and Machine Learning Methods to Identify Pedestrian Crash Patterns. Sustainability 2022, 14, 15471. [Google Scholar] [CrossRef]
- Allen, J.; Browne, M.; Woodburn, A. London Freight Data Report: 2014 Update; Transport for London: London, UK, 2014. [Google Scholar]
- Crundall, D. Hazard prediction discriminates between novice and experienced drivers. Acc. Anal. Prev. 2016, 86, 47–58. [Google Scholar] [CrossRef] [PubMed]
- Wetton, M.A.; Hill, A.; Horswill, M.S. Are what happens next exercises and self-generated commentaries useful additions to hazard perception training for novice drivers. Accid. Anal. Prev. 2013, 54, 57–66. [Google Scholar] [CrossRef] [PubMed]
- Alonso, F.; Esteban, C.; Montoro, L.; Serge, A. Conceptualization of aggressive driving behaviors through a perception of aggressive driving scale (PAD). Transp. Res. F Traffic Psychol. Behav. 2019, 60, 415–426. [Google Scholar] [CrossRef]
- Borowsky, A.; Shinar, D.; Oron-Gilad, T. Age, skill, and hazard perception in driving. Acc. Anal. Prev. 2010, 42, 1240–1249. [Google Scholar] [CrossRef]
- Sahebi, S.; Nassiri, H.; Naderi, H. A study of the factors affecting driving risk perception using the Bivariate Ordered Probit model. Int. J. Inj. Control Saf. Promot. 2022, 29, 1–13. [Google Scholar] [CrossRef]
- Furian, G.; Kaiser, S.; Senitschnig, N.; Soteropoulos, A. Subjective safety and risk perception. In ESRA2 Thematic Report Nr. 15. ESRA Project (E-Survey of Road Users’ Attitudes); Austria Austrian Road Safety Board KFV: Vienna, Austria, 2021. [Google Scholar]
- Furian, G.; Brandstätter, C.; Kaiser, S.; Witzik, A. Subjective safety and risk perception. In ESRA Thematic Report No. 5. ESRA Project (European Survey of Road Users’ Safety Attitudes); Kuratorium fuür Verkehrssicherheit: Vienna, Austria, 2016. [Google Scholar]
- Fernandes, R.; Hatfield, J.; Job, R.F.S. A systematic investigation of the differential predictors for speeding, drink-driving, driving while fatigued, and not wearing a seat belt among young drivers. Transp. Res. Part F 2010, 13, 179–196. [Google Scholar] [CrossRef]
- Boufous, S.; Ivers, R.; Senserrick, T.; Stevenson, M. Attempts at the Practical On-Road Driving Test and the Hazard Perception Test and the Risk of Traffic Crashes in Young Drivers. Traffic Inj. Prev. 2011, 12, 475–482. [Google Scholar] [CrossRef]
- Scarano, A.; Aria, M.; Mauriello, F.; Riccardi, M.R.; Montella, A. Systematic literature review of 10 years of cyclist safety research. Acc. Anal. Prev. 2023, 184, 106996. [Google Scholar] [CrossRef]
- Montella, A.; Chiaradonna, S.; Mihiel, A.C.d.S.; Lovegrove, G.; Nunziante, P.; Rella Riccardi, M. Sustainable Complete Streets Design Criteria and Case Study in Naples, Italy. Sustainability 2022, 14, 13142. [Google Scholar] [CrossRef]
- Varmazyar, S.; Mortazavi, S.B.; Hajizadeh, E.; Arghami, S. The relationship between driving aberrant behavior and self-reported accidents involvement amongst professional bus drivers in the public transportation company. Health Scope 2013, 2, 110–115. [Google Scholar] [CrossRef]
- Iamtrakul, P.; Chayphong, S.; Klaylee, J. Foreign tourist behavior and perception of motorcycle accident risk in Chiang Mai, Thailand. Lowl. Technol. Int. 2019, 21, 187–196. [Google Scholar]


| Variables | Travel Modes | |||||||||||||
|---|---|---|---|---|---|---|---|---|---|---|---|---|---|---|
| Private Automobile | Active Transportation | Public Transportation | Paratransit | |||||||||||
| Private Car | Motorcycle | Pedestrian | Bicycle | Public Bus | Mass Transit BTS/MRT | |||||||||
| n | % | n | % | n | % | n | % | n | % | n | % | |||
| Gender | ||||||||||||||
| Male | 325 | 58.0 | 289 | 49.8 | 299 | 51.7 | 259 | 45.7 | 119 | 43.9 | 36 | 35.6 | 164 | 47.8 |
| Female | 200 | 35.7 | 253 | 43.6 | 249 | 43.1 | 274 | 48.3 | 114 | 42.1 | 54 | 53.5 | 143 | 41.7 |
| Others | 35 | 6.3 | 38 | 6.6 | 30 | 5.2 | 34 | 6.0 | 38 | 14.0 | 11 | 10.9 | 36 | 10.5 |
| Age (year) | ||||||||||||||
| 18–44 | 445 | 79.5 | 479 | 82.6 | 455 | 78.7 | 409 | 72.1 | 236 | 87.1 | 84 | 83.2 | 282 | 82.2 |
| 45–59 | 103 | 18.4 | 71 | 12.2 | 68 | 11.8 | 92 | 16.2 | 25 | 9.2 | 13 | 12.8 | 42 | 12.3 |
| 60 or over | 12 | 2.1 | 30 | 5.2 | 55 | 9.5 | 66 | 11.6 | 10 | 3.7 | 4 | 4.0 | 19 | 5.5 |
| Marital status | ||||||||||||||
| Married | 287 | 51.3 | 271 | 46.7 | 294 | 50.9 | 280 | 49.4 | 77 | 28.4 | 25 | 24.8 | 156 | 45.5 |
| Single | 217 | 38.7 | 256 | 44.2 | 223 | 38.6 | 235 | 41.5 | 145 | 53.5 | 57 | 56.4 | 138 | 40.2 |
| Divorced | 28 | 5.0 | 28 | 4.8 | 32 | 5.5 | 24 | 4.2 | 27 | 10.0 | 9 | 8.9 | 28 | 8.2 |
| Widowed | 28 | 5.0 | 25 | 4.3 | 29 | 5.0 | 28 | 4.9 | 22 | 8.1 | 10 | 9.9 | 21 | 6.1 |
| Variables | Travel Modes | |||||||||||||
|---|---|---|---|---|---|---|---|---|---|---|---|---|---|---|
| Private Automobile | Active Transportation | Public Transportation | Paratransit | |||||||||||
| Private Car | Motorcycle | Pedestrian | Bicycle | Public Bus | Mass Transit BTS/MRT | |||||||||
| n | % | n | % | n | % | n | % | n | % | n | % | n | % | |
| Education level | ||||||||||||||
| Lower primary school | 0 | 0.0 | 0 | 0.0 | 0 | 0.0 | 1 | 0.2 | 0 | 0.0 | 0 | 0.0 | 0 | 0.0 |
| Primary school | 0 | 0.0 | 2 | 0.3 | 4 | 0.7 | 5 | 0.9 | 0 | 0.0 | 0 | 0.0 | 0 | 0.0 |
| Junior high school | 4 | 0.7 | 12 | 2.1 | 21 | 3.6 | 10 | 1.7 | 1 | 0.4 | 0 | 0.0 | 12 | 3.5 |
| High school | 65 | 11.6 | 91 | 15.7 | 121 | 20.9 | 97 | 17.1 | 54 | 19.9 | 20 | 19.8 | 61 | 17.8 |
| Vocational college | 112 | 20.0 | 204 | 35.2 | 211 | 36.5 | 250 | 44.1 | 74 | 27.3 | 23 | 22.8 | 123 | 35.9 |
| Bachelor’s degree | 366 | 65.4 | 267 | 46.0 | 220 | 38.1 | 199 | 35.1 | 137 | 50.6 | 57 | 56.4 | 137 | 39.9 |
| Postgraduate | 13 | 2.3 | 4 | 0.7 | 1 | 0.2 | 5 | 0.9 | 5 | 1.8 | 1 | 1.0 | 10 | 2.9 |
| Income level (person/month) (USD) | ||||||||||||||
| Less than 135 | 5 | 0.9 | 11 | 1.9 | 20 | 3.5 | 22 | 3.9 | 14 | 5.2 | 2 | 2.0 | 7 | 2.1 |
| 135–270 | 25 | 4.5 | 44 | 7.6 | 58 | 10.0 | 74 | 13.0 | 23 | 8.5 | 7 | 6.9 | 32 | 9.3 |
| 271–405 | 88 | 15.7 | 139 | 24.0 | 158 | 27.3 | 188 | 33.2 | 83 | 30.6 | 30 | 29.7 | 90 | 26.2 |
| 406–540 | 162 | 28.9 | 209 | 36.0 | 167 | 28.9 | 101 | 17.8 | 45 | 16.6 | 20 | 19.8 | 77 | 22.4 |
| 541–675 | 196 | 35.0 | 103 | 17.7 | 112 | 19.4 | 110 | 19.4 | 47 | 17.3 | 17 | 16.8 | 79 | 23.1 |
| 676–810 | 34 | 6.1 | 38 | 6.6 | 20 | 3.5 | 26 | 4.6 | 28 | 10.3 | 10 | 9.9 | 26 | 7.6 |
| More than 810 | 50 | 8.9 | 36 | 6.2 | 43 | 7.4 | 46 | 8.1 | 31 | 11.5 | 15 | 14.9 | 32 | 9.3 |
| Perception of Risk Behavior | AVG. by Travel Modes | Trend | Total AVG. | MAX | MIN | ||||||
|---|---|---|---|---|---|---|---|---|---|---|---|
| A | M | P | BC | B | BM | PT | |||||
| Rule violation | 3.58 | 3.57 | 3.65 | 3.70 | 3.39 | 3.33 | 3.53 |  | 3.58 | 5 | 1 |
| Distraction | 3.19 | 3.17 | 3.32 | 3.50 | 3.12 | 3.29 | 3.22 |  | 3.27 | 5 | 0 |
| Fatigue | 3.75 | 3.74 | 3.84 | 3.99 | 3.38 | 3.53 | 3.84 |  | 3.78 | 5 | 1 |
| Emotion | 3.66 | 3.56 | 3.70 | 3.92 | 3.27 | 3.46 | 3.80 |  | 3.67 | 5 | 0 |
| Personal error | 3.59 | 3.48 | 3.57 | 3.61 | 3.33 | 3.03 | 3.47 |  | 3.52 | 5 | 1 |
| Average | 3.55 | 3.50 | 3.62 | 3.74 | 3.30 | 3.33 | 3.57 |  | 3.56 | 5 | 1 |
| Variables | Model 1 | Model 2 | Model 3 | Model 4 | ||||||||
|---|---|---|---|---|---|---|---|---|---|---|---|---|
| Private Vehicle | Active Transportation | Public Transportation | Paratransit | |||||||||
| Coefficient | Std. Error | VIF | Coefficient | Std. Error | VIF | Coefficient | Std. Error | VIF | Coefficient | Std. Error | VIF | |
| Socioeconomic characteristics | ||||||||||||
| Age | 0.027 | 0.041 | 1.178 | –0.117 ** | 0.030 | 1.167 | –0.024 | 0.054 | 1.078 | 0.017 | 0.052 | 1.153 |
| Gender | –0.118 * | 0.036 | 1.069 | –0.024 | 0.031 | 1.049 | –0.088 * | 0.045 | 1.104 | –0.183 ** | 0.046 | 1.156 |
| Education level | 0.071 * | 0.029 | 1.167 | 0.053 * | 0.022 | 1.137 | –0.040 | 0.038 | 1.140 | 0.002 | 0.033 | 1.077 |
| Occupation | –0.007 | 0.016 | 1.073 | –0.024 * | 0.013 | 1.186 | –0.023 | 0.022 | 1.099 | –0.001 | 0.019 | 1.072 |
| Personal income | –0.012 | 0.018 | 1.191 | –0.029 * | 0.014 | 1.289 | 0.047* | 0.024 | 1.809 | –0.020 | 0.022 | 1.262 |
| Marital status | –0.208 ** | 0.029 | 1.117 | –0.284 ** | 0.024 | 1.084 | –0.090* | 0.038 | 1.187 | –0.218 ** | 0.036 | 1.181 |
| Attitude | ||||||||||||
| Attitude toward road safety | –0.108 ** | 0.028 | 1.066 | –0.045 | 0.025 | 1.040 | –0.040 | 0.049 | 1.105 | –0.146 * | 0.042 | 1.140 |
| Driving experience | ||||||||||||
| Driving experience | –0.002 | 0.003 | 1.268 | 0.015 ** | 0.003 | 1.654 | 0.002 | 0.009 | 2.427 | 0.003 | 0.005 | 1.872 |
| Possession of a driving license | –0.090 | 0.129 | 1.084 | –0.436 ** | 0.050 | 1.838 | –0.235 * | 0.081 | 1.671 | –0.340 ** | 0.084 | 2.163 |
| Accident experience | –0.213 ** | 0.045 | 1.093 | –0.051 | 0.041 | 1.148 | –0.353 * | 0.083 | 1.776 | –0.060 | 0.075 | 1.348 |
| R Square | 0.33 | 0.47 | 0.16 | 0.31 | ||||||||
| F-ratio | 13.97, p < 0.001 | 32.13, p < 0.001 | 6.94, p < 0.001 | 15.06, p < 0.001 | ||||||||
Disclaimer/Publisher’s Note: The statements, opinions and data contained in all publications are solely those of the individual author(s) and contributor(s) and not of MDPI and/or the editor(s). MDPI and/or the editor(s) disclaim responsibility for any injury to people or property resulting from any ideas, methods, instructions or products referred to in the content. |
© 2023 by the authors. Licensee MDPI, Basel, Switzerland. This article is an open access article distributed under the terms and conditions of the Creative Commons Attribution (CC BY) license (https://creativecommons.org/licenses/by/4.0/).
Share and Cite
Iamtrakul, P.; Chayphong, S.; Makó, E.; Phetoudom, S. Analysis of Road Users’ Risk Behaviors in Different Travel Modes: The Bangkok Metropolitan Region, Thailand. Infrastructures 2023, 8, 79. https://0-doi-org.brum.beds.ac.uk/10.3390/infrastructures8040079
Iamtrakul P, Chayphong S, Makó E, Phetoudom S. Analysis of Road Users’ Risk Behaviors in Different Travel Modes: The Bangkok Metropolitan Region, Thailand. Infrastructures. 2023; 8(4):79. https://0-doi-org.brum.beds.ac.uk/10.3390/infrastructures8040079
Chicago/Turabian StyleIamtrakul, Pawinee, Sararad Chayphong, Emese Makó, and Souvathone Phetoudom. 2023. "Analysis of Road Users’ Risk Behaviors in Different Travel Modes: The Bangkok Metropolitan Region, Thailand" Infrastructures 8, no. 4: 79. https://0-doi-org.brum.beds.ac.uk/10.3390/infrastructures8040079