
Ionic Conductivity of LiSiON and the Effect of Amorphization/Heterovalent Doping on Li+ Diffusion


1
Beijing Advanced Innovation Center for Materials Genome Engineering, Institute of Physics, Chinese Academy of Sciences, Beijing 100190, China
2
School of Physical Sciences, University of Chinese Academy of Sciences, Beijing 100190, China
*
Authors to whom correspondence should be addressed.
Inorganics 2022, 10(4), 45; https://0-doi-org.brum.beds.ac.uk/10.3390/inorganics10040045
Submission received: 28 February 2022
/
Revised: 22 March 2022
/
Accepted: 24 March 2022
/
Published: 31 March 2022
(This article belongs to the Special Issue A Themed Issue in Honor of Professor Michel Armand on the Occasion of His 75th Birthday)
Abstract
:The search for and design of suitable superior lithium ion conductors is a key process for developing solid state batteries. In order to realize a large range of applications, we researched the ionic conductivity of LiSiON, an example oxynitride mainly composed of elements with high abundance and a similar mixed anion size. Both its amorphous and heterovalent-doped phases were studied through density functional theory simulations. The Li+ ion diffusion behaviors and related properties are discussed. These elements are abundant in nature, and we found that amorphization or doping with P obviously enhanced the ionic conductivity of the system. General strategies to improve the kinetic properties of a candidate structure are presented, to help in the design of solid state electrolytes for lithium batteries.
1. Introduction
With the rapidly increasing requirements for clean energy, to reduce carbon emissions, using electric vehicles (EV), or even electric flights, is one of the main methods of realizing carbon neutrality [1,2,3]. In order to enhance the safety and energy density, solid state batteries have higher requirements [4,5,6,7]. A few solid-state electrolytes, such as Li10GeP2S12 [8], Li9.54Si1.74P1.44S11.7Cl0.3 [9], and even β-Al2O3 [10], show comparable ionic conductivities with liquid electrolytes, while some commonly used lithium ion electrolytes, such as Li7La3Zr2O12 [11], Li3xLa2/3−xTiO3 [12], and Li2O-Al2O3-GeO2-P2O5 [13] provide 0.1–1 mS/cm, which almost meets the requirements for EVs. However, the key purpose of using solid-state batteries is to replace the millions of fuel vehicles, and it is necessary to use abundant elements in the Earth to lower the cost and accelerate electrification. As such, use of some rare elements, such as Ge in LGPS/LAGP, La in LLZO/LLTO, will hinder this process. Using cheaper and more abundant elements will also promote EVs from the perspective of economy. Si is the second richest element in the Earth’s crust, and there are almost endless applications, thanks to glass and chip. SiO2 is so common that it is not affected by the rising price of raw materials. In addition, using Si to substitute P in sulfides can also improve stability and ionic conductivity, such as in Li9.54Si1.74P1.44S11.7Cl0.3 [9] and Li2SiS3 [14].
Cation doping is a powerful method to improve ionic conductivity, by enhancing the concentration of the carrier, such as Li10GeP2S12 [8], Li9.54Si1.74P1.44S11.7Cl0.3 [9], Li7La3Zr2O12 [11], and Li3xLa2/3−xTiO3 [12]. Besides cation doping, utilizing mixed anions is also an effective way to increase the ionic conductivity. Using O to partially replace S gives an improvement of both the ionic conductivity and the stability in a Li3PS4 system [15,16]. The new oxysulfide material LiAlSO, and some of its derivatives in ABXO form (A, B = Metals; X = S, Se, and Te), have been suggested as fast ion conductors by high-throughput calculations [17,18]. Besides S2− ions, N3− and F− ions can also coexist with O2−, because of the close ionic size between them, to form oxynitrides and oxyfluorides, respectively. Apart from doping, amorphization is another method to enhance ion diffusion [19,20,21,22].
In this article, we chose LiSiON [23], mainly composed of elements with high abundance, as an example oxynitride, to discuss the kinetic properties of a material with a similar mixed anion size. An attempt to improve the Li+ ion diffusion was made, by creating various chemical environments, including crystal, amorphous, and doped structures. With amorphization or doping with P, the diffusion coefficient of Li+ was enhanced by orders of magnitude. Compared with oxysulfides, the similar ion radius and more carriers created by heterovalent doping represent a method to design suitable solid state electrolytes for batteries.
2. Results
2.1. The Crystal Structure and Basic Properties of α-LiSiON
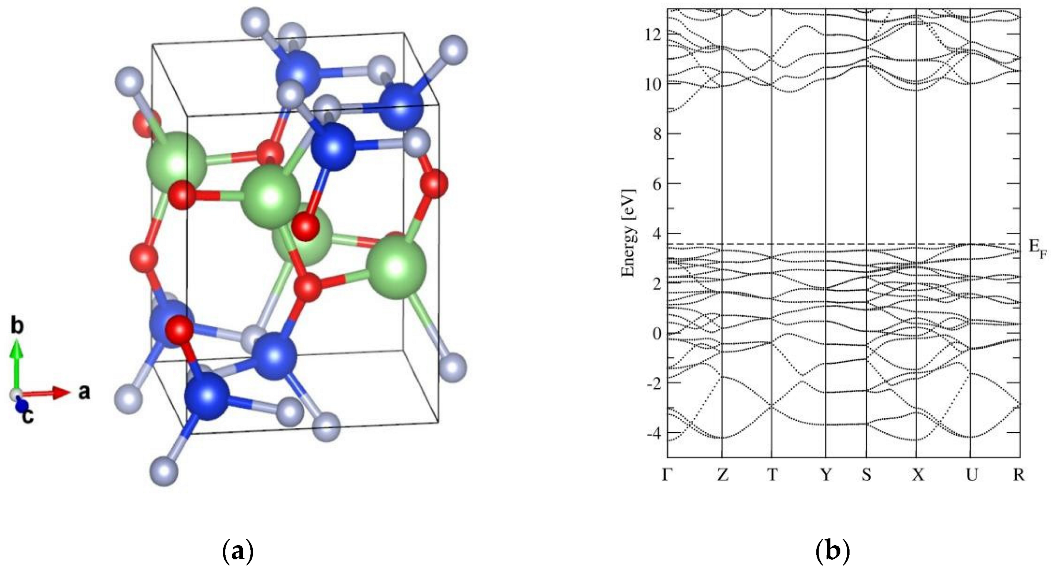
The crystal structure of α-LiSiON belongs to the Pca21 space group in the orthorhombic system [23]. Figure 1a shows the lattice structure of α-LiSiON after geometrical relaxation. The optimized lattice parameters are a = 5.233 Å, b = 6.410 Å, and c = 4.784 Å, which are slightly overestimated by ~0.9% maximum compared with the experimental values. The unit cell contains four formula units (f.u.), with 16 ions in total. Each Li+ ion coordinates three O2− ions with a Li-O bond length of 1.92, 1.93, and 2.05 Å, and one N3− ion with the Li-N bond length of 2.25 Å. Each Si4+ ion coordinates one O2− ion with a Si-O bond length of 1.63 Å, and three N3− ions with a Si-N bond length of 1.73, 1.74, and 1.78 Å. Distorted LiO3N and SiON3 tetrahedrons are connected in a vertex-sharing manner by O2− or N3− ions. LiO3N tetrahedrons form a connected network in the ac-plane, and the neighboring LiO3N planes are separated by SiON3 tetrahedrons in the b direction, which implies that the lithium diffusion pathways potentially exist in the ac-plane with a two-dimensional form.
Before investigating the kinetic properties of the LiSiON system, we first made a basic investigation of its thermostability and band structures. To date, α-LiSiON has been experimentally synthesized by solid state reactions. To check the stability of α-LiSiON, the formation energy with respect to its stable constituent phases was estimated according to the following two possible reactions:
2Li2O + SiO2 + Si3N4 → 4LiSiON
Li4SiO4 + Si3N4 → 4LiSiON
By performing DFT calculations for the related compounds, the reaction energies of −0.672 eV/f.u. and −0.191 eV/f.u. were evaluated for Equations (1) and (2), respectively, indicating that LiSiON is intrinsically thermodynamically stable at 0 K. Previous studies reported that the thermal decomposition of LiSiON happens at 1300 °C, resulting in the formation of Li2SiN2 and probably amorphous SiO2 [24]. The decomposition condition is far beyond the operational temperature of lithium batteries; thus, we believe α-LiSiON is promisingly stable within the temperature range, when working as a solid state electrolyte.
The band structure of α-LiSiON is presented in Figure 1b. To be used as an electrolyte, a wide band gap should be maintained, to ensure negligible electronic conductivity. It is obvious that the α-LiSiON phase shows characteristics of a wide-band-gap insulator, with a band gap of ~5eV, which is comparable to the band gaps of a crystalline Li-P-O-N system [25], ensuring the wide electrochemical window of this material.
2.2. Ionic Diffusion Properties of α-LiSiON
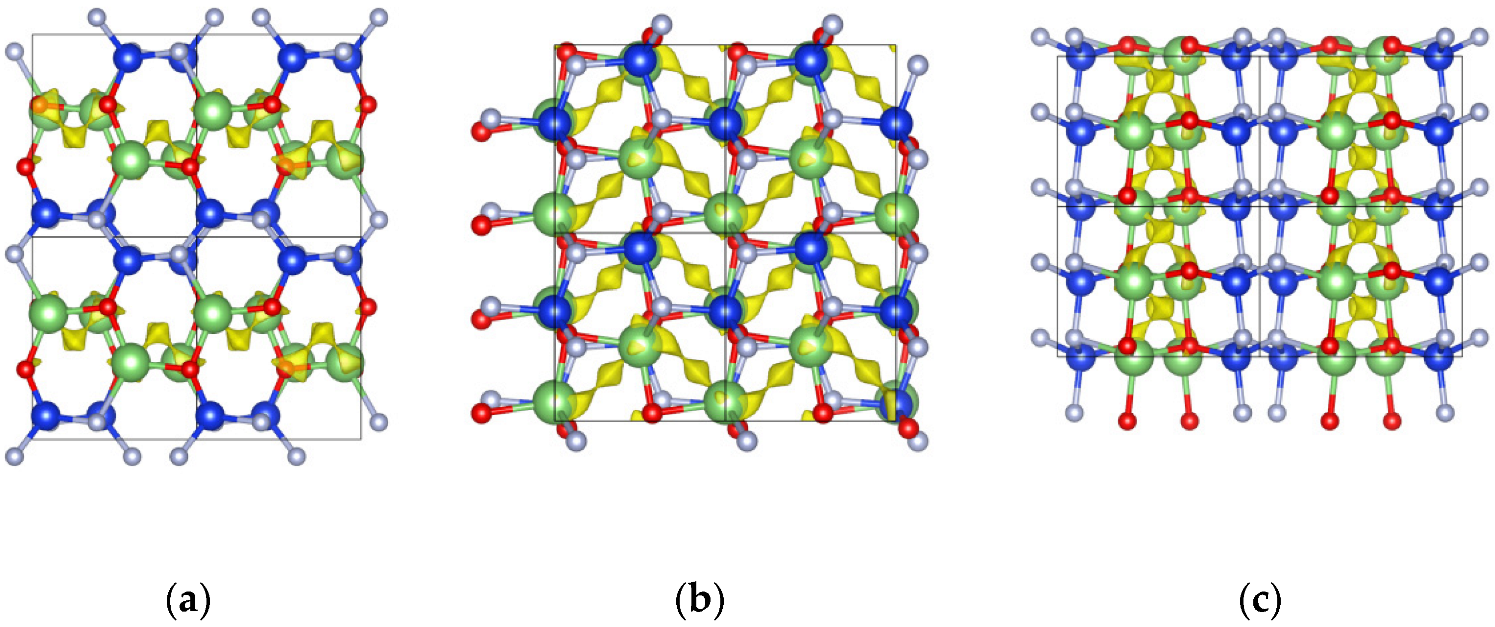
After obtaining a preliminary understanding of the thermostability and electronic structure of α-LiSiON, we started to investigate its ionic transport properties with both the quasiempirical bond-valence (BV) method [26] and DFT-based nudged-elastic band (NEB) method [27]. The former gave us initial knowledge of the diffusion channels and directions in the structure, and the latter provided a more accurate evaluation of the energy barrier for each pathway. Figure 2 illustrates the isosurfaces of the potential energies calculated using the BV-based method, in which the preferred diffusion channels viewed in ab-, ac-, and bc-planes are given. The continuous pathways are formed in a zigzag pattern in ac-plane.
Based on the Li+ ion diffusion pathways revealed by the BV method, DFT simulations of the kinetic properties were performed using transition-state theory and the NEB method [27]. The hopping events of Li+ ions from one lattice site to the neighboring one, assisted by the vacancy along [110] and [100], were considered, and the calculated barrier shapes and corresponding activation energies are shown in Figure 3. Along the [110] direction, the vacancy hopping was the migration with the lower barrier of ~0.13 eV, while the energy barrier for Li+ hopping along the [100] direction was about 0.36 eV. Thus, as predicted by the BV method, a zigzag transporting network could be formed in the ac plane, with a very low energy barrier of ~0.13 eV, as shown in Figure 3a.
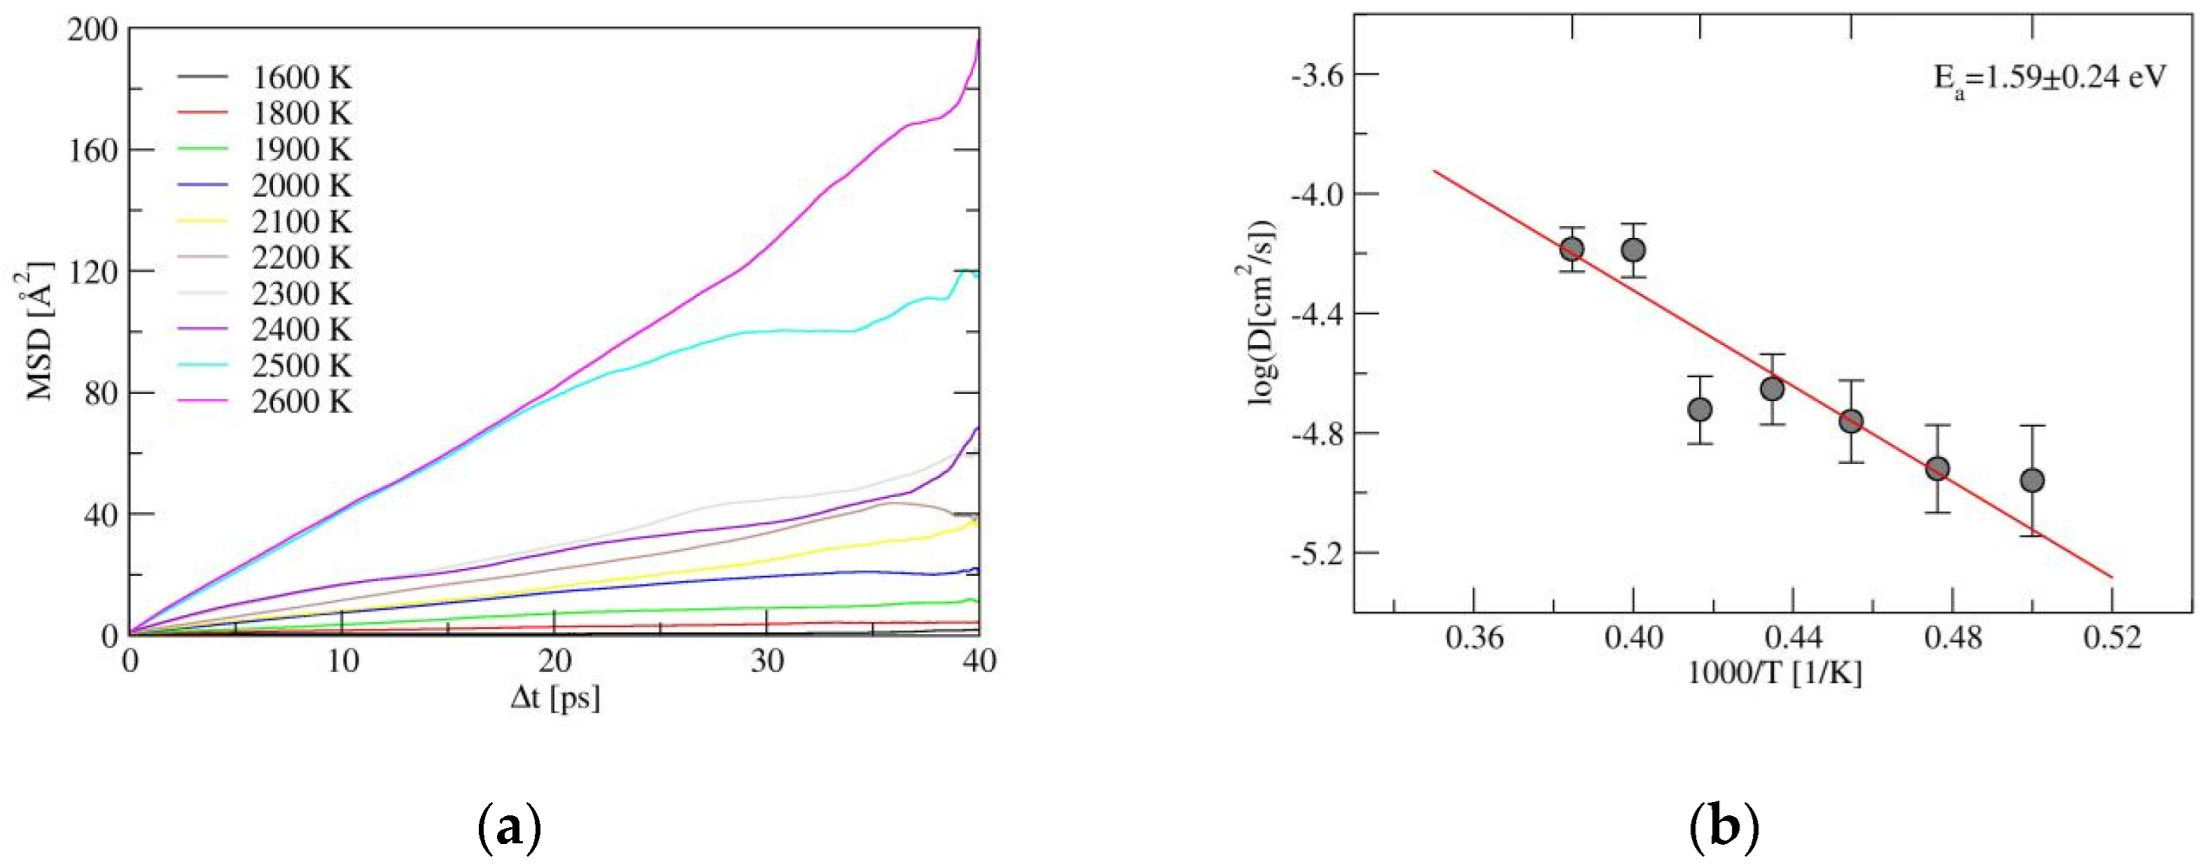
Besides the energy barrier, the formation energy of carriers also plays a role in determining the ionic conductivity; since, the latter correlates with the carrier concentration in the structure. To further understand the diffusion behavior in α-LiSiON, ab initio molecular dynamics (AIMD) simulations at 10 temperatures, ranging from 1600 K to 2600 K, were performed, with the parameters described in Section 4. Mean squared displacements (MSD), as indicated in Figure 4a and Figure S1, were adopted to measure the deviation of ions over time, with respect to their initial positions. The whole structural framework constituted by SiON was stable, since the MSDs of Si, O, and N remained less than 2 Å2, even at 2600 K. However, hopping events of Li+ ions appeared frequently until reaching high temperature, and MSDs with values larger than 100 Å2 were only exhibited at 2500 K and 2600 K. While for solid electrolytes with comparable activation energies, e.g., the Ea of 0.21 ± 0.01 eV in Li10GeP2S12 and the Ea of 0.25 ± 0.02 eV in Li1.33Al0.33Ti1.67(PO4)3 [28], much lower temperatures were needed to induce Li+ ion hopping. Since similar Ea values are found among these systems, this implies that the formation of carriers in α-LiSiON is much more difficult, because of the full occupation of Li+ at the lattice sites. The Li+ ion diffusion energy barrier extracted from the Arrhenius plot of diffusion coefficients, as shown in Figure 4b, was 1.59 ± 0.24 eV. The Ea values obtained from AIMD represent the self-diffusion process, in which the energies for creating carriers are included. When taking Ea as the summation of the energy barrier and half the formation energy of the Li vacancy, we can estimate that the energy for creating the Li vacancy is around 3 eV, which is ~20 times larger than the energy barrier of 0.13 eV. Therefore, decreasing the formation energy of the Li+ vacancy or enhancing the vacancy concentrations were the subsequent procedures aimed at improving the ionic conductivities of the LiSiON system. Creating a frustrated energy landscape [29] and heterovalent ion doping [30] have been proven to be promising strategies in other fast ion conductors. In the following, the two methods, including amorphization of the structure and element doping, were attempted for the LiSiON system.
2.3. The Properties of Amorphous-LiSiON
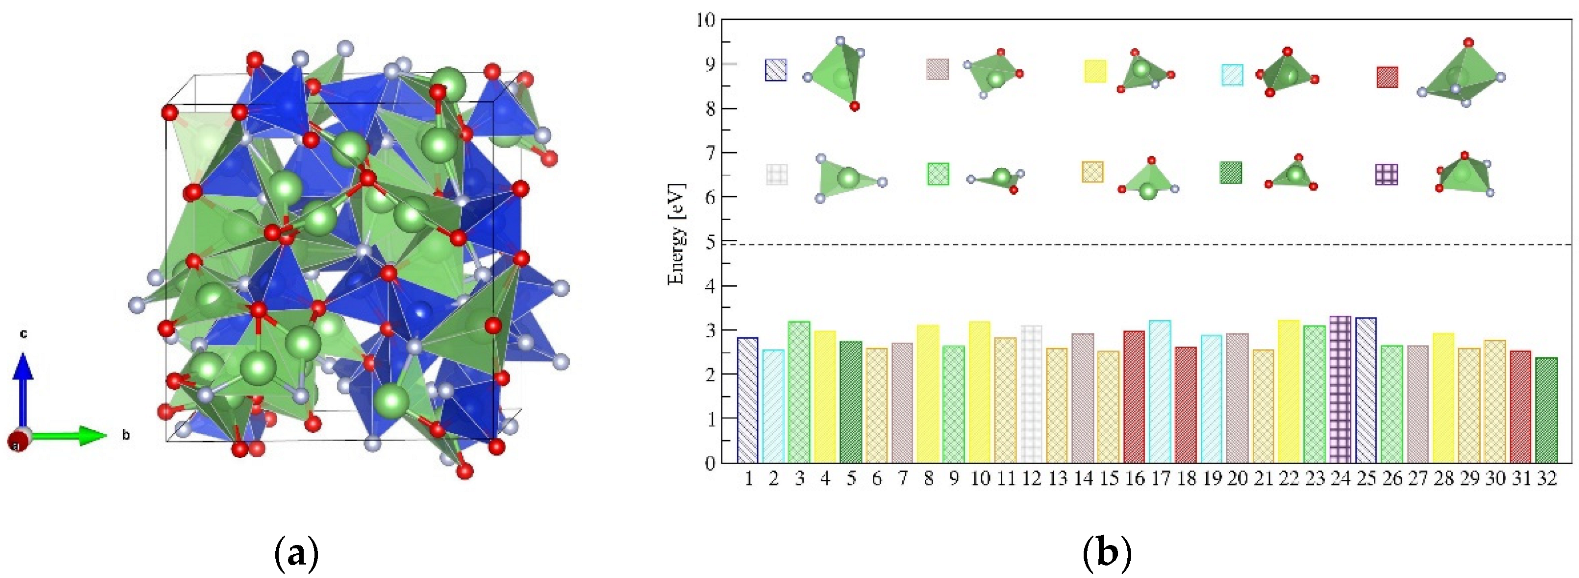
To model the effect of amorphization of LiSiON on the Li+ ion diffusion, an atomic structure of amorphous-LiSiON was built by simulating the quenching process, as described in the Method Section. After melting and quenching, the disordered structure was frozen at 300 K, as illustrated in Figure 5a. The coordination analysis indicated that Si4+ ions remained in the four coordinate environments, but, besides the SiON3 tetrahedron, SiO2N2 and SiON3 tetrahedrons were also found in the amorphous structure. Zanotto et al. used NMR measurement and found similar structures, such as SiO3N, SiO2N2, and SiON3 in nitrated lithium disilicate glasses [31]. Unlike the crystal phase, in which all the SiON3 polyhedrons are connected by vertexes, both vertex-shared and edge-shared connections appear. The coordination environment of Li+ ions in an amorphous structure is much more complex than that in a crystal, since 3-, 4-, and 5-coordinated Li+ are observed in the disordered structure. The partial radial distribution function (PRDF) for Li-O, Li-N, Si-O, and Si-N pairs in amorphous-LiSiON can be seen in Figure S2, and all pairs became wider, indicating the varied distribution of bond lengths in the amorphous state. The coexistence of O and N and the various distortions of each polyhedron offer no regular sites for Li ions, which creates a frustrated environment, similar to that in the superionic conductor LiTi2(PS4)3 [29].
The coordination environments for the 32 Li sites in the disordered structure are illustrated in Figure 5b. Ten types of chemical environments, including 3-coordinated LiN3, LiON2, LiO2N, LiO3, 4-coordinated LiON3, LiO2N2, LiO3N, LiO4, and 5-coordinated LiON4, LiO3N2, were observed. The formation energies for creating Li vacancies in these environments were estimated in the cell with 32 f.u., according to Equations (3) and (4),
Li32Si32O32N32 → Li31Si32O32N32 + Li
Ef(Li_vacancy) = E(Li31Si32O32N32) + E(Li) − E(Li32Si32O32N32)
The formation energy for each of the Li vacancies in amorphous-LiSiON is given in Figure 5b. The Ef(Li_vacancy) values varied among the 32 sites, because of the diverse coordination environments; however, all of them were around 3 eV and much lower than the Ef(Li_vacancy) value in crystalline α-LiSiON. Thus, the carrier concentration in amorphous-LiSiON is much higher than that in the crystal phase.
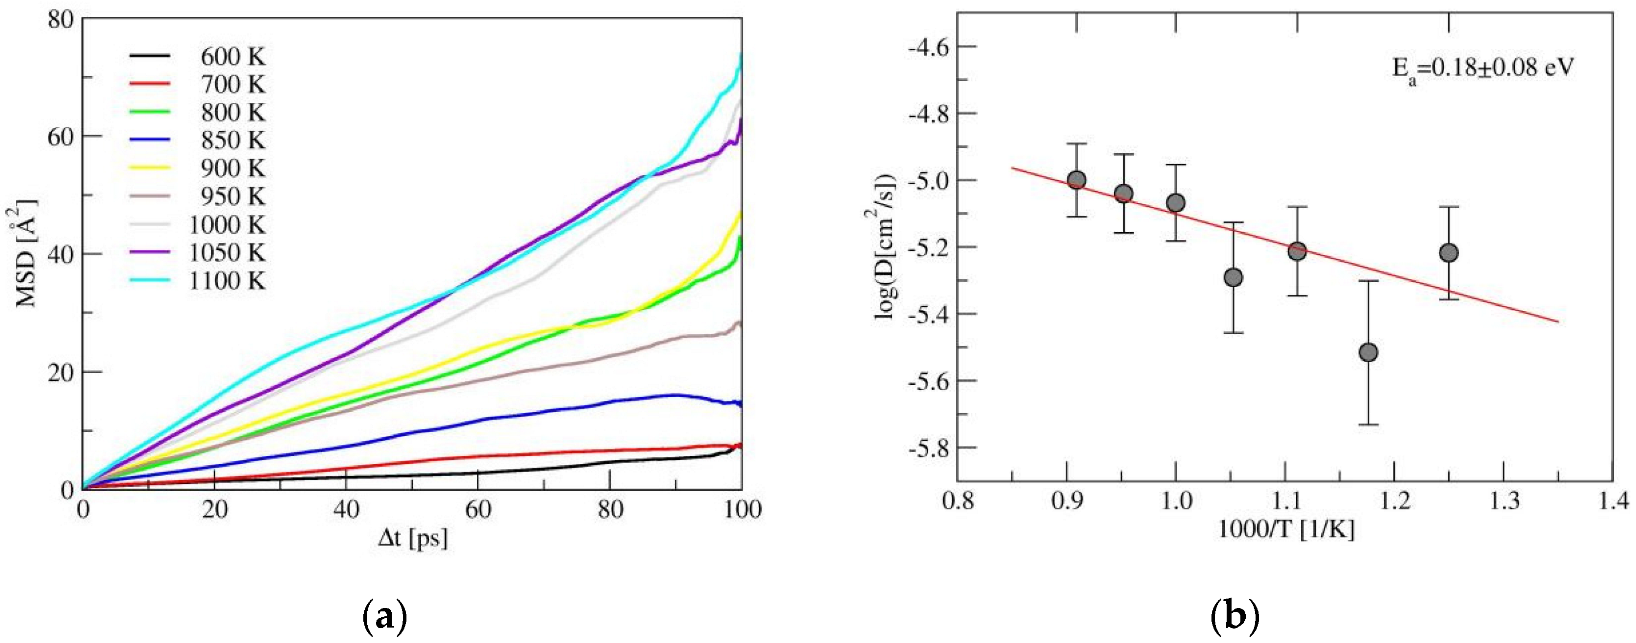
The results of the AIMD simulations for amorphous-LiSiON are shown in Figure 6. Compared with α-LiSiON, much lower temperatures were needed to observe the Li+ ion diffusion. For the nine simulation temperatures, the data from those larger than 800 K were adopted to obtain the diffusion coefficients and the activation energy. As indicated in Figure 6b, the evaluated Ea for amorphous-LiSiON was 0.18 ± 0.08 eV, which is very close to the energy barriers estimated using the NEB method in α-LiSiON, indicating that amorphization effectively decreased the energies needed for carrier creation.
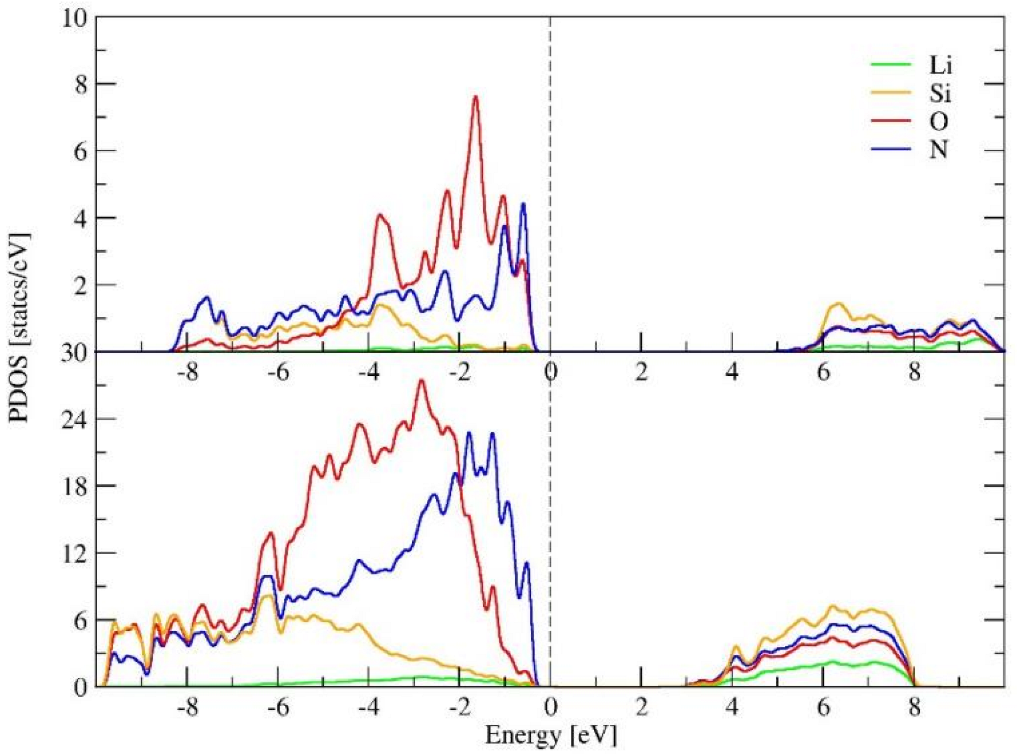
Along with the disordering process, the band gap of the LiSiON system changes from ~5 eV in crystal phase, to ~3 eV in amorphous states. The density of states for α-LiSiON and amorphous-LiSiON are compared in Figure 7. Referring to the Fermi level (EF), the electronic states of α-LiSiON, ranging from −2 to 0 eV, are mainly occupied by O 2p and N 2p orbitals, with nearly no contribution from Li and Si, indicating that the states from O and N dominate the valence band of α-LiSiON. The electronic states ranging from −8 to −2 eV illustrate the covalent characteristics of Si-O and Si-N chemical bonds, because of the orbital hybridization between Si 3p and O 2p states, and between Si 3p and N 2p states. In amorphous phase, both the p states of O and N are dispersed in a broader range, reflecting the diversified strength of bond interactions in the disordered state. The diversity of bond characteristics in the amorphous phase were also confirmed by the Bader charge analysis. The calculated Bader charges of O and N in α-LiSiON were −1.62 e and −2.26 e, respectively, while those in amorphous-LiSiON for O were distributed in the range of −1.66~−1.57 e, and the charge for N was distributed from −2.30 to −2.14 e.
2.4. Ionic Diffusion Properties of P-Doped α-LiSiON
Besides adjusting the formation energies of carriers, another way to improve the carrier concentrations is to introduce vacancies by doping with heterovalent ions. For example, Equation (5) demonstrates using a higher valence state P5+ to replace part of Si4+, to introduce Li vacancies; and Equation (6) shows the substitution of N3− with O2− to create Li vacancies in the structure. We adopted the method of a P-doped Si site, to investigate manners of improving the ionic conductivity.
1.5 Li2O + Si3N4 + 0.5 P2O5 → Li3Si3PO4N4
(2 − x) Li2O + Si3N4 + SiO2 → Li4-2xSi4O4-xN4
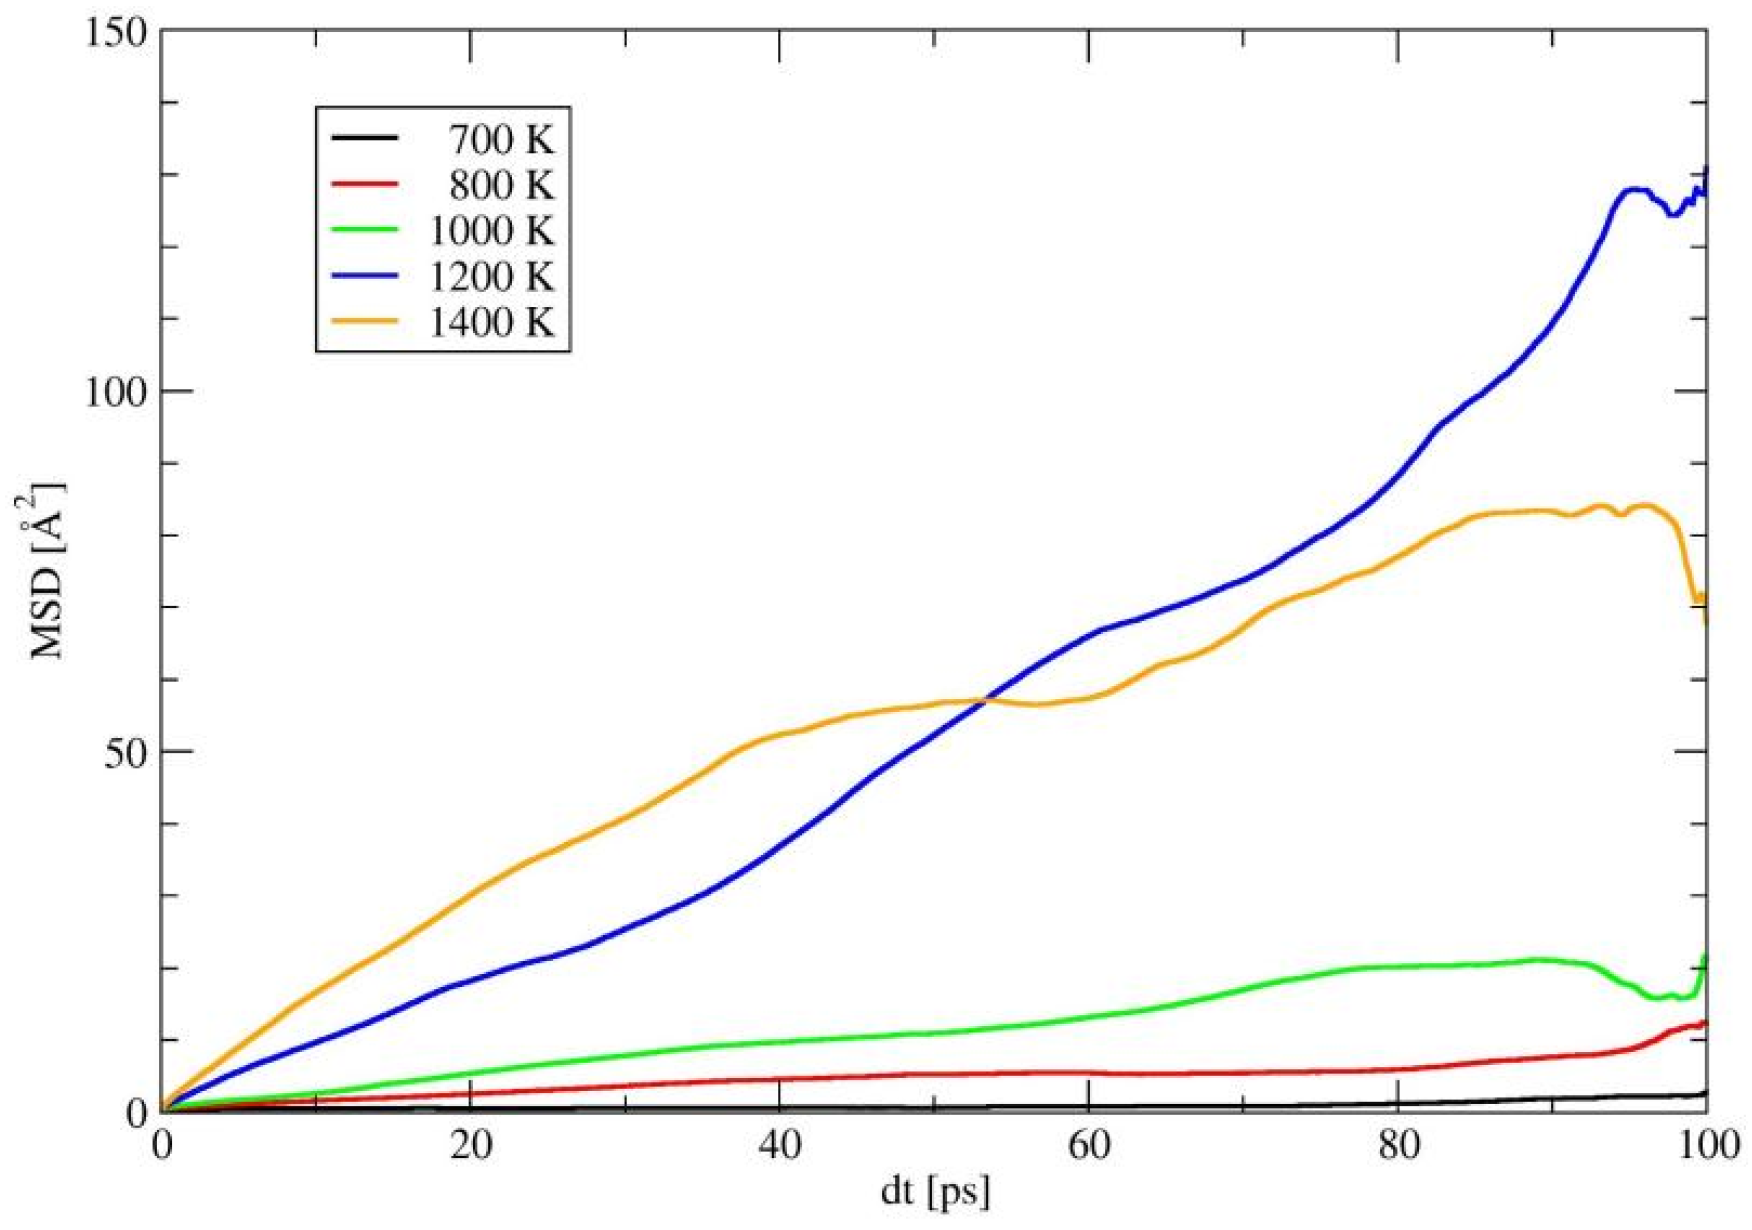
The doping is simulated in the primitive cell with 4 f.u., in which one, two, or three of the four Si sites is(are) replaced by P, and one, two, or three of the four Li ions is(are) removed. More details are shown in Tables S1–S3, and we found that 0.25 is the best P content to obtain the lowest Li+ migration energy barrier using the BV method; therefore, subsequently, we only considered Li0.75Si0.75P0.25ON by AIMD. Sixteen configurations were constructed to simulate Si/P and Li/vacancy coexistence. The total energies of these structures and the Li+ ion diffusion barrier evaluated using the BV method are listed in Table S1. The structure with the lowest total energy was regarded as the most stable and selected to further investigate the Li+ ion diffusion properties with the AIMD technique in the P-doped LiSiON system. The MSD of Li+ ions simulated using AIMD for P-doped LiSiON is shown in Figure 8, and a similar Li+ ion diffusion ability was found compared to amorphous-LiSiON, indicating that creating Li vacancies in advance by heterovalent ion doping is also an effective way to optimize the kinetic properties within a candidate structural framework. The ion conductivity for P doping by extrapolation to the room temperature was 3.9 × 10⁻³ mS/cm. The effectiveness of P doping could be confirmed by comparing it to the 2.5 × 10⁻²⁰ mS/cm in a crystal LiSiON.
3. Discussion and Conclusions
We chose LiSiON as an example of oxynitride, in order to discuss the superionic kinetic properties of materials with a similar mixed anion size. Si is the second richest element in the Earth’s crust and may be suitable for large-scale applications in batteries. Besides the approximate radius between O2− and N3−, Si is also easier to be doped with P, which provides a large chemical space for Li-Si-O-N to investigate. Although LiSiON has a small migration energy barrier, the large formation energy of the Li vacancy is the rate limitation for self-diffusion of Li in LiSiON. Amorphization and doping to create carriers have been proven to be good choices for improving ionic conductivity. Some experiments [32,33,34] revealed that the similar components or amorphization in the Li-Si-P-O-N chemical space will enhance the ionic conductivity, which is consistent with our theoretical prediction for the LiSiON system. In Table S4, we calculated that the ion conductivities for crystal/amorphous/P-doped are 2.5 × 10⁻²⁰, 8.1 and 3.9 × 10⁻³ mS/cm, respectively, by extrapolation to room temperature. It is evident that doping and amorphization can enhance ion conductivity.
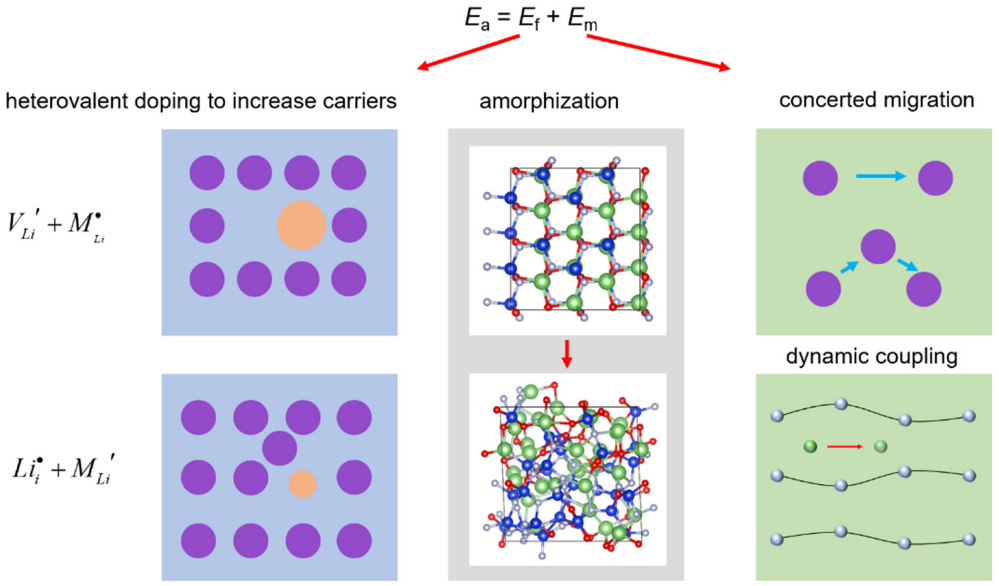
Combined with other possible strategies, such as introducing concerted migration [35] and dynamic coupling [36,37,38,39], the methods for improving the ionic conductivity for a candidate framework are summarized in Figure 9. Meanwhile, the Li+ concentrations can be adjusted by heterovalent doping, and may be suitable for the different sides in batteries. According to the space charge interface model [40,41,42], they may match the cation/anode with suitable doping, as shown in the first column of Figure 9. The creation of a vacancy (upper panel) and interstitial (lower panel) will provide Li-poor and Li-rich samples. Moreover, they may be suitable for the cation or anode sides, respectively. In addition, the Li+ concentrations may affect the electrochemical stability window [43,44], and the combination of different concentrations for the two sides may be a good choice to enlarge the electrochemical window.
In summary, we have discussed the ionic conductivity of LiSiON. Vacancy-assisted Li+ diffusion in LiSiON is improved by amorphization or by doping P5+ to form a Li-poor material. In additional, amorphization will reduce the Ea for diffusion, due to the abundant coordination, while heterovalent doping will provide Li vacancies in advance. Both of these increase the carrier concentration in the structure and effectively improve the Li+ diffusion behavior. We hope our work will be helpful for designing solid state electrolytes for lithium batteries.
4. Materials and Methods
4.1. DFT-Based Structural Relaxation and Band Structure Calculations
The present calculations were performed with the Vienna ab initio simulation package (VASP) [45] using the generalized gradient approximation, with a parameterized exchange–correlation functional according to Perdew–Burke–Ernzerhof [46]. The cutoffs for the wavefunction and density were 500 eV and 756 eV, respectively. For the crystal structure optimization and the electronic structure evaluation, the k-mesh used to sample the Brillouin zone was 10 × 8 × 11 for the conventional cell, and 5 × 5 × 5 for the supercell. In both cases, the Γ point was included. The non-spin-polarized scheme was adopted for all the simulations in this work. Both ions and cells was relaxed in the optimization, with the energy and force convergence criterions of 10−5 eV and 0.01 eV/Å, respectively.
4.2. BV and NEB Simulations
Both the semi-empirical bond valence (BV) method and accurate quantum mechanical calculations based on density functional theory (DFT) were adopted to understand the kinetic properties of α-LiSiON. The initial estimation of the Li+ ion diffusion pathways utilized BV calculations [15,26], in which the Li+ ions were assumed to move within the framework composed of immobile anions and cations. The interactions between a dummy Li+ ion in the space and the ions around it were empirically evaluated by summation of the attraction between Li+ and anions described by the Morse-type potential and the repulsion between Li+ and cations expressed by the Coulombic potential. Maps of the total potential energy, E(Li), on grids of points with a resolution of 0.1 Å were built in the unit cell. Then, the threshold value of E(Li) to form a continuous pathway was estimated as the Li+ migration energy barrier. The energy barriers of the typical pathways found in the BV simulations were calculated using the NEB method [27], with the energy and force convergence criterions of 10−5 eV and 0.02 eV/Å, respectively.
4.3. The Model Building of Amorphous-LiSiON
To create the amorphous structure of LiSiON, we started from the crystalline α-LiSiON lattice in a 2 × 2 × 2 supercell, with 128 atoms in total. The ab initio molecular dynamics (AIMD) method was adopted to build the atomic position for the disorder phase. First, the ensemble was melted at 3000 K and allowed to equilibrate at this temperature for 20 ps with a timestep of 2 fs. The system was then quenched to room temperature at a rate of 1 K per timestep. We subsequently relaxed the atomic coordinates and length of the cell lattice with an atomic force tolerance of 0.01 eV/Å. The molecular dynamics calculations were carried out on the Γ point to equilibrate the computational cost and the accuracy.
4.4. The AIMD Simulations
The kinetic properties of Li+ ion diffusion were studied using the AIMD method. The simulations were performed on a 2 × 2 × 2 supercell containing 32 formula units (128 atoms in total), and only the Γ point was used for Brillouin zone sampling. The AIMD run was carried out with a Nose thermostat for 40,000 steps, with a time step of 1 fs. No obvious Li migration was observed in the simulations with temperatures of 1600 and 1800 K. To keep the computational cost at a reasonable level, we raised the temperature to increase the possibility of Li ion diffusion; and the results of the latter were used to investigate the diffusion pathways. The kinetic properties were extracted using the molecular dynamics analysis package developed by Mo et al. [28].
Supplementary Materials
The following supporting information can be downloaded at: https://0-www-mdpi-com.brum.beds.ac.uk/article/10.3390/inorganics10040045/s1, Figure S1: The mean-squared-displacements (MSD) for Li+, Si4+, O2−, and N3− ions simulated by AIMD; Figure S2: The partial radial distribution function (PRDF) for Li-O, Li-N, Si-O, and Si-N pairs in amorphous-LiSiON; Tables S1–S3: The total energies (Etot) of 16/12/4 configurations for Li0.75Si0.75P0.25ON/Li0.5Si0.5P0.5ON/Li0.25Si0.25P0.75ON and the Li+ ion diffusion barriers evaluated using the BV method (Ea by BV); Table S4: The estimated value for the ionic conductivities at 300 K for crystal α-LiSiON, amorphous-LiSiON and P-doped LiSiON (Li0.75Si0.75P0.25ON) according to the Arrhenius plot of diffusion coefficients.
Author Contributions
Conceptualization, R.X. and H.L.; validation, S.W. and R.X.; investigation, S.W. and R.X.; data curation, S.W. and R.X.; writing—original draft preparation, S.W. and R.X.; writing—review and editing, R.X. and H.L.; supervision, H.L. and L.C. All authors have read and agreed to the published version of the manuscript.
Funding
This research was funded by the National Natural Science Foundation of China (grant number 52022106 and 52172258) and the Informatization Plan of Chinese Academy of Sciences (grant number CAS-WX2021SF-0102).
Data Availability Statement
Data available on request.
Acknowledgments
We acknowledge the Tianjin Supercomputer Center for providing computing resources.
Conflicts of Interest
The authors declare no conflict of interest.
References
- Armand, M.; Tarascon, J.M. Building better batteries. Nature 2008, 451, 652–657. [Google Scholar] [CrossRef] [PubMed]
- Goodenough, J.B.; Kim, Y. Challenges for Rechargeable Li Batteries. Chem. Mater. 2010, 22, 587–603. [Google Scholar] [CrossRef]
- Viswanathan, V.; Epstein, A.H.; Chiang, Y.; Takeuchi, E.; Bradley, M.; Langford, J.; Winter, M. The challenges and opportunities of battery-powered flight. Nature 2022, 601, 519–525. [Google Scholar] [CrossRef]
- Hu, Y. Batteries: Getting solid. Nat. Energy 2016, 1, 16042. [Google Scholar] [CrossRef]
- Janek, J.; Zeier, W. A solid future for battery development. Nat. Energy 2016, 1, 16141. [Google Scholar] [CrossRef]
- Balaish, M.; Gonzalez-Rosillo, J.; Kim, K.; Zhu, Y.; Hood, Z.; Rupp, J.M. Processing thin but robust electrolytes for solid-state batteries. Nat. Rev. Mater. 2020, 5, 229. [Google Scholar] [CrossRef]
- Xu, L.; Lu, Y.; Zhao, C.; Yuan, H.; Zhu, G.; Hou, L.; Zhang, Q.; Huang, J. Toward the Scale-Up of Solid-State Lithium Metal Batteries: The Gaps between Lab-Level Cells and Practical Large-Format Batteries. Adv. Energy Mater. 2020, 11, 2002360. [Google Scholar] [CrossRef]
- Kamaya, N.; Homma, K.; Yamakawa, Y.; Hirayama, M.; Kanno, R.; Yonemura, M.; Kamiyama, T.; Kato, Y.; Hama, S.; Kawamoto, K.; et al. A lithium superionic conductor. Nat. Mater. 2011, 10, 682–686. [Google Scholar] [CrossRef]
- Kato, Y.; Hori, S.; Saito, T.; Suzuki, K.; Hirayama, M.; Mitsui, A.; Yonemura, M.; Iba, H.; Kanno, R. High-power all-solid-state batteries using sulfide superionic conductors. Nat. Energy 2016, 1, 16030. [Google Scholar] [CrossRef]
- Bates, J.; Engstrom, H.; Wang, J.; Larson, B.; Dudney, N.; Brundage, W. Composition, ion-ion correlations and conductivity of beta″-alumina. Solid State Ionics 1981, 5, 159–162. [Google Scholar] [CrossRef]
- Murugan, R.; Thangadurai, V.; Weppner, W. Fast Lithium Ion Conduction in Garnet-Type Li7La3Zr2O12. Angew. Chem. Int. Ed. 2007, 46, 7778–7781. [Google Scholar] [CrossRef] [PubMed]
- Inaguma, Y.; Chen, L.; Itoh, M.; Nakamura, T.; Uchida, T.; Ikuta, H.; Wakihara, M. High ionic conductivity in lithium lanthanum titanate. Solid State Commun. 1993, 86, 689–693. [Google Scholar] [CrossRef]
- Fu, J. Fast Li+ ion conducting glass-ceramics in the system Li2O–Al2O3–GeO2–P2O5. Solid State Ionics 1997, 10, 191–194. [Google Scholar] [CrossRef]
- Huang, W.; Matsui, N.; Hori, S.; Suzuki, K.; Hirayama, M.; Yonemura, M.; Saito, T.; Kamiyama, T.; Sasaki, Y.; Yoon, Y.; et al. Anomalously High Ionic Conductivity of Li2SiS3-Type Conductors. J. Am. Chem. Soc. 2022, 144, 4989–4994. [Google Scholar] [CrossRef] [PubMed]
- Xiao, R.; Li, H.; Chen, L. High-throughput design and optimization of fast lithium ion conductors by the combination of bond-valence method and density functional theory. Sci. Rep. 2015, 5, 14227. [Google Scholar] [CrossRef] [Green Version]
- Wang, X.; Xiao, R.; Li, H.; Chen, L. Oxygen-driven transition from two-dimensional to three-dimensional transport behaviour in β-Li3PS4 electrolyte. Phys. Chem. Chem. Phys. 2016, 18, 21269–21277. [Google Scholar] [CrossRef]
- Wang, X.; Xiao, R.; Li, H.; Chen, L. Oxysulfide LiAlSO: A Lithium Superionic Conductor from First Principles. Phys. Rev. Lett. 2017, 118, 195901. [Google Scholar] [CrossRef] [Green Version]
- He, J.; Yao, Z.; Hegde, V.; Naghavi, S.; Shen, J.; Bushick, K.; Wolverton, C. Computational Discovery of Stable Heteroanionic Oxychalcogenides ABXO (A, B = Metals; X = S, Se, and Te) and Their Potential Applications. Chem. Mater. 2020, 32, 8229–8242. [Google Scholar] [CrossRef]
- Angell, C.A. Mobile Ions in Amorphous Solids. Annu. Rev. Phys. Chem. 1992, 43, 693–717. [Google Scholar] [CrossRef]
- Bates, J.B.; Dudney, N.J.; Gruzalski, G.R.; Zuhr, R.A.; Choudhury, A.; Luck, C.F.; Robertson, J.D. Fabrication and characterization of amorphous lithium electrolyte thin films and rechargeable thin-film batteries. J. Power Source 1993, 43, 103–110. [Google Scholar] [CrossRef]
- Takuya, K.; Chie, H.; Atsushi, S.; Akitoshi, H.; Masahiro, T. Mechanochemical synthesis and characterization of amorphous Li2CN2 as a lithium ion conductor. J. Ceram. Soc. Jpn. 2019, 127, 518–520. [Google Scholar]
- Minami, T.; Hayashi, A.; Tatsumisago, M. Recent progress of glass and glass-ceramics as solid electrolytes for lithium secondary batteries. Solid State Ionics 2006, 177, 2715–2720. [Google Scholar] [CrossRef]
- Laurent, Y.; Guyader, J.; Roult, G. Etude par diffraction de neutrons selon la method du temps de vol de LiSiONα. Acta Cryst. 1981, 37, 911–913. [Google Scholar] [CrossRef]
- Podsiadlo, S. Formation and Thermal Decomposition of Silicon Oxynitride Compounds II. J. Therm. Anal. 1987, 32, 445–449. [Google Scholar] [CrossRef]
- Du, Y.A.; Holzwarth, N.A.W. First-principles study of LiPON and related solid electrolytes. Phys. Rev. B 2010, 81, 184106. [Google Scholar]
- Adams, S.; Rao, R.P. High power lithium ion battery materials by computational design. Phys. Status Solidi A 2011, 208, 1746–1753. [Google Scholar] [CrossRef]
- Henkelman, G.; Jónsson, H. Improved tangent estimate in the nudged elastic band method for finding minimum energy paths and saddle points. J. Chem. Phys. 2000, 113, 9978. [Google Scholar] [CrossRef] [Green Version]
- He, X.; Zhu, Y.; Epstein, A.; Mo, Y. Statistical variances of diffusional properties from ab initio molecular dynamics simulations. npj Comput. Mater. 2018, 4, 18. [Google Scholar] [CrossRef] [Green Version]
- Stefano, D.D.; Miglio, A.; Robeyns, K.; Filinchuk, Y.; Lechartier, M.; Senyshyn, A.; Ishida, H.; Spannenberger, S.; Prutsch, D.; Lunghammer, S.; et al. Superionic diffusion through frustrated energy landscape. Chem 2019, 5, 2450–2460. [Google Scholar] [CrossRef] [Green Version]
- Xiao, R.; Li, H.; Chen, L.Q. High-throughput computational discovery of K2CdO2 as an ion conductor for solid-state potassium-ion batteries. J. Mater. Chem. A 2020, 8, 5157. [Google Scholar] [CrossRef]
- Singh, S.P.; Schneider, J.F.; Kundu, S.; Rodrigues, A.C.M.; de Mattos, P.P.G.; Zanotto, E.D.; Rocherullé, J.; Bénard-Rocherullé, P.; Lebullenger, R. Structure and ionic conductivity of nitrated lithium disilicate (LiSiON) glasses. Mater. Chem. Phys. 2018, 211, 438–444. [Google Scholar] [CrossRef]
- Famprikis, T.; Galipaud, J.; Clemens, O.; Pecquenard, B.; Le Cras, F. Composition Dependence of Ionic Conductivity in LiSiPO(N) Thin-Film Electrolytes for Solid-State Batteries. ACS Appl. Energy Mater. 2019, 2, 4782–4791. [Google Scholar] [CrossRef]
- Lee, S.J.; Bae, J.H.; Lee, H.W.; Baik, H.K.; Lee, S.M. Electrical conductivity in Li–Si–P–O–N oxynitride thin-films. J. Power Sources 2003, 123, 61–64. [Google Scholar] [CrossRef]
- Xia, Q.; Sun, S.; Zan, F.; Xu, J.; Xia, H. Amorphous LiSiON Thin Film Electrolyte for All-solid-state Thin Film Lithium Battery. J. Inorg. Mater. 2022, 37, 230–236. [Google Scholar] [CrossRef]
- He, X.; Zhu, Y.; Mo, Y. Origin of fast ion diffusion in super-ionic conductors. Nat. Comm. 2017, 8, 15893. [Google Scholar] [CrossRef] [PubMed] [Green Version]
- Zhang, Z.; Roy, P.N.; Li, H.; Avdeev, M.; Nazar, L.F. Coupled Cation–Anion Dynamics Enhances Cation Mobility in Room-Temperature Superionic Solid-State Electrolytes. J. Am. Chem. Soc. 2019, 141, 19360–19372. [Google Scholar] [CrossRef] [PubMed]
- Zhang, Z.; Li, H.; Kaup, K.; Zhou, L.; Roy, P.N.; Nazar, L.F. Targeting Superionic Conductivity by Turning on Anion Rotation at Room Temperature in Fast Ion Conductors. Matter 2020, 2, 1667–1684. [Google Scholar] [CrossRef]
- Zhang, Z.; Nazar, L. Exploiting the paddle-wheel mechanism for the design of fast ion conductors. Nat. Rev. Mater. 2022, 1–17. [Google Scholar] [CrossRef]
- Wu, S.; Xiao, R.; Li, H.; Chen, L. New insights into the mechanism of cation migration induced by cation–anion dynamic coupling in superionic conductors. J. Mater. Chem. A 2022, 10, 3093–3101. [Google Scholar] [CrossRef]
- Morgan, B.J.; Madden, P.A. Effects of Lattice Polarity on Interfacial Space Charges and Defect Disorder in Ionically Conducting AgI Heterostructures. Phys. Rev. Lett. 2011, 107, 206102. [Google Scholar] [CrossRef]
- Fu, L.; Chen, C.C.; Samuelis, D.; Maier, J. Thermodynamics of Lithium Storage at Abrupt Junctions: Modeling and Experimental Evidence. Phys. Rev. Lett. 2014, 112, 208301. [Google Scholar] [CrossRef]
- Swift, M.; Qi, Y. First-Principles Prediction of Potentials and Space-Charge Layers in All-Solid-State Batteries. Phys. Rev. Lett. 2019, 122, 167701. [Google Scholar] [CrossRef] [PubMed] [Green Version]
- Schwietert, T.K.; Vasileiadis, A.; Wagemaker, M. First-Principles Prediction of the Electrochemical Stability and Reaction Mechanisms of Solid-State Electrolytes. J. Am. Chem. Soc. Au 2021, 1, 1488–1496. [Google Scholar] [CrossRef] [PubMed]
- Richards, W.D.; Miara, L.J.; Wang, Y.; Kim, J.C.; Ceder, G. Interface Stability in Solid-State Batteries. Chem. Mater. 2016, 28, 266–273. [Google Scholar] [CrossRef]
- Kresse, G.; Furthmüller, J. Efficiency of ab-initio total energy calculations for metals and semiconductors using a plane-wave basis set. Comput. Mater. Sci. 1996, 6, 15–50. [Google Scholar]
- Perdew, J.P.; Burke, K.; Ernzerhof, M. Generalized Gradient Approximation Made Simple. Phys. Rev. Lett. 1996, 77, 3865. [Google Scholar] [CrossRef] [Green Version]
Figure 1.
(a) The crystal structure and (b) the band structure of α-LiSiON. The green, blue, red, and gray spheres represent Li, Si, O, and N atoms, respectively.
Figure 1.
(a) The crystal structure and (b) the band structure of α-LiSiON. The green, blue, red, and gray spheres represent Li, Si, O, and N atoms, respectively.

Figure 2.
The Li+ diffusion pathways evaluated using the bond valence method and represented by yellow isosurfaces, with the isovalue of 0.90 eV, viewed in the (a) ab-, (b) ac-, and (c) bc-plane. The green, blue, red, and gray spheres represent Li, Si, O, and N atoms, respectively.
Figure 2.
The Li+ diffusion pathways evaluated using the bond valence method and represented by yellow isosurfaces, with the isovalue of 0.90 eV, viewed in the (a) ab-, (b) ac-, and (c) bc-plane. The green, blue, red, and gray spheres represent Li, Si, O, and N atoms, respectively.

Figure 3.
The Li+ diffusion energy barriers of (a) the inline migration mode, and (b) the interline migration model simulated by the NEB method.
Figure 3.
The Li+ diffusion energy barriers of (a) the inline migration mode, and (b) the interline migration model simulated by the NEB method.

Figure 4.
(a) The mean-squared-displacements (MSD) for Li+ ions simulated by AIMD, and (b) the Arrhenius plot of diffusion coefficients for α-LiSiON, from which the Li+ ion diffusion energy barrier was obtained, with the error bars of logD given as vertical lines.
Figure 4.
(a) The mean-squared-displacements (MSD) for Li+ ions simulated by AIMD, and (b) the Arrhenius plot of diffusion coefficients for α-LiSiON, from which the Li+ ion diffusion energy barrier was obtained, with the error bars of logD given as vertical lines.

Figure 5.
(a) The disordered structure of amorphous-LiSiON frozen at 300 K, in which the green, blue, red, and gray spheres represent Li, Si, O, and N atoms, respectively. (b) The formation energy for each of the Li vacancy in amorphous-LiSiON and the coordination environment of each Li site. The value for creating one Li vacancy in crystalline α-LiSiON is indicated as a horizontal dotted line for comparison.

Figure 6.
(a) The MSD for Li+ ions simulated by AIMD, and (b) Arrhenius plot of diffusion coefficients for amorphous-LiSiON.
Figure 6.
(a) The MSD for Li+ ions simulated by AIMD, and (b) Arrhenius plot of diffusion coefficients for amorphous-LiSiON.

Figure 7.
The density of states for α-LiSiON (upper panel) and amorphous-LiSiON (lower panel).

Figure 8.
The MSD for Li+ ions simulated by AIMD for P-doped LiSiON.

Figure 9.
Strategies to improve the ionic conductivity for a candidate framework.

Publisher’s Note: MDPI stays neutral with regard to jurisdictional claims in published maps and institutional affiliations. |
© 2022 by the authors. Licensee MDPI, Basel, Switzerland. This article is an open access article distributed under the terms and conditions of the Creative Commons Attribution (CC BY) license (https://creativecommons.org/licenses/by/4.0/).
Share and Cite
MDPI and ACS Style
Wu, S.; Xiao, R.; Li, H.; Chen, L. Ionic Conductivity of LiSiON and the Effect of Amorphization/Heterovalent Doping on Li+ Diffusion. Inorganics 2022, 10, 45. https://0-doi-org.brum.beds.ac.uk/10.3390/inorganics10040045
AMA Style
Wu S, Xiao R, Li H, Chen L. Ionic Conductivity of LiSiON and the Effect of Amorphization/Heterovalent Doping on Li+ Diffusion. Inorganics. 2022; 10(4):45. https://0-doi-org.brum.beds.ac.uk/10.3390/inorganics10040045
Chicago/Turabian StyleWu, Siyuan, Ruijuan Xiao, Hong Li, and Liquan Chen. 2022. "Ionic Conductivity of LiSiON and the Effect of Amorphization/Heterovalent Doping on Li+ Diffusion" Inorganics 10, no. 4: 45. https://0-doi-org.brum.beds.ac.uk/10.3390/inorganics10040045
Note that from the first issue of 2016, this journal uses article numbers instead of page numbers. See further details here.