
TiO2-La2O3 as Photocatalysts in the Degradation of Naproxen

 ,
,
Abstract
:1. Introduction
2. Results and Discussion
2.1. Characterization
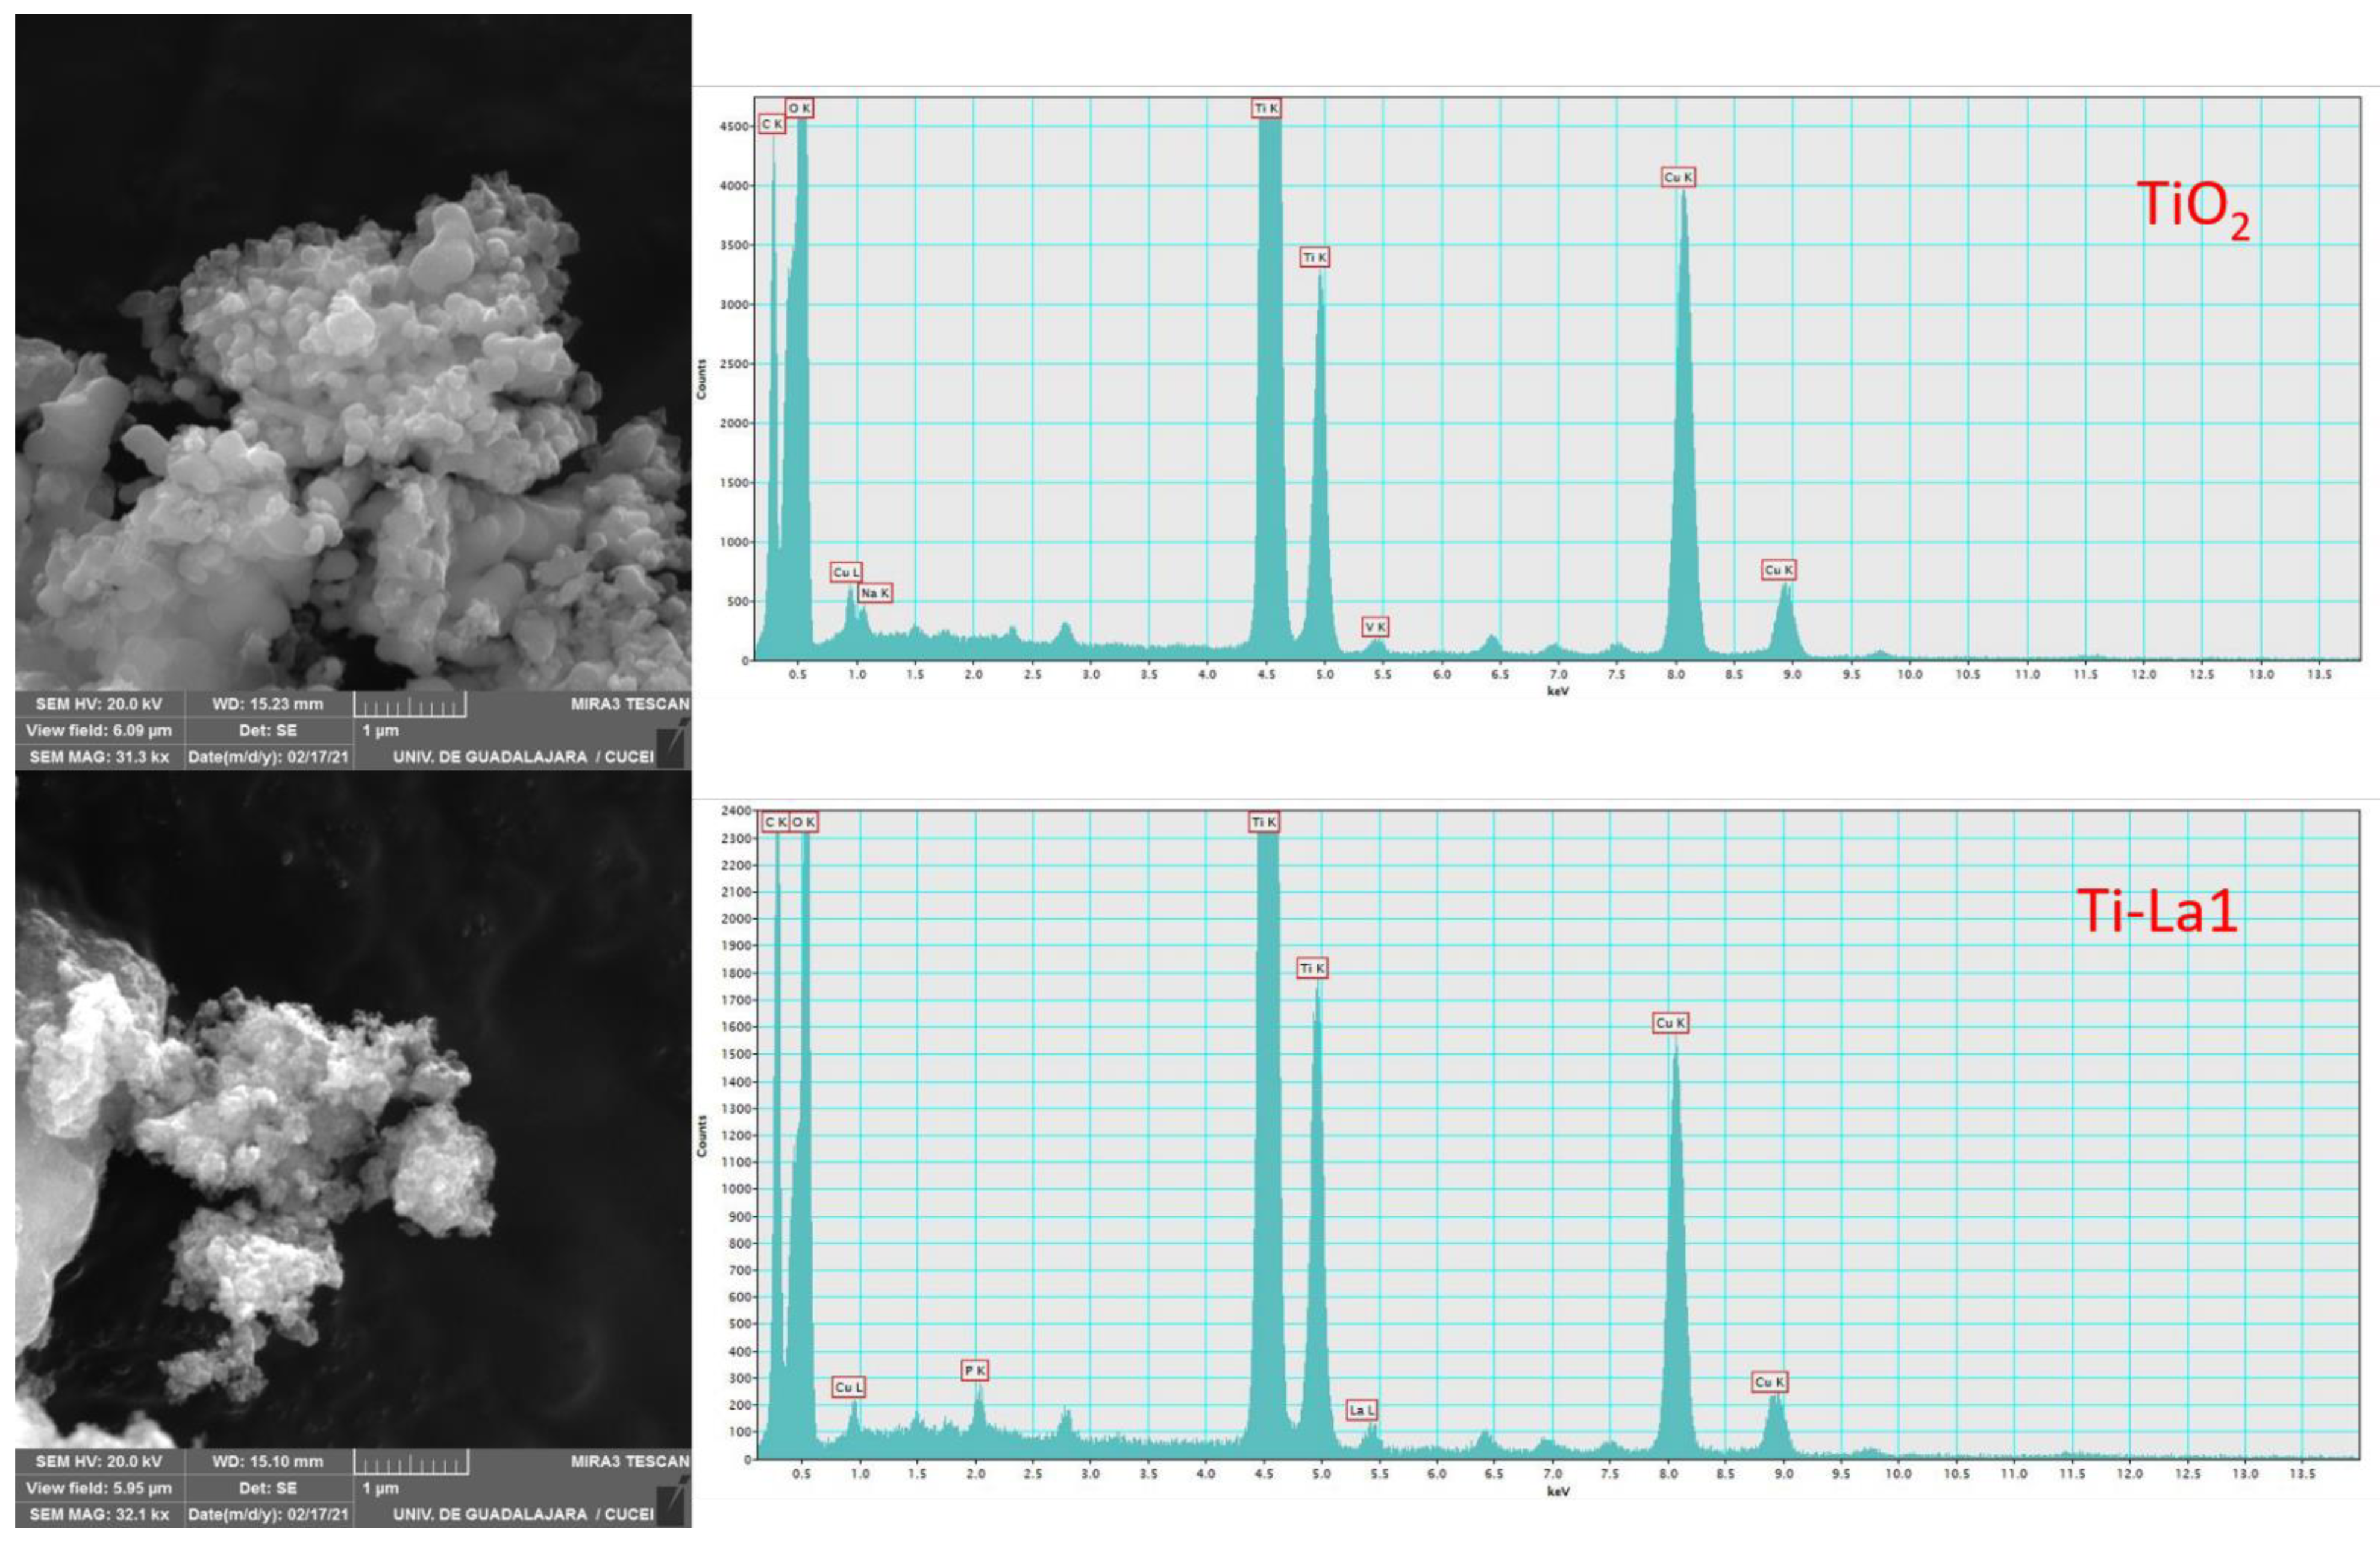
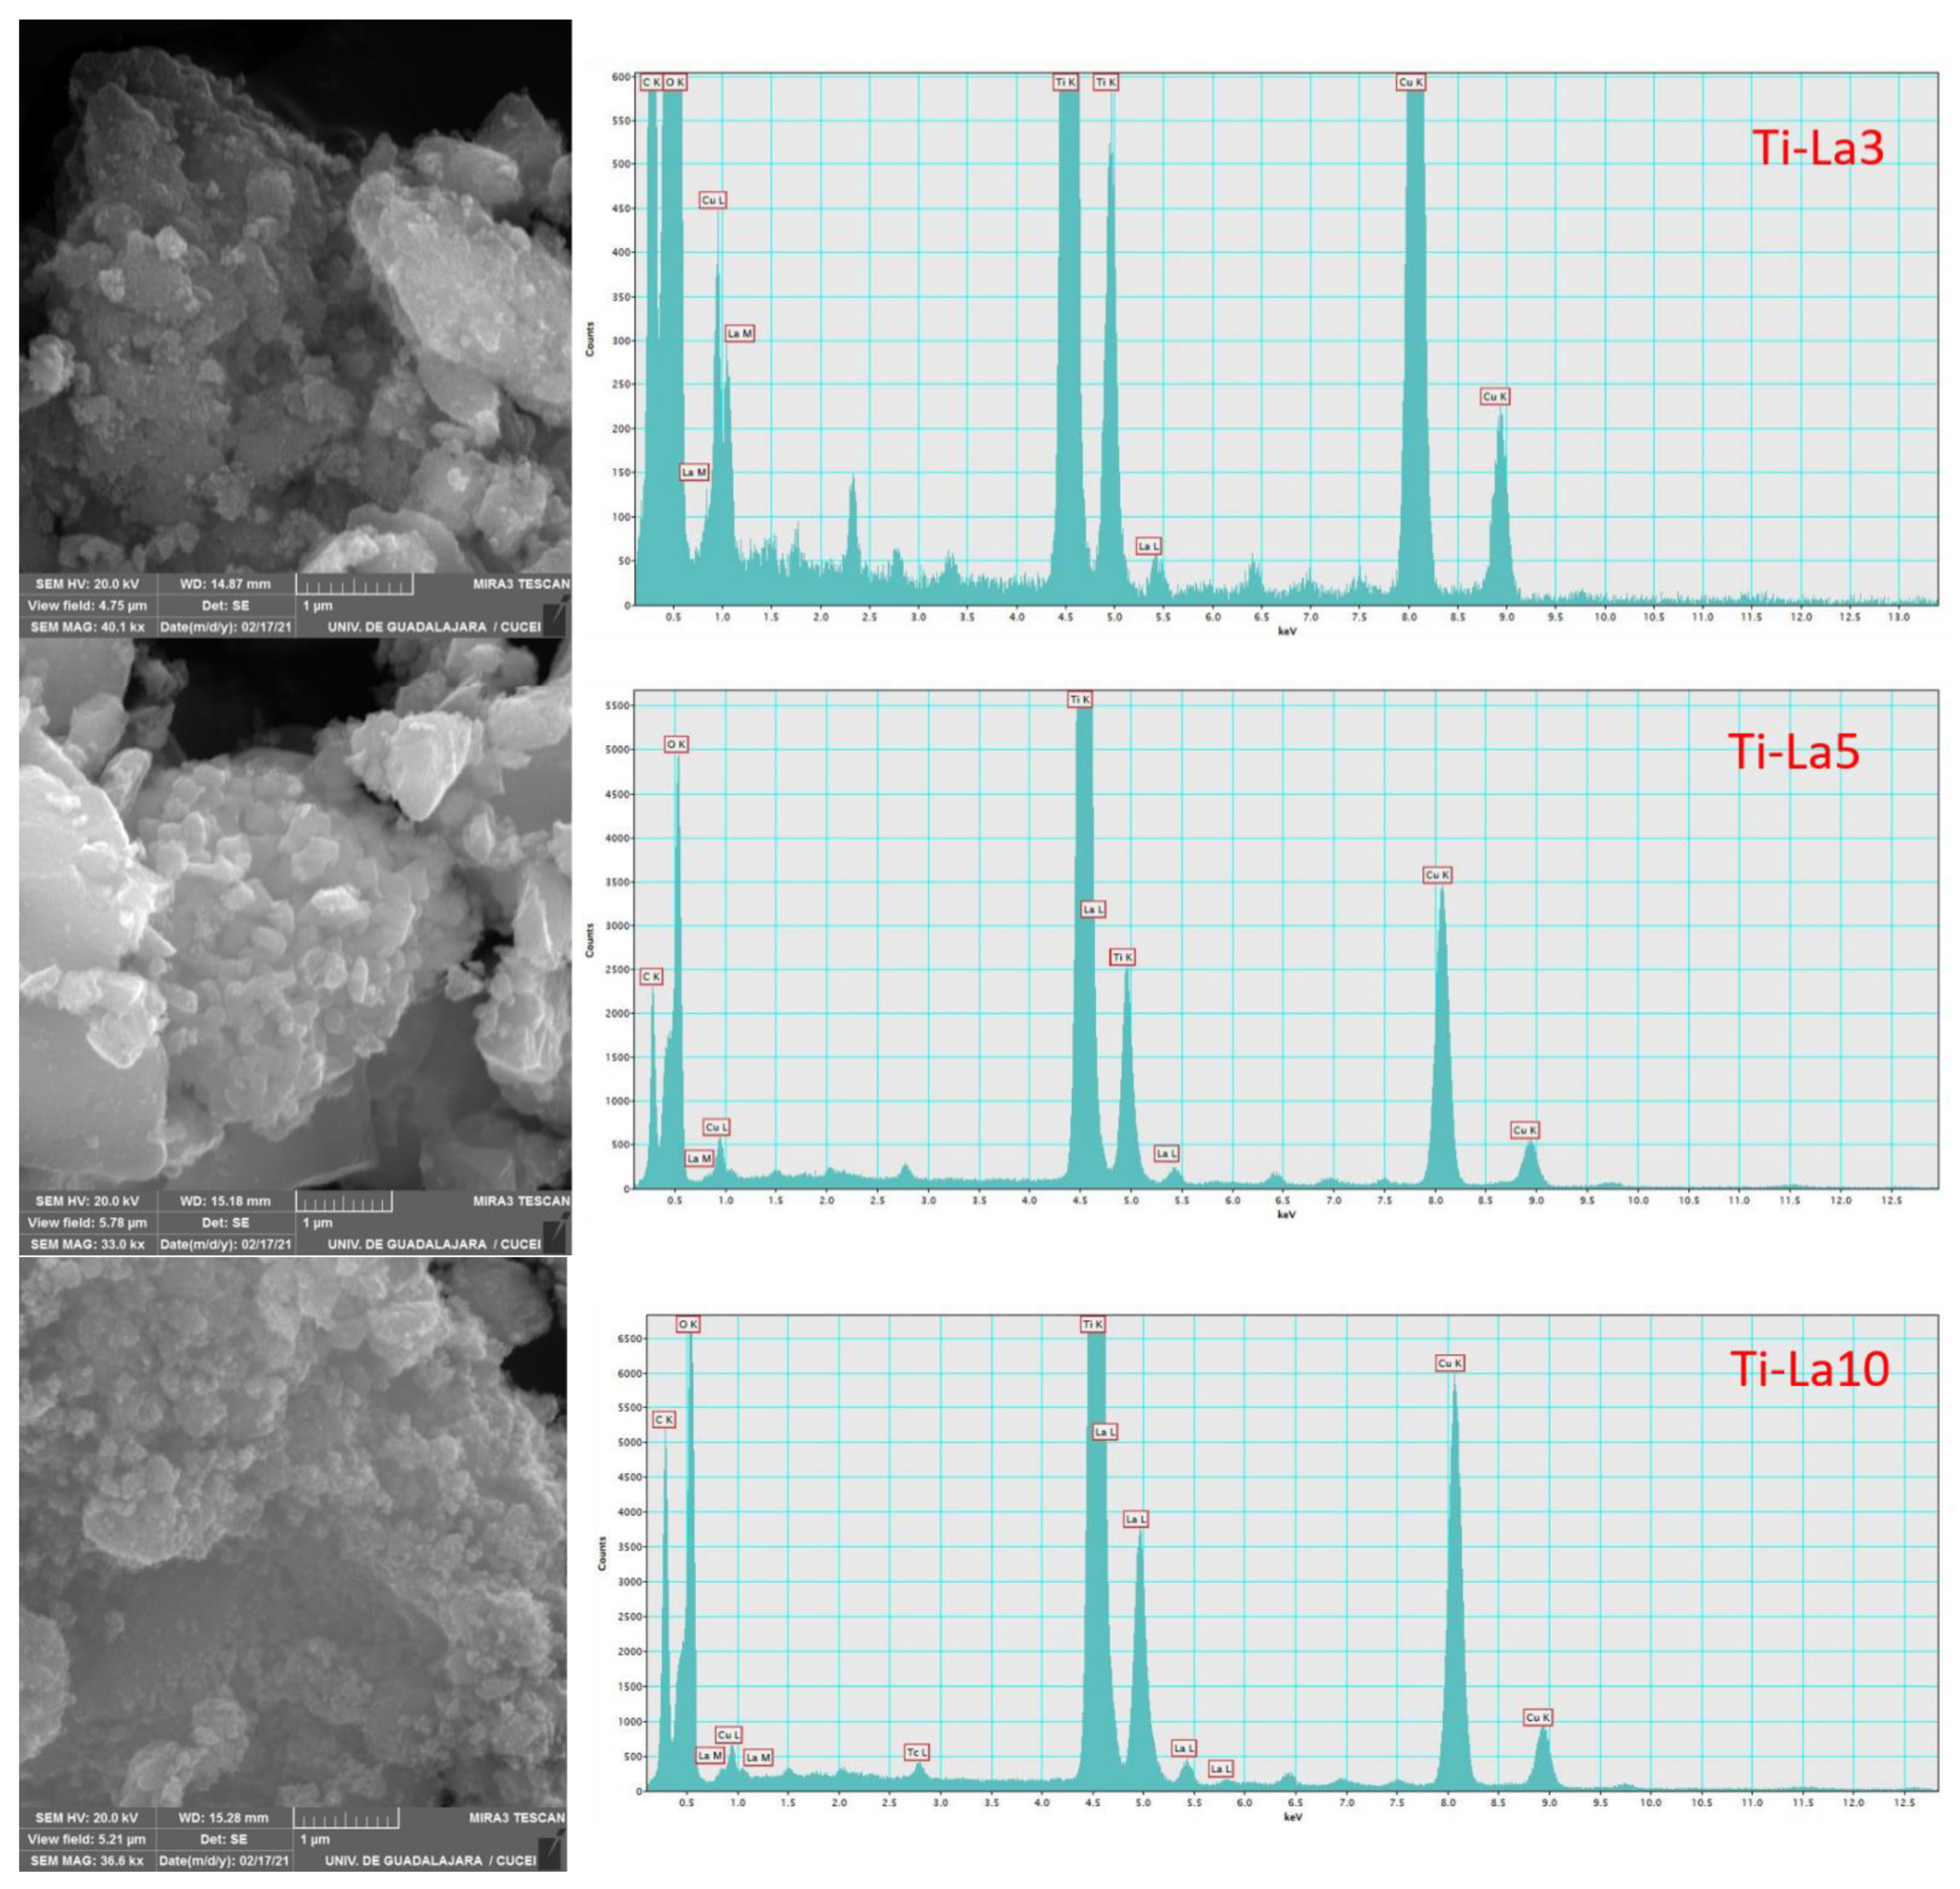
2.1.1. Scanning Electron Microscopy
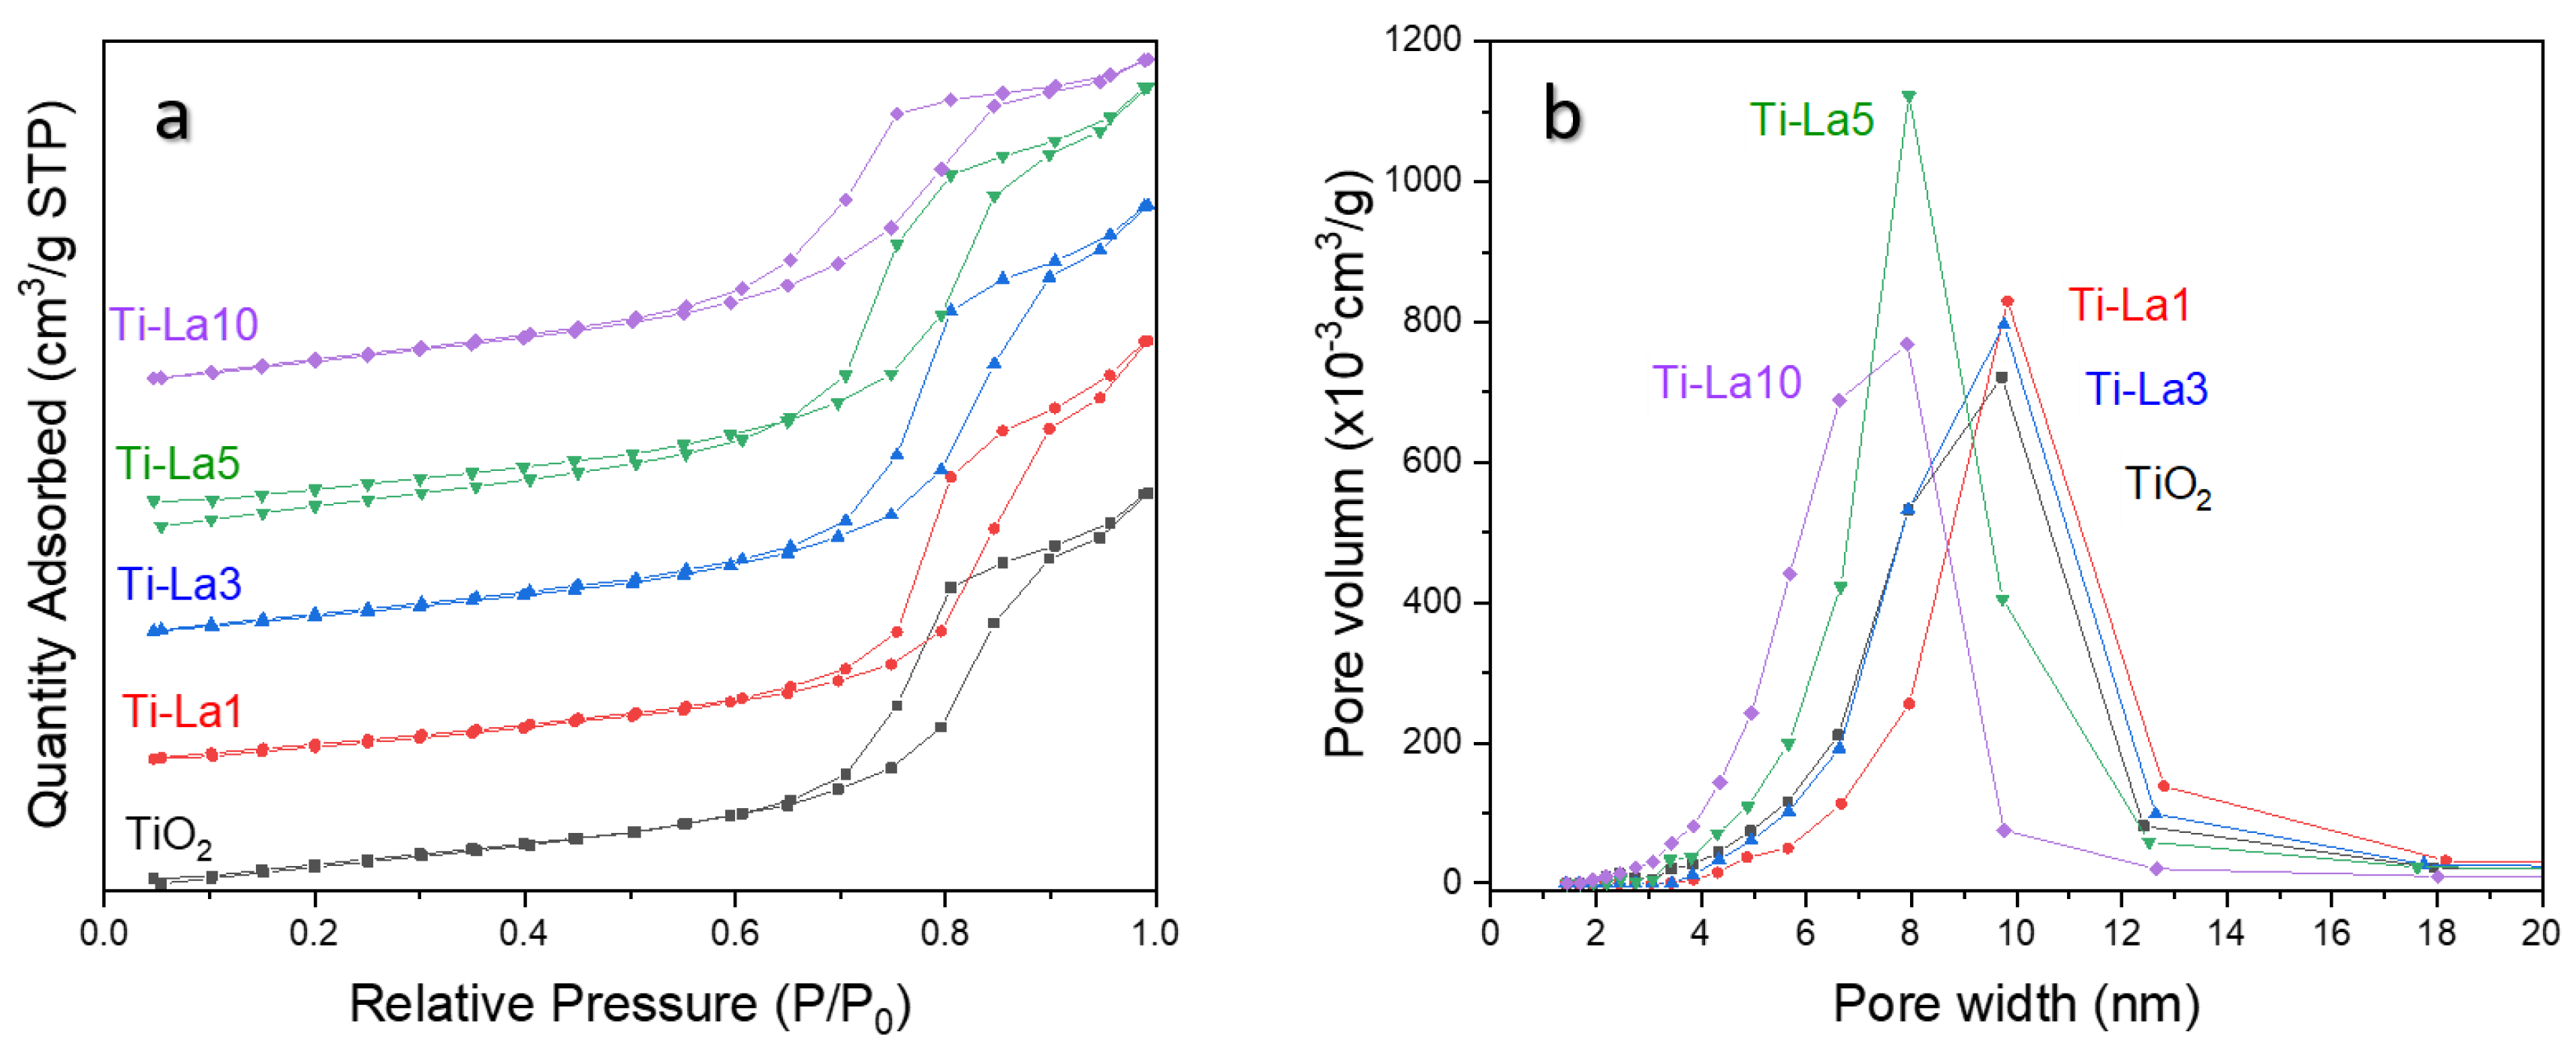
2.1.2. Nitrogen Physisorption
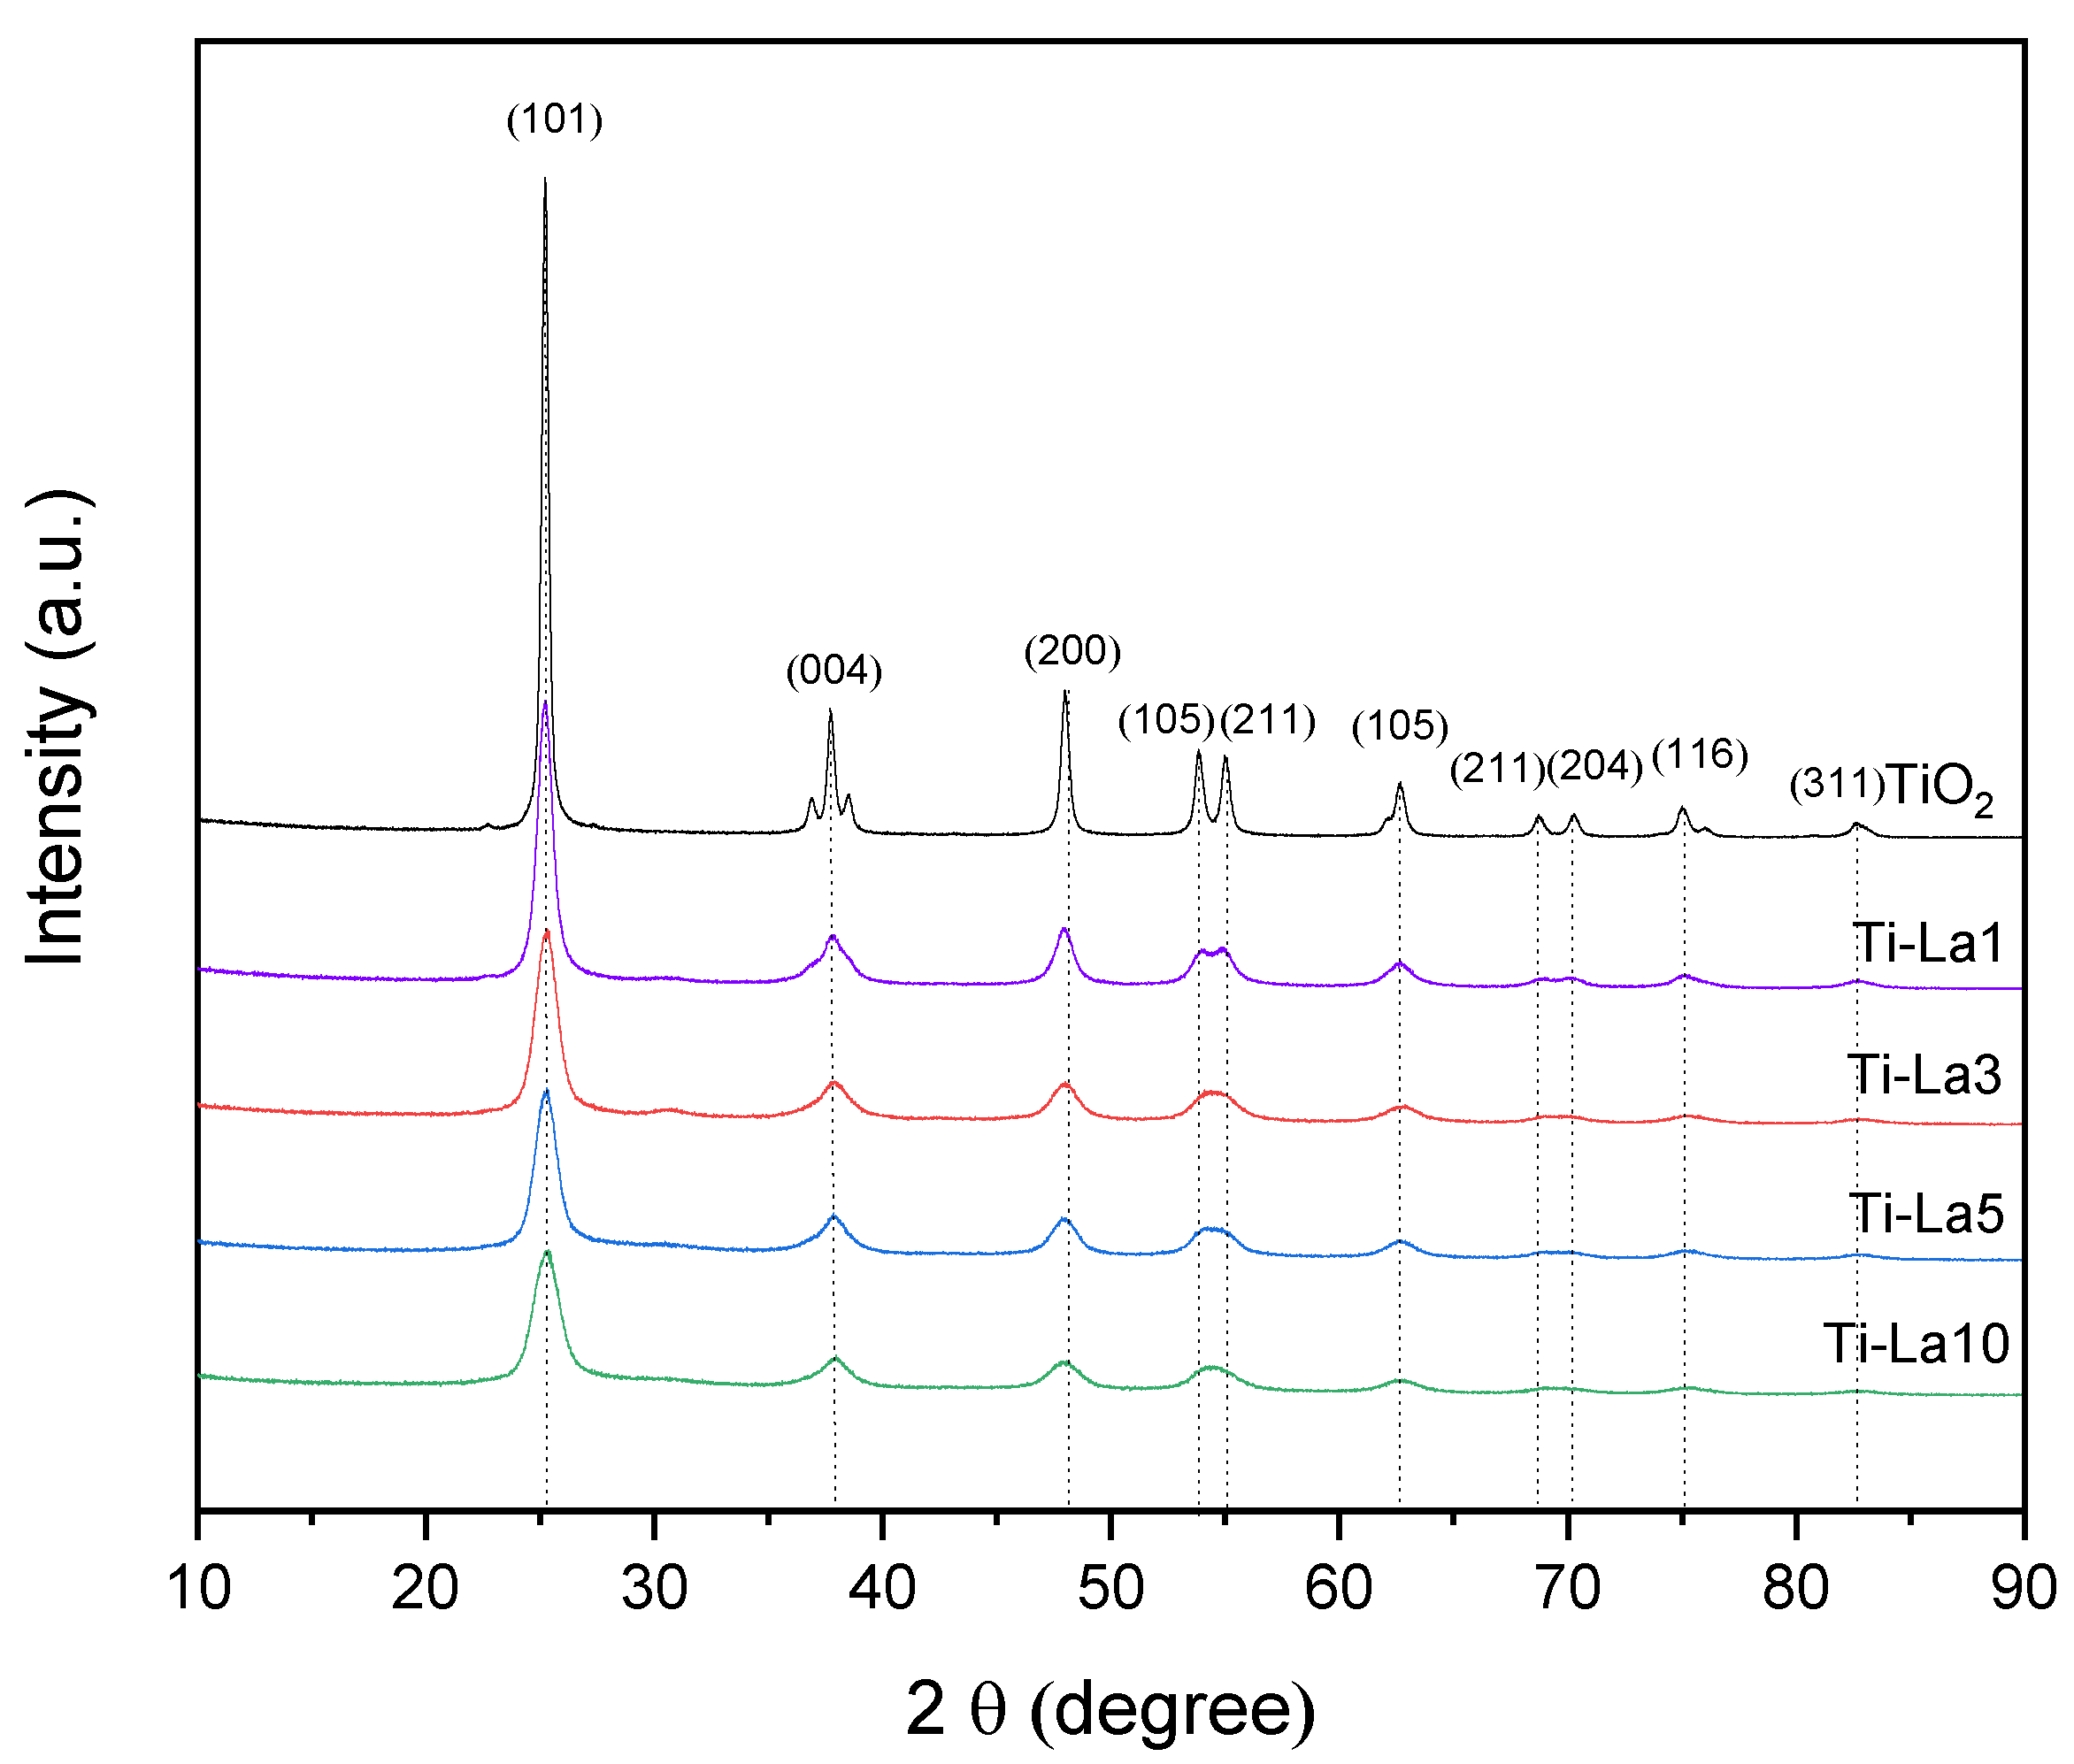
2.1.3. X-ray Diffraction
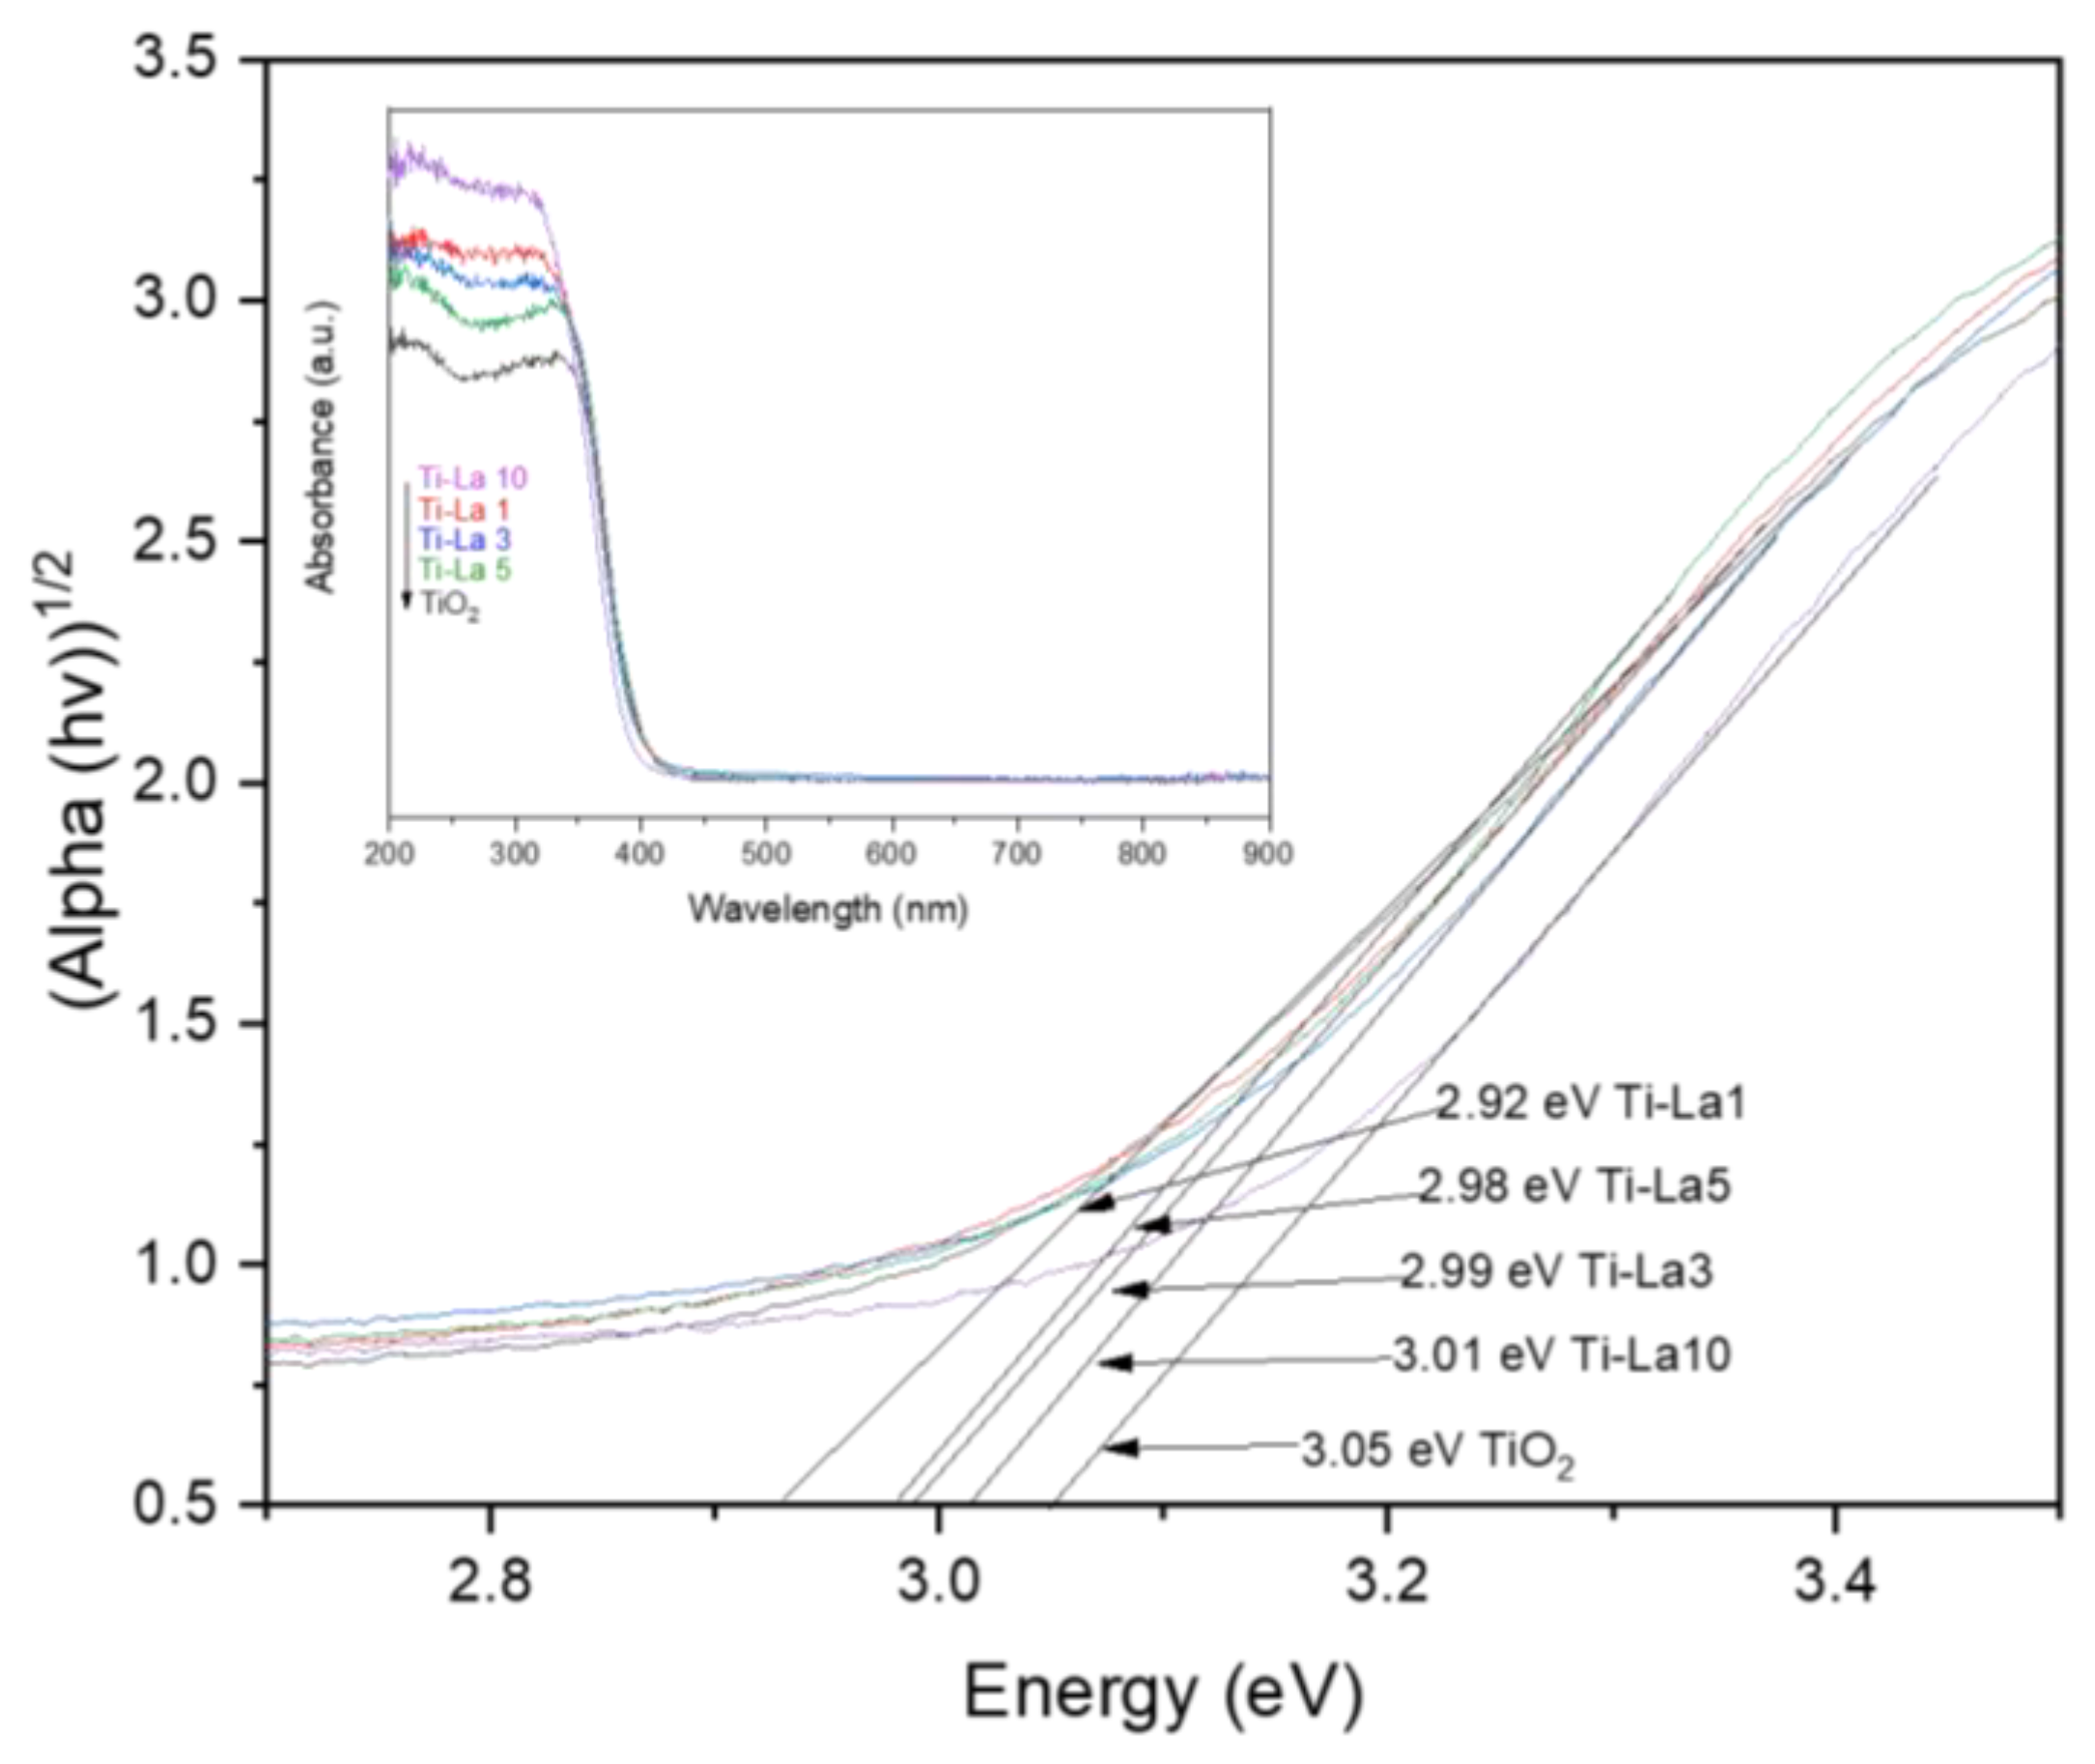
2.1.4. UV-Vis Spectroscopy
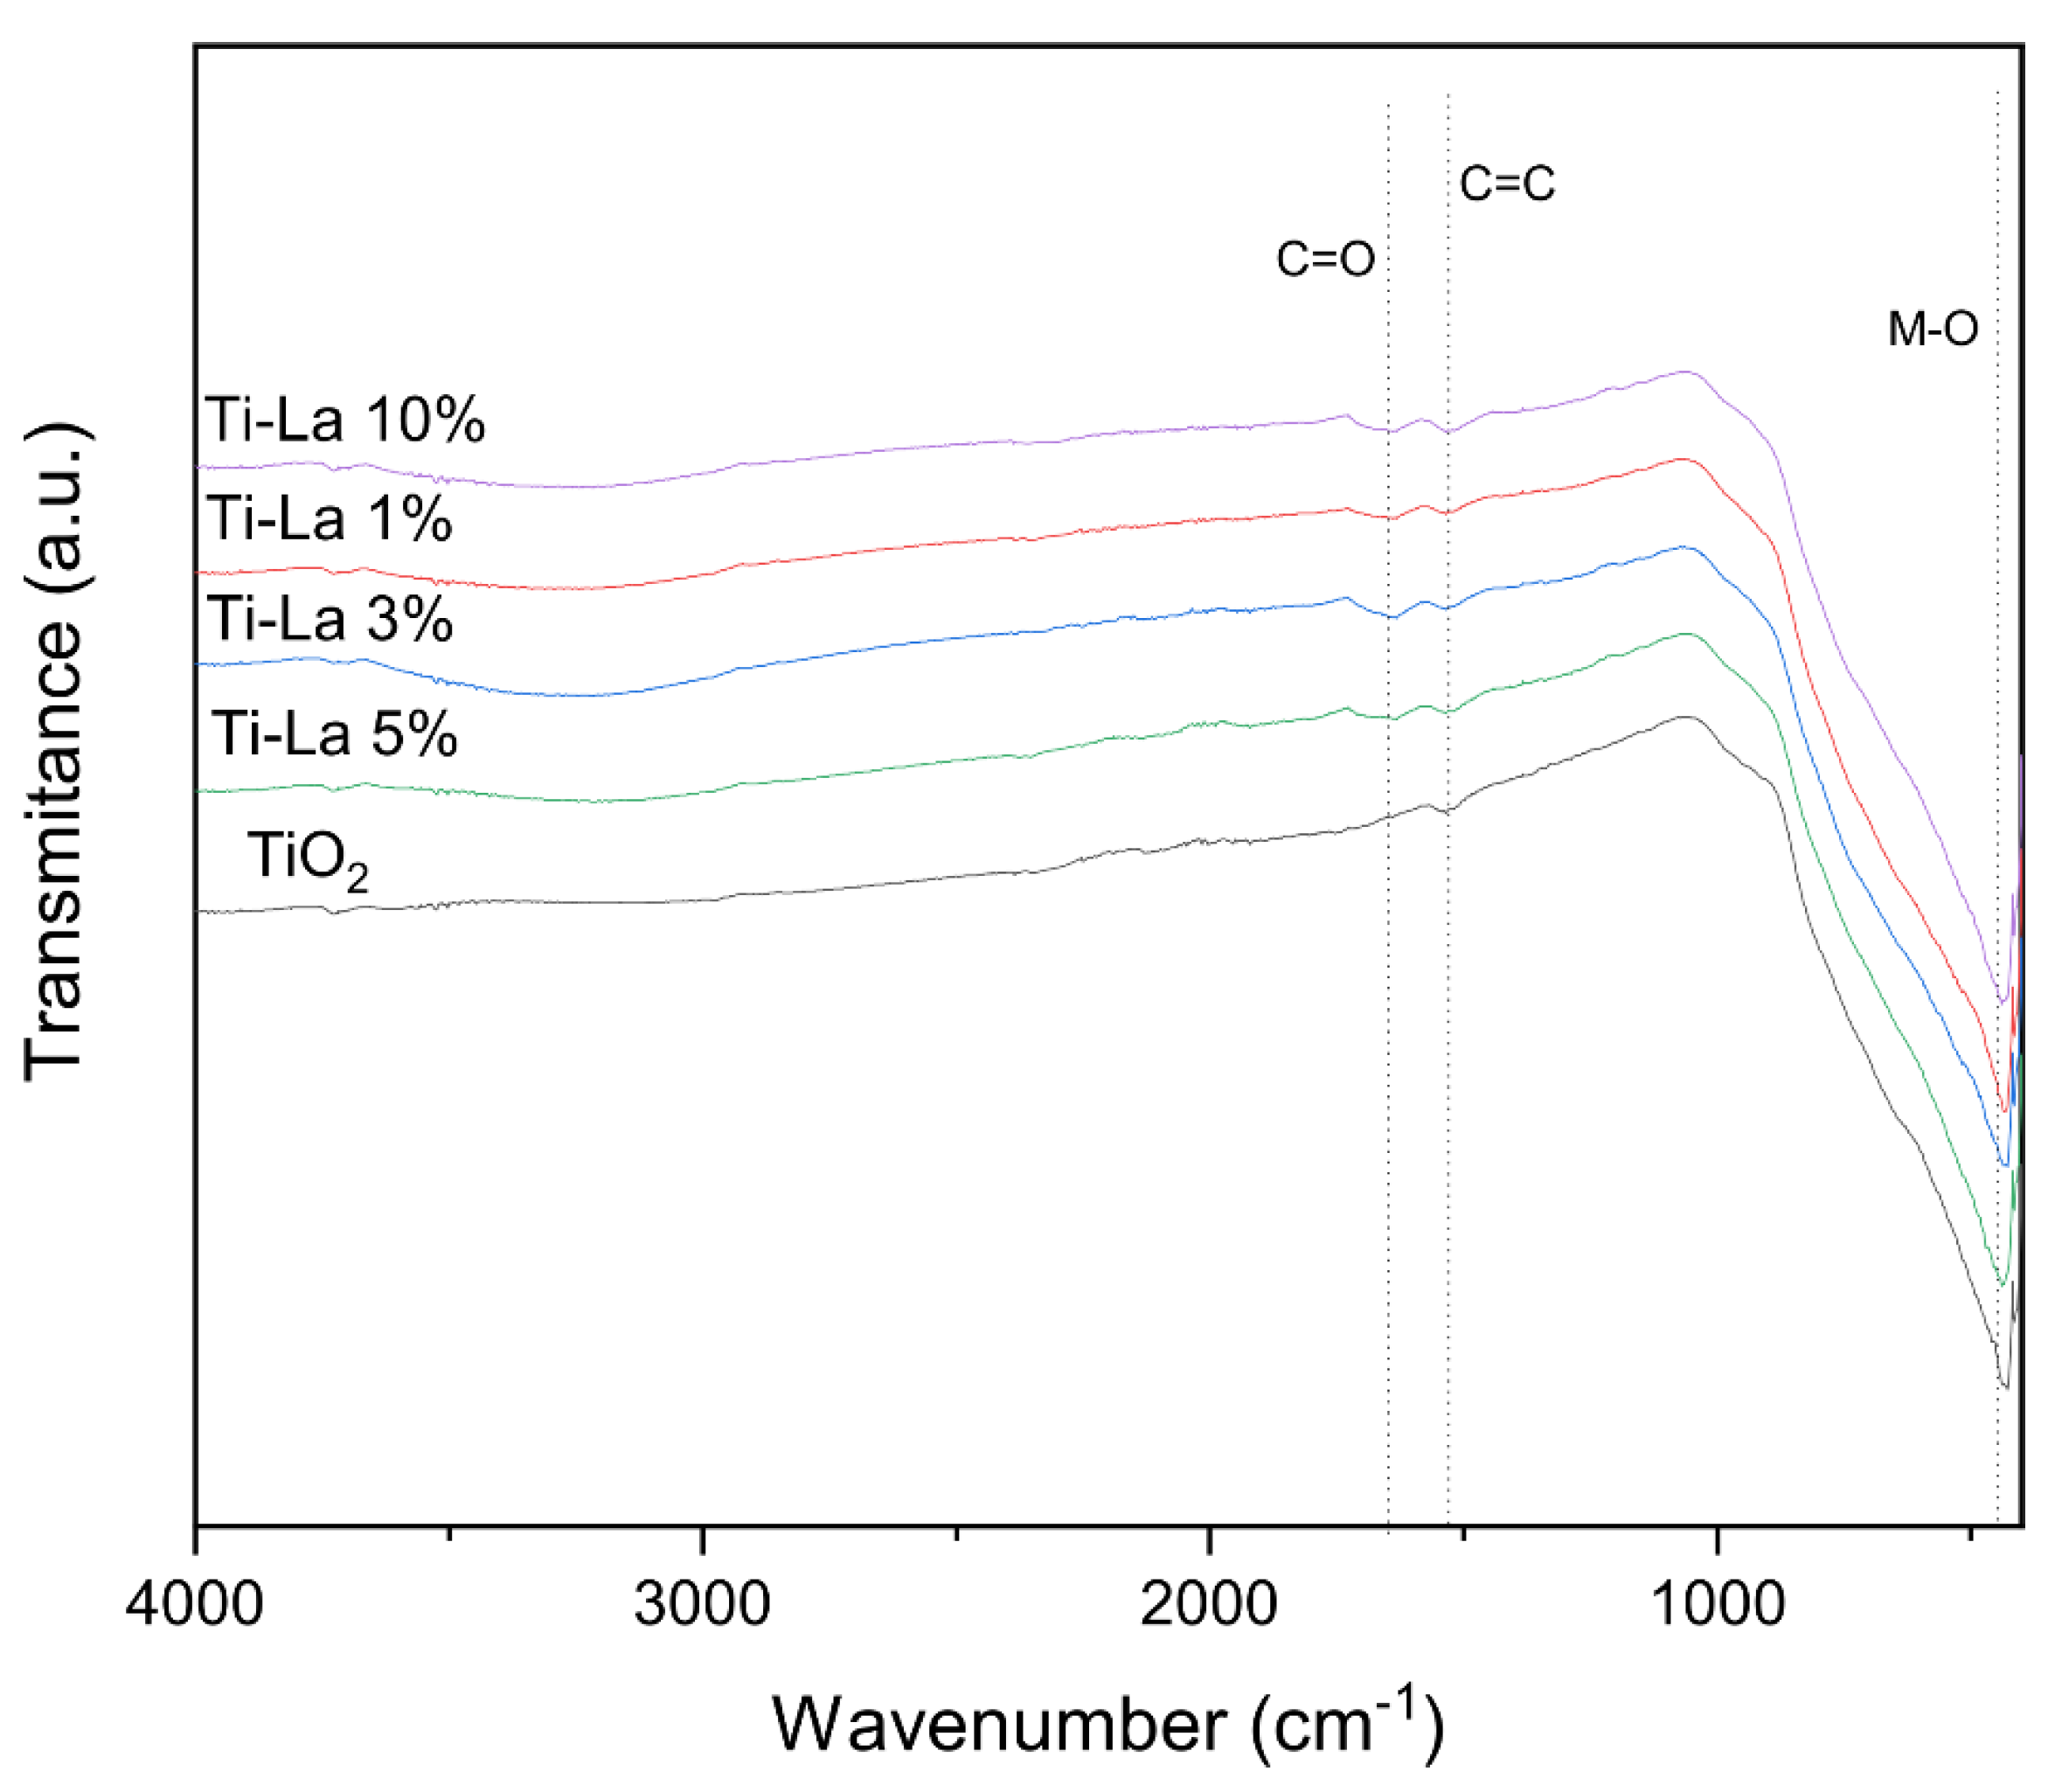
2.1.5. FT-IR Spectroscopy
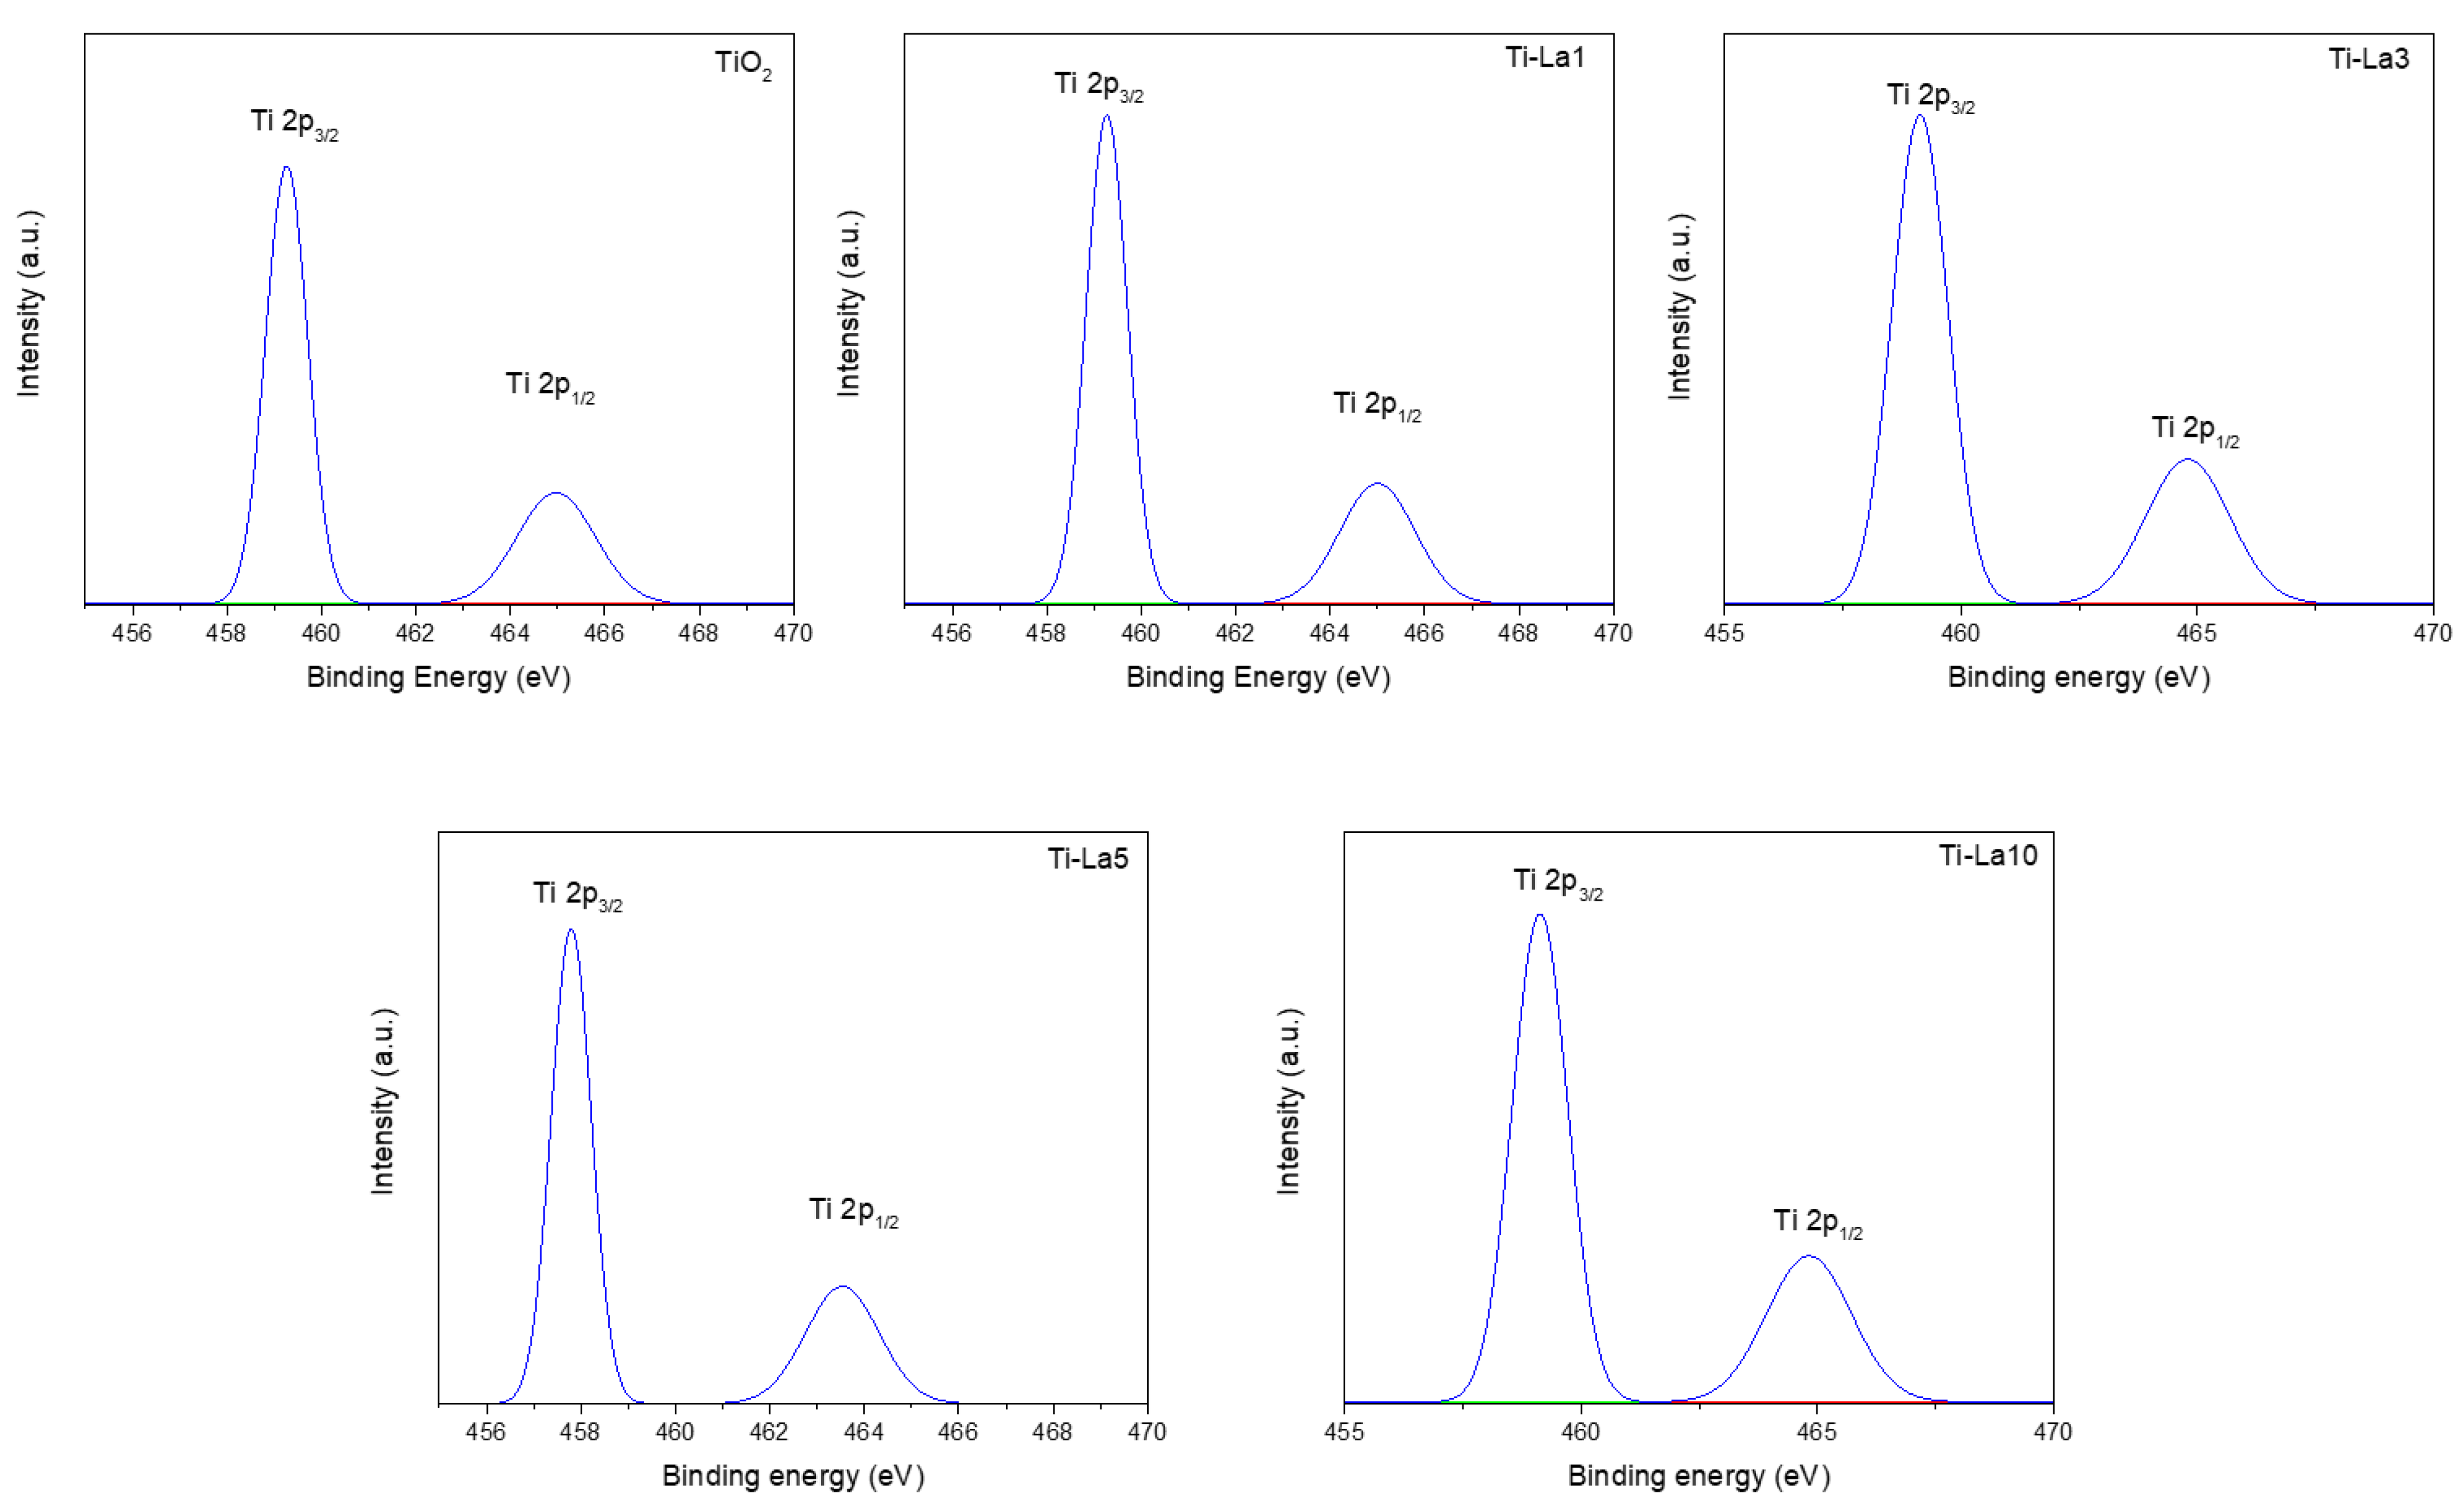
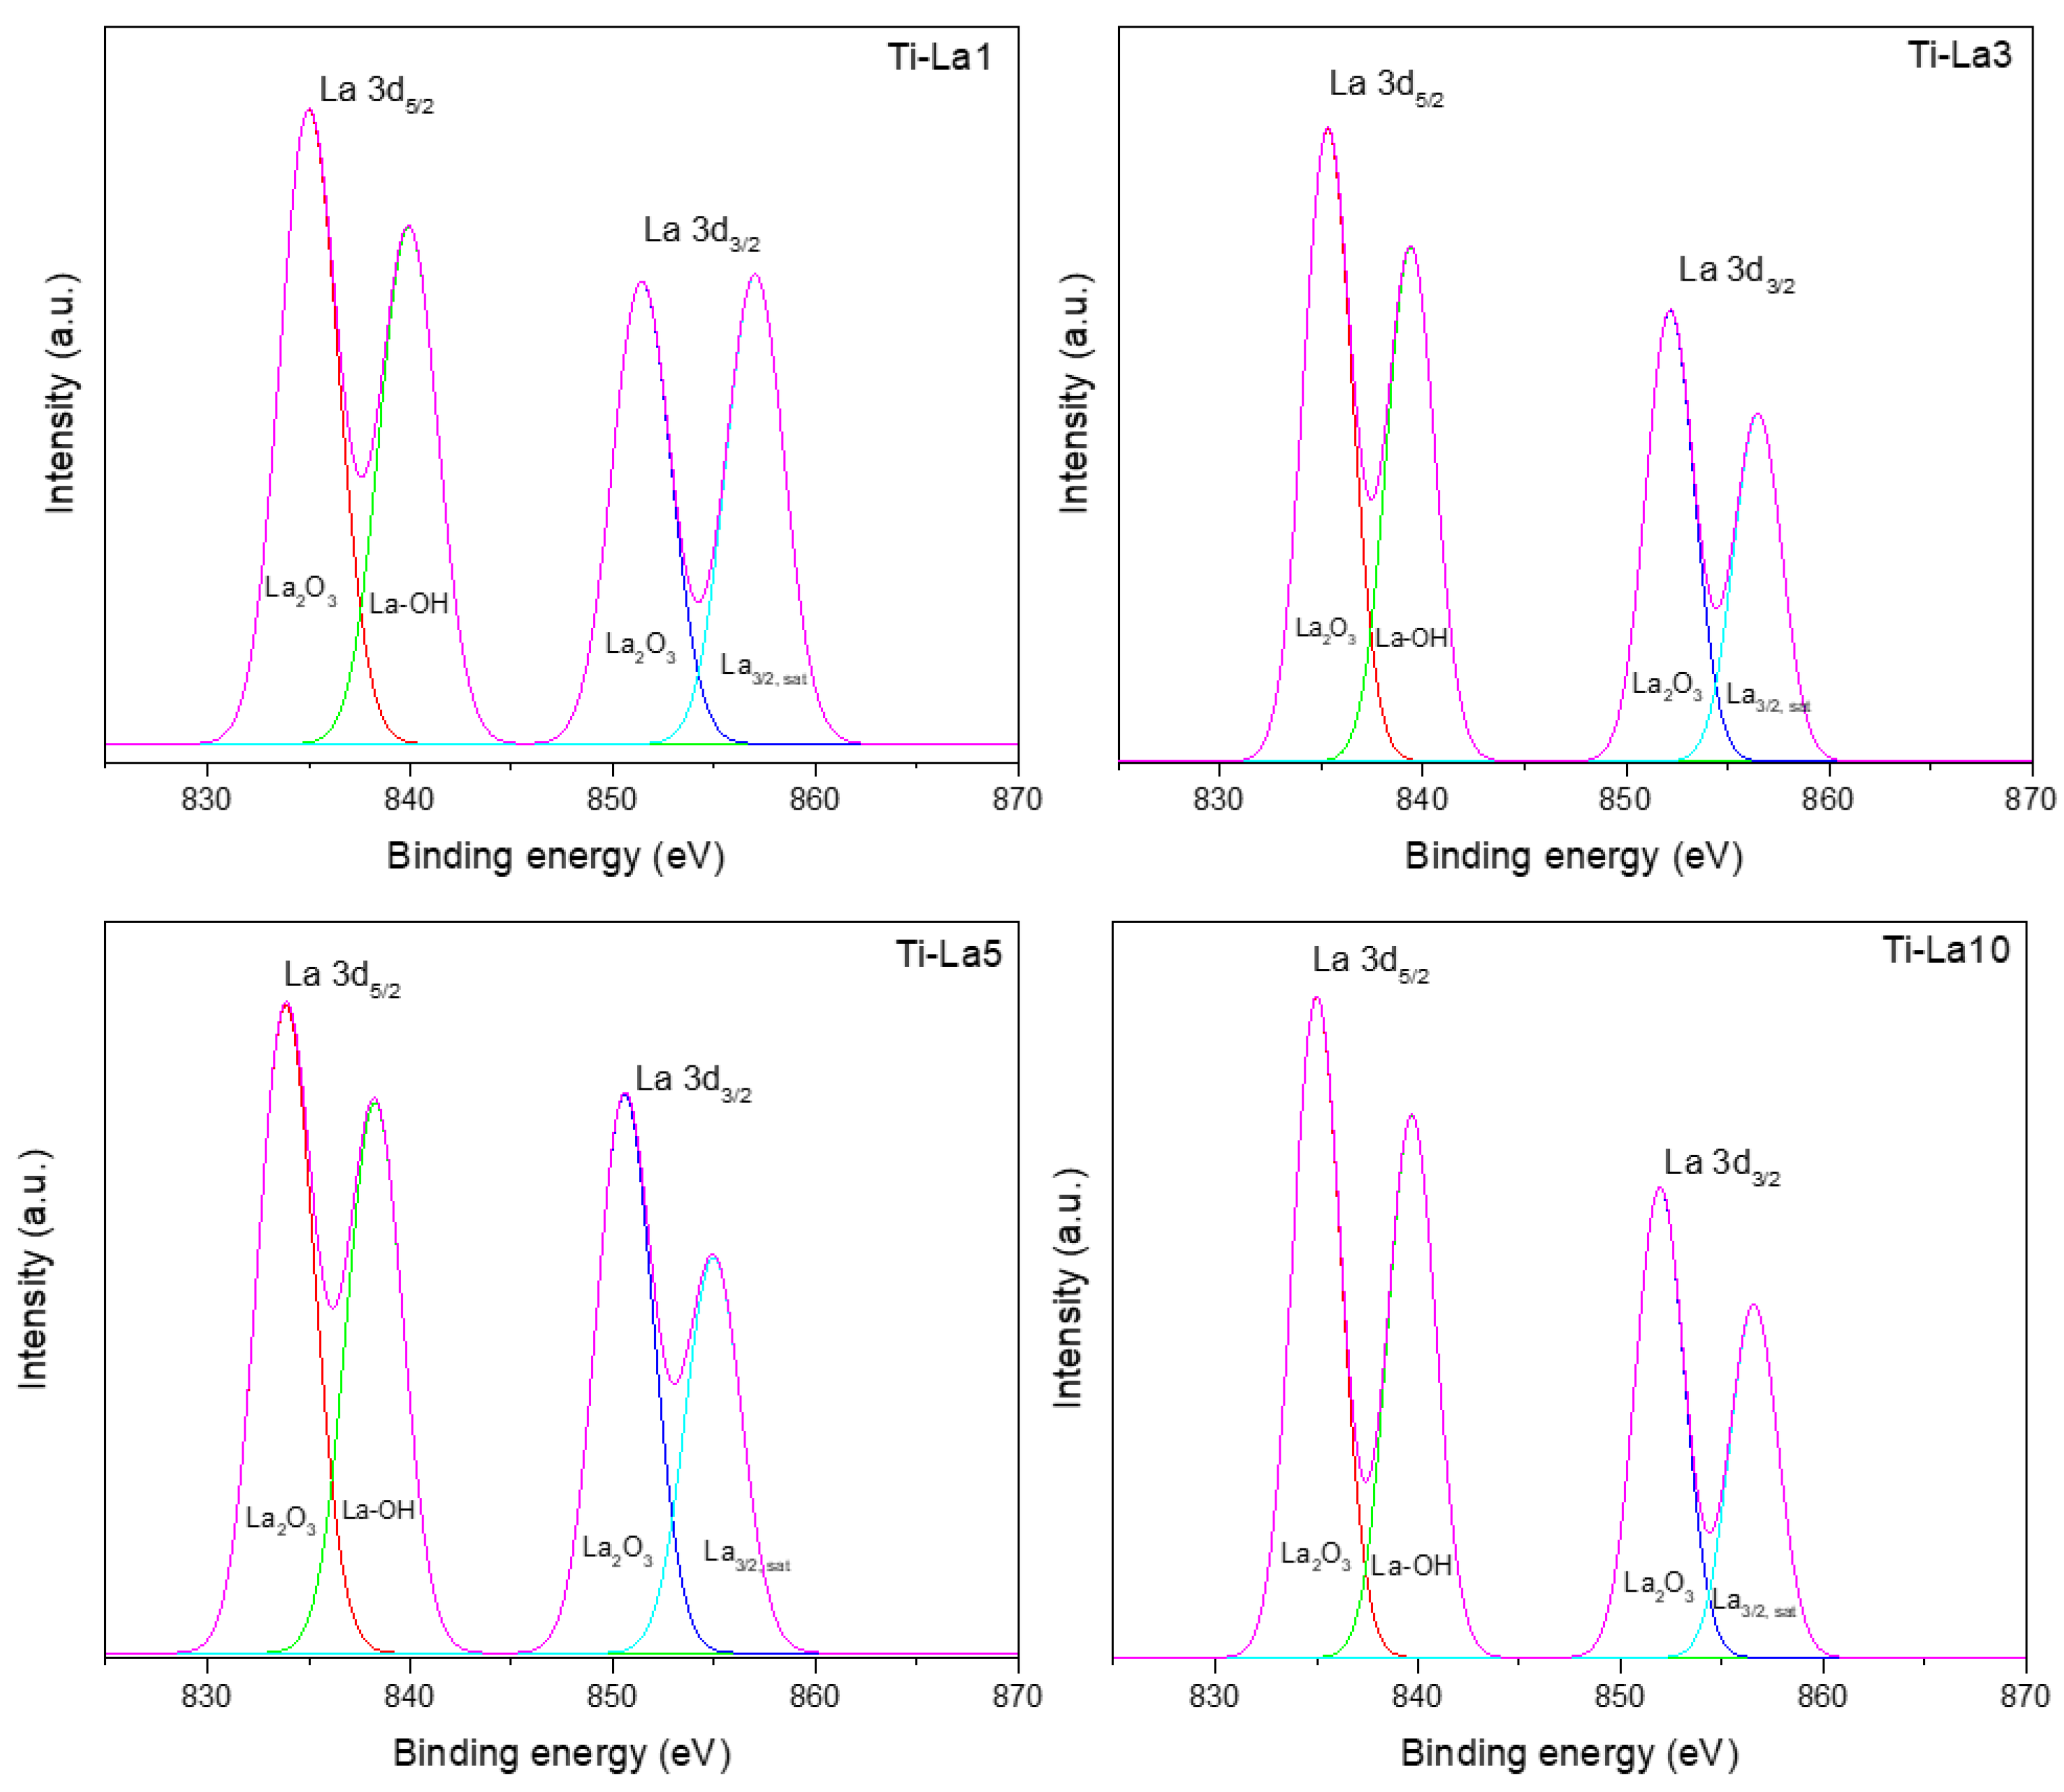
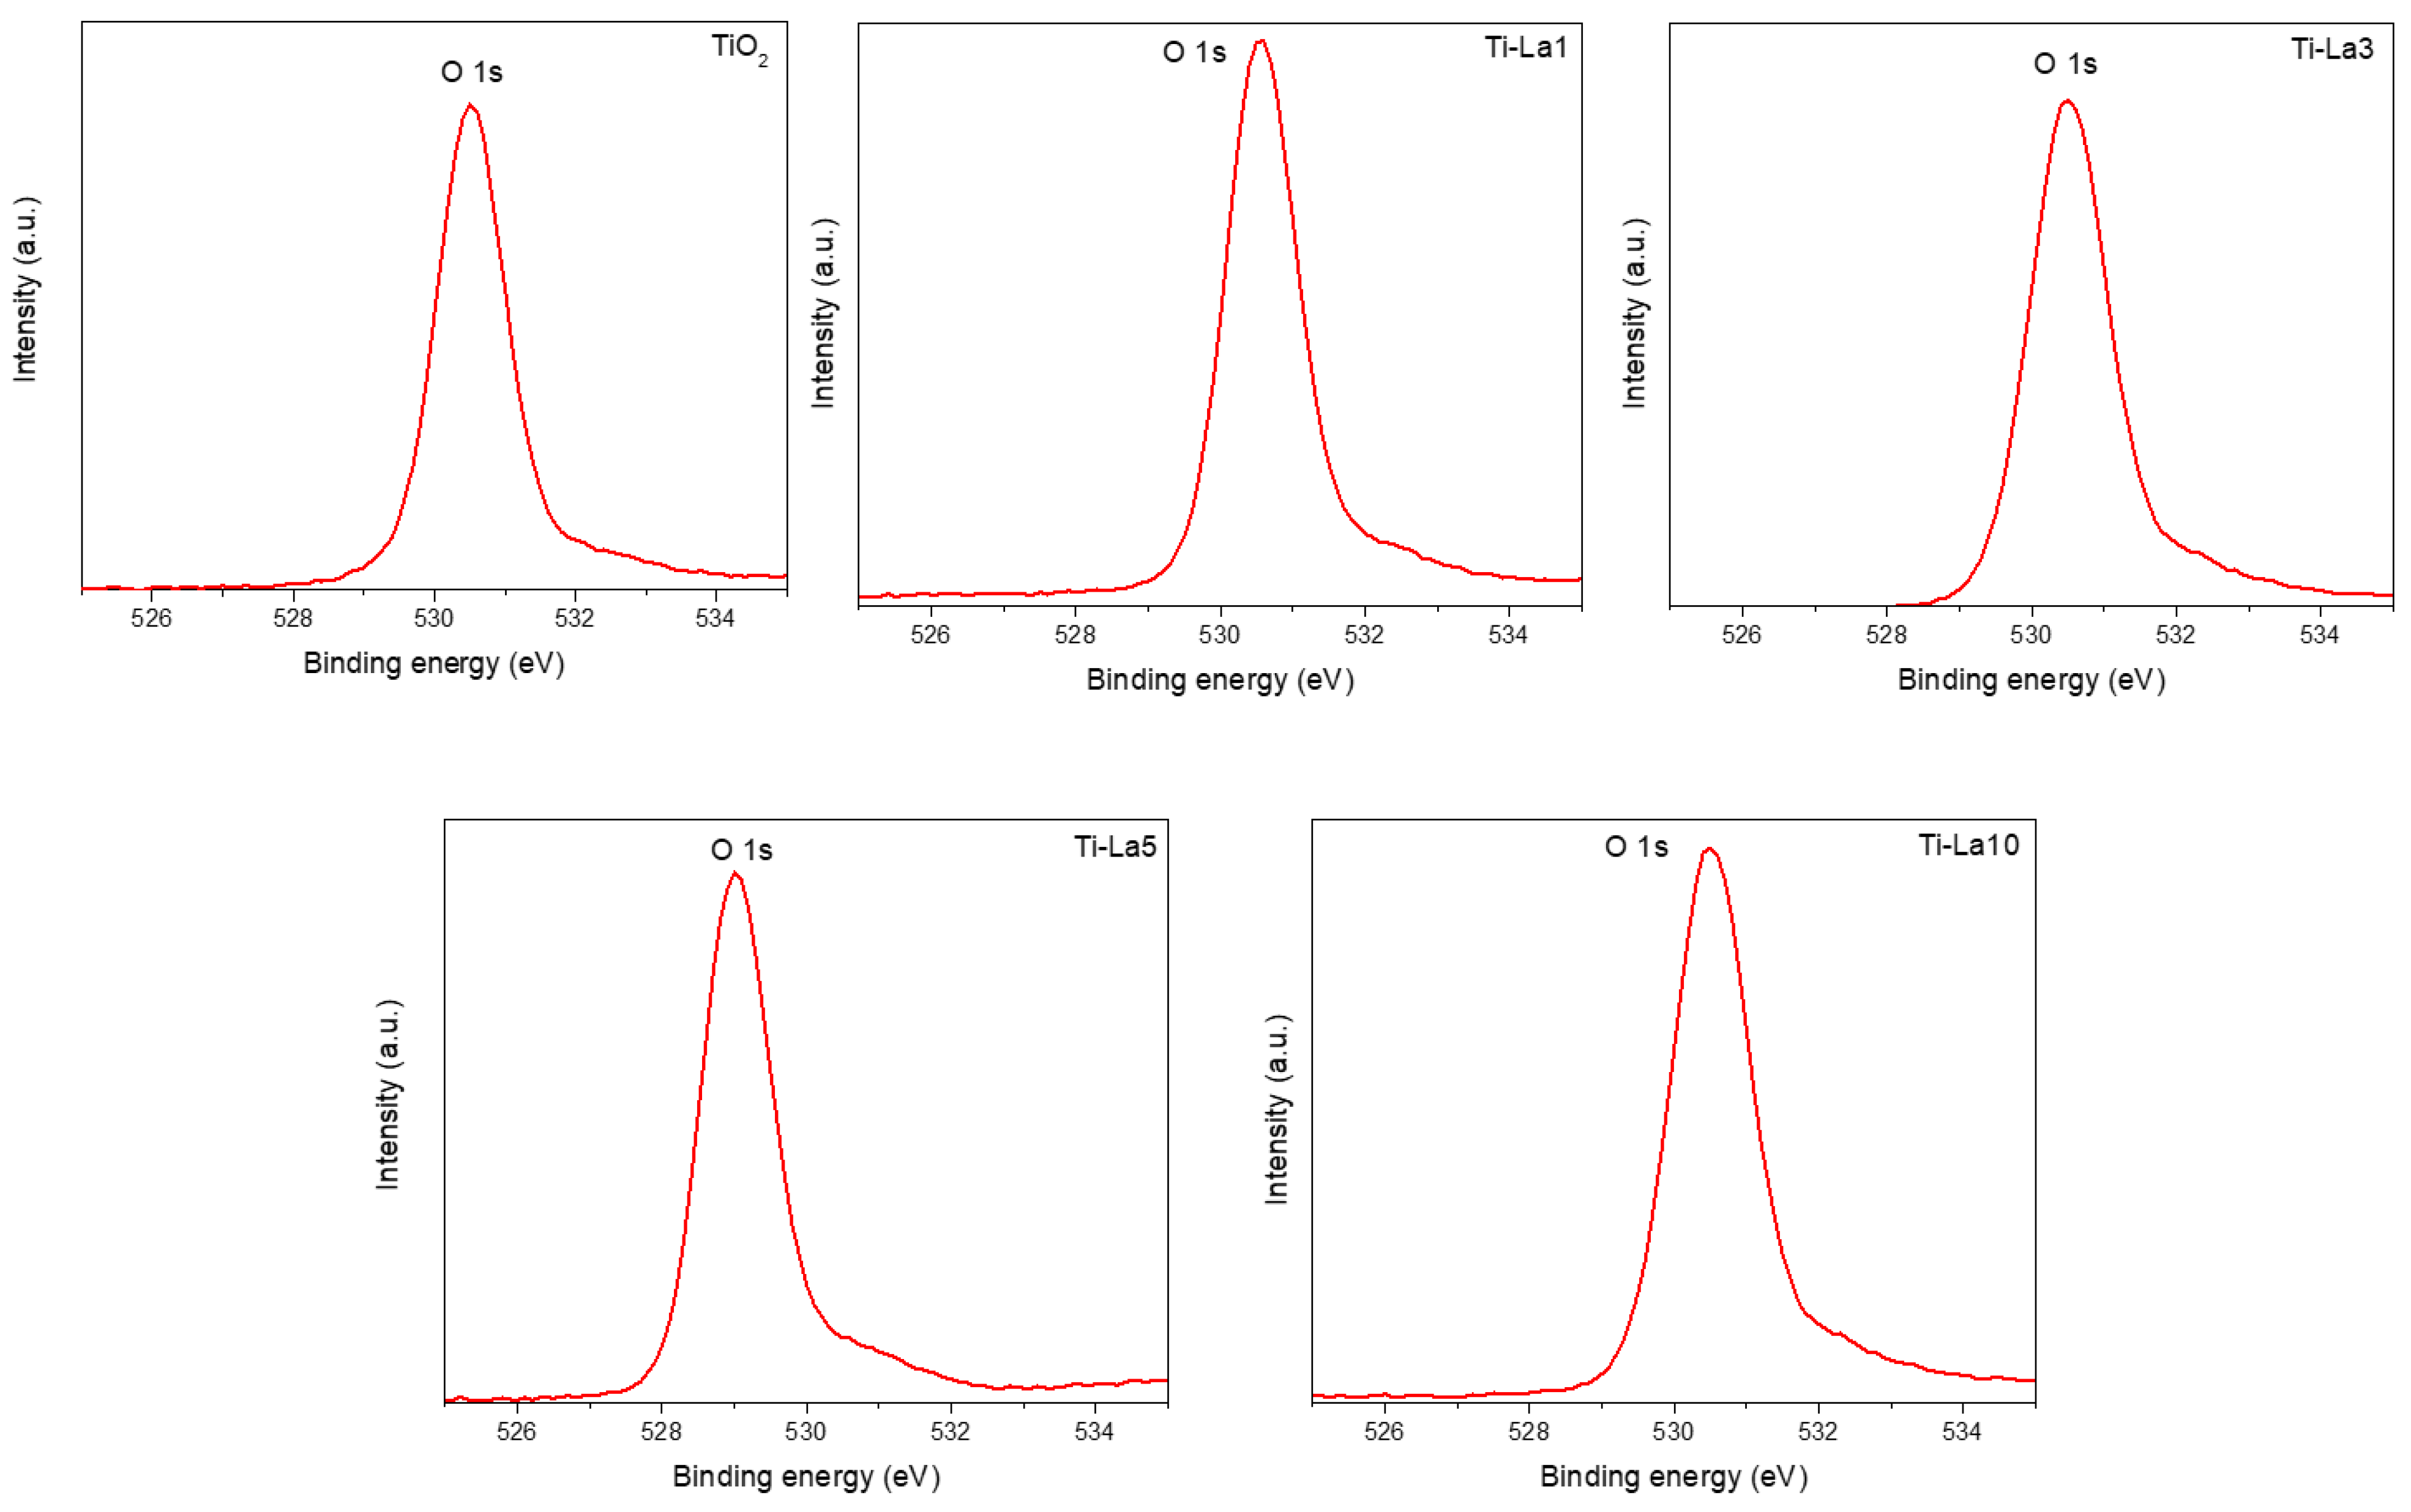
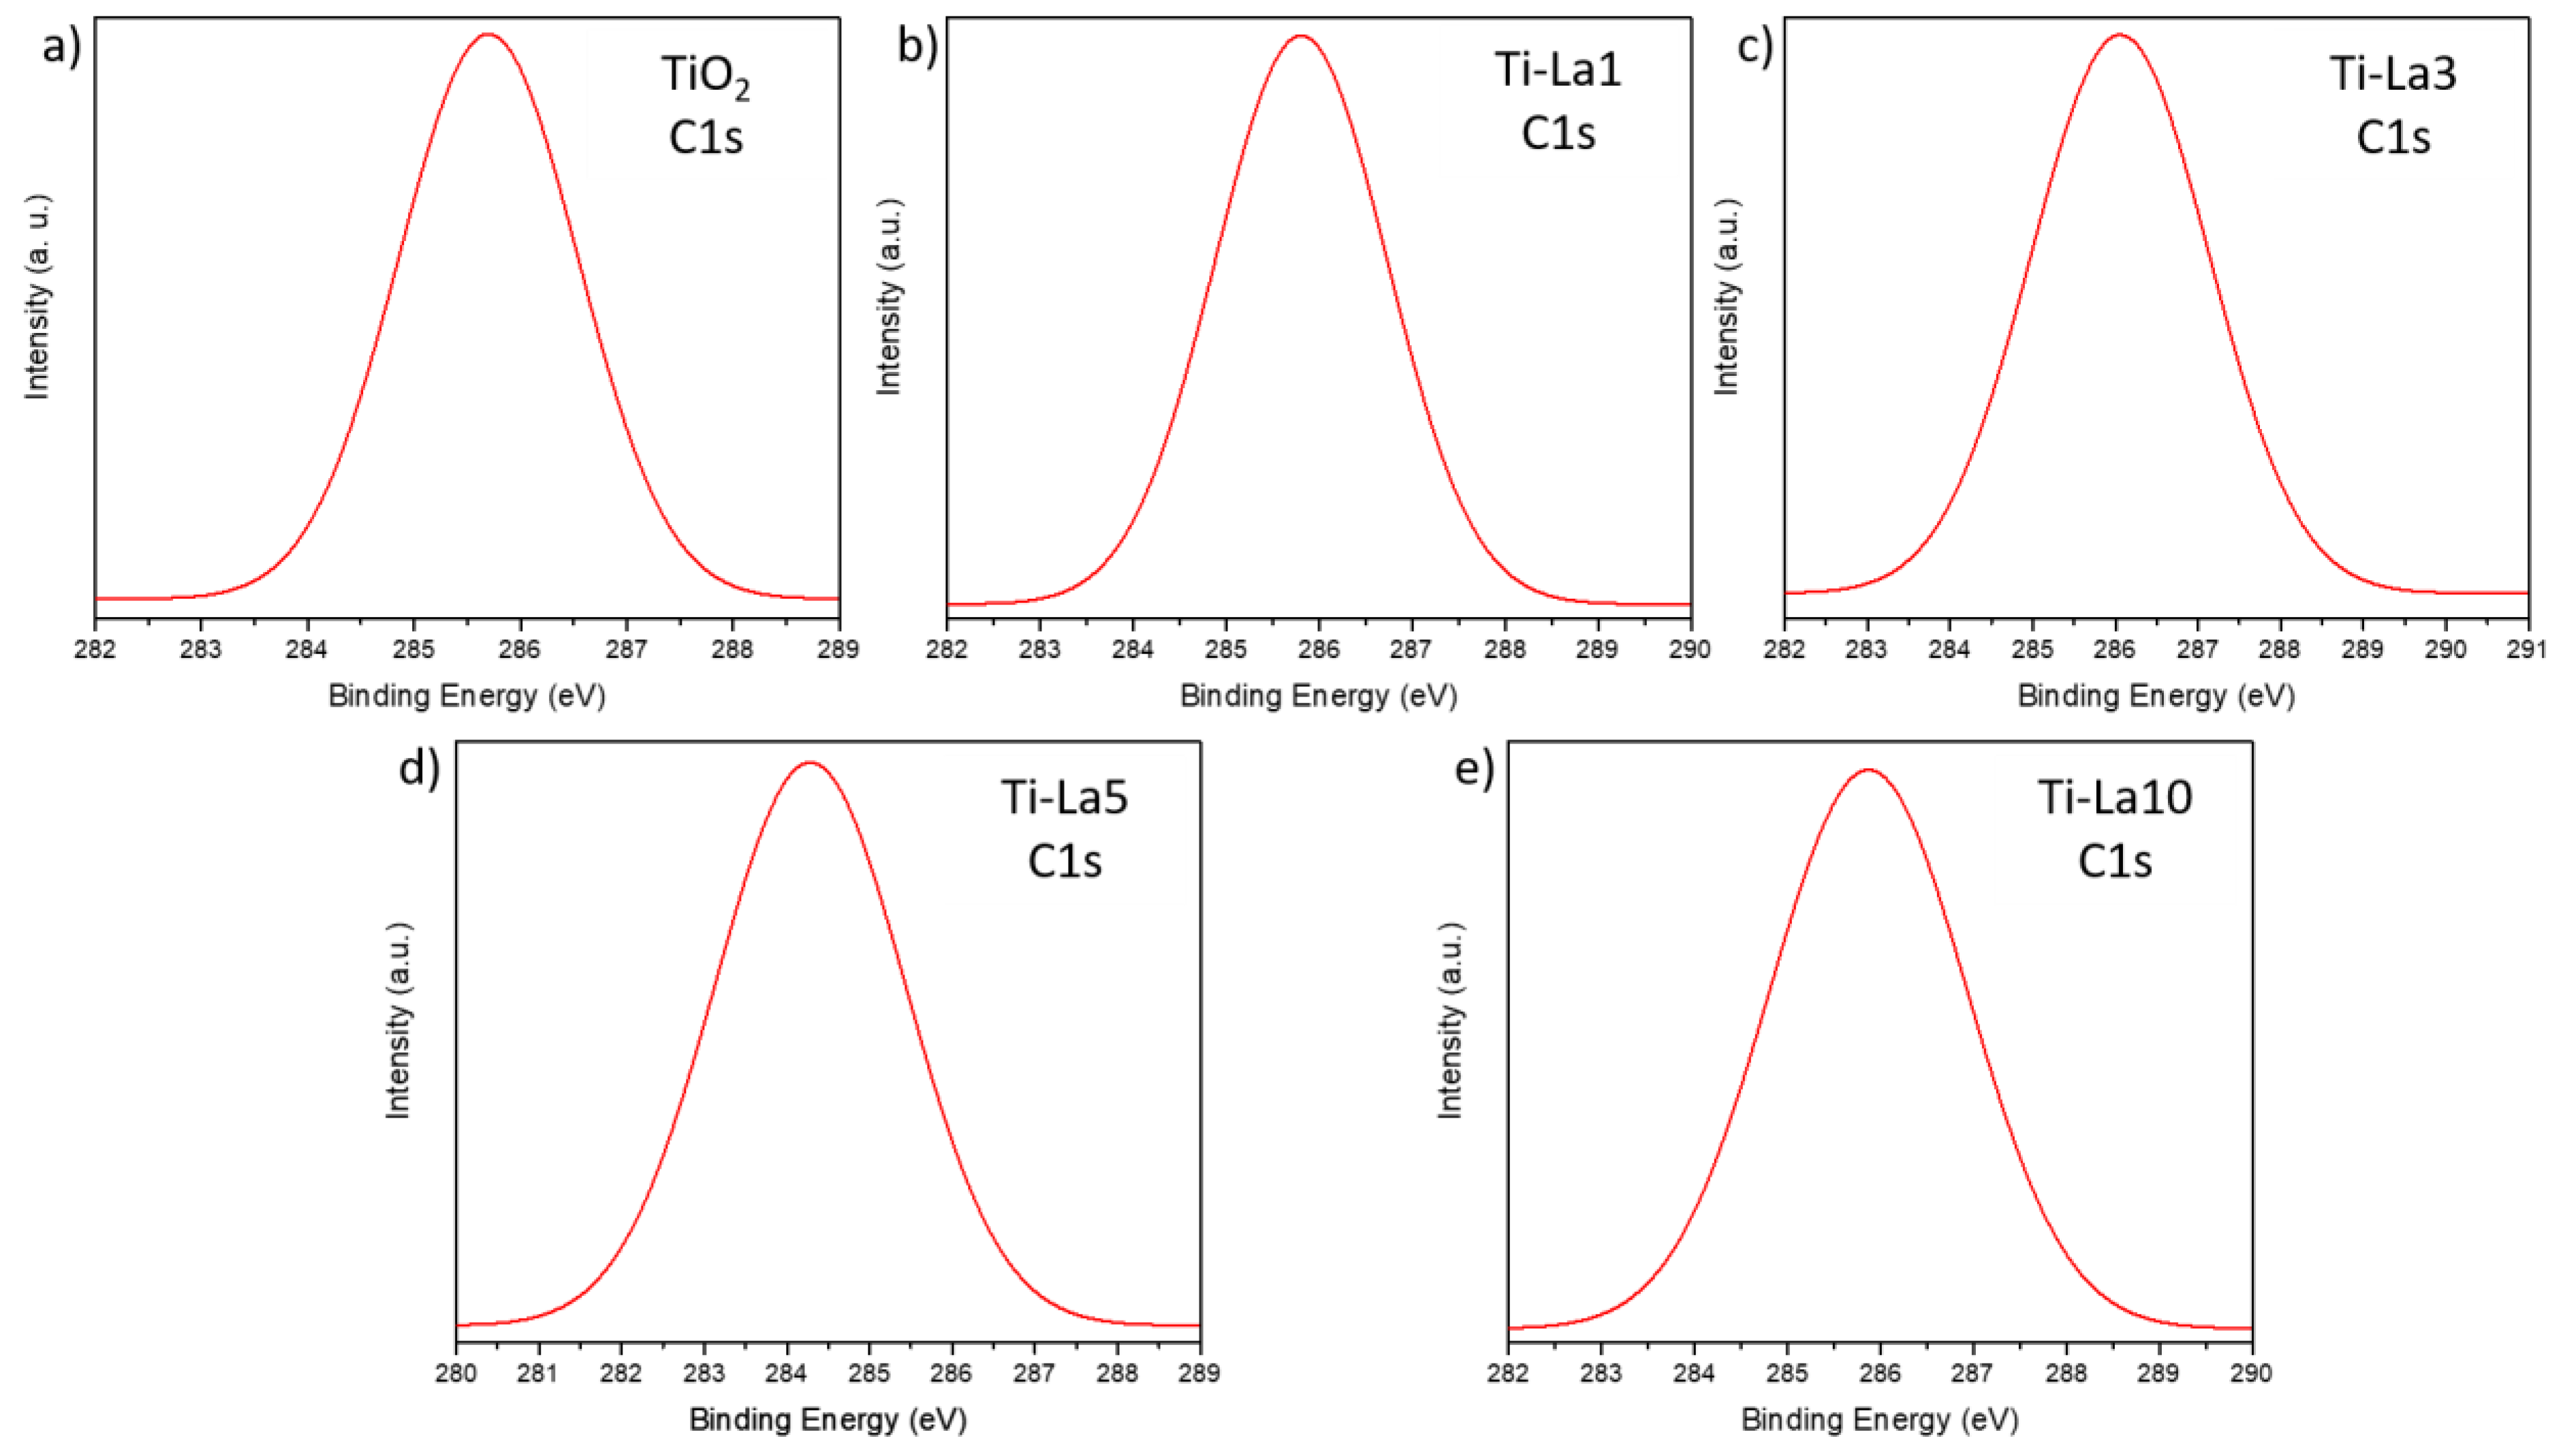
2.1.6. X-ray Photoelectron Spectrometry
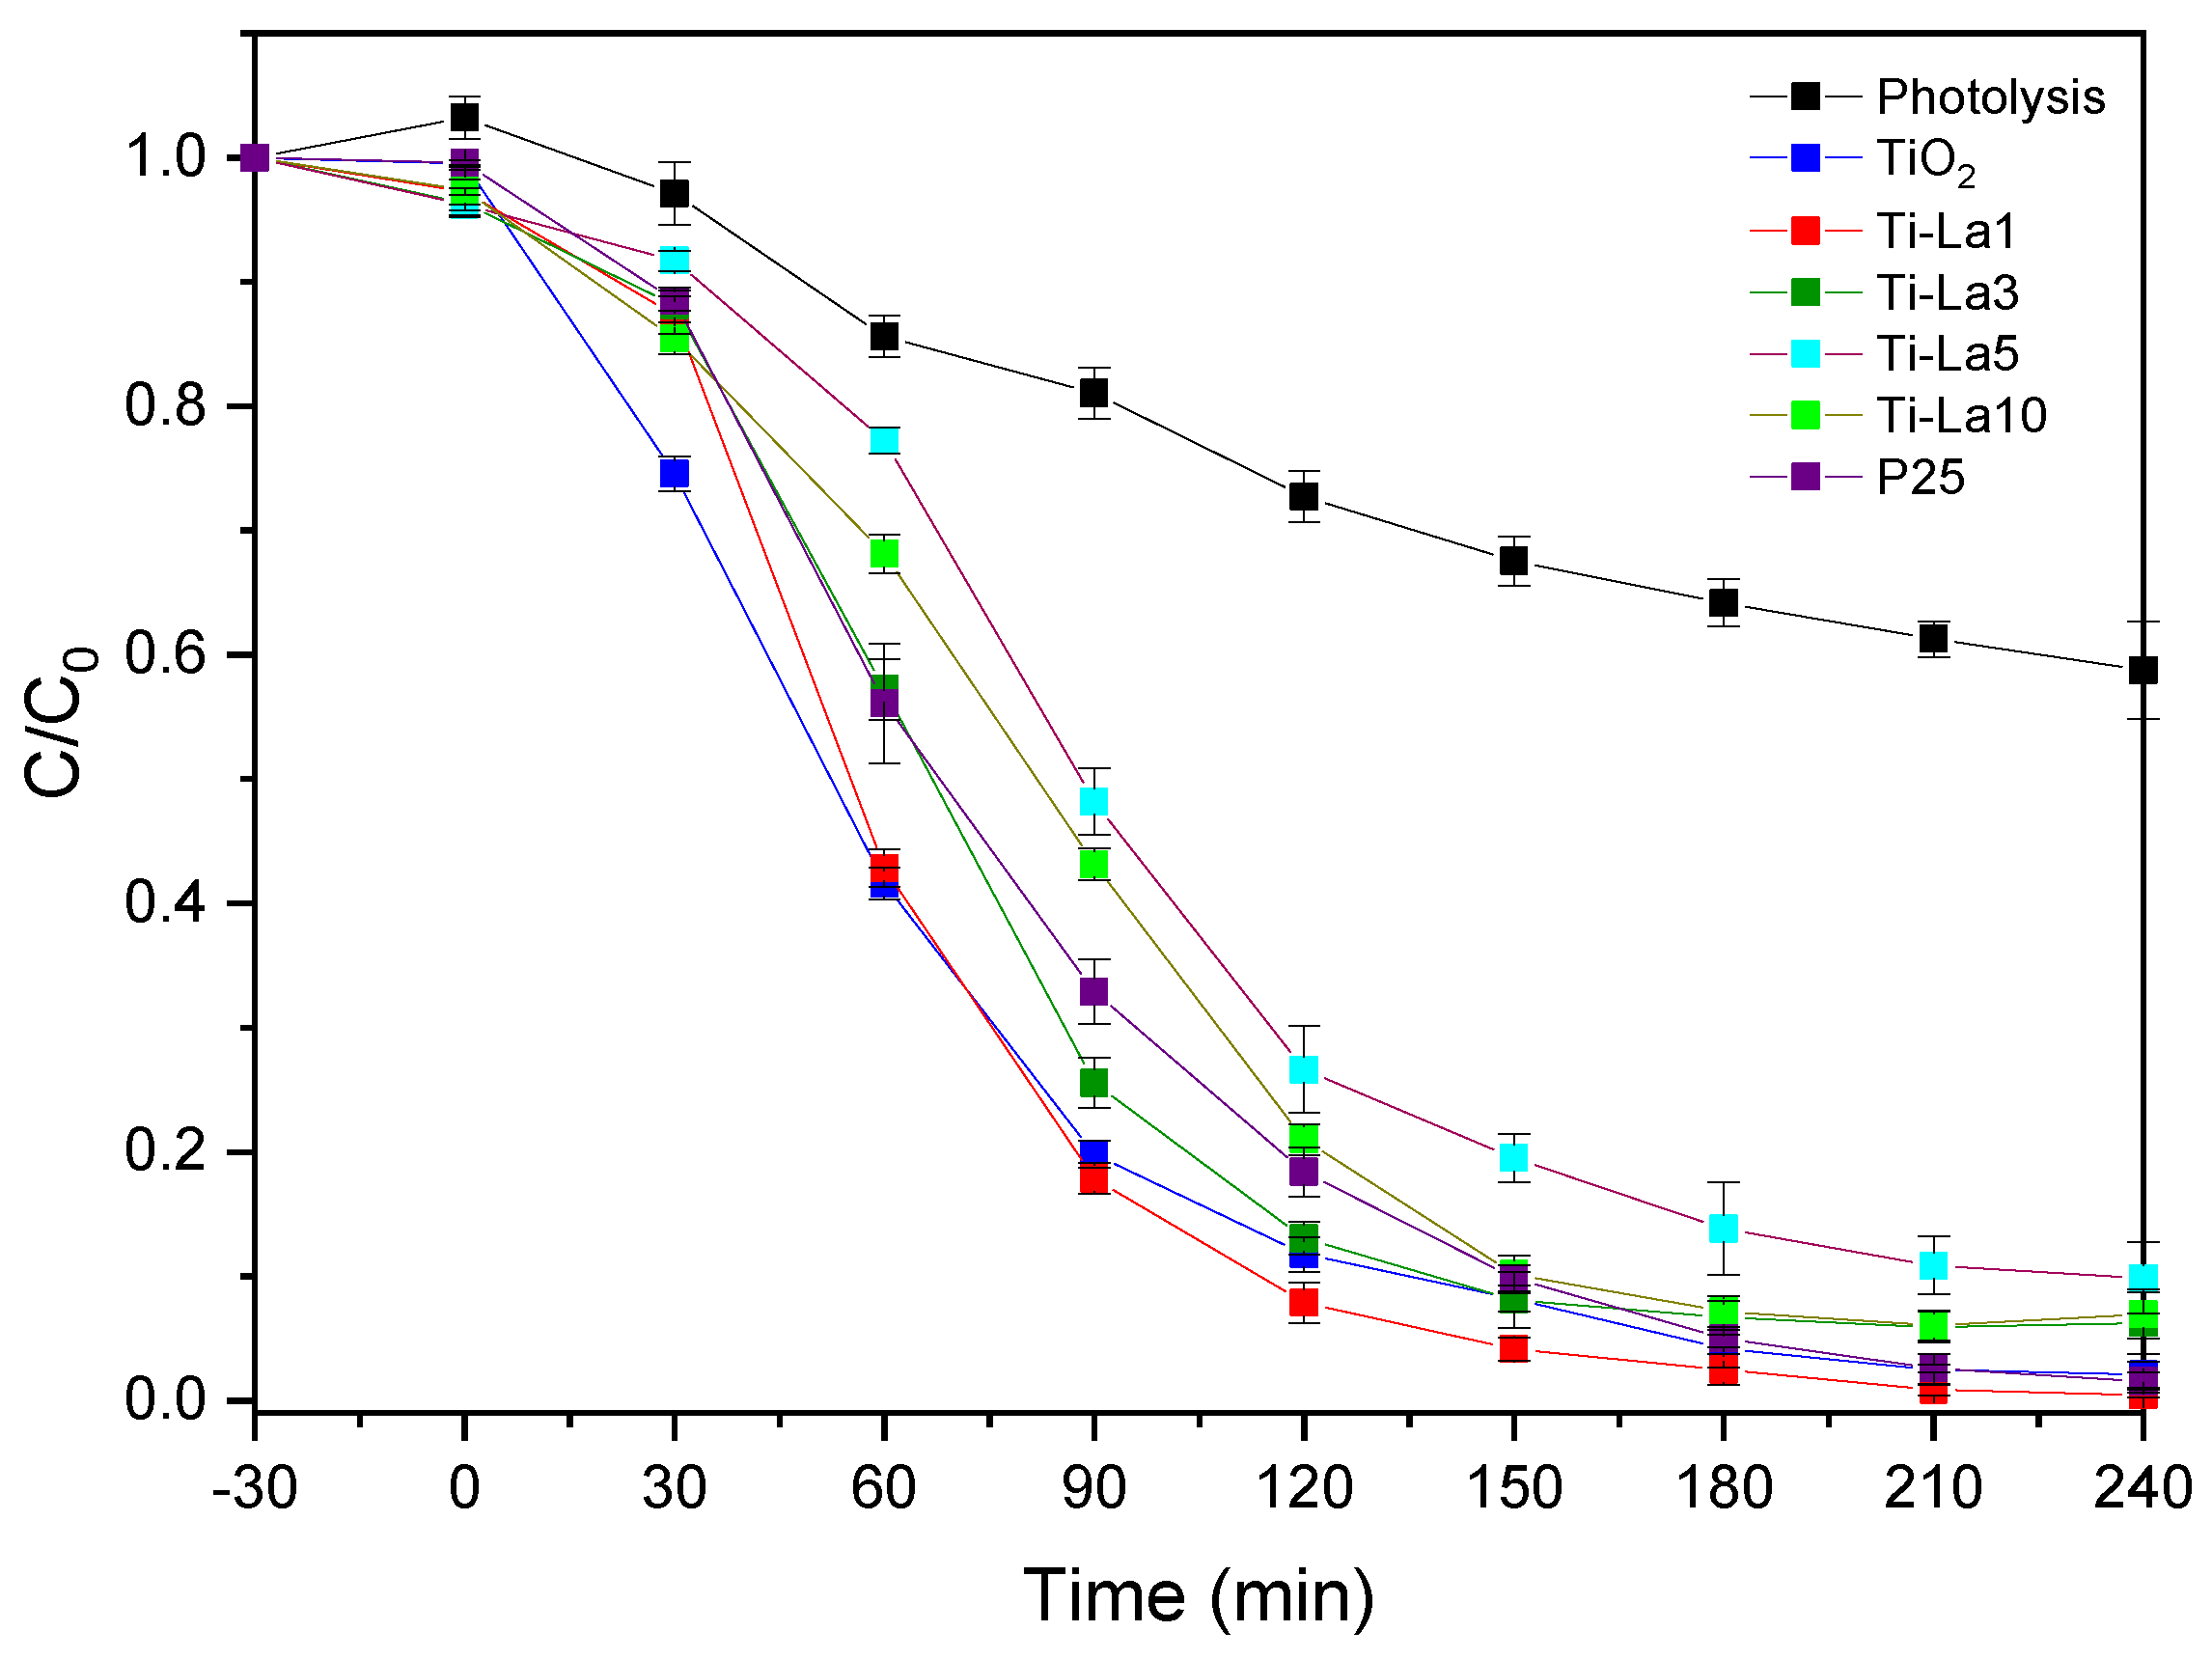
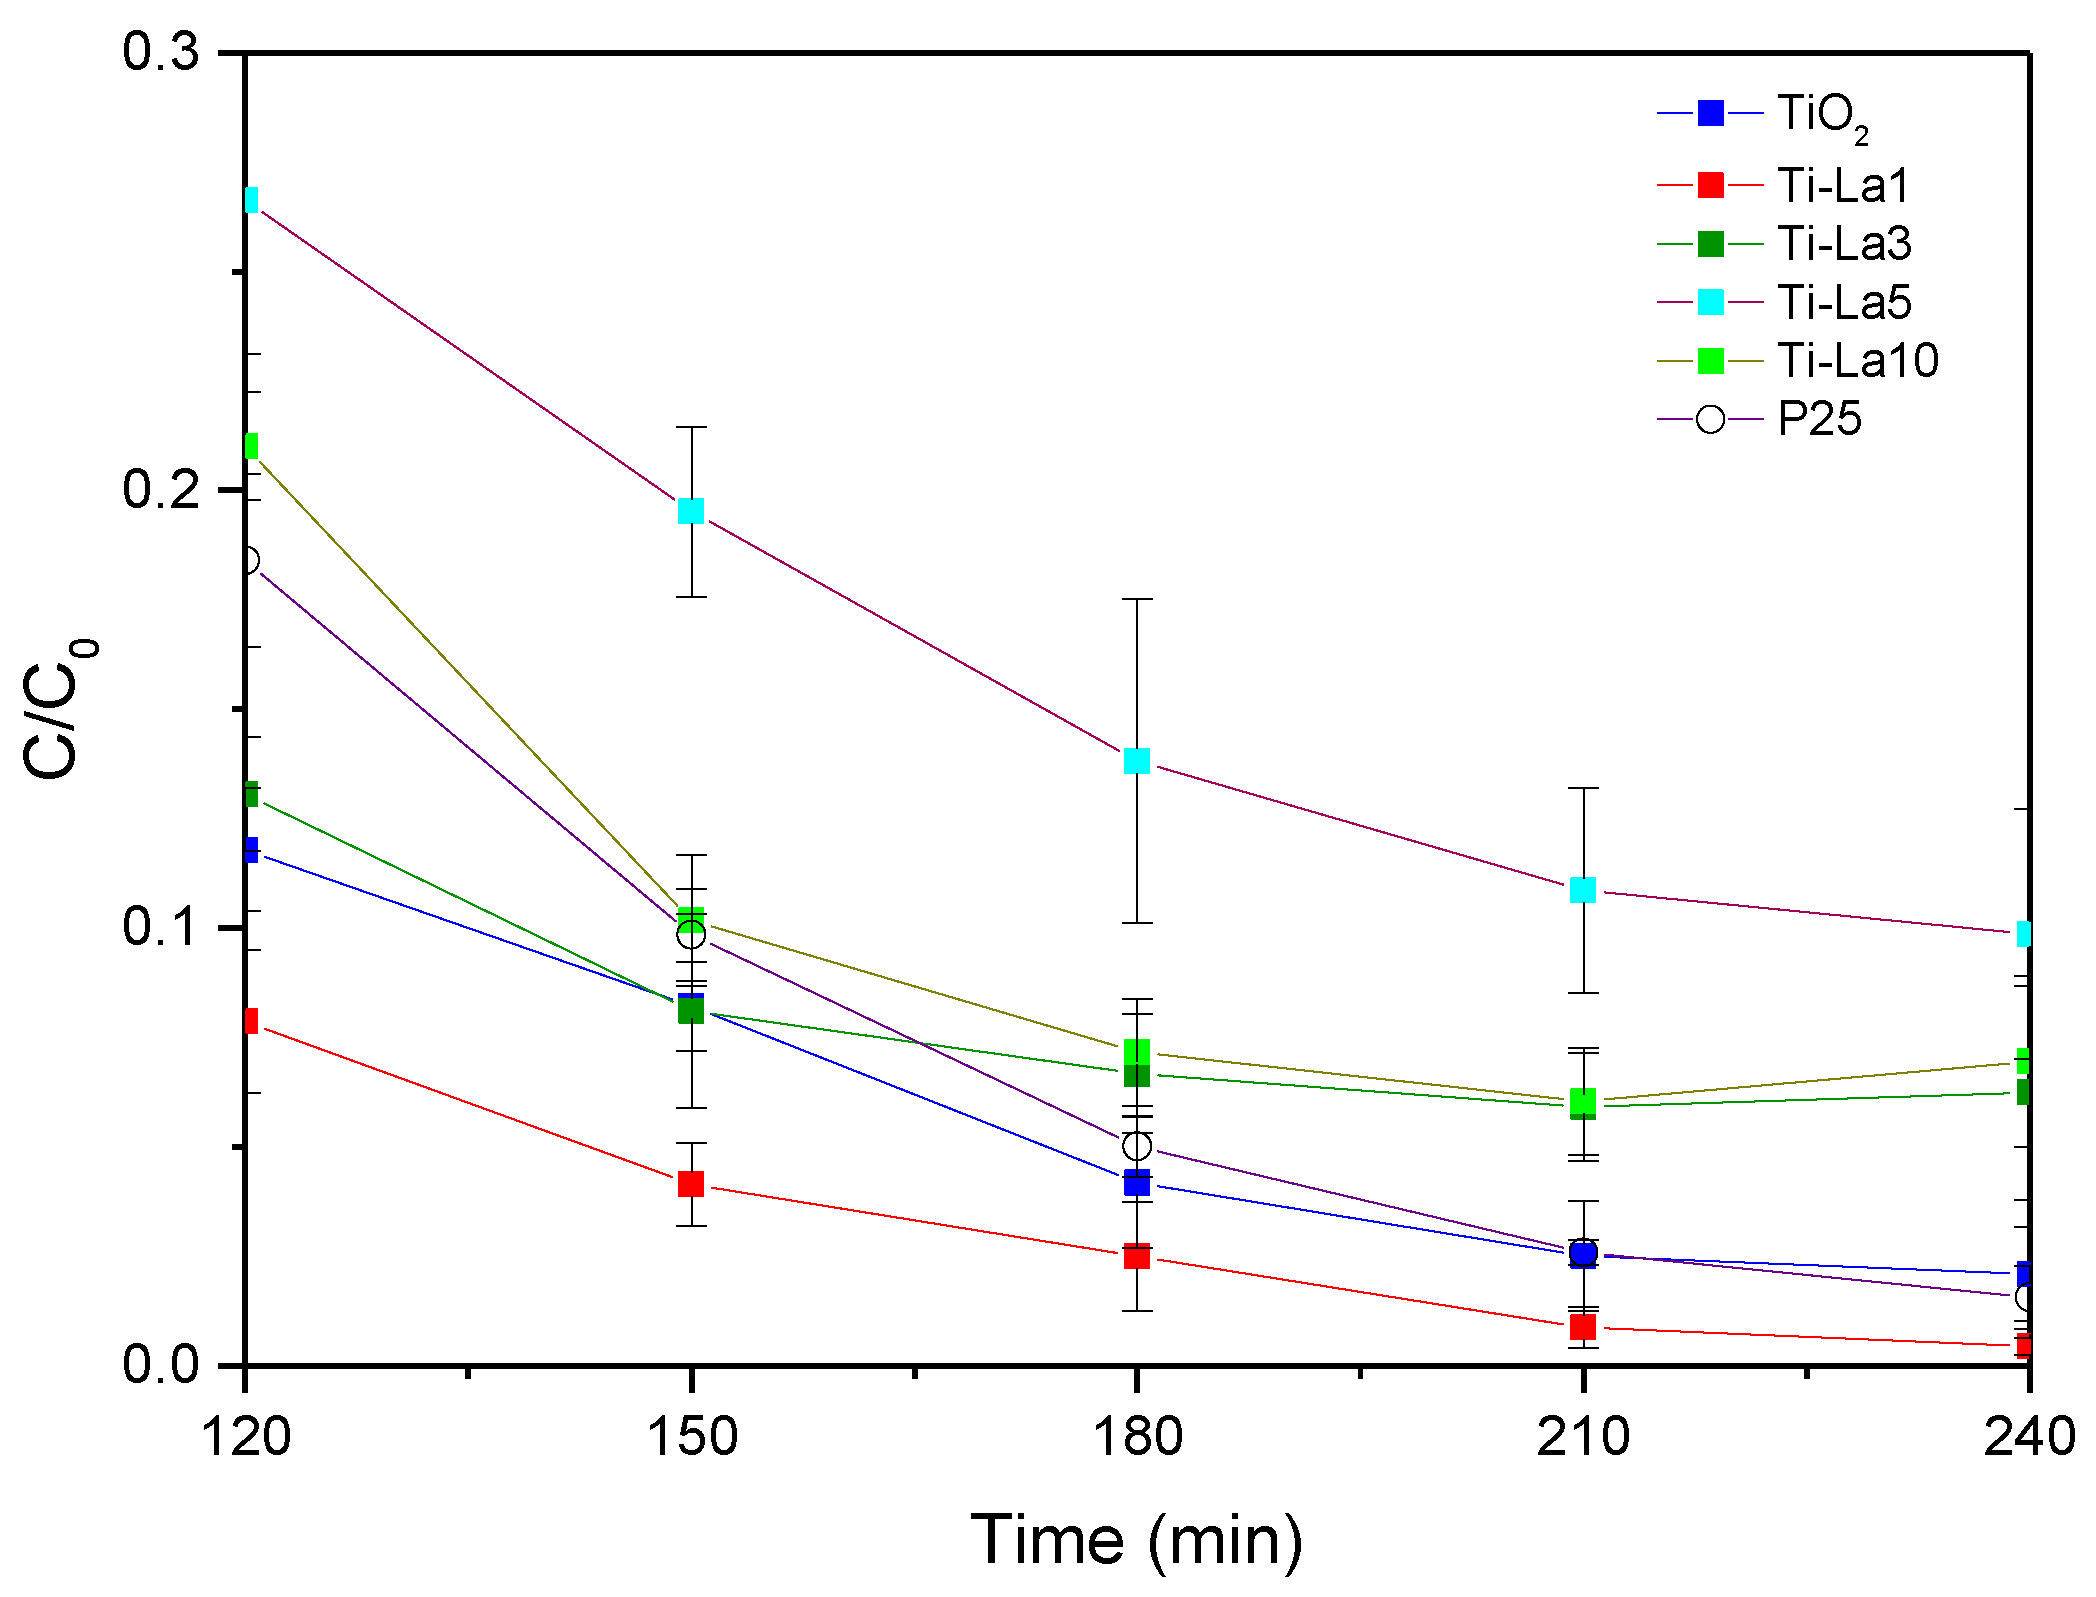
2.2. Phococatalytic Activity
3. Conclusions
4. Materials and Methods
4.1. Materials
4.2. Catalyst Preparation
4.3. Characterization Equipment
4.4. Photocatalytic Activity
Author Contributions
Funding
Institutional Review Board Statement
Informed Consent Statement
Data Availability Statement
Acknowledgments
Conflicts of Interest
Abbreviations
| TiO2 | Titanium dioxide |
| NPX | naproxene |
| XRD | X-ray diffraction |
| SEM | scanning electron microscopy |
| EDS | Energy Dispersive X-ray |
| UV-Vis | Visible and ultra-violet ligth |
| FT-IR | Fourier Transform Infrared Spectroscopy |
| TEM | transmission electron microscopy |
| XPS | X-ray photoelectron spectroscopy |
| AOP’s | Advanced Oxidation Processes |
| OH | hydroxyl radicals |
| BET | Brunauer-Emmett-Teller |
| BJH | Barrett-Joyner-Halenda |
| JCPDS | Joint Committee on Powder Diffraction Standards |
| M-O | Metal-Oxygen |
| eV | electron Volt |
| TOC | Total Organic Carbon |
| TC | Total Carbon |
| IC | Inorganic Carbon |
| HPLC | High Performance Liquid Chromatography |
References
- Uheida, A.; Mohamed, A.; Belaqziz, M.; Nasser, W.S. Photocatalytic degradation of Ibuprofen, Naproxen, and Cetirizine using PAN-MWCNT nanofibers crosslinked TiO2-NH2 nanoparticles under visible light irradiation. Sep. Purif. Technol. 2019, 212, 110–118. [Google Scholar] [CrossRef]
- Strbac, D.; Aggelopoulos, C.; Štrbac, G.; Dimitropoulos, M.; Novaković, M.; Ivetić, T.; Yannopoulos, S.N. Photocatalytic degradation of Naproxen and methylene blue: Comparison between ZnO, TiO2 and their mixture. Process Saf. Environ. Prot. 2018, 113, 174–183. [Google Scholar] [CrossRef]
- Kaur, M.; Mehta, S.K.; Kansal, S.K. Construction of Multifunctional NH2-UiO-66 Metal Organic Framework: Sensing and Photocatalytic Degradation of Ketorolac Tromethamine and Tetracycline in Aqueous Medium. Environ. Sci. Pollut. Res. 2022, 1, 1–21. [Google Scholar] [CrossRef] [PubMed]
- Pylypchuk, I.V.; Daniel, G.; Kessler, V.G.; Seisenbaeva, G.A. Removal of Diclofenac, Paracetamol, and Carbamazepine from Model Aqueous Solutions by Magnetic Sol–Gel Encapsulated Horseradish Peroxidase and Lignin Peroxidase Composites. Nanomaterials 2020, 10, 282. [Google Scholar] [CrossRef] [PubMed] [Green Version]
- Wojcieszyńska, D.; Guzik, U. Naproxen in the environment: Its occurrence, toxicity to nontarget organisms and biodegradation. Appl. Microbiol. Biotechnol. 2020, 104, 1849–1857. [Google Scholar] [CrossRef] [Green Version]
- Martínez-Huitle, C.A.; Panizza, M. Electrochemical oxidation of organic pollutants for wastewater treatment. Curr. Opin. Electrochem. 2018, 11, 62–71. [Google Scholar] [CrossRef]
- Bello, M.M.; Raman, A.A.A.; Asghar, A. A review on approaches for addressing the limitations of Fenton oxidation for recalcitrant wastewater treatment. Process Saf. Environ. Prot. 2019, 126, 119–140. [Google Scholar] [CrossRef]
- Glaze, W.H. Reaction products of ozone: A review. Environ. Health Perspect. 1986, 69, 151–157. [Google Scholar] [CrossRef]
- Ahmadpour, N.; Sayadi, M.H.; Sobhani, S.; Hajiani, M. A potential natural solar light active photocatalyst using magnetic ZnFe2O4 @ TiO2/Cu nanocomposite as a high performance and recyclable platform for degradation of naproxen from aqueous solution. J. Clean. Prod. 2020, 268, 122023. [Google Scholar] [CrossRef]
- Mohamed, A.; Salama, A.; Nasser, W.S.; Uheida, A. Photodegradation of Ibuprofen, Cetirizine, and Naproxen by PAN-MWCNT/TiO2–NH2 nanofiber membrane under UV light irradiation. Environ. Sci. Eur. 2018, 30, 47. [Google Scholar] [CrossRef]
- Castro-Pastrana, L.; Cerro-López, M.; Toledo-Wall, M.; Gómez-Oliván, L.; Saldívar-Santiago, M.; Castro-Pastrana, L.; Cerro-López, M.; Toledo-Wall, M.; Gómez-Oliván, L.; Saldívar-Santiago, M. Análisis de fármacos en aguas residuales de tres hospitales de la ciudad de Puebla, México. Ing. Del. Agua 2021, 25, 59. [Google Scholar] [CrossRef]
- Reyes, M.H.; Solis, R.C.; Ruiz, F.; Rodriguez-Gonzalez, V.; Moctezuma, E. Promotional effect of metal doping on nanostructured TiO2 during the photocatalytic degradation of 4-chlorophenol and naproxen sodium as pollutants. Mater. Sci. Semicond. Process. 2019, 100, 130–139. [Google Scholar] [CrossRef]
- Amini, Z.; Givianrad, M.H.; Saber-Tehrani, M.; Azar, P.A.; Husain, S.W. Synthesis of N-doped TiO2/SiO2/Fe3O4 magnetic nanocomposites as a novel purple LED illumination-driven photocatalyst for photocatalytic and photoelectrocatalytic degradation of naproxen: Optimization and different scavenger agents study. J. Environ. Sci. Health Part A 2019, 54, 1254–1267. [Google Scholar] [CrossRef] [PubMed]
- Marizcal-Barba, A.; Sanchez-Burgos, J.A.; Zamora-Gasga, V.; Larios, A.P. Study of the Response Surface in the Photocatalytic Degradation of Acetaminophen Using TiO2. Photochem 2022, 2, 225–236. [Google Scholar] [CrossRef]
- Eidsvåg, H.; Bentouba, S.; Vajeeston, P.; Yohi, S.; Velauthapillai, D. TiO2 as a Photocatalyst for Water Splitting—An Experimental and Theoretical Review. Molecules 2021, 26, 1687. [Google Scholar] [CrossRef] [PubMed]
- Abel, S.; Jule, L.T.; Belay, F.; Shanmugam, R.; Dwarampudi, L.P.; Nagaprasad, N.; Krishnaraj, R. Application of Titanium Dioxide Nanoparticles Synthesized by Sol-Gel Methods in Wastewater Treatment. J. Nanomater. 2021, 2021, 1–6. [Google Scholar] [CrossRef]
- Primo, J.D.O.; Bittencourt, C.; Acosta, S.; Sierra-Castillo, A.; Colomer, J.-F.; Jaerger, S.; Teixeira, V.C.; Anaissi, F.J. Synthesis of Zinc Oxide Nanoparticles by Ecofriendly Routes: Adsorbent for Copper Removal from Wastewater. Front. Chem. 2020, 8, 571790. [Google Scholar] [CrossRef]
- Limón-Rocha, I.; Guzmán-González, C.A.; Anaya-Esparza, L.M.; Romero-Toledo, R.; Rico, J.L.; González-Vargas, O.A.; Pérez-Larios, A. Effect of the Precursor on the Synthesis of ZnO and Its Photocatalytic Activity. Inorganics 2022, 10, 16. [Google Scholar] [CrossRef]
- Troncoso, F.D.; Tonetto, G.M. Nb2O5 monolith as an efficient and reusable catalyst for textile wastewater treatment. Sustain. Environ. Res. 2021, 31, 35. [Google Scholar] [CrossRef]
- Al-Enizi, A.M.; El-Halwany, M.M.; Al-Abdrabalnabi, M.A.; Bakrey, M.; Ubaidullah, M.; Yousef, A. Novel Low Temperature Route to Produce CdS/ZnO Composite Nanofibers as Effective Photocatalysts. Catalysts 2020, 10, 417. [Google Scholar] [CrossRef] [Green Version]
- Sakwises, L.; Pisitsak, P.; Manuspiya, H.; Ummartyotin, S. Effect of Mn-substituted SnO2 particle toward photocatalytic degradation of methylene blue dye. Results Phys. 2017, 7, 1751–1759. [Google Scholar] [CrossRef]
- Qin, Y.; Fang, F.; Xie, Z.; Lin, H.; Zhang, K.; Yu, X.; Chang, K. La,Al-Codoped SrTiO3 as a Photocatalyst in Overall Water Splitting: Significant Surface Engineering Effects on Defect Engineering. ACS Catal. 2021, 11, 11429–11439. [Google Scholar] [CrossRef]
- Mousa, H.M.; Alenezi, J.F.; Mohamed, I.M.; Yasin, A.S.; Hashem, A.-F.M.; Abdal-Hay, A. Synthesis of TiO2@ZnO heterojunction for dye photodegradation and wastewater treatment. J. Alloy. Compd. 2021, 886, 161169. [Google Scholar] [CrossRef]
- Ameur, N.; Bachir, R.; Bedrane, S.; Choukchou-Braham, A. A Green Route to Produce Adipic Acid on TiO2-Fe2O3 Nanocomposites. J. Chin. Chem. Soc. 2017, 64, 1096–1103. [Google Scholar] [CrossRef]
- Ahmad, R.; Kim, J.K.; Kim, J.H.; Kim, J. Effect of polymer template on structure and membrane fouling of TiO2 /Al2O3 composite membranes for wastewater treatment. J. Ind. Eng. Chem. 2018, 57, 55–63. [Google Scholar] [CrossRef]
- Pérez-Larios, A.; Rico, J.L.; Anaya-Esparza, L.M.; Vargas, O.G.; González-Silva, N.; Gómez, R. Hydrogen Production from Aqueous Methanol Solutions Using Ti–Zr Mixed Oxides as Photocatalysts under UV Irradiation. Catalysts 2019, 9, 938. [Google Scholar] [CrossRef] [Green Version]
- Chaker, H.; Ameur, N.; Saidi-Bendahou, K.; Djennas, M.; Fourmentin, S. Modeling and Box-Behnken design optimization of photocatalytic parameters for efficient removal of dye by lanthanum-doped mesoporous TiO2. J. Environ. Chem. Eng. 2021, 9, 104584. [Google Scholar] [CrossRef]
- Rozman, N.; Tobaldi, D.M.; Cvelbar, U.; Puliyalil, H.; Labrincha, J.A.; Legat, A.; Škapin, A.S. Hydrothermal Synthesis of Rare-Earth Modified Titania: Influence on Phase Composition, Optical Properties, and Photocatalytic Activity. Materials 2019, 12, 713. [Google Scholar] [CrossRef] [Green Version]
- Ray, S.K.; Dhakal, D.; Lee, S.W. Rapid degradation of naproxen by AgBr-α-NiMoO4 composite photocatalyst in visible light: Mechanism and pathways. Chem. Eng. J. 2018, 347, 836–848. [Google Scholar] [CrossRef]
- Weber, A.S.; Grady, A.M.; Koodali, R.T. Lanthanide modified semiconductor photocatalysts. Catal. Sci. Technol. 2012, 2, 683–693. [Google Scholar] [CrossRef]
- Baiju, K.; Sibu, C.; Rajesh, K.; Pillai, P.K.; Mukundan, P.; Warrier, K.; Wunderlich, W. An aqueous sol–gel route to synthesize nanosized lanthana-doped titania having an increased anatase phase stability for photocatalytic application. Mater. Chem. Phys. 2005, 90, 123–127. [Google Scholar] [CrossRef]
- Štengl, V.; Bakardjieva, S.; Murafa, N. Preparation and photocatalytic activity of rare earth doped TiO2 nanoparticles. Mater. Chem. Phys. 2009, 114, 217–226. [Google Scholar] [CrossRef]
- Sibu, C.P.; Kumar, S.R.; Mukundan, P.; Warrier, K.G.K. Structural Modifications and Associated Properties of Lanthanum Oxide Doped Sol-Gel Nanosized Titanium Oxide. Chem. Mater. 2002, 14, 2876–2881. [Google Scholar] [CrossRef]
- Song, L.; Zhao, X.; Cao, L.; Moon, J.-W.; Gu, B.; Wang, W. Synthesis of rare earth doped TiO2 nanorods as photocatalysts for lignin degradation. Nanoscale 2015, 7, 16695–16703. [Google Scholar] [CrossRef] [PubMed]
- Elgendy, K.; Elmehasseb, I.; Kandil, S. Synthesis and characterization of rare earth metal and non-metal co-doped TiO2 nanostructure for photocatalytic degradation of Metronidazole. Environment 2019, 2508, 60–67. [Google Scholar]
- Du, J.; Li, B.; Huang, J.; Zhang, W.; Peng, H.; Zou, J. Hydrophilic and photocatalytic performances of lanthanum doped titanium dioxide thin films. J. Rare Earths 2013, 31, 992–996. [Google Scholar] [CrossRef]
- Zhang, X.; Chen, W.; Lin, Z.; Yao, J.; Tan, S. Preparation and Photocatalysis Properties of Bacterial Cellulose/TiO2 Composite Membrane Doped with Rare Earth Elements. Synth. React. Inorganic Met. Nano-Metal Chem. 2011, 41, 997–1004. [Google Scholar] [CrossRef]
- Liu, J.; Yang, R.; Li, S. Synthesis and Photocatalytic Activity of TiO2/V2O5 Composite Catalyst Doped with Rare Earth Ions. J. Rare Earths 2007, 25, 173–178. [Google Scholar] [CrossRef]
- Zhu, L.; Xiao, Y.F.; Wang, X. The Photocatalytic Oxidation Properties of La3+-Doped and Ce4+-Doped ZnO-TiO2 in Treating Pharmaceutical Wastewater. Adv. Mater. Res. 2013, 726–731, 2988–2992. [Google Scholar] [CrossRef]
- Li, S.; Yang, Y.; Su, Q.; Liu, X.; Zhao, H.; Zhao, Z.; Li, J.; Jin, C. Synthesis and photocatalytic activity of transition metal and rare earth element co-doped TiO2 nano particles. Mater. Lett. 2019, 252, 123–125. [Google Scholar] [CrossRef]
- Ðorđević, V.; Milićević, B.; Dramićanin, M.D. Rare Earth-Doped Anatase TiO2 Nanoparticles. In Titanium Dioxide; InTech: London, UK, 2017. [Google Scholar]
- Smitha, V.S.; Saju, P.; Hareesh, U.S.; Swapankumar, G.; Warrier, K.G.K. Optical Properties of Rare-Earth Doped TiO2 Nanocomposites and Coatings; A Sol-Gel Strategy towards Multi-functionality. ChemistrySelect 2016, 1, 2140–2147. [Google Scholar] [CrossRef]
- Lan, X.; Wang, L.; Zhang, B.; Tian, B.; Zhang, J. Preparation of lanthanum and boron co-doped TiO2 by modified sol–gel method and study their photocatalytic activity. Catal. Today 2014, 224, 163–170. [Google Scholar] [CrossRef]
- Smitha, V.S.; Jyothi, C.K.; Mohamed, A.P.; Pillai, S.; Warrier, K.G. Novel multifunctional titania–silica–lanthanum phosphate nanocomposite coatings through an all aqueous sol–gel process. Dalton Trans. 2013, 42, 4602–4612. [Google Scholar] [CrossRef] [PubMed]
- Khedr, T.M.; El-Sheikh, S.M.; Hakki, A.; Ismail, A.A.; Badawy, W.A.; Bahnemann, D.W. Highly active non-metals doped mixed-phase TiO 2 for photocatalytic oxidation of ibuprofen under visible light. J. Photochem. Photobiol. A Chem. 2017, 346, 530–540. [Google Scholar] [CrossRef]
- Escudero, A.; Becerro, A.I.; Carrillo-Carrion, C.; Núñez, N.O.; Zyuzin, M.V.; Laguna, M.; González, D.; Ocaña, M.; Parak, W.J. Rare earth based nanostructured materials: Synthesis, functionalization, properties and bioimaging and biosensing applications. Nanophotonics 2017, 6, 881–921. [Google Scholar] [CrossRef]
- Sing, K.S.W.; Everett, D.H.; Haul, R.A.W.; Moscou, L.; Pierotti, R.A.; Rouquerol, J.; Siemieniewska, T. Reporting Physisorption Data for Gas/Solid Systems with Special Reference to the Determination of Surface Area and Porosity. Pure Appl. Chem. 1985, 57, 603–619. [Google Scholar] [CrossRef]
- Pérez-Larios, A.; Hernández-Gordillo, A.; Morales-Mendoza, G.; Lartundo-Rojas, L.; Mantilla, Á.; Gómez, R. Enhancing the H2 evolution from water–methanol solution using Mn2+–Mn+3–Mn4+ redox species of Mn-doped TiO2 sol–gel photocatalysts. Catal. Today 2016, 266, 9–16. [Google Scholar] [CrossRef]
- Pérez-Larios, A.; Torres-Ramos, I.; Zanella, R.; Rico, J.L. Ti-Co mixed oxide as photocatalysts in the generation of hydrogen from water. Int. J. Chem. React. Eng. 2022, 20, 129–140. [Google Scholar] [CrossRef]
- Kabir, H.; Nandyala, S.H.; Rahman, M.M.; Kabir, M.A.; Stamboulis, A. Influence of calcination on the sol–gel synthesis of lanthanum oxide nanoparticles. Appl. Phys. A Mater. Sci. Process 2018, 124, 1–11. [Google Scholar] [CrossRef]
- Pérez-Larios, A.; Lopez, R.; Hernández-Gordillo, A.; Tzompantzi, F.; Gómez, R.; Torres-Guerra, L.M. Improved hydrogen production from water splitting using TiO2–ZnO mixed oxides photocatalysts. Fuel 2012, 100, 139–143. [Google Scholar] [CrossRef]
- Santoso, J.S.; Nusantor, Y.R.; Lestari, W.C.; Choir, A.A. Review: Pengaruh Variasi Suhu Kalsinasi C-TiO2, Zn-TiO2, dan La-TiO2 Terhadap Kristalinitas pada Metode Sol-Gel. J. Chem. 2021, 10, 3. [Google Scholar]
- Zalas, M.; Laniecki, M. Photocatalytic hydrogen generation over lanthanides-doped titania. Sol. Energy Mater. Sol. Cells 2005, 89, 287–296. [Google Scholar] [CrossRef]
- McDevitt, N.T.; Baun, W.L. Infrared absorption study of metal oxides in the low frequency region (700–240 cm−1). Spectrochim. Acta 1964, 20, 799–808. [Google Scholar] [CrossRef]
- Catauro, M.; Tranquillo, E.; Poggetto, G.D.; Pasquali, M.; Dell’Era, A.; Ciprioti, S.V. Influence of the Heat Treatment on the Particles Size and on the Crystalline Phase of TiO2 Synthesized by the Sol-Gel Method. Materials 2018, 11, 2364. [Google Scholar] [CrossRef] [Green Version]
- Ruíz-Santoyo, V.; Marañon-Ruiz, V.F.; Romero-Toledo, R.; González Vargas, O.A.; Pérez-Larios, A. Photocatalytic Degradation of Rhodamine B and Methylene Orange Using TiO2-ZrO2 as Nanocomposite. Catalysts 2021, 11, 1035. [Google Scholar] [CrossRef]
- Nguyen-Phan, T.-D.; Song, M.B.; Kim, E.J.; Shin, E.W. The role of rare earth metals in lanthanide-incorporated mesoporous titania. Microporous Mesoporous Mater. 2009, 119, 290–298. [Google Scholar] [CrossRef]
- Kumaresan, L.; Prabhu, A.; Palanichamy, M.; Arumugam, E.; Murugesan, V. Synthesis and characterization of Zr4+, La3+ and Ce3+ doped mesoporous TiO2: Evaluation of their photocatalytic activity. J. Hazard. Mater. 2011, 186, 1183–1192. [Google Scholar] [CrossRef]
- Zhang, Z.; Ni, X.; Yao, K.; Liu, Y.; Sun, Y.; Wang, X.; Huang, W.; Zhang, Y. An electrochemical synthesis of a rare-earth(La3+)-doped ZIF-8 hydroxyapatite composite coating for a Ti/TiO2 implant material. New J. Chem. 2021, 45, 6543–6549. [Google Scholar] [CrossRef]
- Briggs, D. Handbool of X Ray Photoelectron Spectroscopy: A Reference Book of Standard Spectra for Identification and Interpretation of XPS Data. In Handbook of Adhesion; John Wiley & Sons, Ltd.: Chichester, UK, 2005; pp. 621–622. [Google Scholar]
- Thommes, M.; Kaneko, K.; Neimark, A.V.; Olivier, J.P.; Rodriguez-Reinoso, F.; Rouquerol, J.; Sing, K.S.W. Physisorption of gases, with special reference to the evaluation of surface area and pore size distribution (IUPAC Technical Report). Pure Appl. Chem. 2015, 87, 1051–1069. [Google Scholar] [CrossRef] [Green Version]
- Walford, E. Handbook of Inorganic Chemicals; McGraw Hill: New York, NY, USA, 1896. [Google Scholar]
- Li, J.P.H.; Zhou, X.; Pang, Y.; Zhu, L.; Vovk, E.I.; Cong, L.; van Bavel, A.P.; Li, S.; Yang, Y. Understanding of binding energy calibration in XPS of lanthanum oxide by in situ treatment. Phys. Chem. Chem. Phys. 2019, 21, 22351–22358. [Google Scholar] [CrossRef]
- Pérez-Larios, A.; Torres-Ramos, M.; González-Vargas, O.; Rico, J.L.; Zanella, R. Ti–Fe mixed oxides as photocatalysts in the generation of hydrogen under UV-light irradiation. Int. J. Hydrogen Energy 2022. [Google Scholar] [CrossRef]
- Scoca, D.L.S.; Cemin, F.; Bilmes, S.A.; Figueroa, C.A.; Zanatta, A.R.; Alvarez, F. Role of Rare Earth Elements and Entropy on the Anatase-To-Rutile Phase Transformation of TiO2 Thin Films Deposited by Ion Beam Sputtering. ACS Omega 2020, 5, 28027–28036. [Google Scholar] [CrossRef] [PubMed]
- Manjumol, K.A.; Smitha, V.S.; Shajesh, P.; Baiju, K.V.; Warrier, K.G.K. Synthesis of lanthanum oxide doped photocatalytic nano titanium oxide through aqueous sol–gel method for titania multifunctional ultrafiltration membrane. J. Sol-Gel Sci. Technol. 2010, 53, 353–358. [Google Scholar] [CrossRef]
- Eslami, A.; Amini, M.M.; Asadi, A.; Safari, A.A.; Daglioglu, N. Photocatalytic degradation of ibuprofen and naproxen in water over NS-TiO2 coating on polycarbonate: Process modeling and intermediates identification. Inorg. Chem. Commun. 2020, 115, 107888. [Google Scholar] [CrossRef]
- Fan, G.; Zhan, J.; Luo, J.; Zhang, J.; Chen, Z.; You, Y. Photocatalytic degradation of naproxen by a H2O2-modified titanate nanomaterial under visible light irradiation. Catal. Sci. Technol. 2019, 9, 4614–4628. [Google Scholar] [CrossRef]
- Regmi, C.; Kshetri, Y.K.; Pandey, R.P.; Lee, S.W. Visible-light-driven S and W co-doped dendritic BiVO 4 for efficient photocatalytic degradation of naproxen and its mechanistic analysis. Mol. Catal. 2018, 453, 149–160. [Google Scholar] [CrossRef]
- Méndez-Arriaga, F.; Gimenez, J.; Esplugas, S. Photolysis and TiO2 Photocatalytic Treatment of Naproxen: Degradation, Mineralization, Intermediates and Toxicity. J. Adv. Oxid. Technol. 2008, 11, 435–444. [Google Scholar] [CrossRef]
- Begum, S. Ahmaruzzaman Biogenic synthesis of SnO2/activated carbon nanocomposite and its application as photocatalyst in the degradation of naproxen. Appl. Surf. Sci. 2018, 449, 780–789. [Google Scholar] [CrossRef]


| Catalyst | Contaminant | Type of Light | Reaction Time (min) | Efficiency | Reference |
|---|---|---|---|---|---|
| Ti-La | Methylene blue | UV irradiation | 20 | 20% | [28] |
| Ti-Ce | Methylene blue | 585 nm | 20 | <10% | [28] |
| Ti-Gd | Methylene blue | UV irradiation | 20 | 20% | [28] |
| Ti-Ce | Metronidazole | Visible light illumination | 120 | 50% | [35] |
| Ti-Ce/N/C | Metronidazole | Visible light illumination | 120 | 100% | [35] |
| Ti-Co/Ce/La/Eu/Sm | Methylene blue | 440–550 nm | 30 | >90% | [40] |
| TiO2 | Methylene blue | 440–550 nm | 30 | <50% | [40] |
| Ti-Nd | Methyl orange | Simulated solar radiation (SSR) | 240 | >90% | [41] |
| Ti-Eu | Methyl orange | SSR | 240 | <70% | [41] |
| Ti-Tb | Methyl orange | SSR | 240 | <40% | [41] |
| TiO2 | Methyl orange | SSR | 240 | <50% | [41] |
| Ti-La | Methylene blue | 484 nm | 120 | <70% | [42] |
| Ti-La/Tb | Methylene blue | 484 nm | 120 | 80% | [42] |
| Ti-Eu | Methyl orange | Simulated sunlight radiation | 20 | >95% | [34] |
| P25 TiO2 | Methyl orange | Simulated sunlight radiation | 20 | <50% | [34] |
| Ti-Sm | Lignin | Simulated sunlight radiation | 90 | >95% | [34] |
| P25 TiO2 | Lignin | Simulated sunlight radiation | 90 | <80% | [34] |
| Ti-La | Azo-dye acid orange 7 | >420 nm | 300 | <80% | [43] |
| Ti-La-B | Azo-dye acid orange 7 | >420 nm | 300 | >90% | [43] |
| Ti-Si-La | Methylene blue | UV irradiation | 120 | 94% | [44] |
| TiO2 | Methylene blue | UV irradiation | 120 | <60% | [44] |
| Ti/bc-La | Methyl orange | UV irradiation | 300 | >85% | [37] |
| Ti/bc-Ce | Methyl orange | UV irradiation | 300 | >95% | [37] |
| Ti/bc | Methyl orange | UV irradiation | 300 | <60% | [37] |
| C,N,S-TiO2 | Ibuprofen | Visible light | 300 | >99% | [45] |
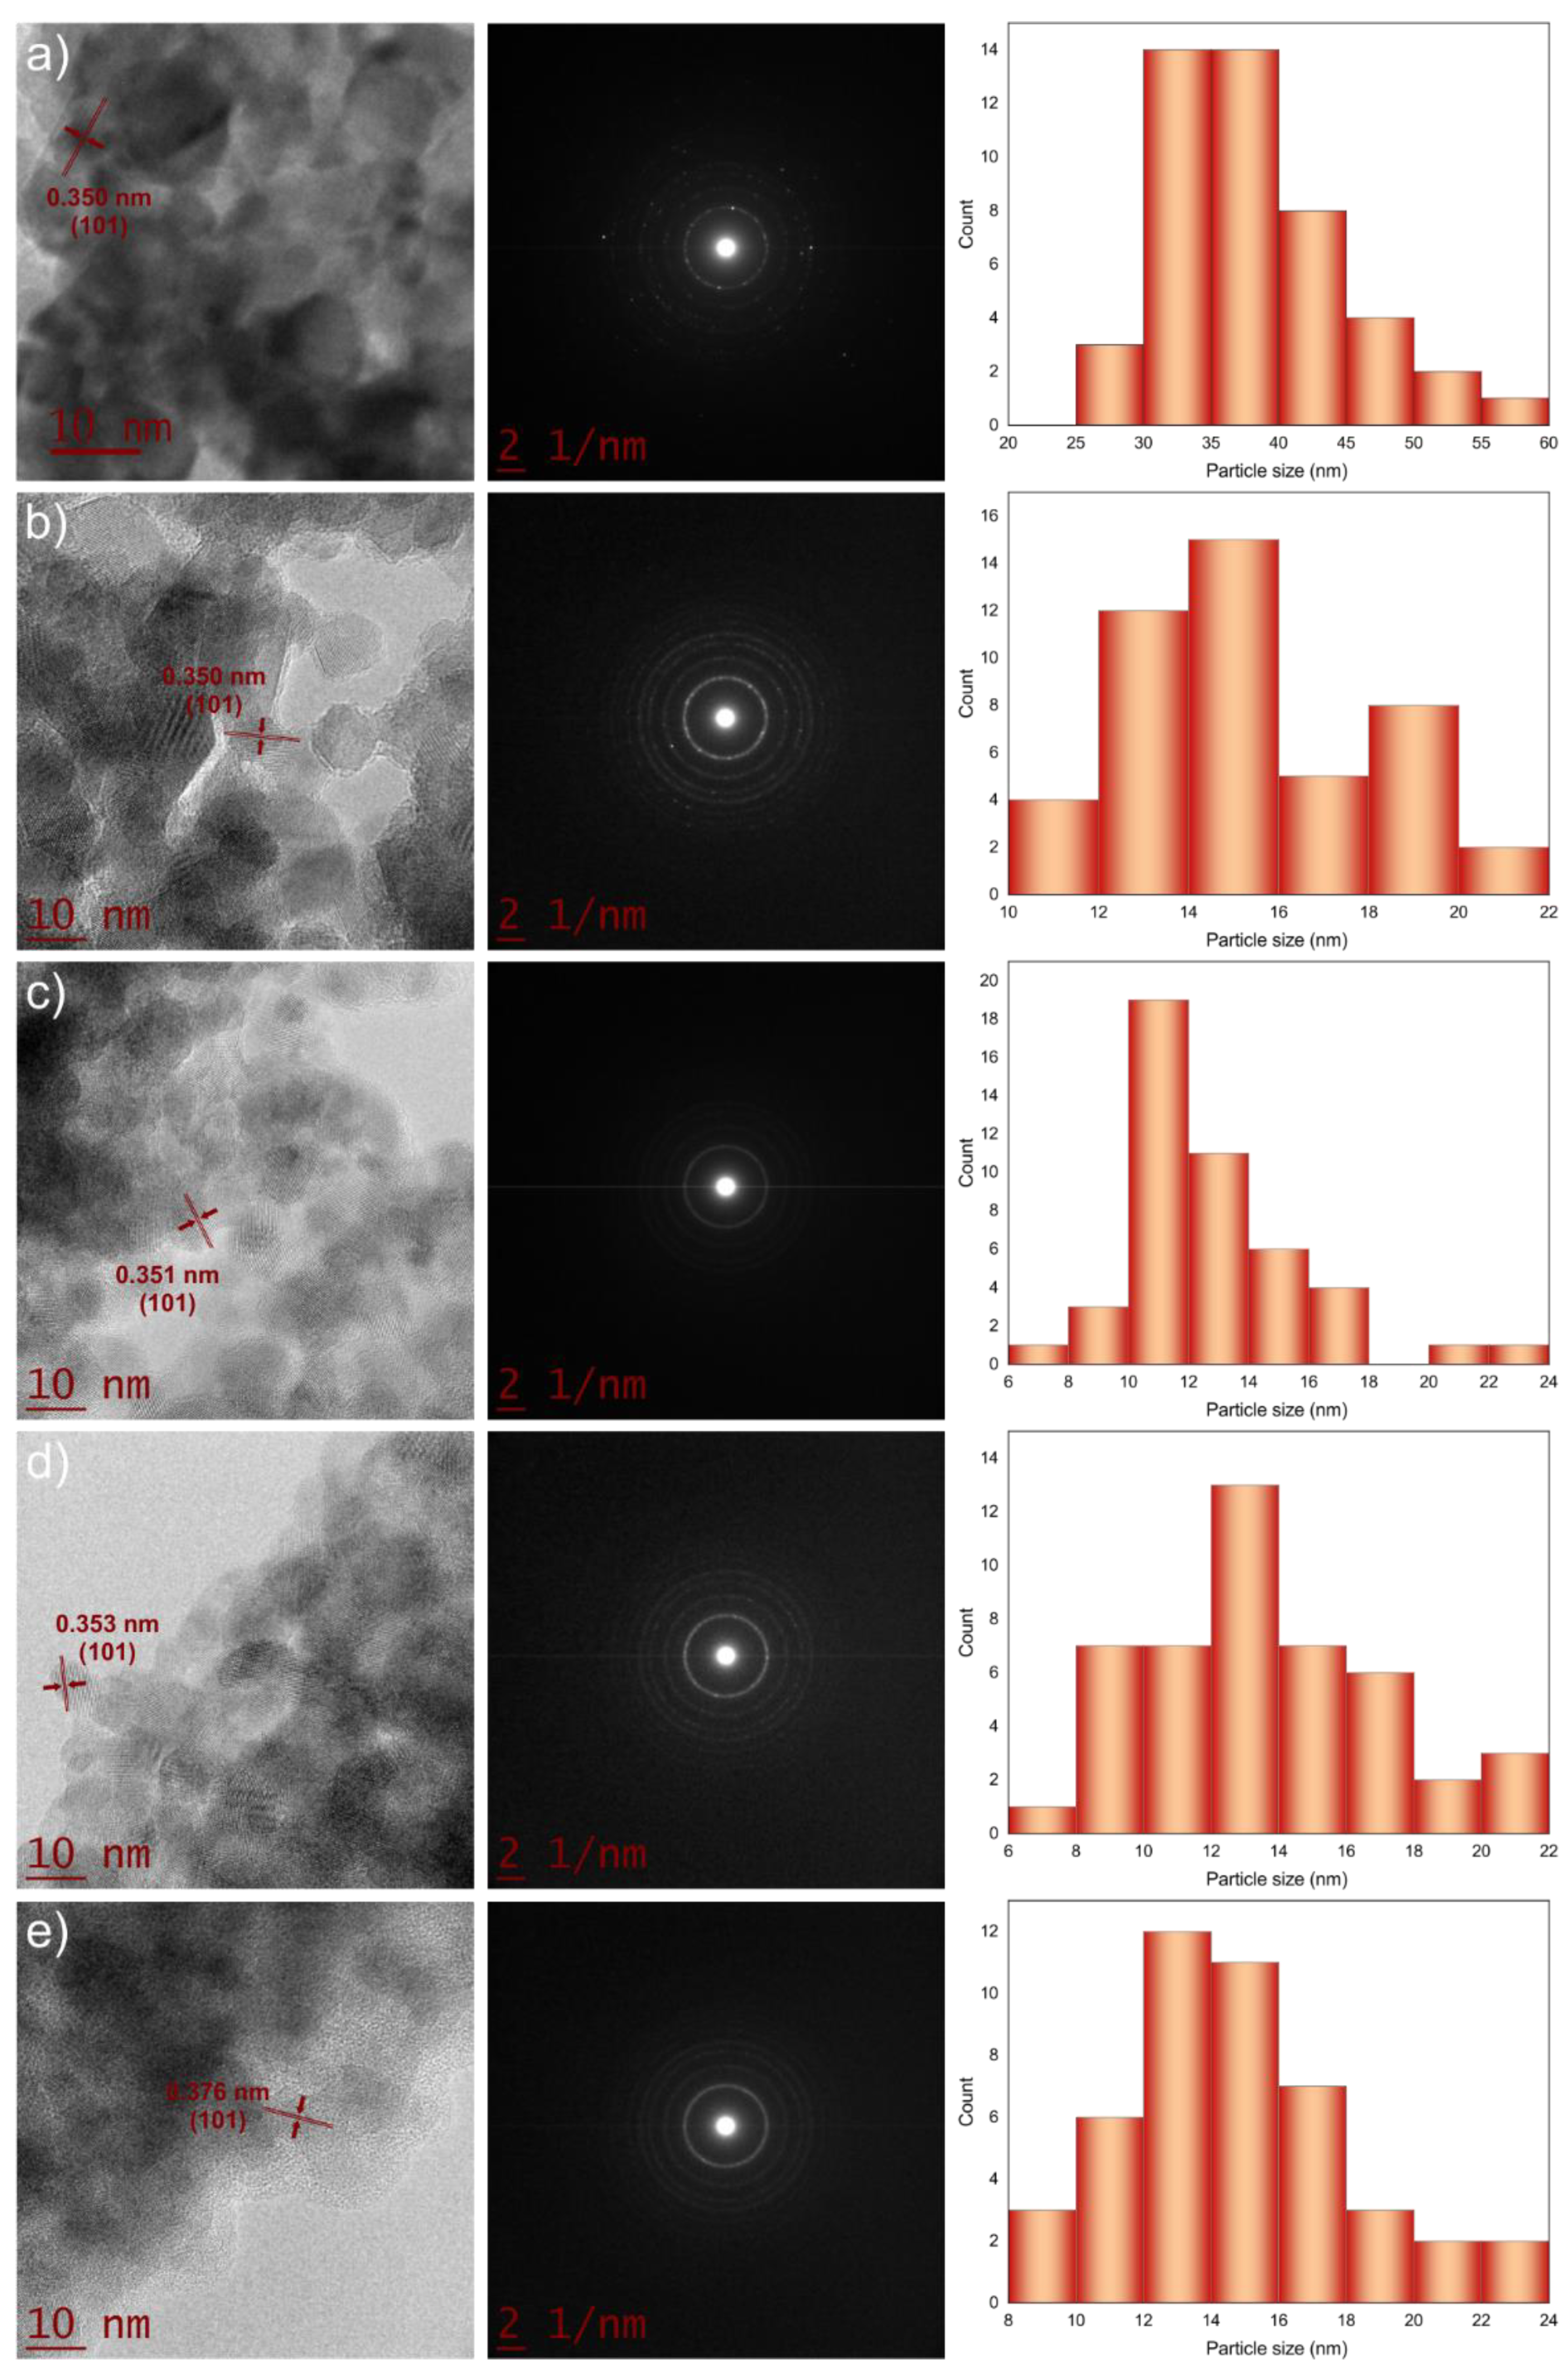
| Samples | BET (m2/g) | Pore Diameter (nm) | Cell Parameter a (Å) | Crystallite Size, D (nm) | Eg (eV) |
|---|---|---|---|---|---|
| Ti-La1 | 112.7 | 14.32 | 3.790 | 9.22 | 2.92 |
| Ti-La3 | 127.8 | 12.95 | 3.792 | 6.52 | 2.99 |
| Ti-La5 | 135.8 | 12.07 | 3.796 | 6.33 | 2.98 |
| Ti-La10 | 144.6 | 8.99 | 3.820 | 5.21 | 3.01 |
| TiO2 | 64.0 | 6.5 | 3.790 | 20.58 | 3.05 |
| Element | Binding Energies in eV, and Chemical State | ||||
|---|---|---|---|---|---|
| TiO2 | Ti-La1 | Ti-La3 | Ti-La5 | Ti-La10 | |
| Ti 2p3/2 | 459.25 | 459.31 | 459.25 | 457.78 | 459.25 |
| Chemical state | Ti4+ | Ti4+ + Ti3+ | Ti4+ + Ti3+ | Ti4+ + Ti3+ | Ti4+ + Ti3+ |
| Ti 2p1/2 | 464.96 | 464.99 | 464.73 | 463.53 | 464.76 |
| Chemical state | Ti4+ | Ti4+ + Ti3+ | Ti4+ + Ti3+ | Ti4+ + Ti3+ | Ti4+ + Ti3+ |
| La 3d5/2 | - | 835.89 | 835.18 | 833.72 | 835.18 |
| La 3d3/2 | - | 854.96 | 852.20 | 850.76 | 852.20 |
| Chemical state | - | La3+ | La3+ | La3+ | La3+ |
| Weight% La | - | 1.44 | 3.52 | 5.43 | 8.58 |
| Sample | % Degradation | Standard Deviation | % Mineralization | Standard Deviation |
|---|---|---|---|---|
| Ti-La1 | 99.55 | ±0.20 | 99.65 | ±0.08 |
| Ti-La3 | 93.76 | ±0.24 | 93.78 | ±0.29 |
| Ti-La5 | 90.13 | ±0.29 | 93.22 | ±0.47 |
| Ti-La10 | 93.45 | ±0.29 | 94.45 | ±0.48 |
| TiO2 | 97.90 | ±0.19 | 99.64 | ±0.36 |
| Photolysis | 45.12 | ±0.39 | 18.92 | ±0.39 |
| Photocatalyst | Pharmaceutical Compound | Type of Irradiation | Reaction Time (min) | % Degradation | Reference |
|---|---|---|---|---|---|
| H2O2 modified titanate nanomaterial | Naproxen | Visible light | 180 | 99.9 | [67] |
| BiVO4 | Naproxen | Visible light | 300 | 80% | [68] |
| AgBr-α-NiMoO4 | Naproxen | Visible light | 20 | 84 | [29] |
| TiO2 | Naproxen | Xe-lamp | 180 | 40 | [69] |
| SnO2/AC | Naproxen | Direct sunlight | 120 | 94 | [70] |
| P25-TiO2 | Naproxen | Visible light | 600 | 94 | [71] |
Publisher’s Note: MDPI stays neutral with regard to jurisdictional claims in published maps and institutional affiliations. |
© 2022 by the authors. Licensee MDPI, Basel, Switzerland. This article is an open access article distributed under the terms and conditions of the Creative Commons Attribution (CC BY) license (https://creativecommons.org/licenses/by/4.0/).
Share and Cite
Marizcal-Barba, A.; Limón-Rocha, I.; Barrera, A.; Casillas, J.E.; González-Vargas, O.A.; Rico, J.L.; Martinez-Gómez, C.; Pérez-Larios, A. TiO2-La2O3 as Photocatalysts in the Degradation of Naproxen. Inorganics 2022, 10, 67. https://0-doi-org.brum.beds.ac.uk/10.3390/inorganics10050067
Marizcal-Barba A, Limón-Rocha I, Barrera A, Casillas JE, González-Vargas OA, Rico JL, Martinez-Gómez C, Pérez-Larios A. TiO2-La2O3 as Photocatalysts in the Degradation of Naproxen. Inorganics. 2022; 10(5):67. https://0-doi-org.brum.beds.ac.uk/10.3390/inorganics10050067
Chicago/Turabian StyleMarizcal-Barba, Adriana, Isaias Limón-Rocha, Arturo Barrera, José Eduardo Casillas, O. A. González-Vargas, José Luis Rico, Claudia Martinez-Gómez, and Alejandro Pérez-Larios. 2022. "TiO2-La2O3 as Photocatalysts in the Degradation of Naproxen" Inorganics 10, no. 5: 67. https://0-doi-org.brum.beds.ac.uk/10.3390/inorganics10050067