Magnetic Transitions in the Co-Modified Mn2Sb System
by
 ,
,
Johanna S. Wilden
1, 
Andreas Hoser
2,
Mamuka Chikovani
3,
Jörg Perßon
3,
Jörg Voigt
3,
Karen Friese
3 and
Andrzej Grzechnik
1,* 1
Institute of Crystallography, RWTH Aachen University, 52066 Aachen, Germany
2
Helmholtz-Zentrum Berlin, Hahn-Meitner Platz 1, 14109 Berlin, Germany
3
Jülich Centre for Neutron Science—2/Peter Grünberg Institute—4, Forschungszentrum Jülich, 52425 Jülich, Germany
*
Author to whom correspondence should be addressed.
Inorganics 2018, 6(4), 113; https://0-doi-org.brum.beds.ac.uk/10.3390/inorganics6040113
Submission received: 10 September 2018
/
Revised: 8 October 2018
/
Accepted: 17 October 2018
/
Published: 19 October 2018
(This article belongs to the Section Inorganic Solid-State Chemistry)
Abstract
:Mn2Sb is ferrimagnetic below its Curie temperature (TC) and passes through a spin flip transition with decreasing temperature. The Co substitution induces an additional first-order phase transition from the ferrimagnetic (FRI) to an antiferromagnetic (AFM) state. This phase transition is connected to a sizable magnetocaloric effect (MCE). To understand the underlying mechanisms, the temperature dependence of structural and magnetic changes was analyzed. At the same time, the influence of the Co substitution was explored. Three Mn2−xCoxSb (x = 0.1, 0.15, 0.2) compounds were synthesized by cold crucible induction melting. Neutron powder diffraction was performed to determine the magnetic structures and to obtain the individual magnetic moments on both symmetrically independent Mn sites. In combination with the temperature-dependent magnetization measurements, the magnetic phase transition temperatures were identified. In the low-temperature range, additional antiferromagnetic peaks were detected, which could be indexed with a propagation vector of (0 0 ½). In Mn1.9Co0.1Sb at 50 K and in Mn1.8Co0.2Sb at 200 K, a co-existence of the FRI and the AFM state was observed. The pure AFM state only occurs in Mn1.8Co0.2Sb at 50 K.
1. Introduction
Mn2Sb (space group: P4/nmm) crystalizes in a tetragonal Cu2Sb-type structure [1,2,3,4,5,6,7,8,9]. The Mn atoms are located on two symmetrically independent crystallographic sites: Mn1 (site symmetry: −42m) and Mn2 (site symmetry: 4mm) [9]. The nuclear structure is stable over a broad temperature range, while the magnetic structure passes through a series of phase transitions. The first magnetic phase transition for Mn2Sb occurs at TC~550 K [1,2,3,4,5,6,7,8,9,10,11]. Below this temperature, the material is ferrimagnetic with the magnetic moments aligned parallel to the c axis [2,6,9,10]. At about 240 K [2,6,8,9,10], a spin flip transition (TSF) occurs and the magnetic moments align parallel to the a-b plane.
Mn2−xCoxSb crystalizes in the same tetragonal space group as Mn2Sb. The Co atoms only occupy the Mn1 sites [1,2,3,6,9,12]. An increase in the Co content decreases TC [2]. For low Co contents (0 < x < 0.1), the material is ferrimagnetic below TC with an ordering scheme like the one reported for Mn2Sb. Higher amounts of Co (0.1 < x < 0.35) lead to an additional magnetic phase transition at Tt~180 K [9,12]. A sudden decrease of magnetization indicates a phase transition from the FRI into an AFM state [8]. Here, the space group of the nuclear structure is preserved, while a discontinuous contraction of the c lattice parameter takes place [9]. A sizeable magnetocaloric effect (MCE) is connected to the occurrence of a thermal hysteresis, which implies the first-order character of this phase transition [6,7]. With the application of magnetic fields, Tt can be shifted to lower temperatures [3,4,6]. Reference [13] claimed metastability to occur during the first-order phase transition in the Co-modified Mn2Sb system. Therefore, low cooling rates are required to gain thermodynamic equilibrium. Prior studies show contradictory results in the magnetization measurements and the phase transition temperature determination [3,6,7,9,12]. The aim of this study is to find an explanation for these discrepancies and to investigate the influence of Co incorporation on the magnetic phase transitions. Therefore, the impact of thermal history was also considered here. Using neutron powder diffraction, we determined the structures of all magnetic states.
2. Results and Discussion
2.1. Chemical Analysis and Crystal Structure
The results of the chemical analysis indicate that there was no contamination in any of the Mn2−xCoxSb (x = 0.1, 0.15, 0.2) samples. Within the tripled standard deviations, only slight discrepancies with respect to the nominal compositions were observed (Tables S1–S3).
All peaks in the X-ray powder diffractograms can be indexed with the tetragonal Cu2Sb-type lattice (space group: P4/nmm). The occurrence of hexagonal MnSb (space group: P63/mmc), which is often reported as a by-product of the synthesis [6,7,8], could be excluded. A comparison of the lattice parameters (Table S4) of the Mn2−xCoxSb (x = 0.1, 0.15, 0.2) compounds with the ones of pure Mn2Sb (a = 4.08 Å and c = 6.56 Å [10]) clearly shows that the Co incorporation has a minor influence on the a lattice parameter, while the c lattice parameter significantly decreases. The a/c ratios determined in this work (Table S4) are lower than the ones determined by other authors [6,7,8,12], who did not explicitly mention the chemical composition of their samples. As the occurrence of MnSb impurities was observed by many of these authors [6,7,8], the different a/c ratios could be due to the deviations from the ideal compositions.
2.2. Magnetic Properties
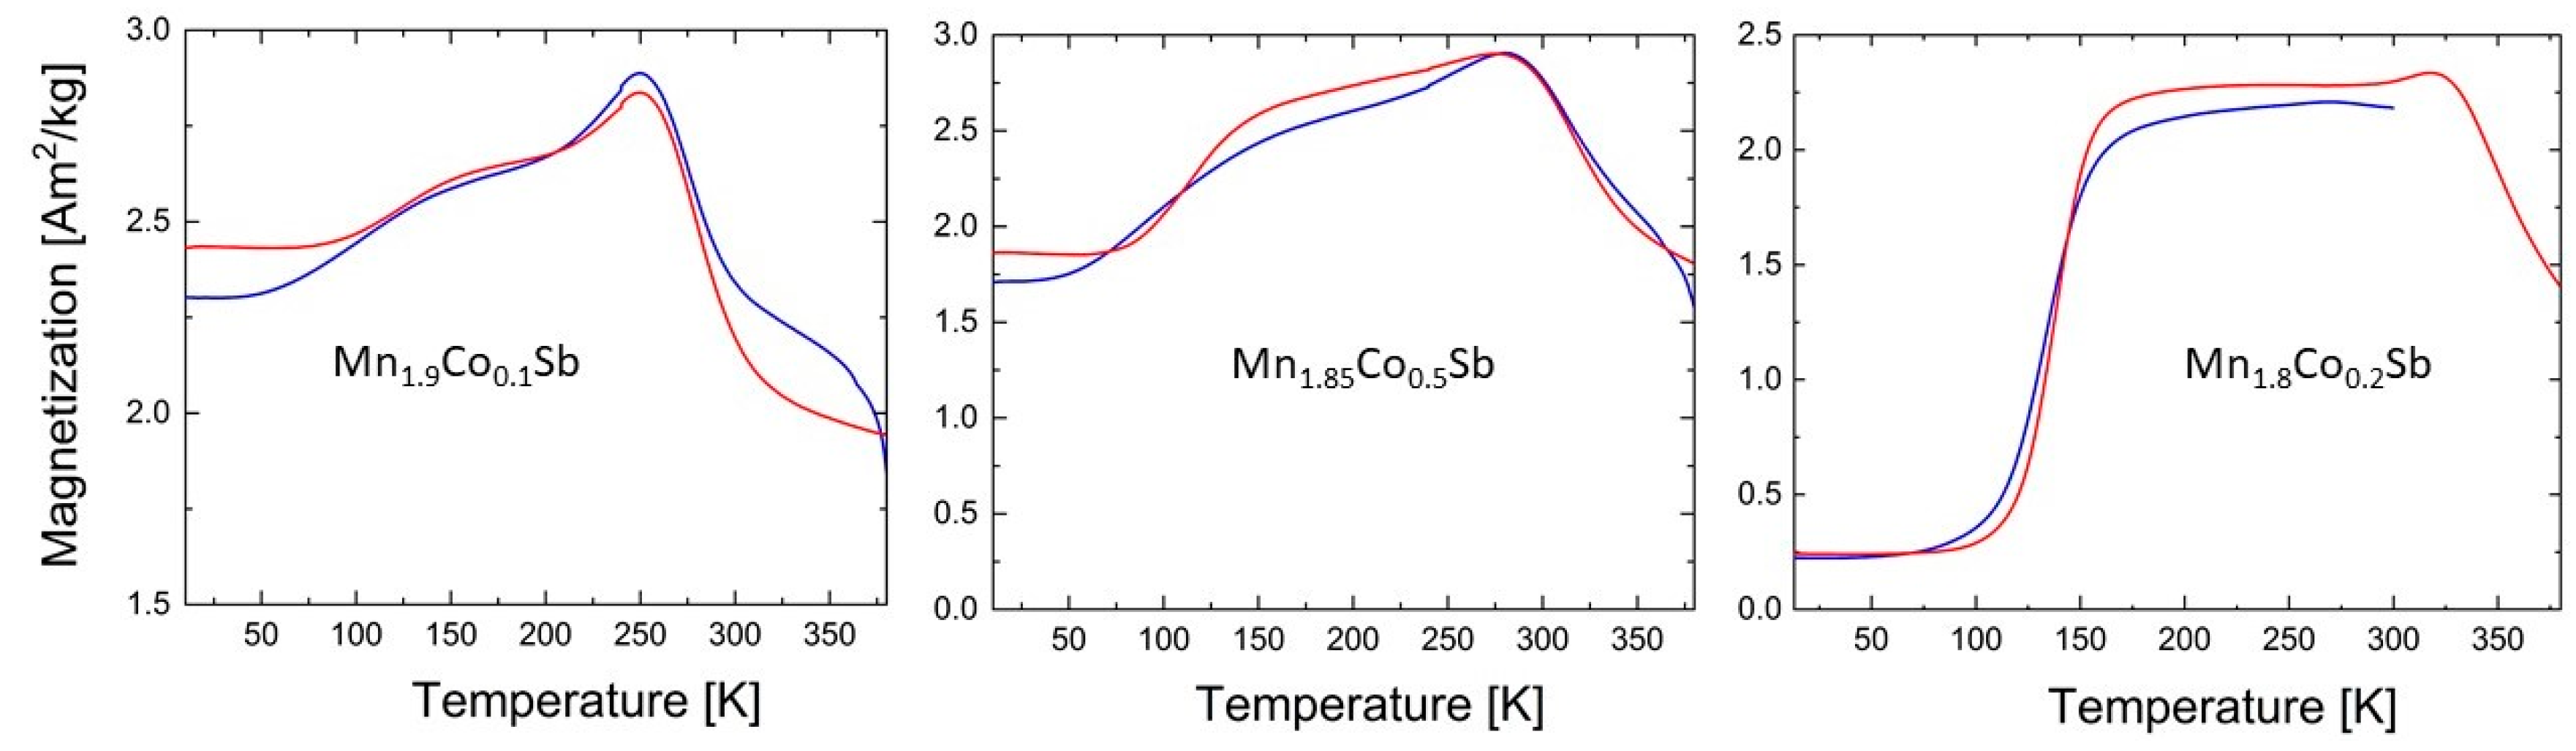
The magnetic properties of the polycrystalline Mn2−xCoxSb (x = 0.1, 0.15, 0.2) samples were studied by isofield measurements. Since we are interested in the magnetically ordered phases, we have used the low-temperature option of the vibrating sample magnetometer. The temperature-dependent magnetization curves (Figure 1) exhibit similar features for all three compositions. At low temperatures we observe a constant magnetization, which increases towards higher temperatures. The temperature dependence features an inflection point for all three compositions between 100 K and 200 K, and then a maximum between 250 K and 325 K. The magnetization is decreased at temperatures approaching 380 K, but the behavior is clearly not paramagnetic. The different response depending on the temperature protocol can be due to small differences in the microstructure of the powder and also due to the metastability. The magnetization increase in the low-temperature region becomes more pronounced with increasing Co content. For all three curves, we observe distinct differences between the cooling and the heating curves. To obtain the accurate phase transition temperatures, the extrema of first derivatives of the magnetization curves dM/dT were determined (Figures S1–S3). In Table 1, we compare the transition temperatures for different temperature protocols.
The phase transition from the FRI into an AFM state does not occur in pure Mn2Sb. A thermal hysteresis between the cooling and heating cycles in Mn2−xCoxSb (x = 0.1, 0.15, 0.2) indicates the first-order phase transition. No correlation between the Co content and Tt was found in this study (Figure S5). TSF are slightly higher, while Tt are slightly lower than the temperatures reported in the literature (Figures S4 and S5). Again, this can be due to instrumental discrepancies or deviations in the chemical compositions. No correlation between the Co content and the width of the thermal hysteresis (Thys) was observed. With Thys = 23 K, Mn1.85Co0.15Sb shows the broadest hysteresis, followed by Mn1.9Co0.1Sb with Thys = 17 K. Surprisingly, Mn1.8Co0.2Sb shows a very narrow thermal hysteresis with Thys = 3 K. Nevertheless, this compound is the only one that exhibits a magnetization of ~0 Am2/kg in the low-temperature region, which indicates the occurrence of AFM phases.
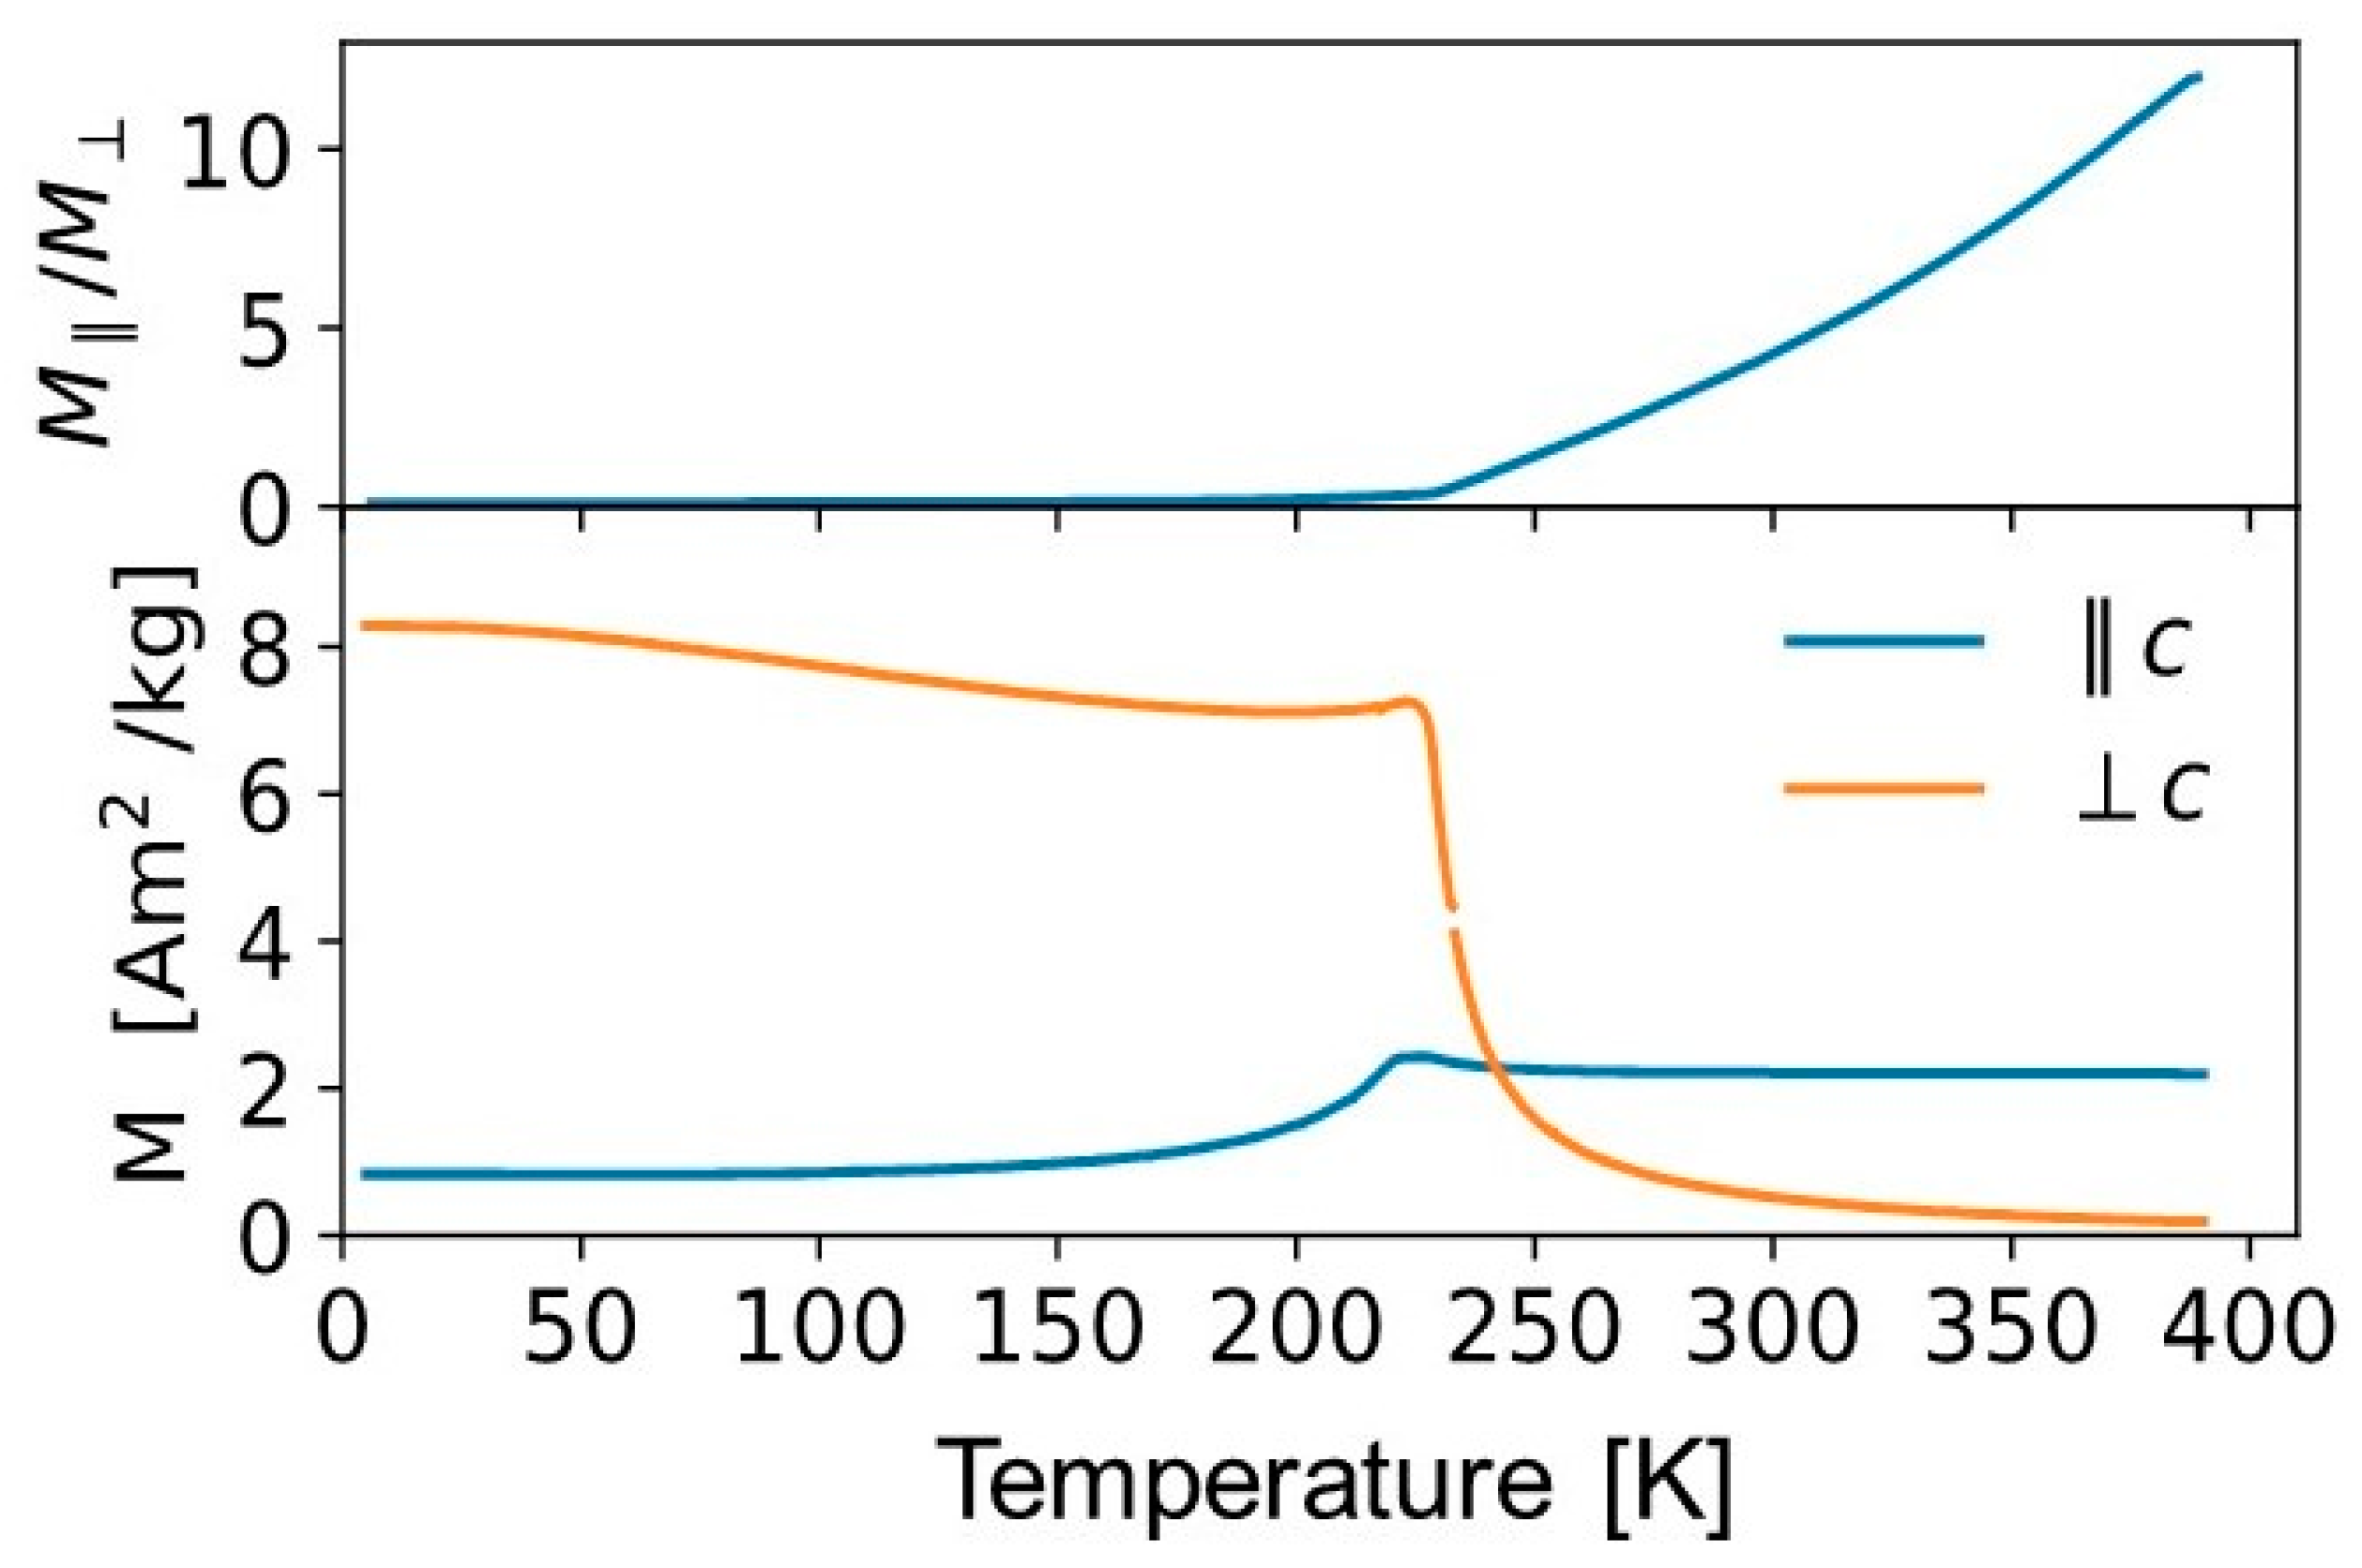
Measurements on an oriented Mn1.9Co0.1Sb single crystal provide better insight into the anisotropy of the system. In a constant magnetic field of 0.01 T, we observe distinct anisotropy for the fields perpendicular or parallel to the c direction (Figure 2). At low temperatures, the easy axis of magnetization lies within the a-b plane. Around 180 K, the response goes through a local minimum and then increases slightly up to 230 K and finally decreases towards 0 at higher temperatures. The response parallel to c changes in the other way. From a small residual moment below 50 K, the moment rises up to 230 K. It then decreases and is essentially constant up to 380 K, the highest temperature we have measured. From the ratio we clearly identify the spin flip transition at 230 K for this sample. This observation is in contrast to the results from the powder magnetization measurements. The transition appears at lower temperature and also the second transition to the AF phase is suppressed. This might be understood as the x = 0.1 composition is close to the phase boundary, where the transition into an AFM phase is lost. While the nominal composition is x = 0.1, the actual Co content could be slightly smaller for the single crystal.
2.3. Neutron Powder Diffraction and Magnetic Structure
Neutron powder diffractograms were collected at five temperatures (50 K, 200 K, room temperature (RT), 350 K, and 550 K) for each Mn2−xCoxSb (x = 0.1, 0.15, 0.2) compound to determine the nuclear and magnetic structures. Due to restrictions in the available beamtime, the measurement for Mn1.85Co0.15Sb started with a heating cycle, followed by a cooling cycle, while Mn1.8Co0.2Sb and Mn1.9Co0.1Sb were measured the other way around. The measured diffractograms for Mn1.85Co0.15Sb show only very diffuse magnetic reflections with a low signal-to-noise ratio. Unfortunately, the data quality is not sufficient for further magnetic structure refinements. This is presumably since the magnetic ordering for Mn1.85Co0.15Sb on cooling was not fully completed and the thermodynamic equilibrium was not reached yet. The important role of the thermal history is thus evidenced by this observation.
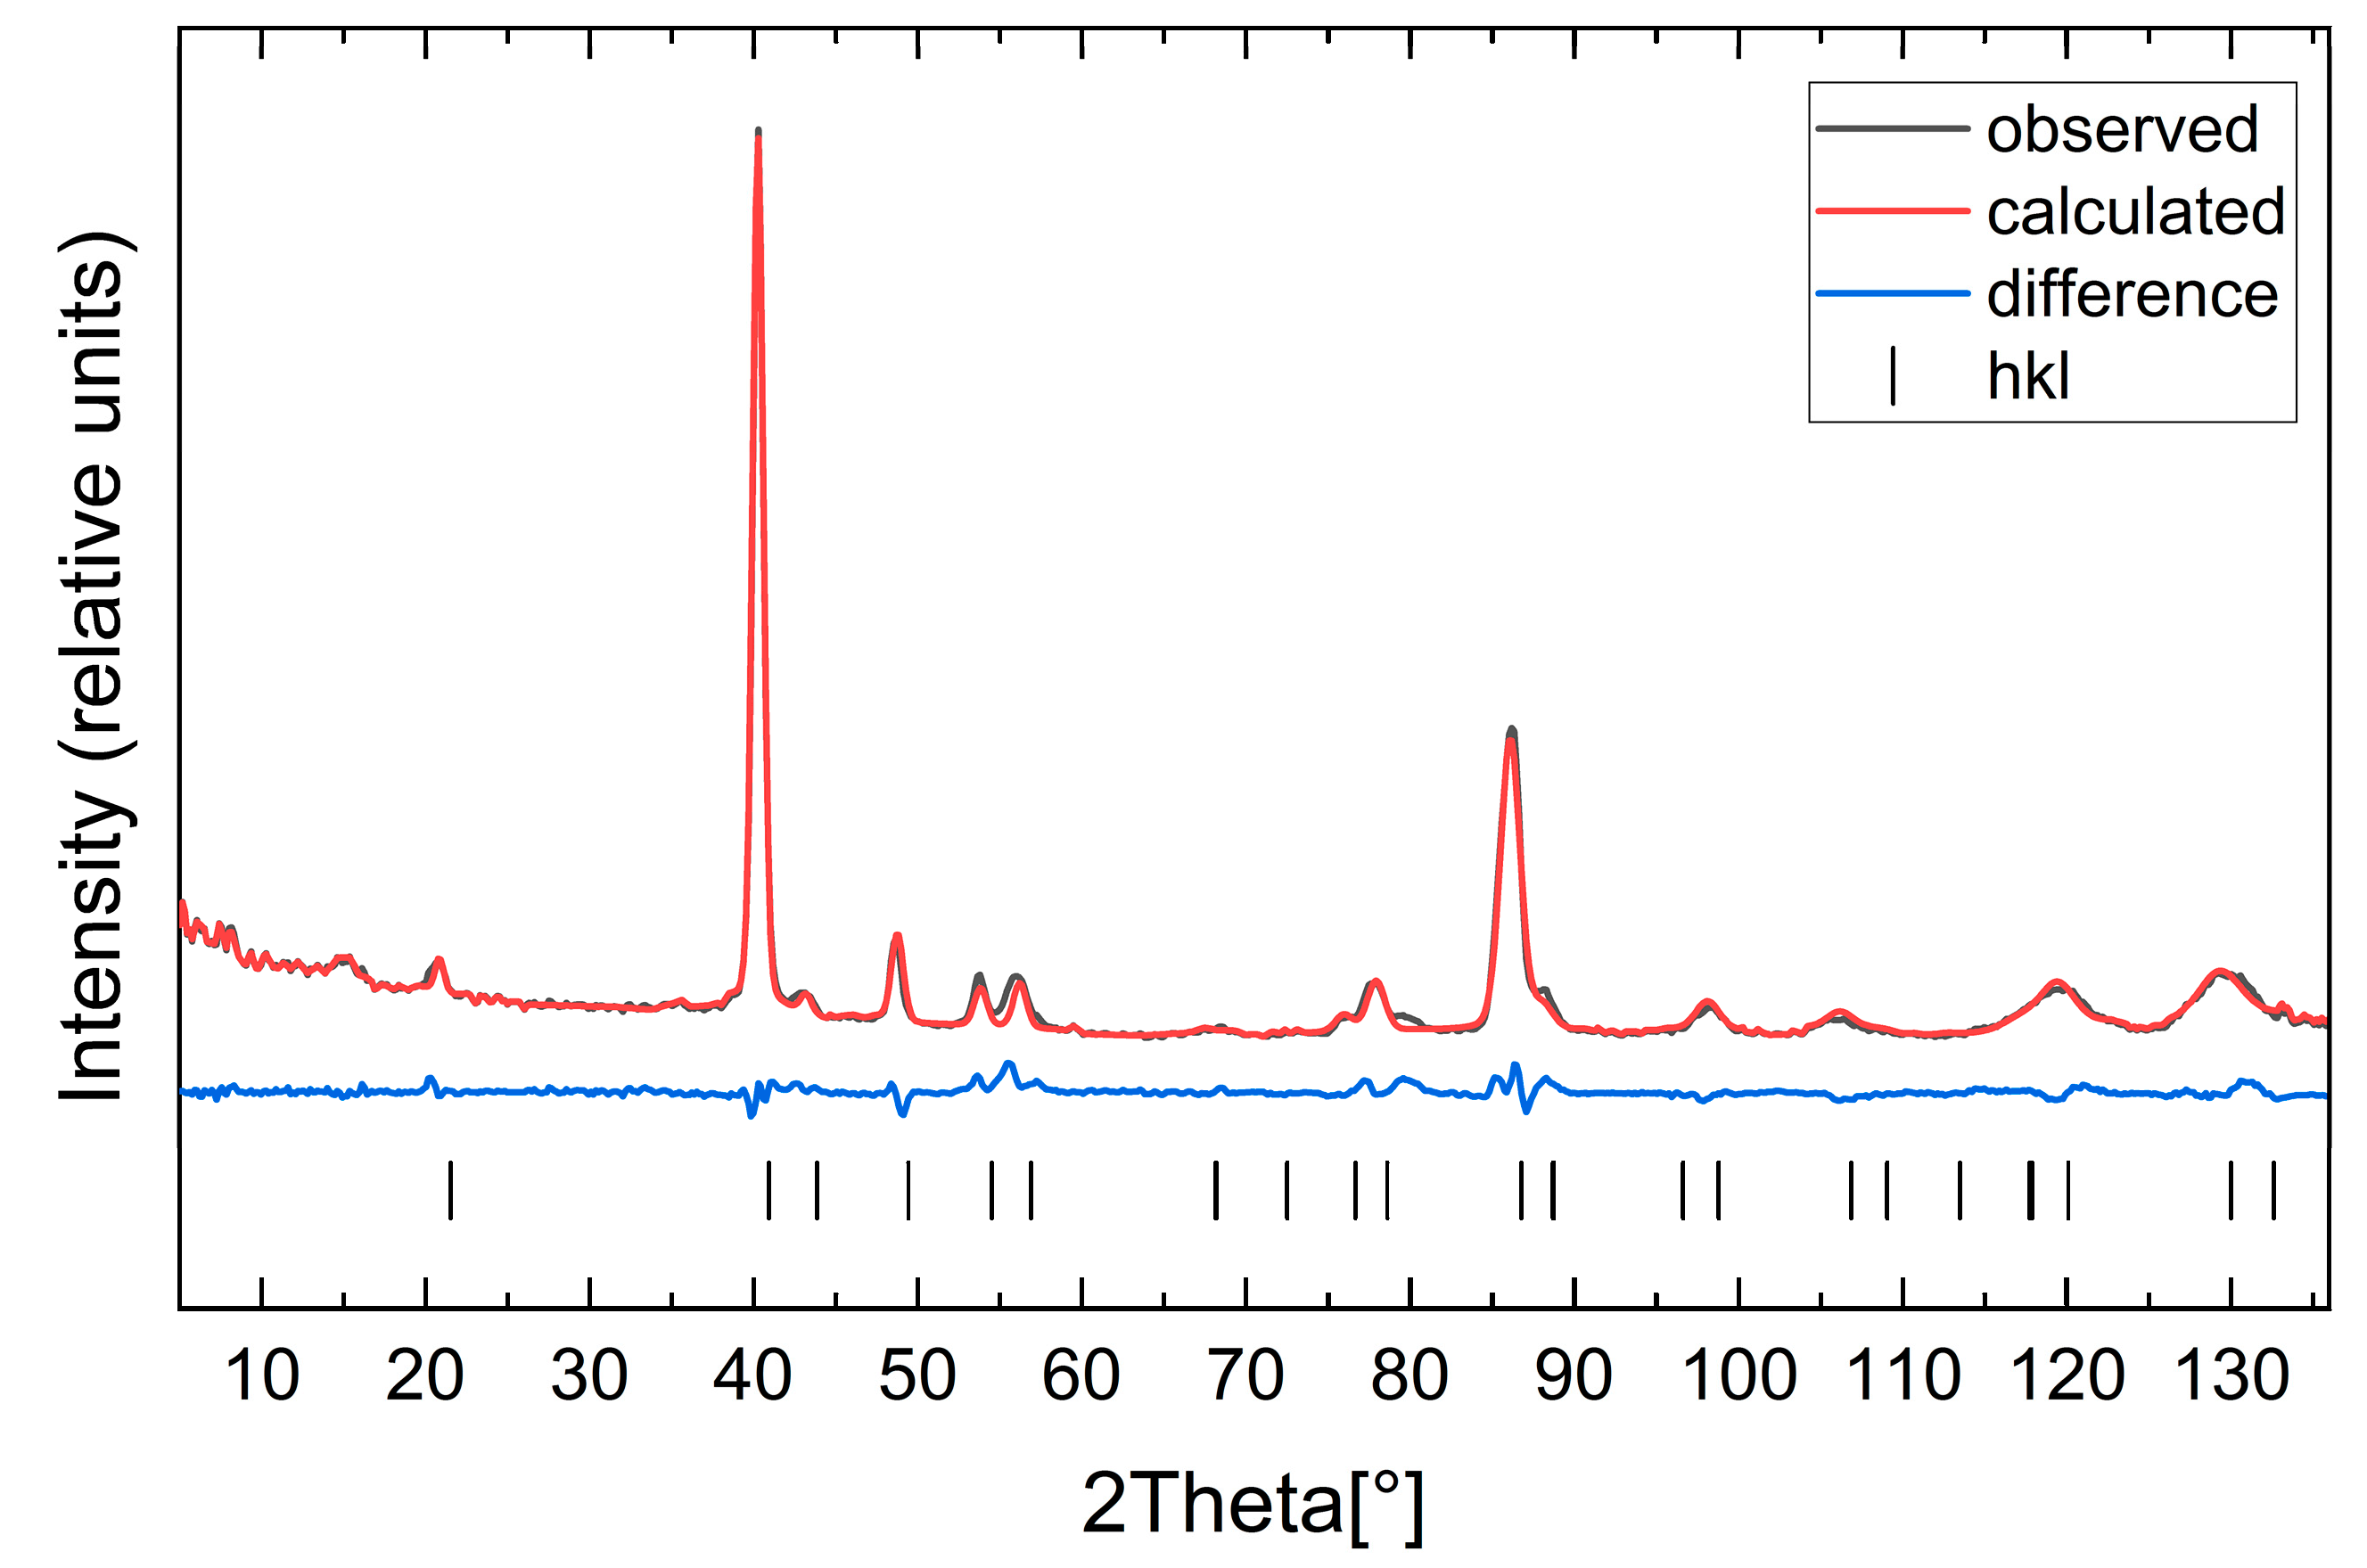
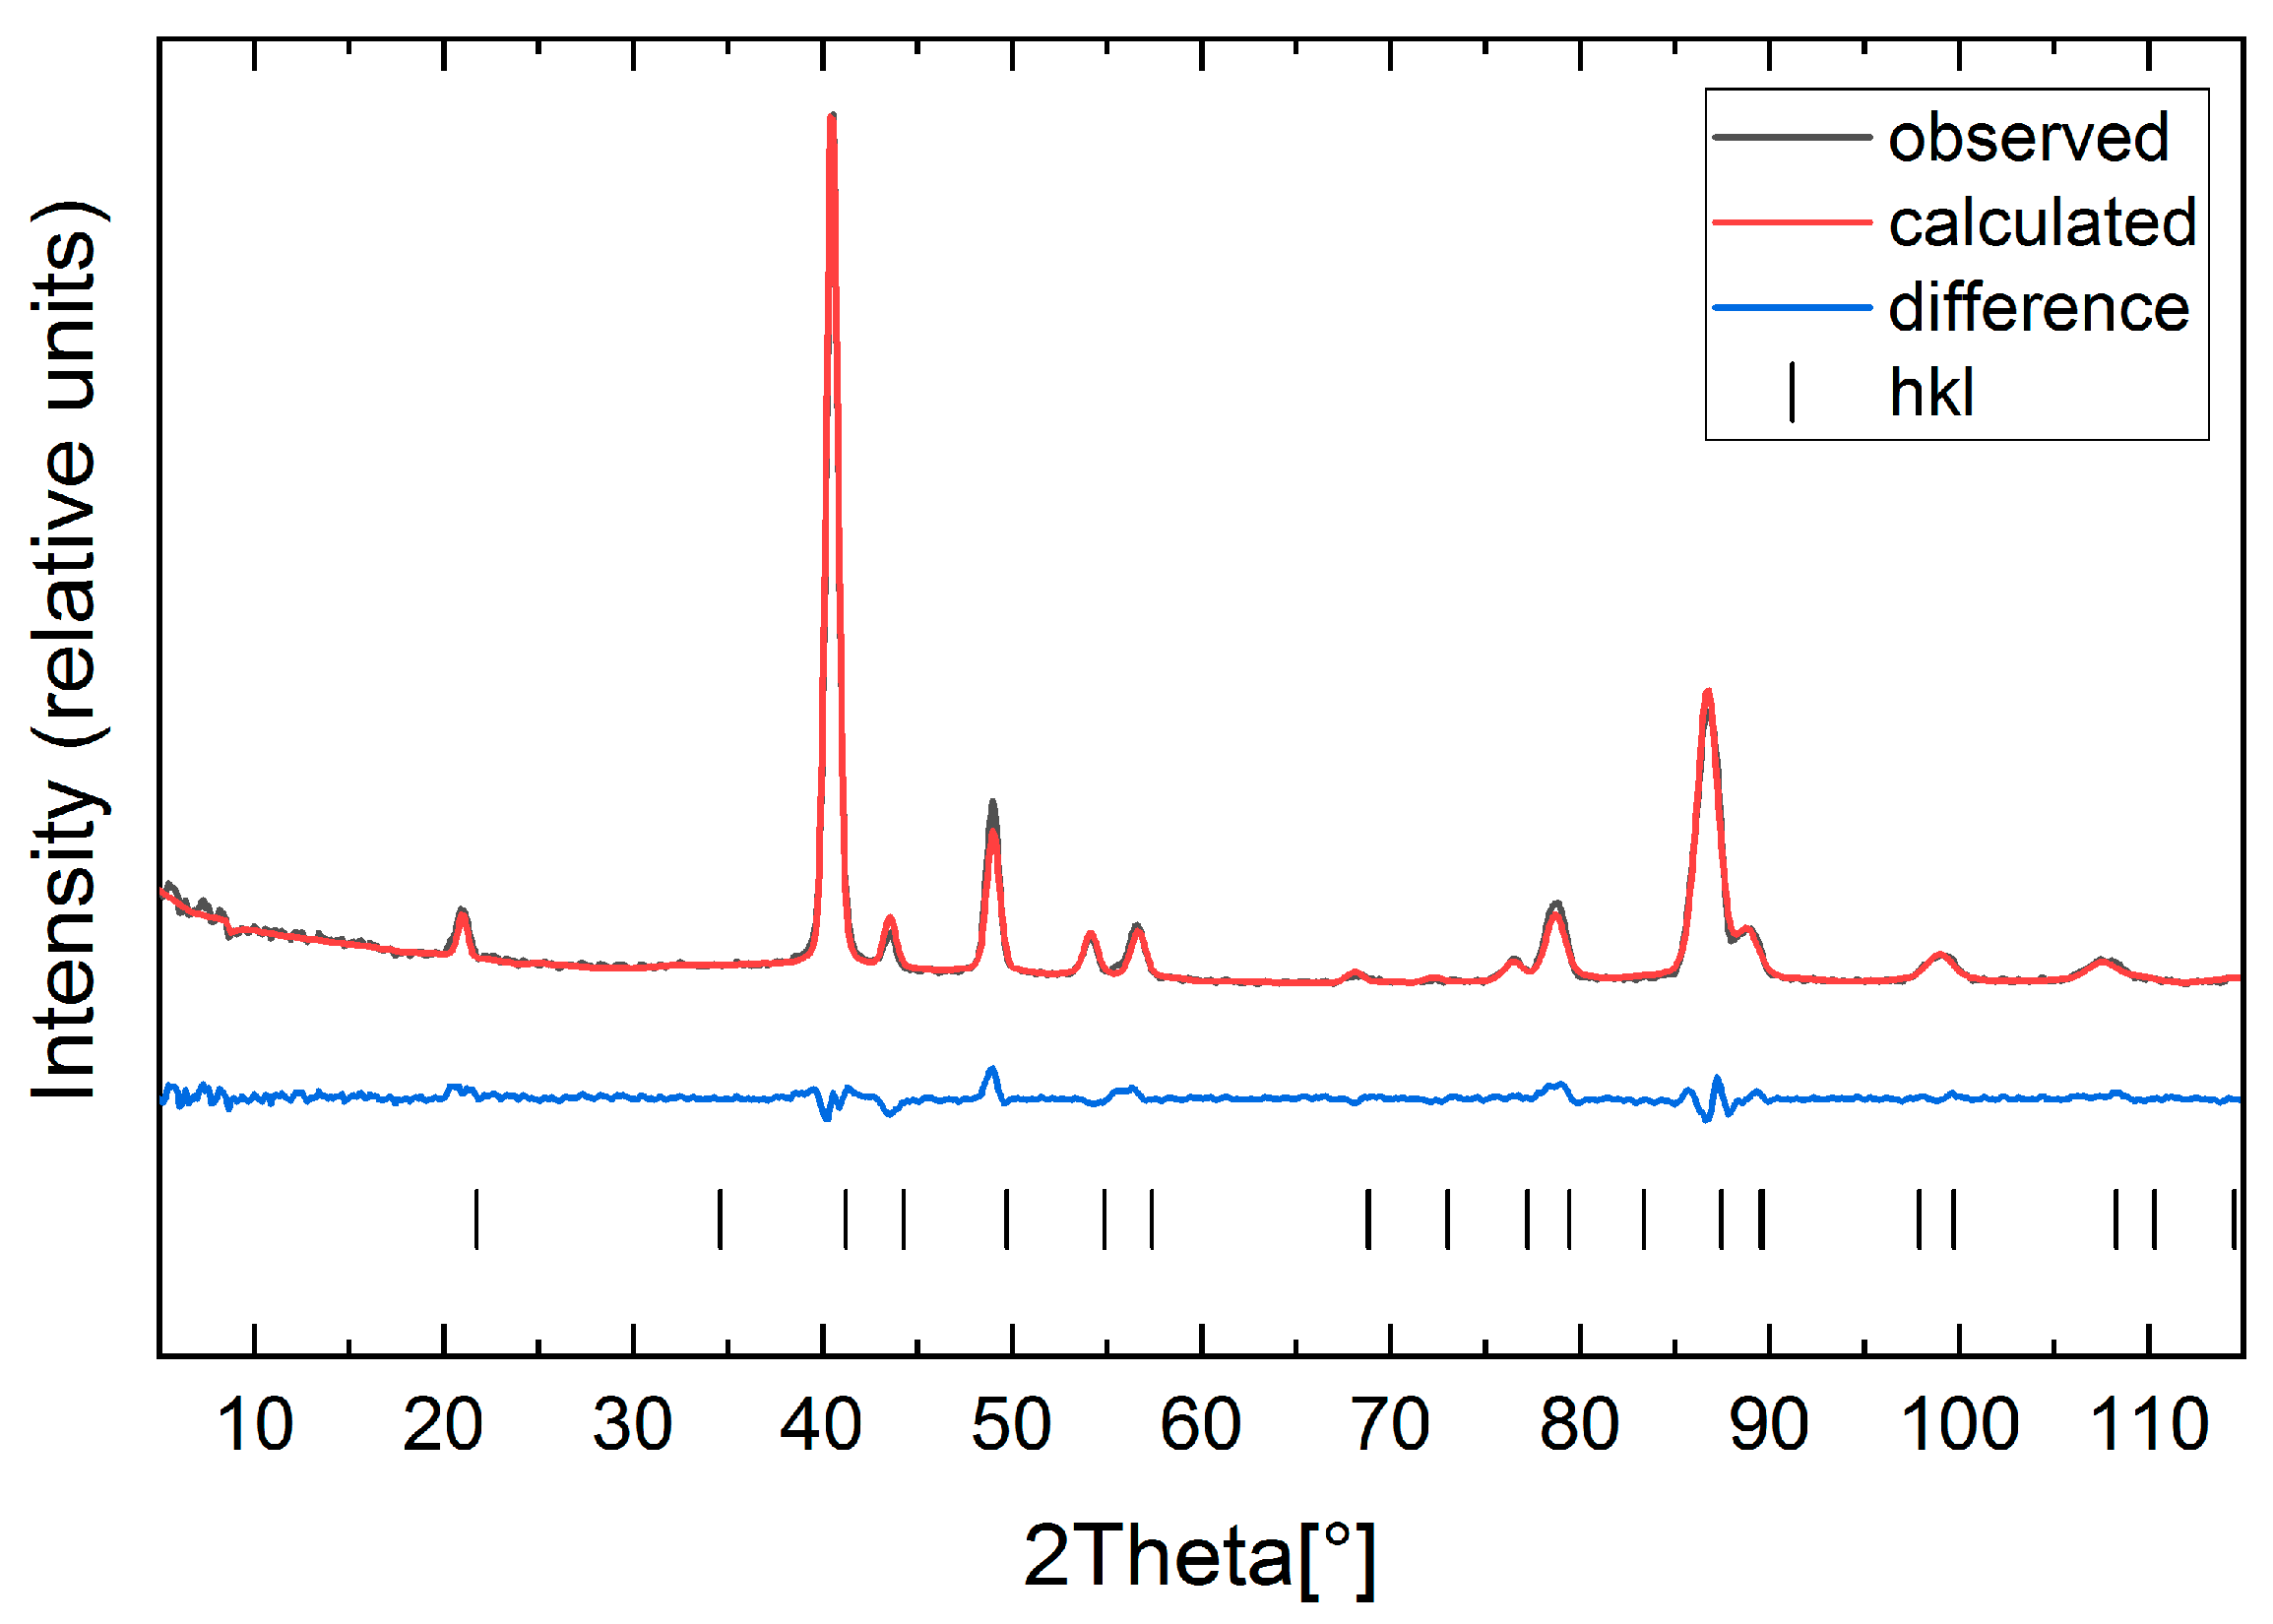
The neutron powder diffractograms measured at 550 K contain only the scattering from the nuclear structure and correspond to the paramagnetic state of the compounds. To check the Co incorporation on both crystallographic sites, equal amounts of Co were distributed on both Mn positions initially. The atomic coordinates and the isotropic thermal displacement parameters of Mn1/Co1 and Mn2/Co2 were restricted to be equal, while the occupancy parameters were refined. The refinements would always show negative values for Co2. This confirms the absence of Co atoms on the Mn2 site for all compounds, which was also claimed by several authors [1,3,6,14]. A refinement of the Co occupancy on the Mn1 site led to the result that the stoichiometric and the refined occupancies agree with each other within one standard deviation (Table S10). The final fit for Mn1.8Co0.2Sb is shown in Figure 3. The refined lattice parameters, unit cell volumes, atomic coordinates, isotropic thermal displacements for Mn1.8Co0.2Sb and Mn1.9Co0.1Sb as well as the final fit for Mn1.9Co0.1Sb are given in the Supplementary Materials (Tables S5–S9, Figures S7 and S11).
In the neutron powder diffractograms measured at 350 K and at RT magnetic scattering contributions from the ferrimagnetic phases are present. The same is true for the Mn1.9Co0.1Sb at 200 K. Ferrimagnetic phases are characterized by an overlap of nuclear and magnetic peaks. As seen in Figure 1, the isofield measurements confirm the presence of a global magnetic moment for Mn1.9Co0.1Sb and Mn1.8Co0.2Sb within this temperature range. From all the Shubnikov groups deduced via irreducible representations of the nuclear space group with Jana2006 [15,16,17], only four of them allow a global magnetic moment: P4/nm’m’, Cm’me’, Pmm’n’ and P2’/n’. In contrast to the other three Shubnikov groups, more than one parameter is needed to describe the magnetic moments of the atoms for the symmetry P2’/n’. In the refinement, strong correlations between these parameters were observed, most probably indicating that the monoclinic symmetry is too low. Therefore, refinements in this magnetic space group were discarded. Magnetic refinements with the remaining Shubnikov groups (P4/nm’m’, Cm’me’, Pmm’n’) were tested to find the best model. Apart from the information obtained from the magnetization measurements, the R-values (Table 2 and Table S11) and the difference curves of the magnetic structure refinements were carefully examined to deduce the correct model. Of the three possible magnetic space groups, only P4/nm’m’ has the magnetic moments aligned parallel to the c axis, which according to the magnetization measurements on the single crystal (Figure 2) corresponds to an arrangement in the FRI-I state. In the Shubnikov groups Cm’me’ and Pmm’n’, the magnetic moments are aligned within the a-b plane. Models in these magnetic space groups could therefore correspond to the FRI-II state described in the literature.
Considering TSF determined from the temperature-dependent magnetization measurements (Figure 1 and Table 1), some further assumptions can be made. Mn1.8Co0.2Sb should be in the FRI-I state (P4/nm’m’) at 350 K, while at RT it should rather correspond either to the Cm’me’ or Pmm’n’ symmetries. For Mn1.9Co0.1Sb, the determined spin flip transition is between 275 and 280 K. According to this, the 350 K and RT measurements should correspond to the FRI-I state. In this case, P4/nm’m’ is the only choice of a Shubnikov group. At 200 K, below the TSF, Cm’me’ or Pmm’n’ would be the better choices for the magnetic space group.
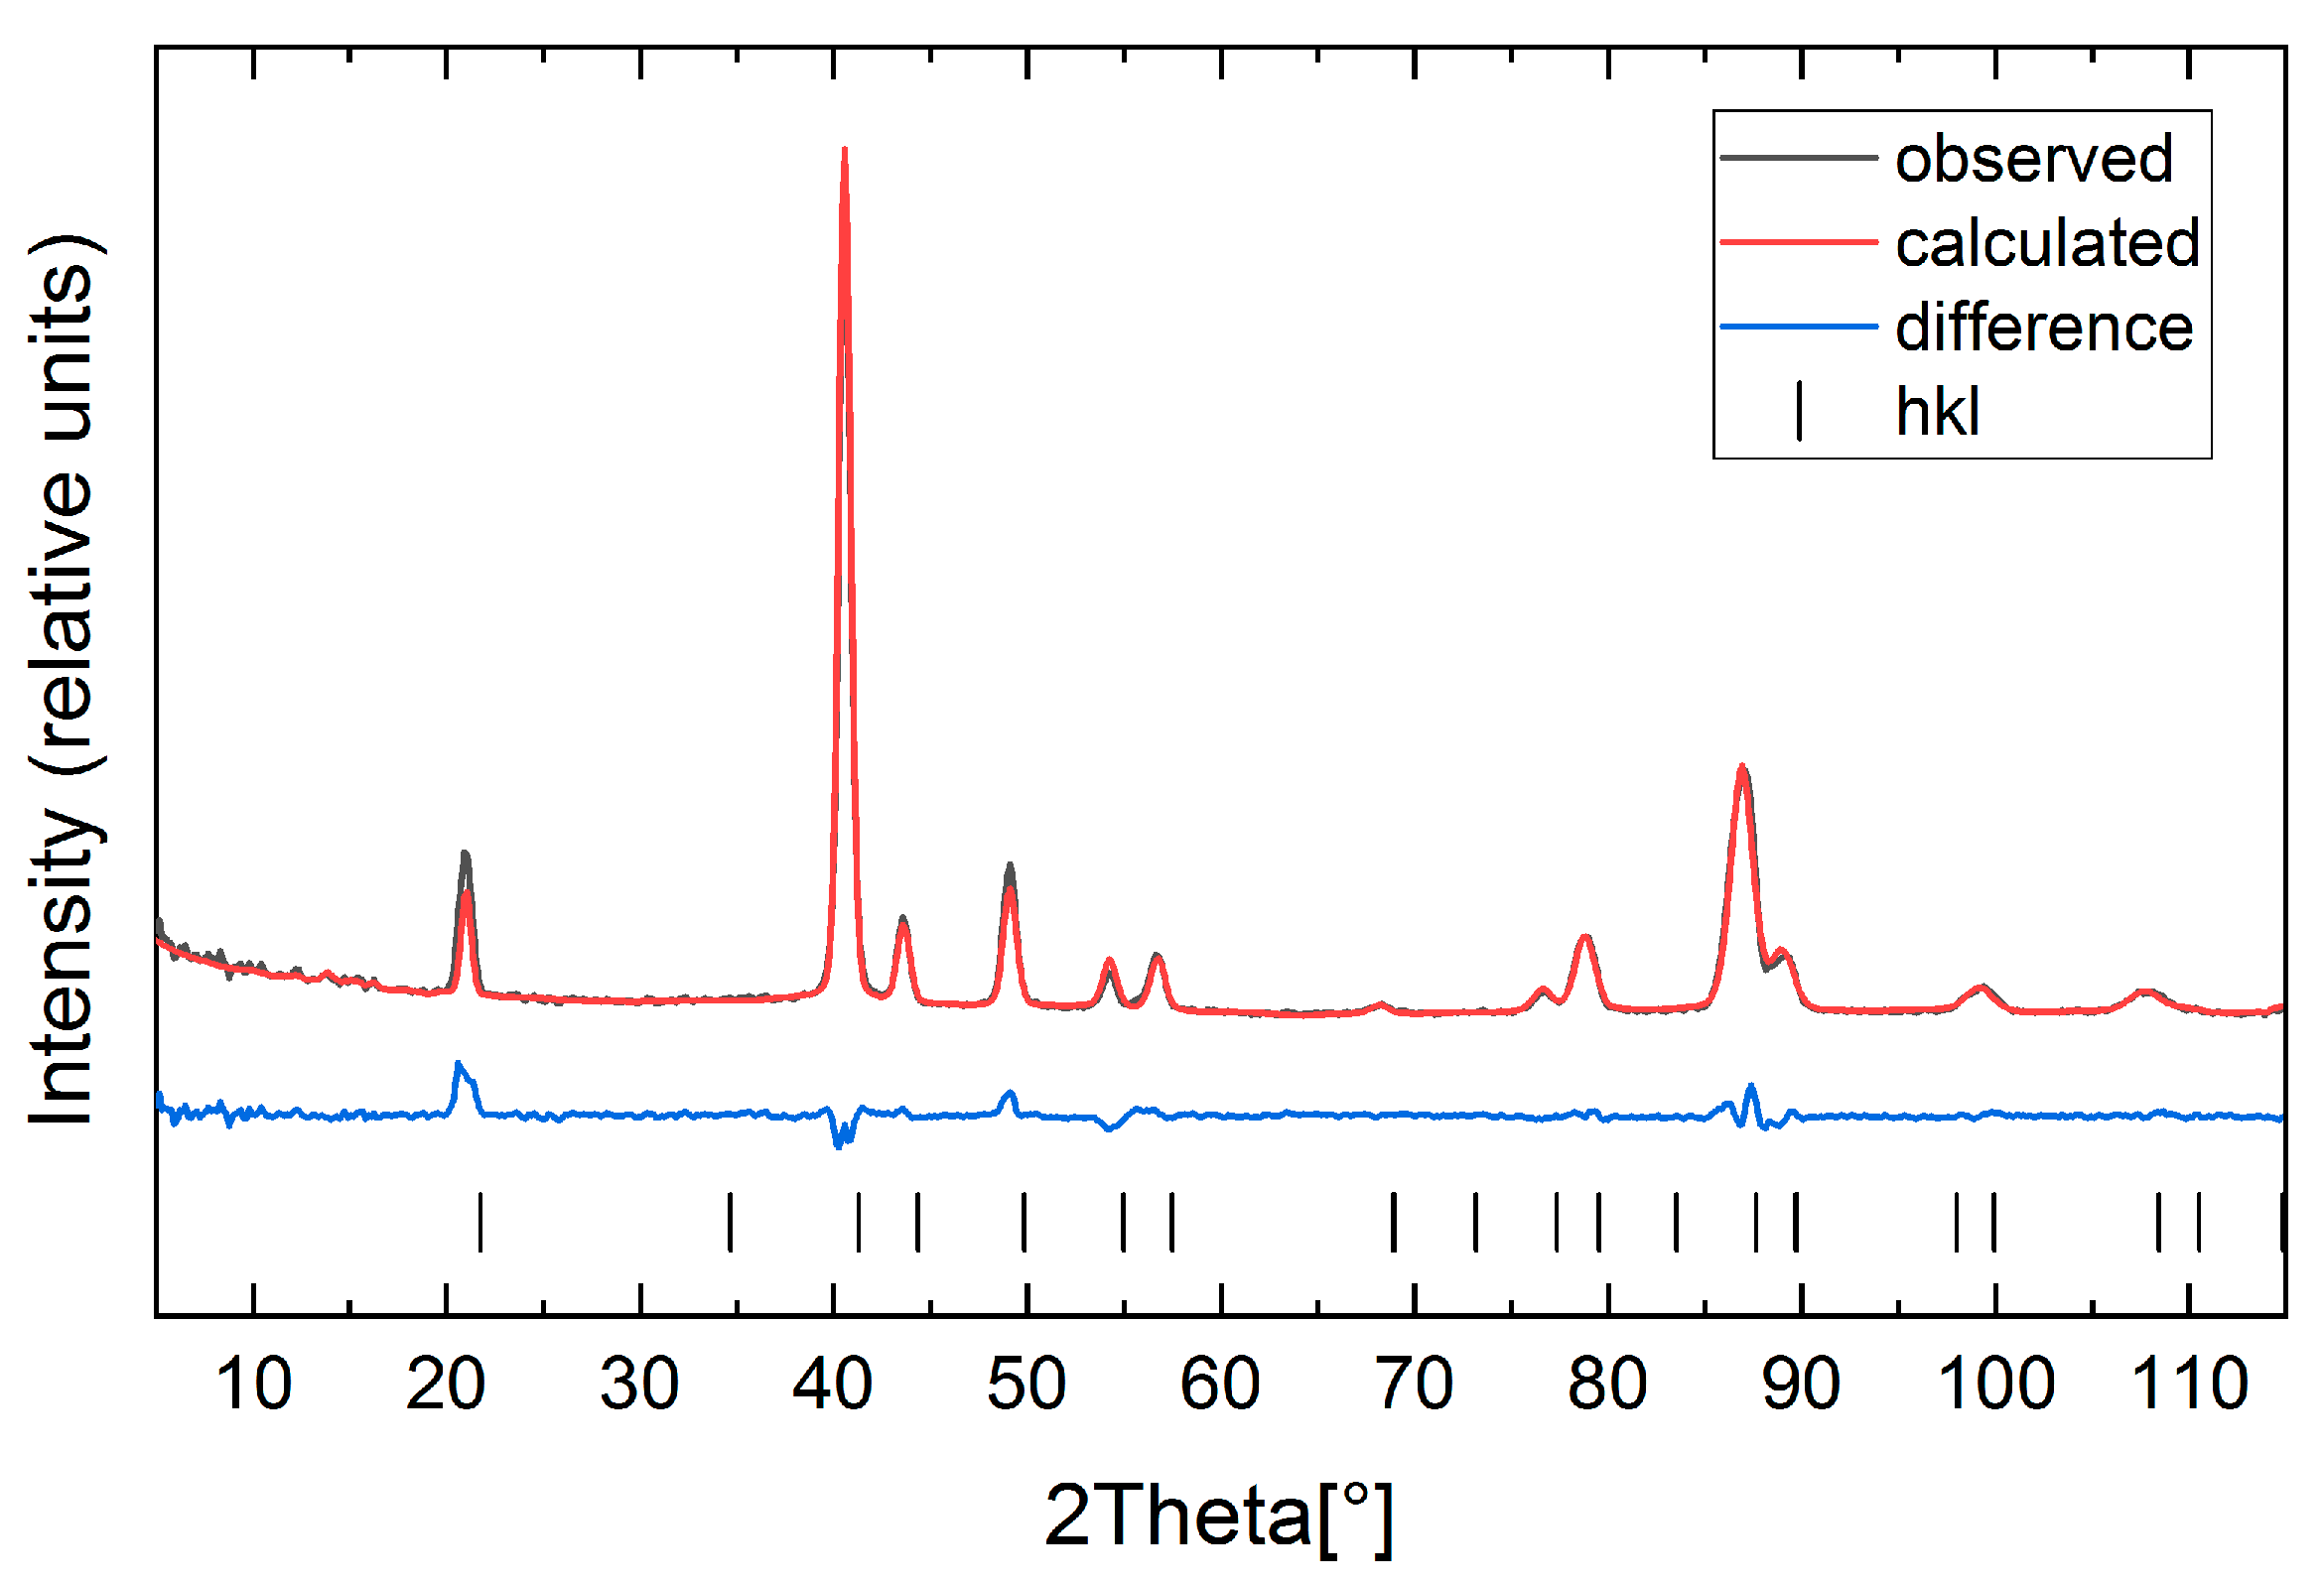
The magnetic structure refinements of the Mn1.8Co0.2Sb diffractograms at 350 K and RT are shown in Figure 4 and Figure 5, respectively. The magnetic structure refinements of the Mn1.9Co0.1Sb diffractograms at 350 K, RT, and 200 K are provided in the Appendix (Figures S8–S10).
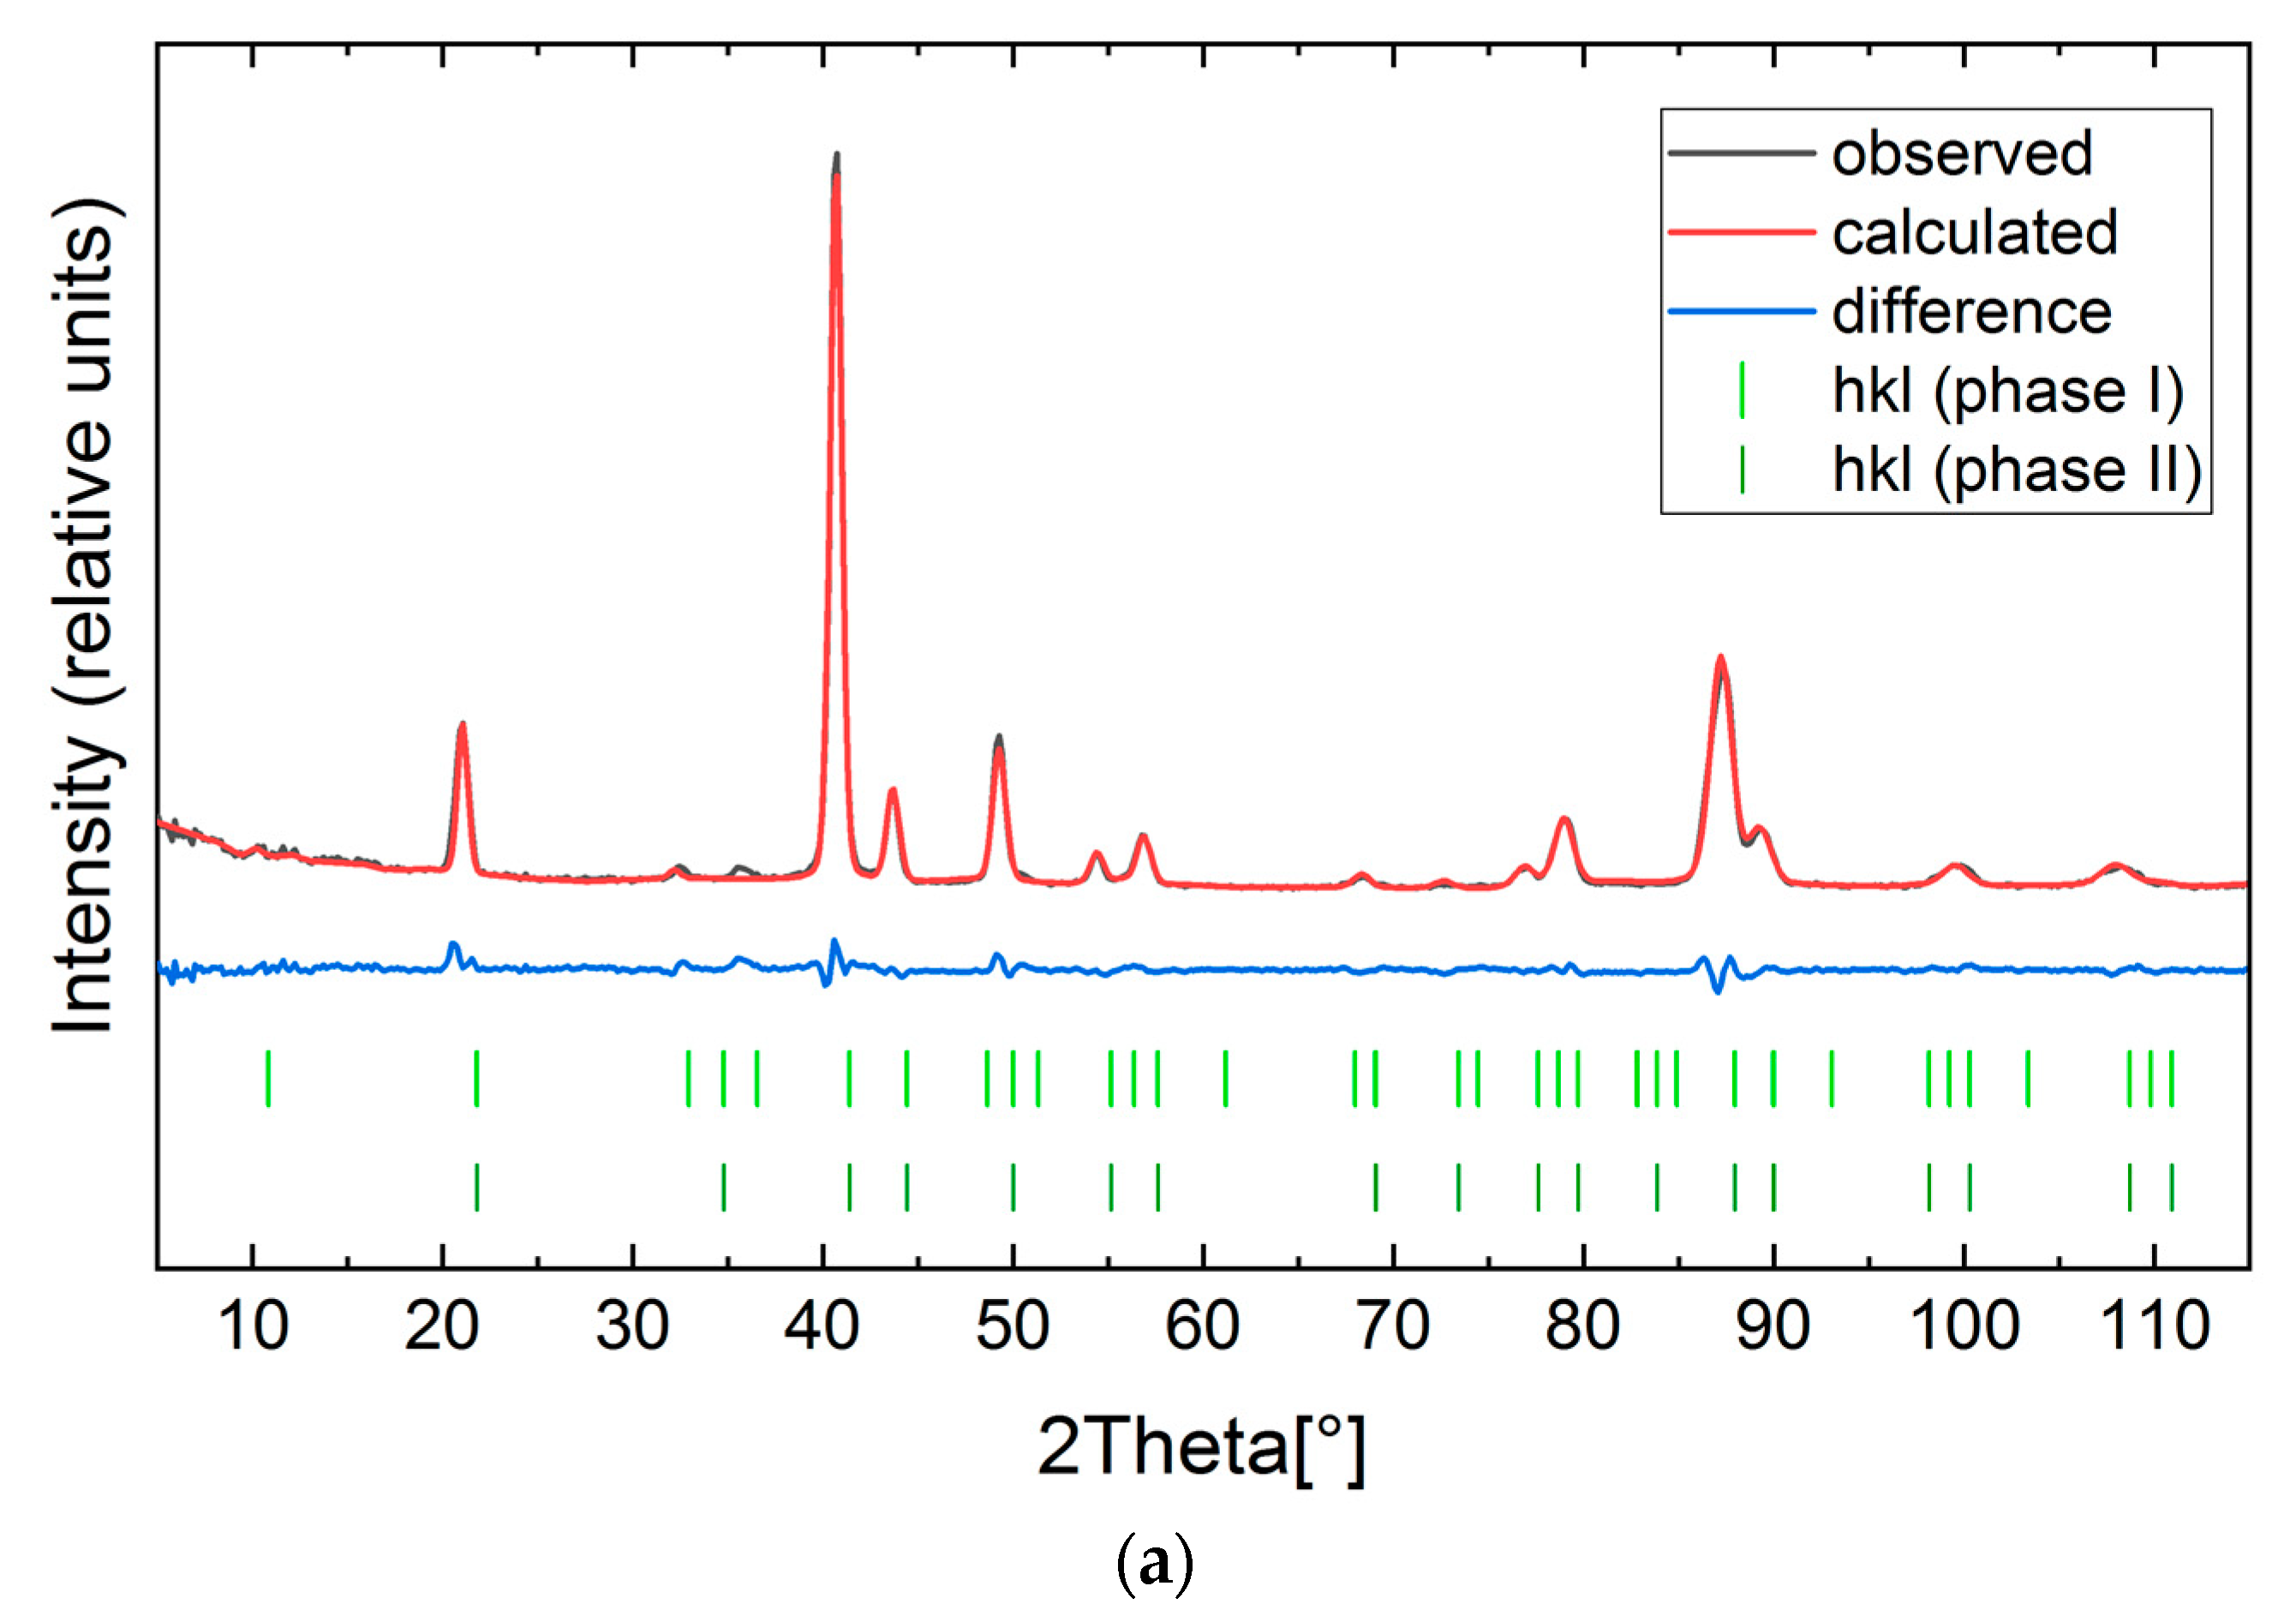
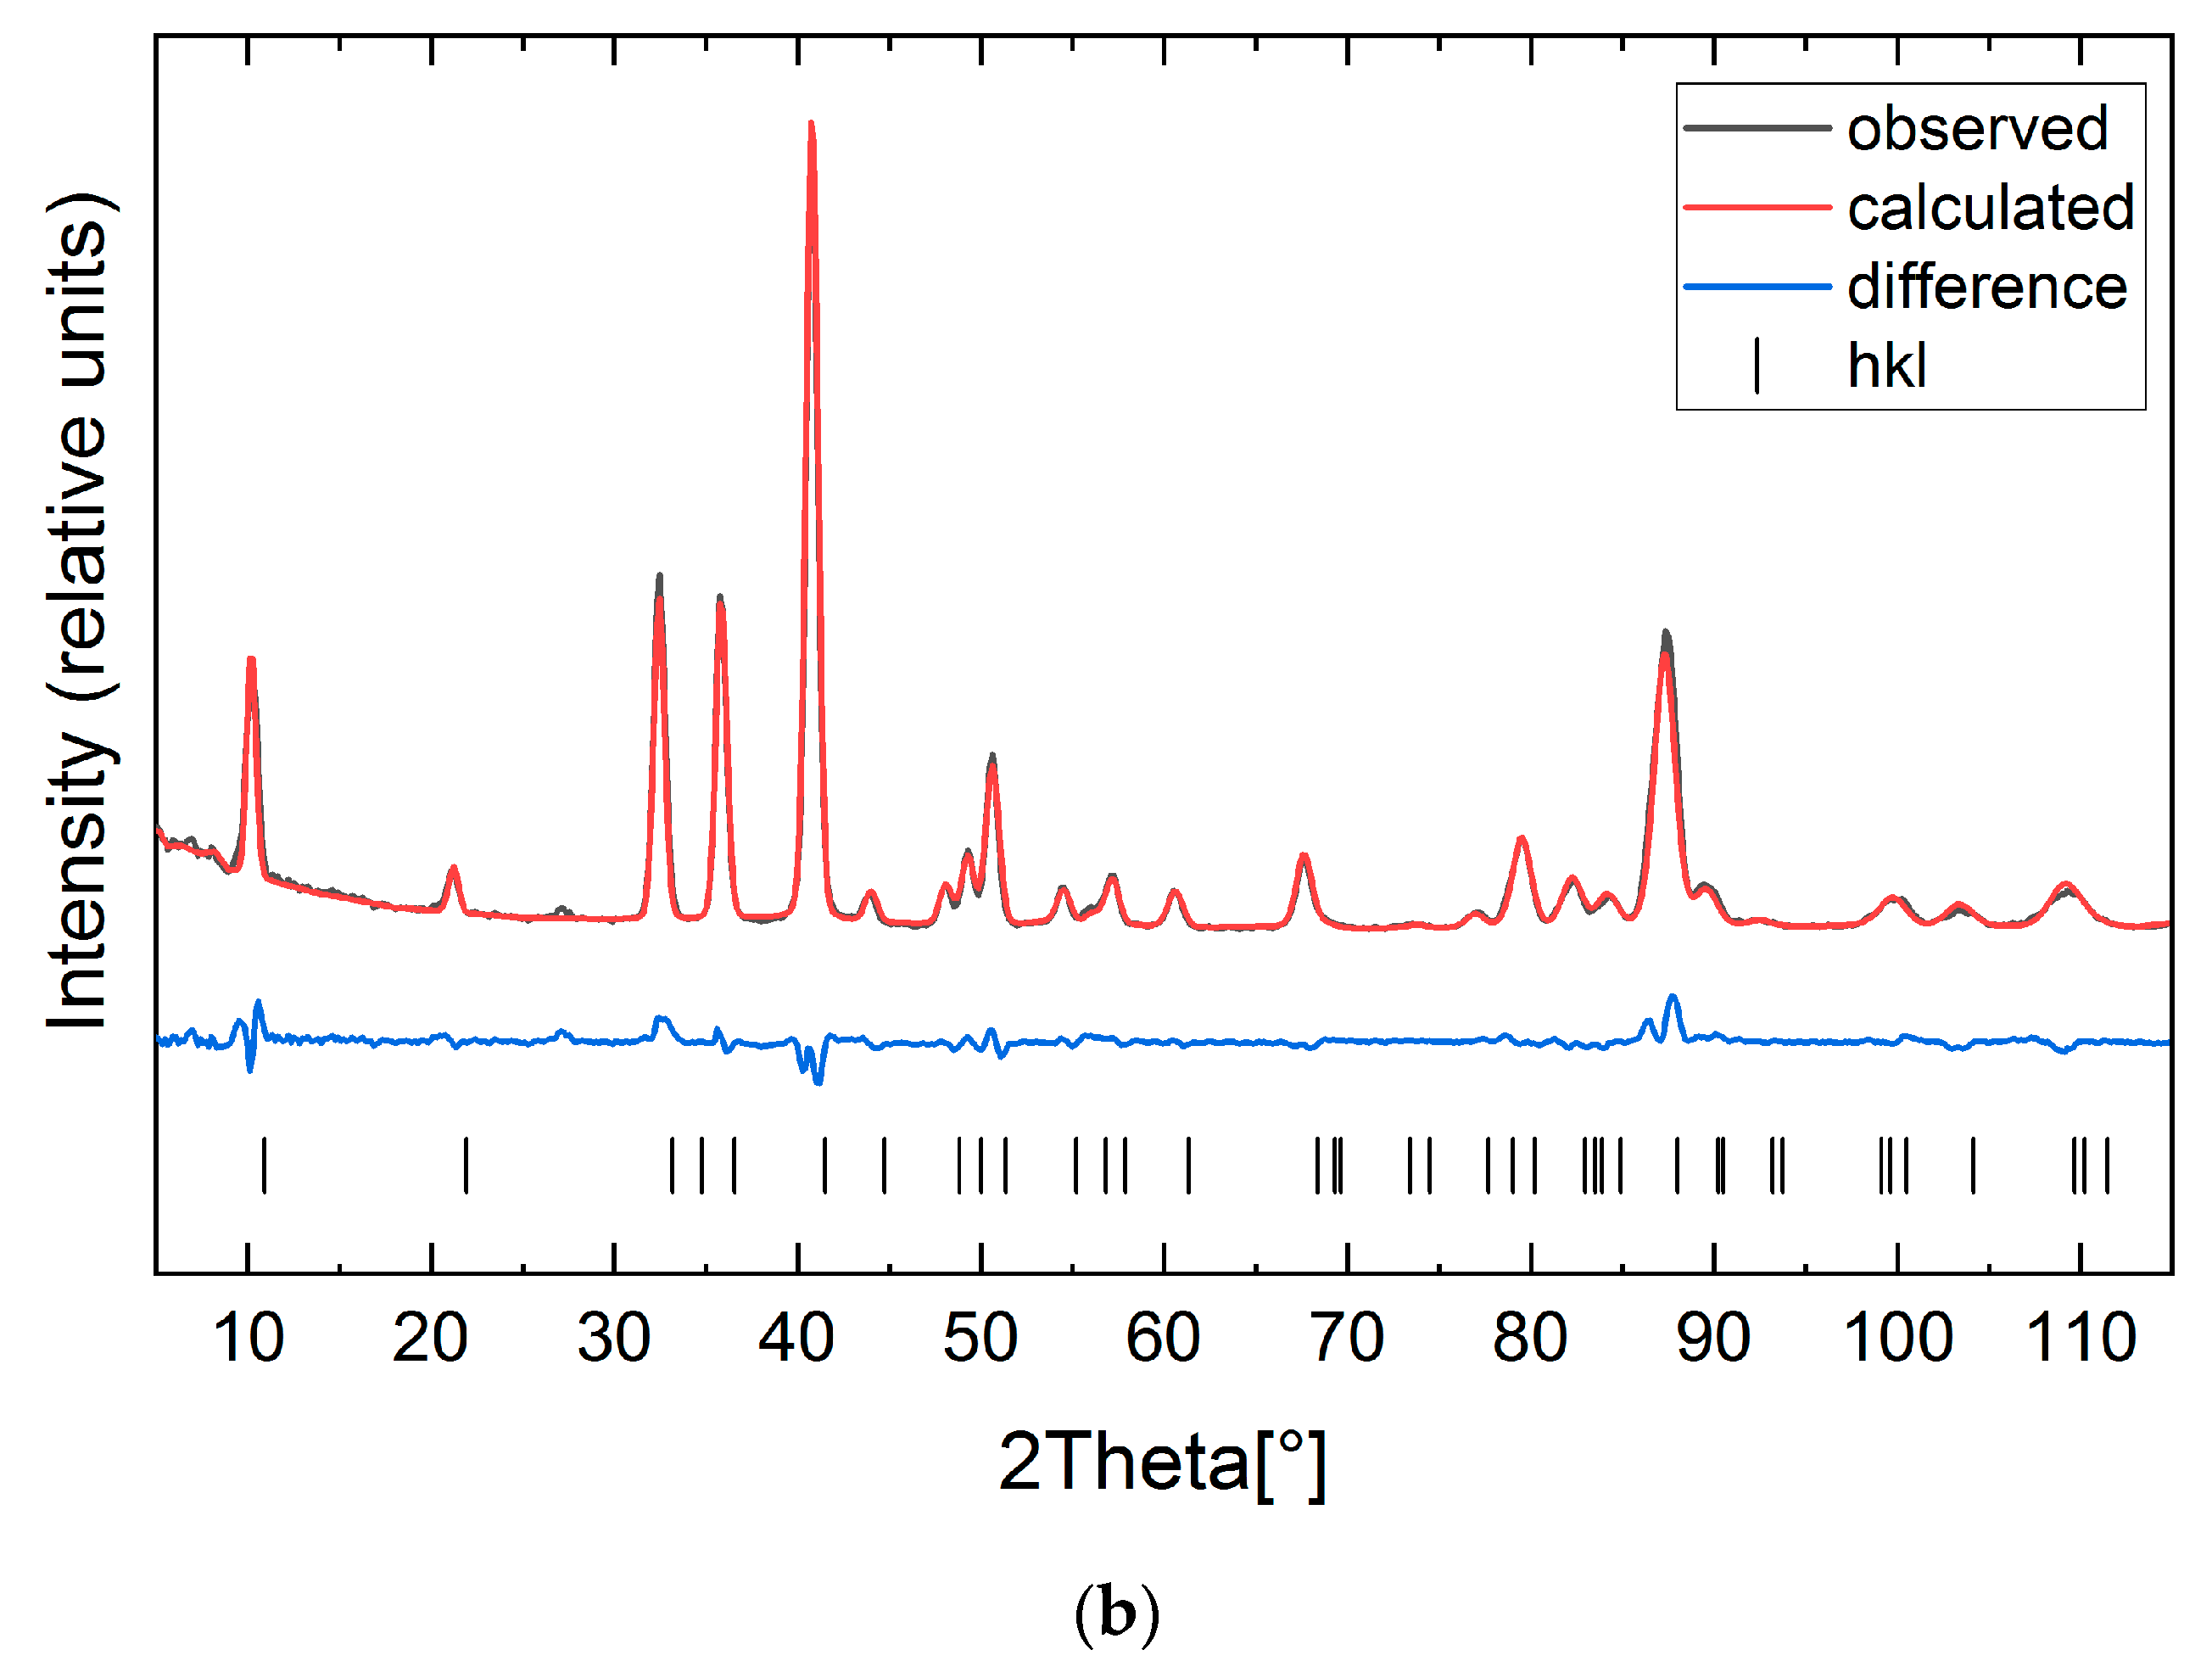
Additional peaks are clearly visible for Mn1.8Co0.2Sb at 200 K and 50 K (Figure 6a,b), as well as for Mn1.9Co0.1Sb at 50 K. Apart from this, the diffractograms show a reduced intensity of several low-θ Bragg peaks. These observations point to the existence of AFM structures. The additional reflections can be indexed assuming a doubling of the c lattice parameter [12]. Consequently, a propagation vector (0 0 ½) was introduced into the magnetic structure refinement, as proposed by [9]. All possible resulting magnetic symmetries are characterized by a global magnetic moment of 0, confirming the antiferromagnetic nature of the order. For Mn1.8Co0.2Sb at 200 and 50 K, only two magnetic models (C[c]mce and P[c]mcn), are plausible, as they are the only ones indexing all additional peaks in the diffraction patterns. In the first one, the magnetic moments lie within the a-b plane, in the second one the moments lie parallel to the a direction.
For the data at 50 K of Mn1.8Co0.2Sb the magnetic peaks show high intensities and the determination of the magnetic structure was straightforward, as the model in P[c]mcn leads to better agreement factors (Table 3) then the one in C[c]mce. However, in the 200 K diffractogram, the magnetic reflections have very low intensities and it became clear that none of the two magnetic models (C[c]mce and P[c]mcn) resulted in a satisfactory fit. As the intensities of the magnetic peaks associated with the antiferromagnetic ordering are very low, we assumed a co-existence of the FRI-II phase with the AFM phase. Metastable frozen FRI-II phases at low temperatures due to kinetic arrest were also reported by [8,13]. A refinement considering both phases led indeed to an acceptable fit. In the refinement the profile parameters, the a lattice parameter and the isotropic thermal displacement parameters of both phases, were restricted to be equal. The c lattice parameter of the FRI-II phase was set to be ½ c of the AFM phase and the z-coordinates of the Mn2 and Sb1 in the AFM phase were restricted to be 2z of the corresponding atoms in the FRI-II phase. This way, only three additional parameters (Mx0 of Mn1/Co1, Mx0 of Mn2 and the volume fraction of phase 2) were introduced when compared to a one-phase refinement of the antiferromagnetic phase alone. The refined volume fractions clearly show that the ferrimagnetic phase is still dominating in the sample (VAFM/VFRI = 0.18/0.82). This model is in good agreement with the residual magnetization observed in the temperature-dependent magnetization measurements of the polycrystalline samples (Figure 1).
The additional magnetic reflections in Mn1.9Co0.1Sb at 50 K are also weak and we used a similar two-phase refinement model, as already described for Mn1.8Co0.2Sb at 200 K, assuming a co-existence of an FRI-II and AFM phase (Figure S11). The ferrimagnetic phase is clearly dominating (VAFM/VFRI = 0.21/0.79) and the result is in very good agreement with both observations from the macroscopic magnetization measurements (Figure 1). Yet, it should be noted that the diffractograms for Mn1.9Co0.1Sb and Mn1.8Co0.2Sb measured at 50 K show a peak at about 2θ~27°, that is not indexed with the chosen model. The presence of possible impurities MnSb, Co, Mn, or Sb was checked, but none of these phases explains this reflection.
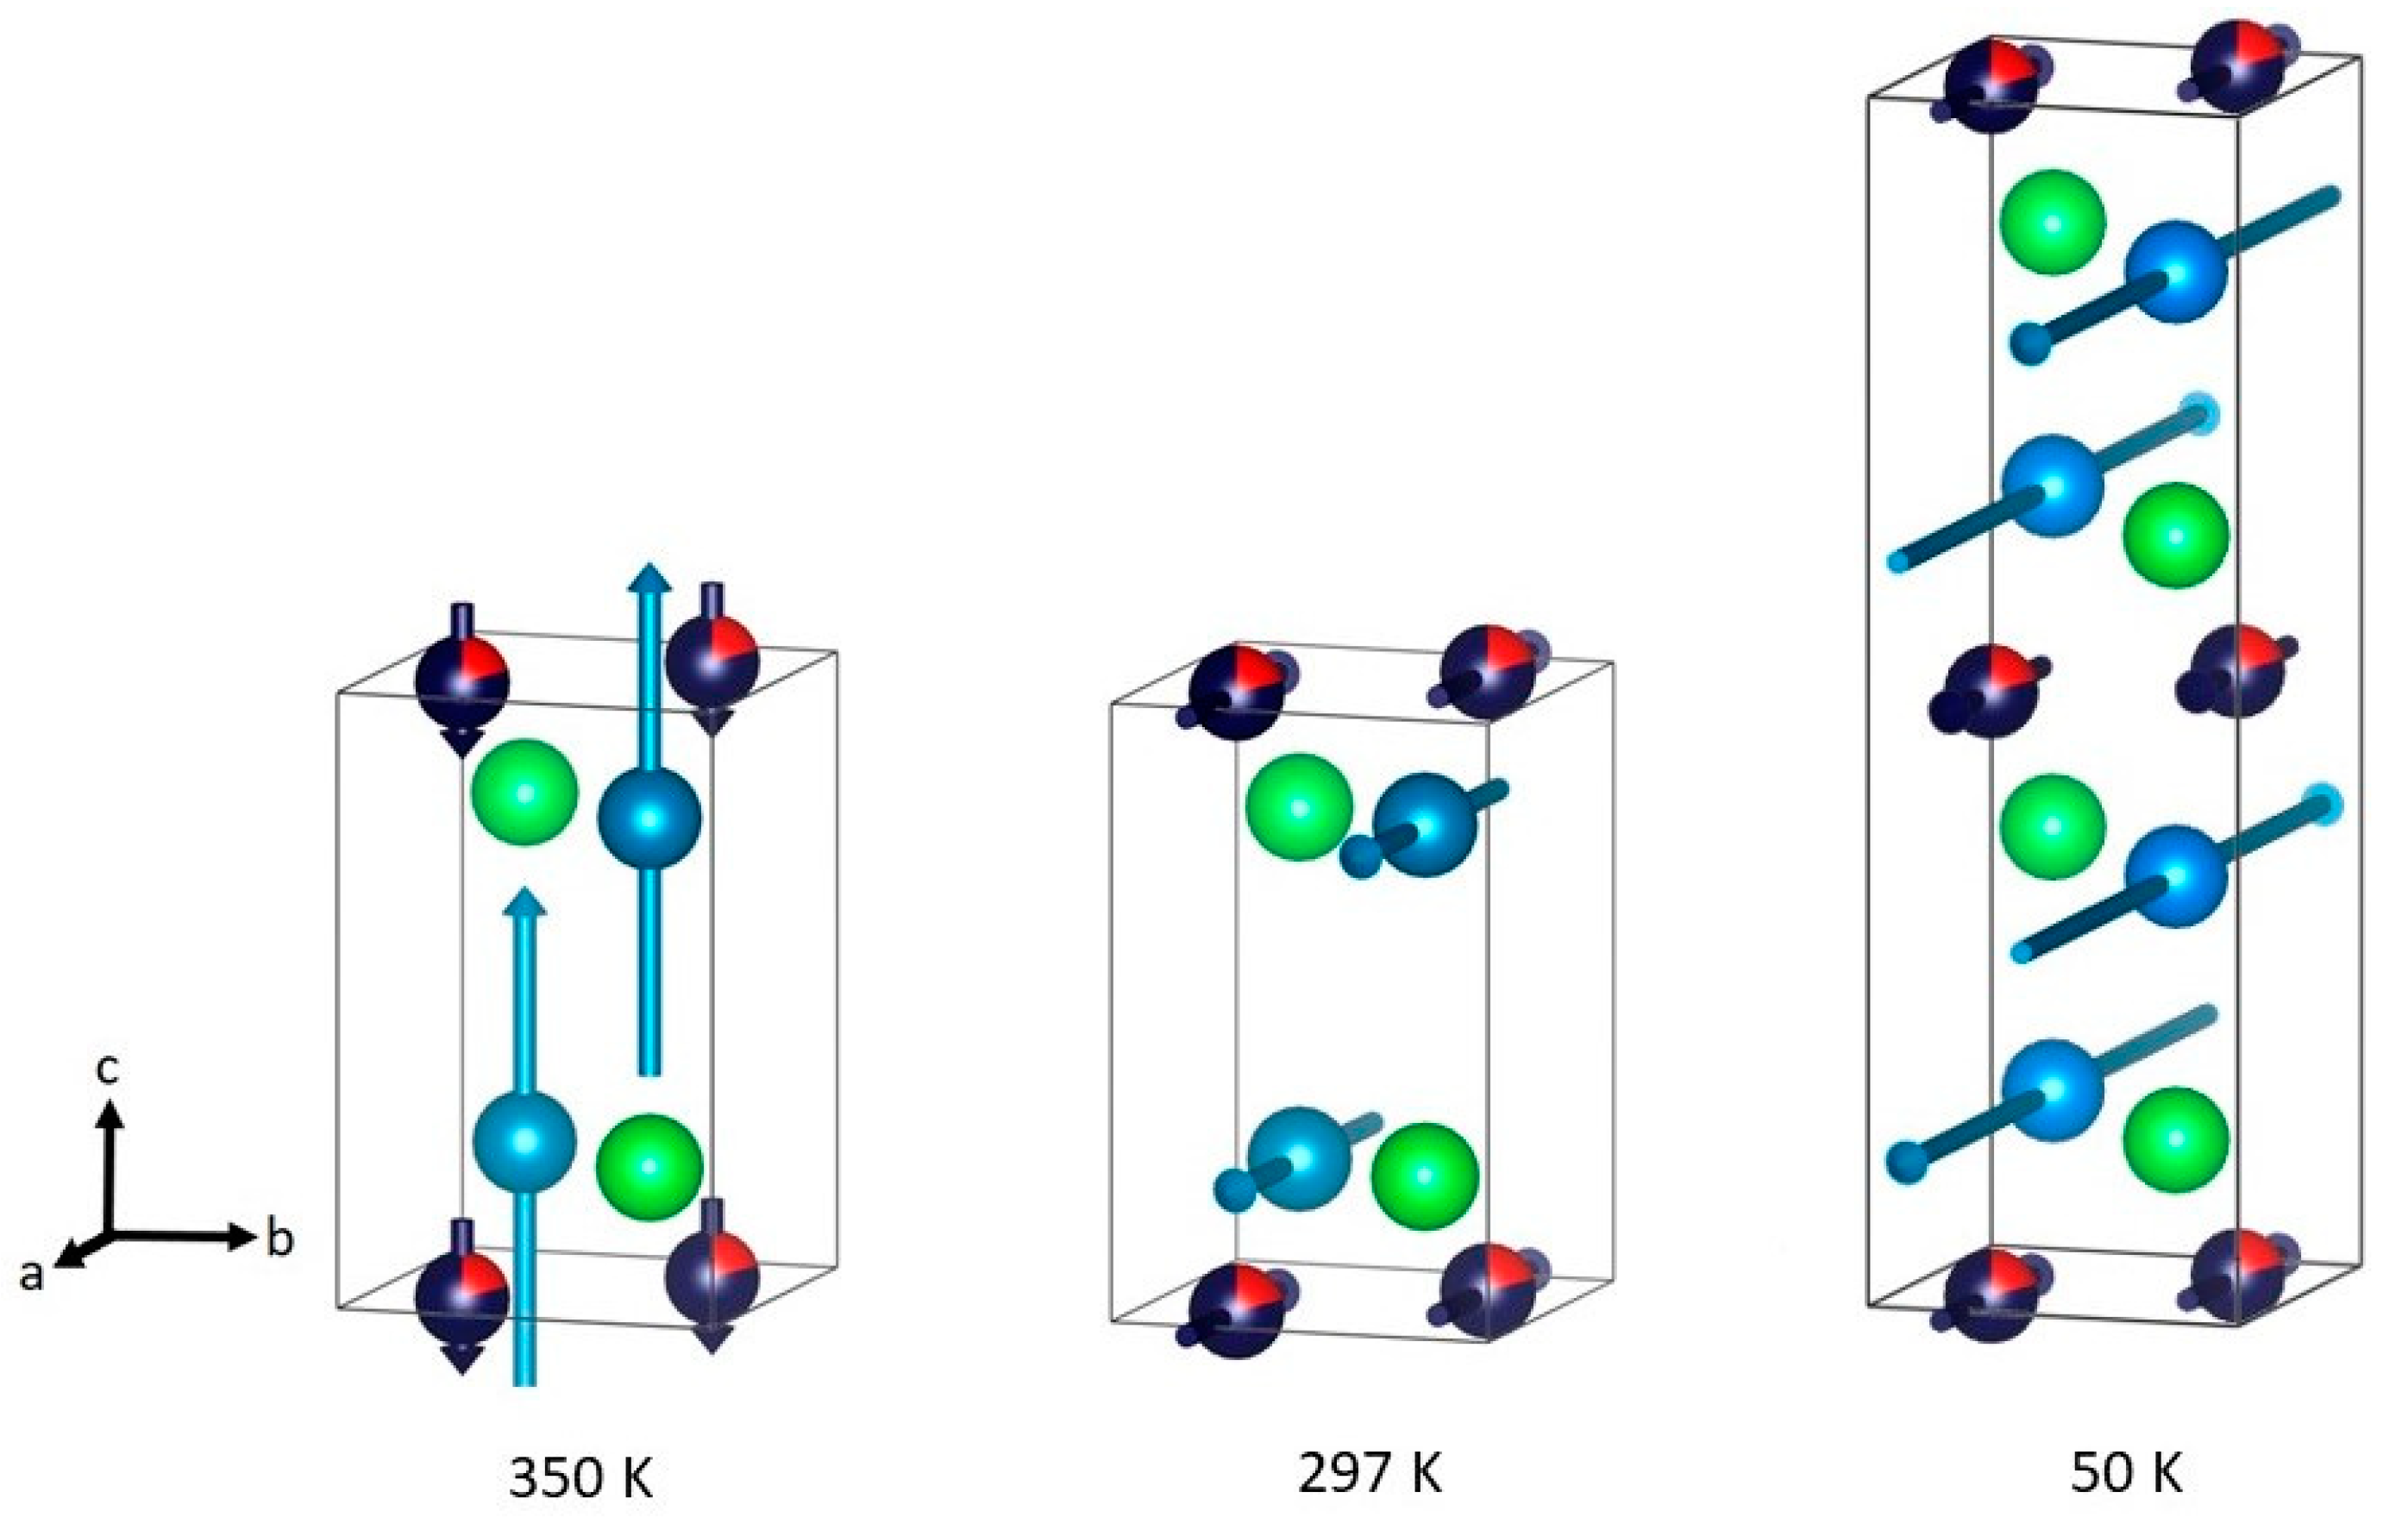
Table 3 shows the refined magnetic moments on the Mn1 and Mn2 sites at all measured temperatures. The moments are visualized in Figure 7. The magnetic moments always point into opposite directions [3,13] in all magnetic states. Only in the FRI-I state (P4/nm’m’) the spins are aligned parallel to the c axis, in the remaining states the spins are parallel to the a axis (Figure 7).
The macroscopic measurements show similar residual magnetizations for Mn1.9Co0.1Sb at 50 K and for Mn1.8Co0.2Sb at 200 K (Figure 1), which correspond to about 2.25–2.5 Am2/kg. This is in full accordance with the assumption that at these temperatures the FRI-II phase co-exists with the AFM phase for both compounds. The drop of magnetization for Mn1.8Co0.2Sb is pronounced at Tt, which agrees with the observation from the neutron powder diffraction studies at 50 K. Here, only the AFM phase is observed. The very small remaining net residual magnetization below Tt for this compound might be related to a very small amount of impurity. A hint for the occurrence of these impurities might be the unindexed peak at 2θ~27°, which is visible in the diffractograms of both compounds at 50 K. However, the exact origin of this peak remains unclear as it cannot be attributed to any of the likely impurity phases (Co, Mn, and Sb or any of the corresponding binary phases).
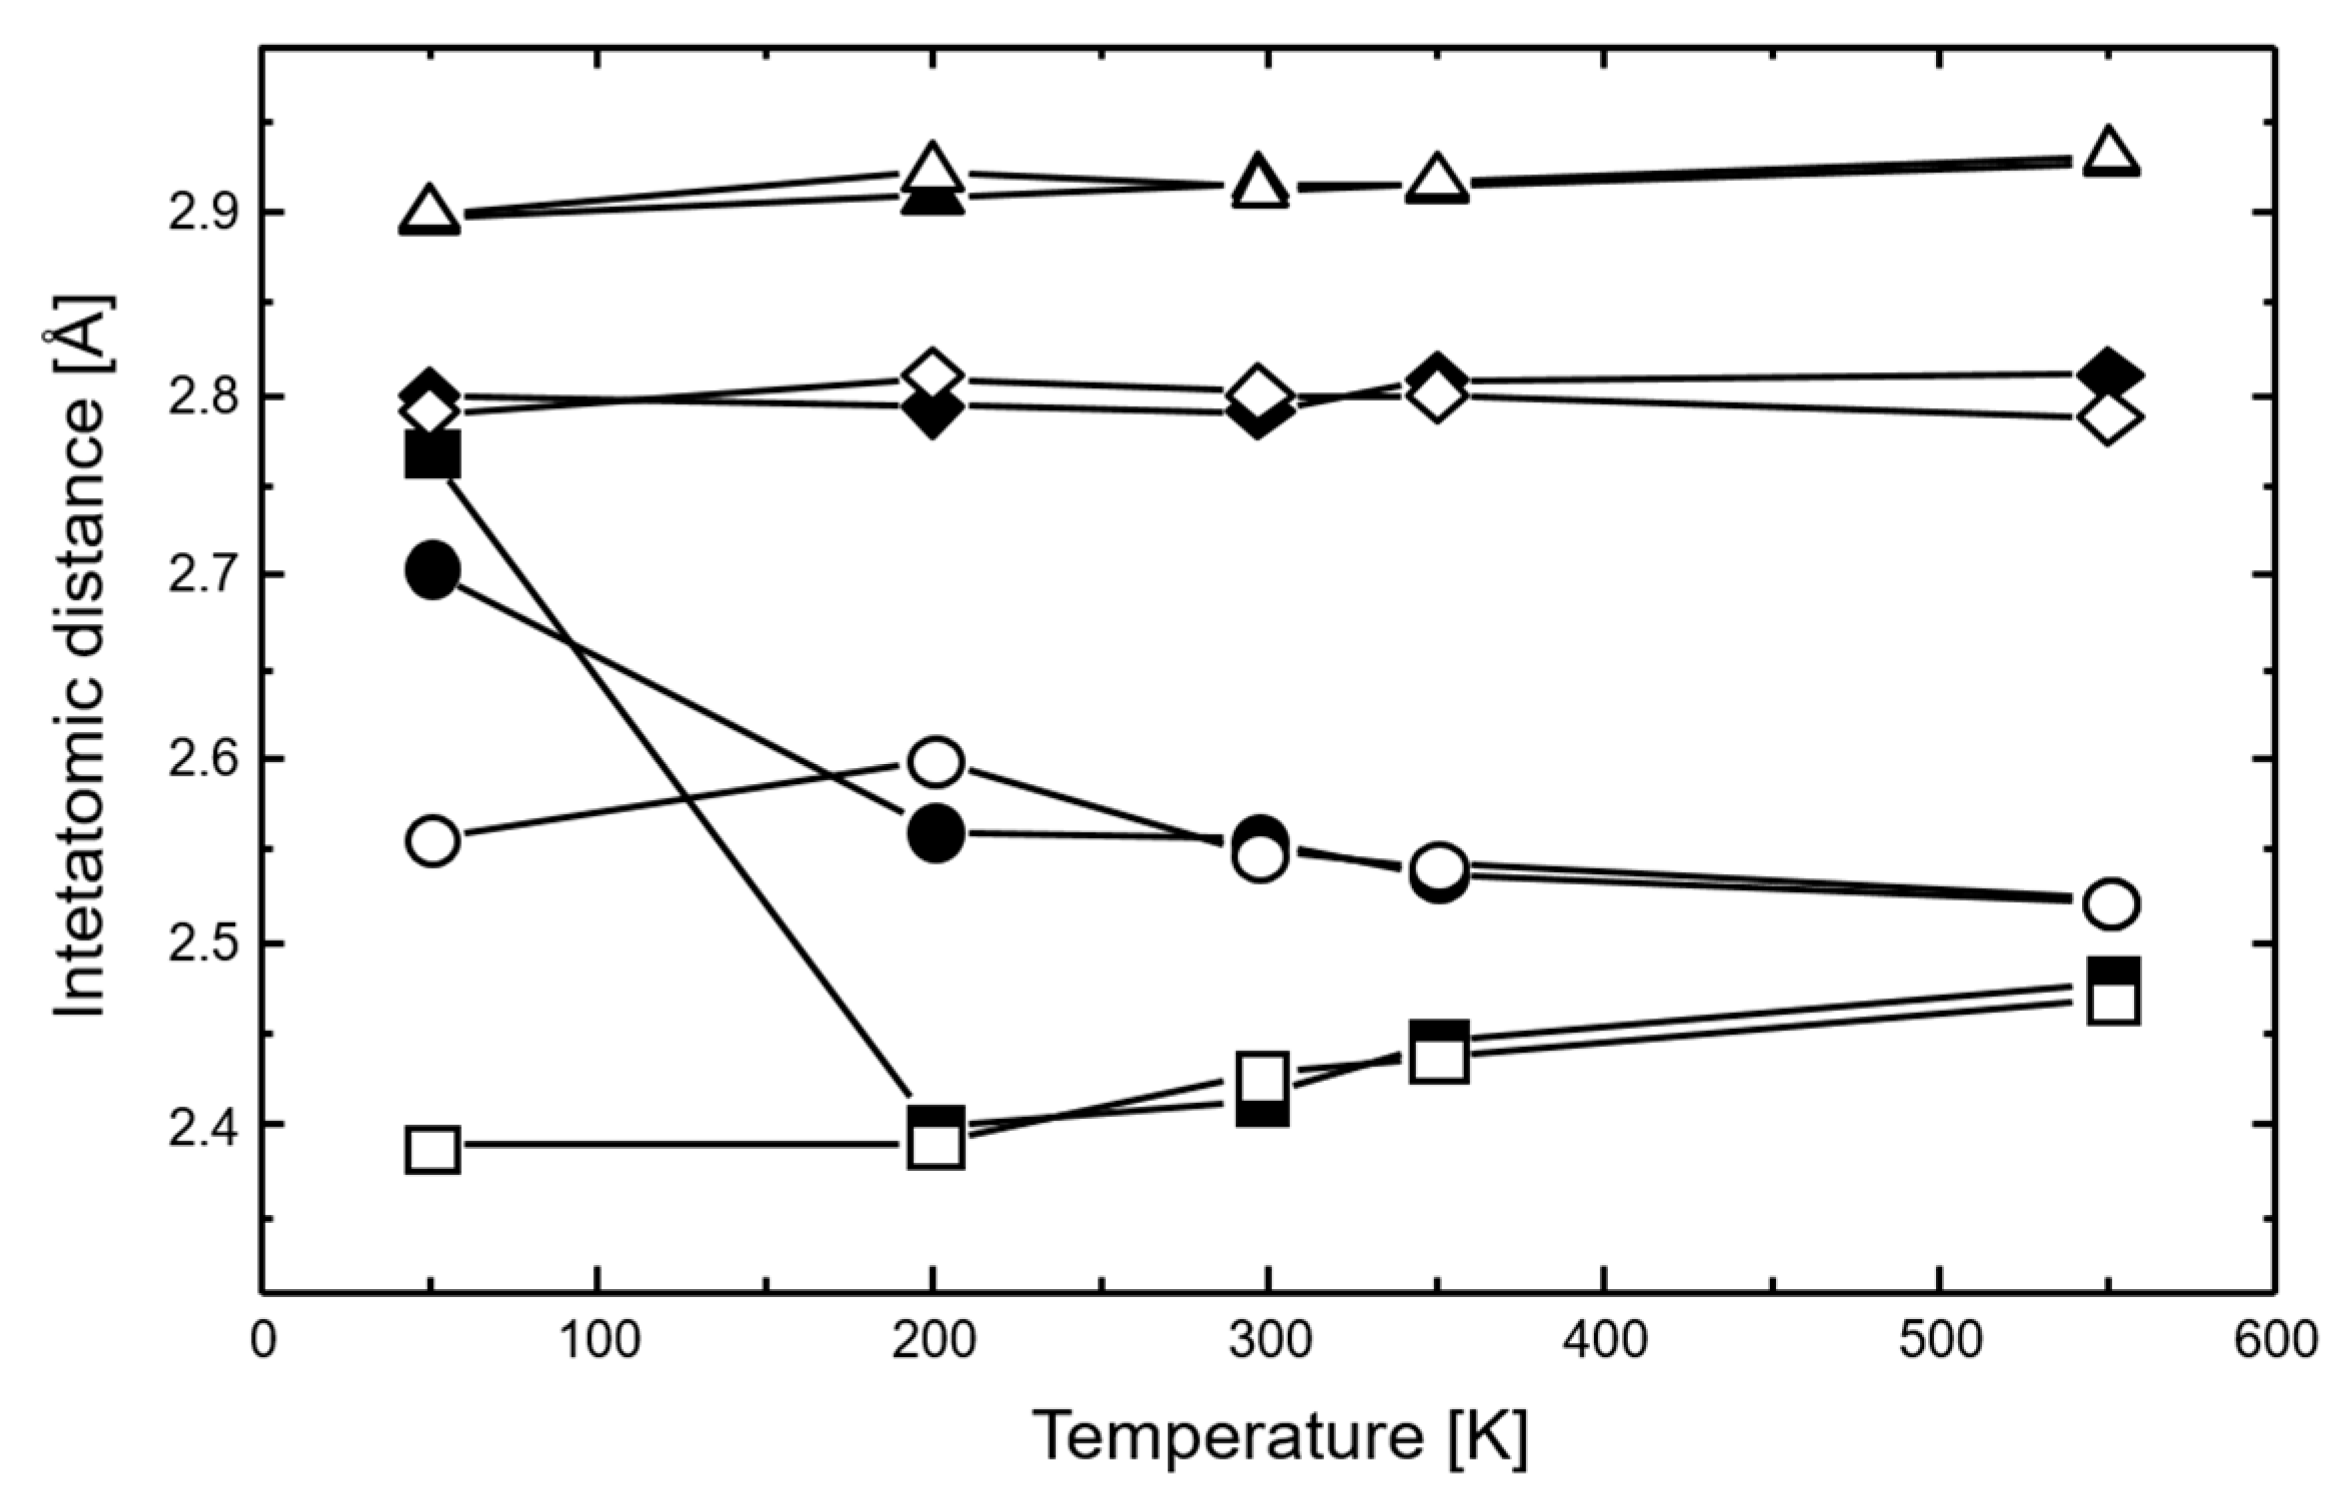
The interatomic distances of Mn1.9Co0.1Sb and Mn1.8Co0.2Sb resulting from the refinements are plotted against the temperature in Figure 8. The distances Mn1/Co1–Sb and Mn1/Co1–Mn2 increase abruptly between 200 K and 50 K, where the magnetic phase transition from the FRI into the AFM state occurs. For the remaining interatomic distances, no significant changes are observed.
3. Materials and Methods
Samples with the compositions Mn2−xCoxSb (x = 0.1, 0.15, 0.2) were synthesized by cold crucible induction melting [18]. The elements Mn (99.99%), Co (99.9%), and Sb (99.99%) were mixed in stoichiometric proportions, respectively. To avoid oxidation, the synthesis was performed under the Ar atmosphere. Five melting cycles were performed to guarantee a sufficient homogenization of the samples. After each melting cycle, the solidified alloy was turned upside-down. Since contaminations (e.g., oxides) accumulate on the surface, the upper layers of the synthesized samples were removed with abrasive paper. The alloy pieces were crushed and ground to a particle size of a few µm for x-ray and neutron powder diffraction.
A single crystal of Mn1.9Co0.1Sb was grown from the polycrystalline material using the Czochralski method in an aluminum oxide crucible with a tungsten crystal as a seed. A single crystalline piece of the obtained crystal was oriented with the Laue method and cut by spark erosion to yield a suitable sample for direction-dependent magnetization measurements.
Chemical analysis was performed using the ICP-OES (Inductively Coupled Plasma Optical Emission Spectrometer) [19] technique to confirm the stoichiometry of the samples. For the analysis, two weighted samples (50 mg) of each composition were dissolved in 3 mL HCl and 1 mL H2O2. To determine the Mn, Co, and Sb contents, two aliquots of the parent solution were diluted by 1/100. In addition, two aliquots of the parent solution were diluted by 1/10 for an analysis of possible contamination with other elements (Al, B, Ba, Ca, Cr, Cu, Fe, Hf, K, La, Li, Mg, Mo, Na, Ni, P, S, Si, Sr, Ti, V, Y, Zn, Zr).
X-ray powder diffraction (λ = Cu Kα1,2) was performed at RT on a X’Pert Pro diffractometer (Malvern Panalytical, Almelo, Netherlands) with the samples placed in flat Al sample holders. Neutron powder diffraction was carried out on the E6 Focusing Powder Diffractometer (λ = 2.447 Å) at the Helmholtz-Zentrum (Berlin, Germany). This wavelength is not the most adequate one for crystal structure refinements but it is suitable for the determination of magnetic structures. All samples were placed in V sample holders in the temperature range of 50 to 550 K using a cryo-furnace. For each composition, refinable diffractograms were collected at five temperatures (50 K, 200 K, RT, 350 K and 550 K). As [13] claimed metastability to occur during the FRI to AFM phase transition, the cooling rate was reduced (<1 K/min) below 200 K to avoid the metastable frozen FRI state at low temperatures.
All nuclear and magnetic structure refinements were carried out with the program Jana2006 [17]. The following parameters were refined: the profile parameters (GU, GW, and LY), the lattice parameters, the shift parameter, the preferred orientation parameter in c direction [20], the atomic coordinates and the isotropic thermal displacement parameters. Furthermore, the background was determined manually for each diffractogram.
For the compounds Mn1.8Co0.2Sb and Mn1.9Co0.1Sb magnetic structure refinements were performed at four temperatures (350 K, RT, 200 K and 50 K). The models for those refinements were described with Shubnikov groups, which result from the irreducible representations of the nuclear space group. For their deduction the corresponding algorithm implemented in Jana2006 was used [16]. At each temperature, different models were tested and, besides the previously mentioned parameters, the magnetic moments of Mn1/Co1 and Mn2 were also refined.
Temperature-dependent magnetization measurements were performed on a DynaCool vibrating sample magnetometer (VSM) (Quantum Design, San Diego, CA, USA). All measurements were performed in a uniform magnetic field of 0.01 T. In the temperature range of 240 to 380 K a sweeping rate of 1 K/min was used. To prevent the accumulation of metastable FRI phases in the AFM stability field [13], the sweeping rate was reduced to 0.5 K/min during the cooling cycle from 240 to 10 K. The conversion factor of the Am2/kg unit to the emu/g unit is 1, i.e., 1 Am2/kg = 1 emu/g.
4. Conclusions
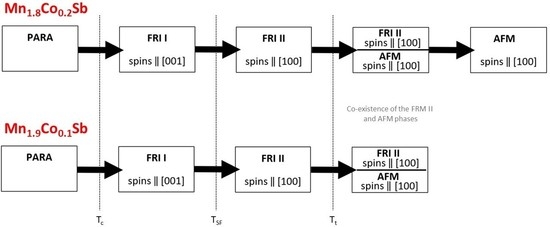
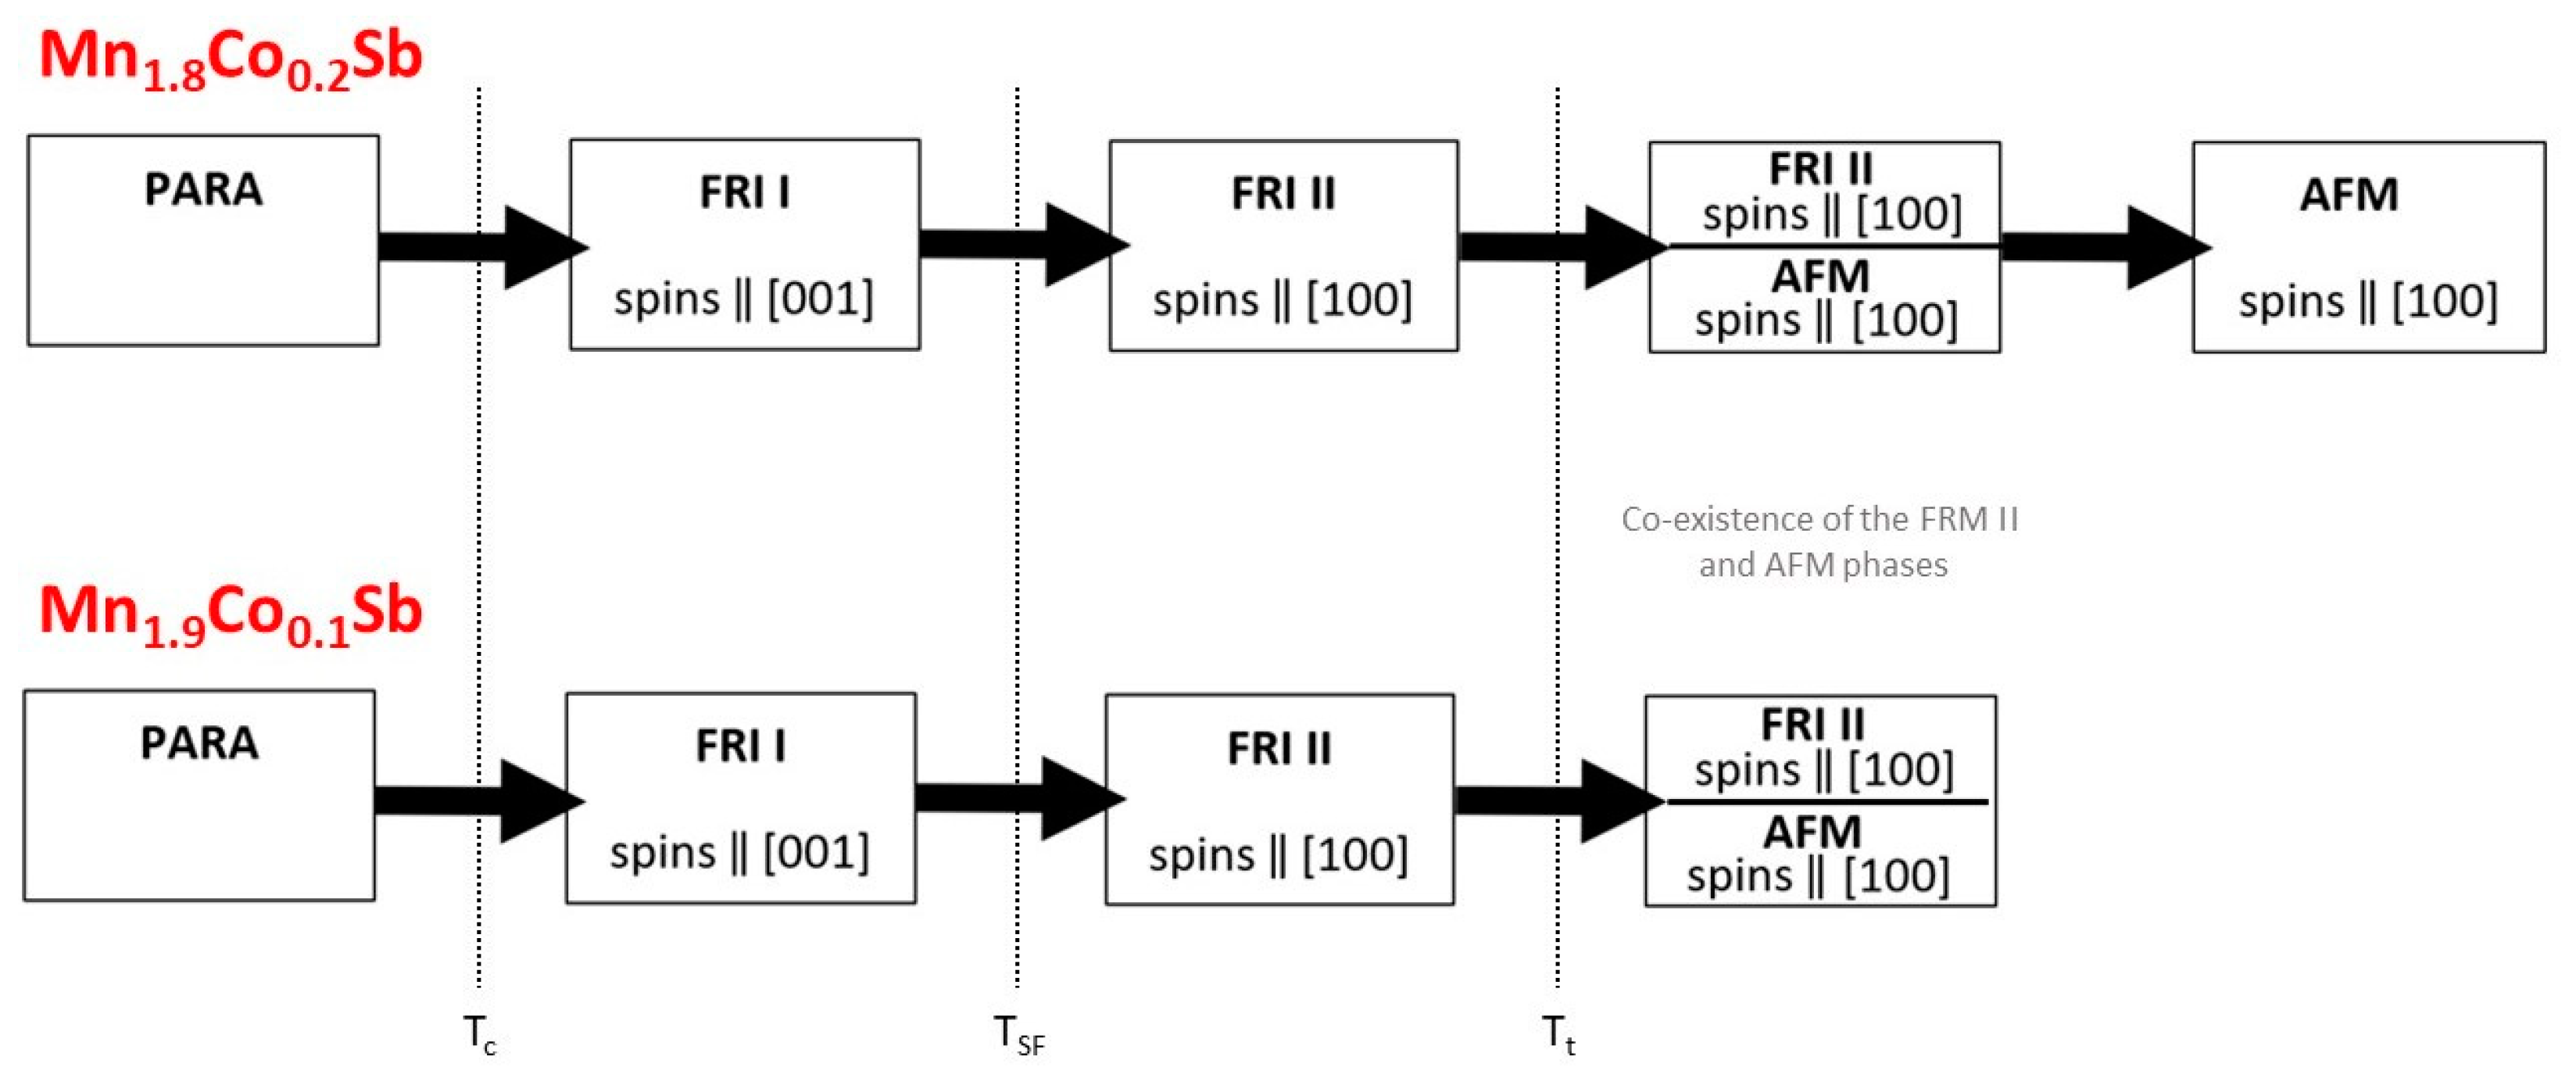
Figure 9 summarizes the information on the Shubnikov groups and the corresponding magnetic models for the compounds Mn1.9Co0.1Sb and Mn1.8Co0.2Sb. The following sequence of magnetic phase transitions P4/nm’m’ → Pmm’n’ → Pmm’n’ + P[c]mcn → P[c]mcn was determined for Mn1.8Co0.2Sb. The compound with x = 0.1 does not reach the pure P[c]mcn state at least down to 50 K.
With increasing Co content, the TSF rises linearly. The phase transition from FRI-I to FRI-II is of a second-order character. The two-phase regions observed in neutron diffraction show that even the low cooling rates during our measurements could not avoid the accumulation metastable frozen FRI-II in the AFM region. This kinetic arrest is associated with the MCE and causes a broadening of the first-order magnetic phase transition [8]. No correlation between Tt and the Co content was found here. The abrupt changes of the interatomic distances for the x = 0.2 compound between RT and 200 K reflect the phase transition from the FRI-II → AFM phase. Our investigations clearly show the importance of the thermal history of these compounds for the formation of the magnetic states. This also explains the contradicting results found in the literature concerning the magnetic properties of the Mn2−xCoxSb materials.
Supplementary Materials
The following are available online at https://0-www-mdpi-com.brum.beds.ac.uk/2304-6740/6/4/113/s1, Figure S1: dM/dT curves for the cooling and heating cycles on Mn1.8Co0.2Sb; Figure S2: dM/dT curves for the cooling and heating cycles on Mn1.85Co0.15Sb; Figure S3: dM/dT curves for the cooling and heating cycles on Mn1.9Co0.1Sb; Figure S4: Spin flip transition temperatures in Mn2−xCoxSb compounds as a function of the Co content; Figure S5: Magnetic phase transition temperatures in Mn2−xCoxSb compounds as a function of the Co content; Figure S6: Rietveld refinement of the neutron powder diffractogram of Mn1.85Co0.15Sb at 550 K; Figure S7: Rietveld refinement of the neutron powder diffractogram of Mn1.9Co0.1Sb at 550 K; Figure S8: Magnetic refinement of the neutron powder diffractogram of Mn1.9Co0.1Sb at 350 K; Figure S9: Magnetic refinement of the neutron powder diffractogram of Mn1.9Co0.1Sb at room temperature; Figure S10: Magnetic refinement of the neutron powder diffractogram of Mn1.9Co0.1Sb at 200K; Figure S11: Magnetic refinement of the neutron powder diffractogram of Mn1.9Co0.1Sb at 50K; Table S1: Nominal vs. actual compositions for Mn1.9Co0.1Sb; Table S2: Nominal vs. actual compositions for Mn1.85Co0.15Sb; Table S3: Nominal vs. actual compositions for Mn1.8Co0.2Sb; Table S4: Lattice parameters, unit-cell volumes, and a/c ratios obtained from the x-ray powder diffractograms at RT; Table S5: a lattice parameters for each composition at different temperatures from the neutron data; Table S6: c lattice parameters for each composition at different temperatures from the neutron data; Table S7: Unit cell volumes for each composition at different temperatures from the neutron data; Table S8: z-coordinates from Rietveld refinements of the neutron powder diffractograms at five temperatures (550 K, 350 K, RT, 200 K, 50 K) for x = 0.2 and x = 0.1; Table S9: Isotropic thermal displacement parameters Uiso from neutron powder diffraction at five temperatures (550 K, 350 K, RT, 200 K, 50 K) for x = 0.2 and x = 0.1; Table S10: Co occupancy on the Mn1 site at 550 K—stoichiometric vs. refined values; Table S11: Final agreement factors of the magnetic structure refinements for the Mn1.9Co0.1Sb (350K, RT, 200 K, 50 K) neutron powder diffractograms.
Author Contributions
Conceptualization, K.F., J.V. and A.G.; Methodology, A.H, J.P., J.V., K.F. and A.G.; Formal Analysis, J.S.W., J.V., K.F. and A.G.; Investigation, J.S.W. and M.C.; Writing—Original Draft Preparation, J.S.W.; Writing—Review & Editing, A.H., J.P., J.V., K.F. and A.G.; Visualization, J.S.W.; Supervision, A.G. All the authors discussed the results and contributed to the manuscript.
Funding
This research received no external funding.
Acknowledgments
One of the authors (M.C.) acknowledges financial support from the Rustaveli National Science Foundation in the framework of the Georgian‒German Science Bridge.
Conflicts of Interest
The authors declare no conflict of interest.
References
- Suzuki, T.; Kanomata, T.; Yoshida, H.; Kaneko, T. Thermal expansion and pressure effect on magnetic transition of Mn2−xCoxSb. J. Appl. Phys. 1990, 67, 4816–4817. [Google Scholar] [CrossRef]
- Kanomata, T.; Hasebe, Y.; Ito, T.; Yoshida, H.; Kaneko, T. Pressure effect on magnetic transition temperature and magnetic phase diagram of Mn2−xCoxSb. J. Appl. Phys. 1991, 69, 4642–4644. [Google Scholar] [CrossRef]
- Bartashevich, M.I.; Goto, T.; Tomita, T.; Baranov, N.V.; Zemlyanski, S.V.; Hilscher, G.; Michor, H. AF–FRI metamagnetic transition in itinerant Mn2−xCoxSb system: High-field and high-pressure effects. Phys. B Condens. Matter 2002, 318, 198–210. [Google Scholar] [CrossRef]
- Bartashevich, M.I.; Goto, T.; Baranov, N.V.; Gaviko, V.S. Volume magnetostriction at the AF–FRI metamagnetic transition in the itinerant-electron system Mn2−xTxSb (T = Co, Cr). Phys. B Condens. Matter 2004, 351, 71–76. [Google Scholar] [CrossRef]
- Caron, L.; Miao, X.F.; Klaasse, J.P.; Gama, S.; Brück, E. Tuning the giant inverse magnetocaloric effect in Mn2−xCrxSb compounds. Appl. Phys. Lett. 2013, 103, 112404. [Google Scholar] [CrossRef]
- Ma, S.C.; Hou, D.; Gong, Y.Y.; Wang, L.Y.; Huang, Y.L.; Zhong, Z.C.; Wang, D.H.; Du, Y.W. Giant magnetocaloric and magnetoresistance effects in ferrimagnetic Mn1.9Co0.1Sb alloy. Appl. Phys. Lett. 2014, 104, 022410. [Google Scholar] [CrossRef]
- Ma, S.; Su, Y.; Huang, Y.; Wu, Y.; Zhong, Z. Magnetic and Magnetocaloric Properties in Ferrimagnetic Mn2−xCoxSb (x = 0.15 and 0.20) Alloys. IEEE Trans. Magn. 2015, 51, 1–6. [Google Scholar] [CrossRef]
- Tekgül, A.; Acet, M.; Farle, M.; Ünal, N. Kinetic arrest of the ferrimagnetic state in indium-doped Mn1.82Co0.18Sb. J. Alloys Compd. 2017, 695, 418–425. [Google Scholar] [CrossRef]
- Brown, P.J.; Gandy, A.P.; Kanomata, T.; Ziebeck, K.R.A. Stability of Mn moments and exchange interactions in cobalt substituted Mn2Sb. J. Phys. Condens. Matter 2008, 20, 015220. [Google Scholar] [CrossRef]
- Wilkinson, M.K.; Gingrich, N.S.; Shull, C.G. The magnetic structure of Mn2Sb. J. Phys. Chem. Solids 1957, 2, 289–300. [Google Scholar] [CrossRef]
- Kimura, A.; Suga, S.; Matsushita, T.; Daimon, H.; Kaneko, T.; Kanomata, T. Photoemission and Absorption Spectroscopy of Mn2Sb, MnAlGe, Mn2As, Cr2As and Fe2As. J. Phys. Soc. Jpn 1993, 62, 1624–1633. [Google Scholar] [CrossRef]
- Ohashi, M.; Yamaguchi, Y.; Kanomata, T. Neutron diffraction studies of the ferrimagnetic-antiferromagnetic phase transition in cobalt modified Mn2Sb. J. Magn. Magn. Mater. 1992, 104, 925–926. [Google Scholar] [CrossRef]
- Kushwaha, P.; Rawat, R.; Chaddah, P. Metastability in the ferrimagnetic–antiferromagnetic phase transition in Co substituted Mn2Sb. J. Phys. Condens. Matter 2008, 20, 022204. [Google Scholar] [CrossRef]
- Kanomata, T.; Ido, H. Magnetic transitions in Mn2−xMxSb (M = 3 d metals). J. Appl. Phys. 1984, 55, 2039–2041. [Google Scholar] [CrossRef]
- Lawson, A.C.; Larson, A.C.; Aronson, M.C.; Johnson, S.; Fisk, Z.; Canfield, P.C.; Thompson, J.D.; Von Dreele, R.B. Magnetic and crystallographic order in α-manganese. J. Appl. Phys. 1994, 76, 7049–7051. [Google Scholar] [CrossRef]
- Petříček, V.; Fuksa, J.; Dušek, M. Magnetic space and superspace groups, representation analysis: Competing or friendly concepts? Acta Crystallogr. Sect. A 2010, 66, 649–655. [Google Scholar] [CrossRef] [PubMed]
- Petříček, V.; Dušek, M.; Palatinus, L. Crystallographic computing system JANA2006: General features. Z. Kristallogr. Cryst. Mater. 2014, 229, 345–352. [Google Scholar] [CrossRef]
- Gier, H. Kalt-Schmelz-Tiegel. European Patent EP 03,45,542 B1, 1993. [Google Scholar]
- Olesik, J.W. Elemental analysis using ICP-OES and ICP/MS. Anal. Chem. 1991, 63, 12A–21A. [Google Scholar] [CrossRef]
- Dollase, W.A. Correction of intensities for preferred orientation in powder diffractometry: Application of the March model. J. Appl. Crystallogr. 1986, 19, 267–272. [Google Scholar] [CrossRef]
Figure 1.
Temperature-dependent magnetization curves (M(T)) for the polycrystalline samples of Mn1.9Co0.1Sb, Mn1.85Co0.15Sb, and Mn1.8Co0.2Sb upon cooling (blue) and heating (red) in a constant magnetic field of μ0H = 0.01 T.
Figure 1.
Temperature-dependent magnetization curves (M(T)) for the polycrystalline samples of Mn1.9Co0.1Sb, Mn1.85Co0.15Sb, and Mn1.8Co0.2Sb upon cooling (blue) and heating (red) in a constant magnetic field of μ0H = 0.01 T.

Figure 2.
Temperature-dependent magnetization curves on a Mn1.9Co0.1Sb single crystal perpendicular and parallel to the c direction in a constant magnetic field µ0H = 0.01 T (bottom) and the ratio of the magnetizations parallel and perpendicular to the c direction (top).
Figure 2.
Temperature-dependent magnetization curves on a Mn1.9Co0.1Sb single crystal perpendicular and parallel to the c direction in a constant magnetic field µ0H = 0.01 T (bottom) and the ratio of the magnetizations parallel and perpendicular to the c direction (top).

Figure 3.
Rietveld refinement of the neutron powder diffractogram of Mn1.8Co0.2Sb at 550 K (Robs = 6.56%, Rwp = 5.07%, Rp = 3.43%). The small peak at around 80° is not observed at the other temperatures and can most likely be attributed to an artifact.
Figure 3.
Rietveld refinement of the neutron powder diffractogram of Mn1.8Co0.2Sb at 550 K (Robs = 6.56%, Rwp = 5.07%, Rp = 3.43%). The small peak at around 80° is not observed at the other temperatures and can most likely be attributed to an artifact.

Figure 4.
Magnetic refinement of the neutron powder diffractogram of Mn1.8Co0.2Sb at 350 K (Shubnikov group: P4/nm’m’).
Figure 4.
Magnetic refinement of the neutron powder diffractogram of Mn1.8Co0.2Sb at 350 K (Shubnikov group: P4/nm’m’).

Figure 5.
Magnetic refinement of the neutron powder diffractogram of Mn1.8Co0.2Sb at RT (Shubnikov group: Pmm’n’).
Figure 5.
Magnetic refinement of the neutron powder diffractogram of Mn1.8Co0.2Sb at RT (Shubnikov group: Pmm’n’).

Figure 6.
Magnetic refinement of the neutron powder diffractogram of Mn1.8Co0.2Sb at (a) 200 K (Shubnikov groups: P[c]cmn (phase I) and Pmm’n’ (phase II)) and (b) 50 K (Shubnikov group: P[c]cmn).
Figure 6.
Magnetic refinement of the neutron powder diffractogram of Mn1.8Co0.2Sb at (a) 200 K (Shubnikov groups: P[c]cmn (phase I) and Pmm’n’ (phase II)) and (b) 50 K (Shubnikov group: P[c]cmn).


Figure 7.
Magnetic moments in Mn1.8Co0.2Sb at different temperatures. Green, dark blue/red, and light blue symbols stand for Sb, Mn1/Co1, and Mn2, respectively.
Figure 7.
Magnetic moments in Mn1.8Co0.2Sb at different temperatures. Green, dark blue/red, and light blue symbols stand for Sb, Mn1/Co1, and Mn2, respectively.

Figure 8.
Interatomic distances in Mn1.8Co0.2Sb (full symbols) and Mn1.9Co0.1Sb (open symbols): Mn2–Sb distance (triangles); Mn2–Sb’ distance (diamonds); Mn1/Co1–Sb distance (circles); Mn1/Co1–Mn2 distance (squares). The estimated standard deviations are smaller than the symbols. Lines are guides for the eye.

Figure 9.
Sequence of magnetic phase transitions for Mn1.8Co0.2Sb and Mn1.9Co0.1Sb.


Table 1.
Magnetic phase transition temperatures TSF and Tt in [K] for the Mn2−xCoxSb (x = 0.1, 0.15, 0.2) powder samples and the width of thermal hysteresis Thys for Tt between the cooling and heating cycles.
Table 1.
Magnetic phase transition temperatures TSF and Tt in [K] for the Mn2−xCoxSb (x = 0.1, 0.15, 0.2) powder samples and the width of thermal hysteresis Thys for Tt between the cooling and heating cycles.
| Transition Temperatures | Cycle | x = 0.1 | x = 0.15 | x = 0.2 |
|---|---|---|---|---|
| TSF | cooling | 275 | 315 | - |
| Tt | 105 | 93 | 133 | |
| TSF | heating | 280 | 316 | 346 |
| Tt | 122 | 116 | 136 | |
| Thys | - | 17 | 23 | 3 |
Table 2.
Final agreement factors of the magnetic structure refinements for the Mn1.8Co0.2Sb (350K, RT, 200 K, 50 K) neutron powder diffractograms. The chosen final models are printed in bold. For the refinement at 200 K two phases were considered. Phase I corresponds to the magnetic symmetry P[c]mcn, while phase II corresponds to the magnetic symmetry Pmm’n’. The volume fractions from the two-phase refinement are mentioned in the table.
| 350 K | Robs (%) | Rwp (%) | Rp (%) | |
| P4/nm’m’ | 4.22 | 4.40 | 3.35 | |
| Cm’me’ | 6.41 | 5.37 | 3.80 | |
| Pmm’n’ | 6.08 | 5.37 | 3.80 | |
| RT | Robs (%) | Rwp (%) | Rp (%) | |
| P4/nm’m’ | 8.33 | 6.76 | 4.98 | |
| Cm’me’ | 4.43 | 5.81 | 4.52 | |
| Pmm’n’ | 3.29 | 5.82 | 4.52 | |
| 200 K | Robs (%) Phase I/II | Rwp (%) | Rp (%) | Volume fractions phase I/II |
| C[c]mce | 3.30/3.03 | 5.54 | 4.40 | 0.18(4)/0.82(4) |
| P[c]mcn | 3.00/3.19 | 5.59 | 4.46 | 0.18(4)/0.82(4) |
| R factors from magnetic reflections | Robs (%) | wRobs | Rall (%) | wRall |
| C[c]mce | 12.12 | 12.86 | 33.69 | 14.17 |
| P[c]mcn | 9.31 | 9.12 | 36.26 | 10.53 |
| 50 K | Robs (%) | Rwp (%) | Rp (%) | Robs (%) Magnetic |
| C[c]mce | 4.80 | 6.18 | 4.61 | 5.94 |
| P[c]mcn | 4.56 | 6.18 | 4.61 | 5.35 |
Table 3.
Refined magnetic moments µMn1/Co1 and µMn2 for the different temperatures.
| x | Temperature [K] | Magnetic State | Shubnikov Group | Magnetic Moment µMn I | Magnetic Moment µMn II |
|---|---|---|---|---|---|
| 0.1 | 350 | FRI-I | P4/nm’m’ | along c: −0.76(11) | along c: 2.24(23) |
| 297 | FRI-I | P4/nm’m’ | along c: −0.79(9) | along c: 2.47(18) | |
| 200 | FRI-II | Pmm’n’ | along a: 1.34(15) | along a: −2.01(30) | |
| 50 | AFM + FRI-II | P[c]mcn | along a: −0.53(10) | along a: −0.42(12) | |
| Pmm’n’ | along a: 0.73(13) | along a: −3.05(24) | |||
| 0.2 | 350 | FRI-I | P4/nm’m’ | along c: −0.55(6) | along c: 1.81(11) |
| 297 | FRI-II | Pmm’n’ | along a: −1.10(11) | along a: 1.61(21) | |
| 200 | AFM + FRI-II | P[c]mcn | along a: −0.51(16) | along a: 0.50(25) | |
| Pmm’n’ | along a: 0.63(11) | along a: −2.75(17) | |||
| 50 | AFM | P[c]mcn | along a: −1.12(3) | along a: 3.44(5) |
© 2018 by the authors. Licensee MDPI, Basel, Switzerland. This article is an open access article distributed under the terms and conditions of the Creative Commons Attribution (CC BY) license (http://creativecommons.org/licenses/by/4.0/).
Share and Cite
MDPI and ACS Style
Wilden, J.S.; Hoser, A.; Chikovani, M.; Perßon, J.; Voigt, J.; Friese, K.; Grzechnik, A. Magnetic Transitions in the Co-Modified Mn2Sb System. Inorganics 2018, 6, 113. https://0-doi-org.brum.beds.ac.uk/10.3390/inorganics6040113
AMA Style
Wilden JS, Hoser A, Chikovani M, Perßon J, Voigt J, Friese K, Grzechnik A. Magnetic Transitions in the Co-Modified Mn2Sb System. Inorganics. 2018; 6(4):113. https://0-doi-org.brum.beds.ac.uk/10.3390/inorganics6040113
Chicago/Turabian StyleWilden, Johanna S., Andreas Hoser, Mamuka Chikovani, Jörg Perßon, Jörg Voigt, Karen Friese, and Andrzej Grzechnik. 2018. "Magnetic Transitions in the Co-Modified Mn2Sb System" Inorganics 6, no. 4: 113. https://0-doi-org.brum.beds.ac.uk/10.3390/inorganics6040113
Note that from the first issue of 2016, this journal uses article numbers instead of page numbers. See further details here.