Article

Comparative Cutaneous Water Loss and Desiccation Tolerance of Four Solenopsis spp. (Hymenoptera: Formicidae) in the Southeastern United States

1
Department of Entomology and Plant Pathology, Auburn University, Auburn, AL 36849, USA
2
Department of Bioinformatics, College of Life Science, Institute of Life Science and Green Development, Hebei University, Baoding 071002, China
*
Authors to whom correspondence should be addressed.
Submission received: 7 May 2020 / Revised: 10 June 2020 / Accepted: 30 June 2020 / Published: 5 July 2020
(This article belongs to the Special Issue Insect Water Relations)

Abstract

:
The high surface area to volume ratio of terrestrial insects makes them highly susceptible to desiccation mainly through the cuticle. Cuticular permeability (CP) is usually the most important factor limiting water loss in terrestrial insects. Water loss rate, percentage of total body water (%TBW) content, CP, and desiccation tolerance were investigated in workers of four Solenopsis species in the southeastern USA. We hypothesized that tropical/subtropical ants (S. invicta and S. geminata) will have lower CP values and tolerate higher levels of desiccation than temperate ants (S. richteri and S. invicta × S. richteri). The %TBW content was similar among species. Solenopsis invicta had a 1.3-fold and 1.1-fold lower CP value than S. invicta × S. richteri and S. richteri, respectively. Solenopsis geminata had a 1.3-fold lower CP value than S. invicta × S. richteri, and a 1.2-fold lower CP value than S. richteri. The LT50 values (lethal time to kill 50% of the population) ranged from 1.5 h (small S. geminata) to 8.5 h (large S. invicta). Desiccation tolerance ranged between 36 and 50 %TBW lost at death and was not related to a species’ location of origin. This study is the first report of water relations of S. invicta × S. richteri. It demonstrates that desiccation stress differentially can affect the survival of different Solenopsis species and implies that environmental stress can affect the distribution of these species in the southeastern USA.

1. Introduction

The distribution of terrestrial insects is limited by tolerance of abiotic stressors such as temperature and relative humidity [1,2,3]. Desiccation impacts insect water balance, and tolerance to this stress plays an important role in the geographic distribution of insects [4,5,6]. Understanding the native distribution of invasive insect species is useful information for predicting their potential spread in newly introduced areas [7,8]. Desiccation tolerance (i.e., percentage of total body water lost at death) can be expressed phenotypically between generations [9]. Desiccation tolerance in terrestrial insects is limited by apparent morphological and ecological factors [9,10,11].
The high surface area to volume ratio of terrestrial insects makes them highly susceptible to desiccation mainly through the cuticle [12]. Terrestrial insects conserve water by a relatively water impermeable cuticle covered with a thin layer of epicuticular lipids (particularly hydrocarbons) which serve as the primary mechanism to limit loss of water across the insect’s exoskeleton [5,13,14]. Cuticular permeability is usually the most important factor limiting water loss [13,14,15,16] and is often measured as the amount of water lost (µg) per unit surface area (cm2) per unit time (h) per unit saturation deficit (mmHg, Torr, or kPa) [13,15,16,17]. Higher cuticular permeability values represent greater rates of water loss and faster desiccation. Cuticular permeability of terrestrial insects is influenced by climatic factors such as temperature, relative humidity, and saturation deficit in their habitat [12,16]. These climatic factors vary between latitudes [17,18,19,20,21] and are being negatively impacted by climate change [22,23]. Dramatic variation in water availability between habitats is another important factor of species distribution. Cuticular permeability is also significantly affected by the condition (live or dead) of terrestrial insects because the cuticular water pump, located in the epidermal cells, actively restricts water loss in living insects [12,24,25,26]. These factors and variabilities are expected to play a role in limiting species’ geographical distribution. However, little is known about how desiccation tolerance is related to the distribution and success of invasive insect species in their introduced environment as compared with their native range [27].
The black imported fire ant, Solenopsis richteri Forel, and the red imported fire ant, S. invicta Buren, were accidentally introduced into the United States of America from South America in the 1920s and 1930s, respectively, through Mobile, Alabama [28,29]. Since their introduction, both S. richteri and S. invicta have become serious pests and S. invicta has displaced native fire ants [30], including the tropical fire ant, S. geminata (Fabricius). Solenopsis richteri and S. invicta have formed an extensive zone of hybridization in the USA [31], but hybridization has not been found in their native South America [32,33]. Colonies of Solenopsis spp. can contain >100,000 workers of varying size and are likely to be exposed to a variety of environmental stressors, including high temperature and low relative humidity, during their lifetimes, especially when foraging [12,34]. Solenopsis richteri occurs at slightly higher latitudes than S. invicta both in the USA and in their native South America (see maps in [35], pp. 27 and 59) [36,37], while S. invicta × S. richteri occur only in the USA between pure species populations. Furthermore, S. invicta and S. geminata are usually found in the tropical/subtropical USA, whereas S. richteri is usually found in more temperate areas in the USA [7,36]. The introduced S. richteri and S. invicta have each remained phenotypically constant since the time of their introduction from South America [38]. The potential range of expansion for S. invicta, based on current temperature and rainfall patterns, has been modeled for the continental USA [39] and worldwide [40]. Solenopsis invicta now occupies much of southern USA and has been established in California, West Indies, New Zealand, Australia, and parts of Asia [41,42,43,44].
A number of investigations have compared water use within and across some Solenopsis spp. and have identified a number of physiological traits related to water loss. Workers of S. invicta were more tolerant to desiccation stress than S. richteri workers despite the significantly greater body water content in S. richteri [45]. Size also plays a role in cuticular permeability in Solenopsis spp. For example, despite the greater percentage of total body water (%TBW) content of small S. invicta workers, cuticular permeability was greater in these individuals as compared with large S. invicta workers [12]. This has also been demonstrated in S. xyloni (McCook) workers [46]. Interestingly, Li and Heinz [47] indicated that desiccation resistance in polygyne S. invicta was not a function of body size and found low heritability of desiccation resistance in the tested population.
In addition to size, cuticular permeability was shown to be influenced by death from exposure to cyanide gas, which increased cuticular permeability in S. invicta workers by about 1.5-fold, and death by hexane extraction, which increased cuticular permeability by about 1.8-fold [12]. On the basis of a comparison among S. invicta, S. richteri, and S. invicta × S. richteri, Xu et al. [48] found that Solenopsis species with the highest water loss transition temperature (Tc) and highest melting point (Tm-max) of cuticular hydrocarbons (CHC’s) retained more water in relatively higher temperatures, and consequently were able to occupy warmer environments. Thus, several heritable physiological traits impact the water relations of Solenopsis spp. Similar impacts could also be caused by acclimation and environmental factors.
Studies within and across some Solenopsis spp. have revealed the degree of impact and relation of extreme abiotic factors to cutaneous water loss. Braulick et al. [49] compared lethal times (LT) in hours at 0% relative humidity (RH) and high temperatures for workers of S. aurea Wheeler, S. geminata, S. invicta, and S. xyloni. In general, workers survived progressively longer periods as temperature decreased; and major workers survived two to four times longer than minor workers at the same temperatures. Munroe et al. [50] compared the effect of desiccation on survival times in workers of S. invicta, S. geminata, and S. xyloni, and found that S. invicta had lower LT50 values than S. geminata and S. xyloni. Wendt and Verble-Pearson [51] found that major and medium S. invicta workers survived higher temperatures more often than did minor workers. Phillips et al. [52] found that workers of S. invicta from xeric conditions were less prone to desiccation than were those from moist conditions. It was suggested that this observation could be the result of natural selection at the population level or a physiological modification (acclimatization) by S. invicta workers as a consequence of continued exposure to more stressful environmental conditions. Li and Heinz [47] found that polygyne populations of S. invicta could be capable of adapting to arid habitats, therefore, suggesting an advantage in dominance of polygyne over monogyne S. invicta populations in arid habitats. Martin and Vinson [53] demonstrated that the ability to maintain a minimum viable level of body water could be a limiting factor to foraging range in S. invicta workers. Vogt et al. [54] also showed that temperature was a significant predictor of foraging activity in S. invicta workers. Thus, several environmental, as well as biological factors, impact the water relations of Solenopsis spp.
Although there have been several water relations studies on some Solenopsis species, there are no documented studies on the S. invicta × S. richteri hybrid, and there are none comparing multiple tropical and temperate Solenopsis species. Our objectives were to determine the percentage of total body water (%TBW) content, rate of mass loss, rate of total body water lost (%TBW lost), and cuticular permeability of introduced and native Solenopsis spp. of fire ants in the southeastern USA. In addition, we determined the desiccation sensitivity of these species. We hypothesized that tropical/subtropical fire ants (S. invicta and S. geminata) have lower cuticular permeability values and tolerate higher levels of desiccation (i.e., greater %TBW lost) than temperate fire ants (S. richteri and S. invicta × S. richteri). This study compares the water relations of temperate and tropical/subtropical fire ant workers across different latitudes in southern USA and is the first report of cuticular permeability and desiccation tolerance of S. invicta × S. richteri hybrid workers.

2. Materials and Methods

2.1. Study Species and Handling

The Solenopsis invicta workers were obtained from mounds on the Auburn University campus, Lee County, Alabama, in March 2017. The Solenopsis richteri workers were obtained from mounds in Hohenwald, Lewis County, and Mount Pleasant, Maury County, Tennessee, in March 2017. Workers of S. invicta × S. richteri hybrids were obtained from mounds in Cullman, Cullman County, and Hollywood, Jackson County, Alabama, in March 2017. Workers of S. geminata were obtained from mounds in Gainesville, Alachua County, Florida, in March 2017. GPS coordinates of ant collection locations are listed in Table 1. The identity of each species was confirmed by gas chromatography of hexane extracts of ca. 50 workers using both venom alkaloid and cuticular hydrocarbon characters, [32,55,56] following the methodology in Hu et al. [57]. Ants were used for experiments within the same week they were collected. On the basis of the large variation of body sizes and behavioral differences among size classes of Solenopsis spp. workers, each species was categorized, using the range of their head width, as small (0.72 mm or less), medium (0.73–0.92 mm), or large (0.93 mm or more) [58,59]. Sample size was either 14 or 15 individuals per worker size class per species. The sample size is indicated in Table 2.
We used live and Hydrogen Cyanide (HCN) killed ants in this study. Live ant data provide insight into desiccation tolerance, acceptable water loss for survival, and the abilities of the ants to actively regulate water loss, whereas dead insect data provide absolute cuticular permeability values. Live ants were separated by size and species and confined in a small glass jar with a screen lid. Jars were placed in a 1 L glass chamber with ≈10 g NaCN and KCN. HCN gas was generated by adding ≈0.5 mL hydrochloric acid to the cyanide salts. Ants were exposed for approximately 3 min or until all ants were dead. Dead ants were removed from the killing chamber and weighed to the nearest 0.01 mg individually using an electronic digital analytical balance.

2.2. Total Body Water Content

Knowledge of the rate of percentage of total body water (%TBW) lost and how much total water loss is lethal enabled the calculation of how long the ants would have to avoid or escape lethal environments. Total body water content of all ants was determined gravimetrically (see [12,60,61]). Masses of individual workers were measured to the nearest 0.01 mg on a digital balance in preweighed plastic weighing boats coated on the inside with Fluon® to prevent escape of live ants. Then, ants were transferred to glass vials ringed on the upper inside surface with Fluon® to prevent escape of live ants. Vials containing the ants were placed in an 11 L desiccating chamber containing approximately 0.5 kg anhydrous CaSO4 (Drierite®, W.A. Hammond Drierite Co. LTD, Xenia, OH, USA), resulting in 0–2% RH. Maximal effectiveness of the Drierite was ensured by heating it at 230 °C for at least 2 h prior to use to remove all water. The chamber was placed in an incubator and maintained at 30 ± 1 °C. Temperature and % RH in the chamber were monitored at each weighing, using a digital thermo-hygrometer. Specimens were weighed and returned to the desiccator chamber as quickly as possible. The ants were weighed at 0, 2, 4, 6, 8, 10, and 24 h; dried in a 55 °C oven for two days, weighed, and then dried an additional two days. Ants were dried and weighed until two successive weighings did not differ by >0.01 mg. Mass loss was assumed to be due entirely to water loss. The percentage of total body water (%TBW) was calculated as follows:
%TBW content = [(Minitial − Mdry)/Minitial] * 100
where Minitial is the initial fresh body mass and Mdry is the dry mass.

2.3. Cuticular Permeability

Cuticular permeability was calculated from the difference between initial and 2 h desiccated masses. The mass loss after 2 h was used to avoid confounding factors caused by variability in body shape, and therefore surface area. Additionally, this period represented the maximum water gradient between the insect and the chamber, and thus the greatest water loss rate. Therefore, this period is the best estimate of absolute permeability [60].
Cuticular   permeability = water   lost   ( μ g ) Surface   area   ( cm 2 ) time   ( h ) saturation   deficit   ( mmHg )
Surface area (cm2) was estimated by Meeh’s formula. Surface area (cm2) = Initial mass (g)2/3 * 12 [62].
Saturation deficit, which is the difference between the vapor pressure of water at a given RH and temperature and the vapor pressure of saturated air at the same temperature [15], remained constant at 31.82 mmHg for 30 °C and 0% RH [63].
Adjusted mass loss was calculated as the difference between initial and 2 h masses divided by initial mass (g) and the formula is as follows:
Adjusted mass loss = mg of H2O lost (T0 − T2)/gram initial body mass (T0)
where T0 is initial mass and T2 is mass after 2 h of desiccation.

2.4. Rates of Mass Loss, Water Loss, and Mortality

Hourly percentage of initial mean mass loss and %TBW loss of live and dead individuals of each species and size were plotted individually by time of desiccation; the analysis of these relationships is described below. The condition (live or dead) of live ants was recorded at each weighing.

2.5. Statistical Analysis

A randomized complete block design with body size, live/dead condition, and species as main effects and the size by species interaction was used to evaluate differences in cuticular permeability and %TBW among species within each size. Analysis of variance followed by the Tukey–Kramer HSD comparison test (p < 0.05; [64]) was performed on the initial mass, %TBW, and cuticular permeability data among and across the species. Linear regression was used to determine if cuticular permeability was related to initial live mass. Change in % mass loss or %TBW lost over time was analyzed using nonlinear regression [65]. A rectangular hyperbolic model was used for analysis of the change in % mass loss and %TBW lost overtime. The following function was fit to the hourly % mass loss and %TBW lost values:
Y = a x b + x
where Y = % mass loss or %TBW lost, a = the maximum asymptotic value of % mass loss or %TBW lost, b = (t max)/2 or the period required for half the maximum value to be reached, and x = hour. This function was selected because it is the most parsimonious expression that contains a curvilinear increase and an asymptotic maximum. The maximum value would be obtained with complete dryness of the specimen. For % mass loss, the maximum represents %TBW; for %TBW lost, the maximum should approximate 100%, or complete loss of all body water. Probit analysis [66] was used to estimate the median lethal time of ants exposed to desiccating conditions (ca. 30 °C and 0–2% RH). The resulting LT50 values were used to estimate desiccation tolerance, or %TBW lost at death, from the nonlinear regression equations. Data are expressed as means ± SE, α = 0.05.

3. Results

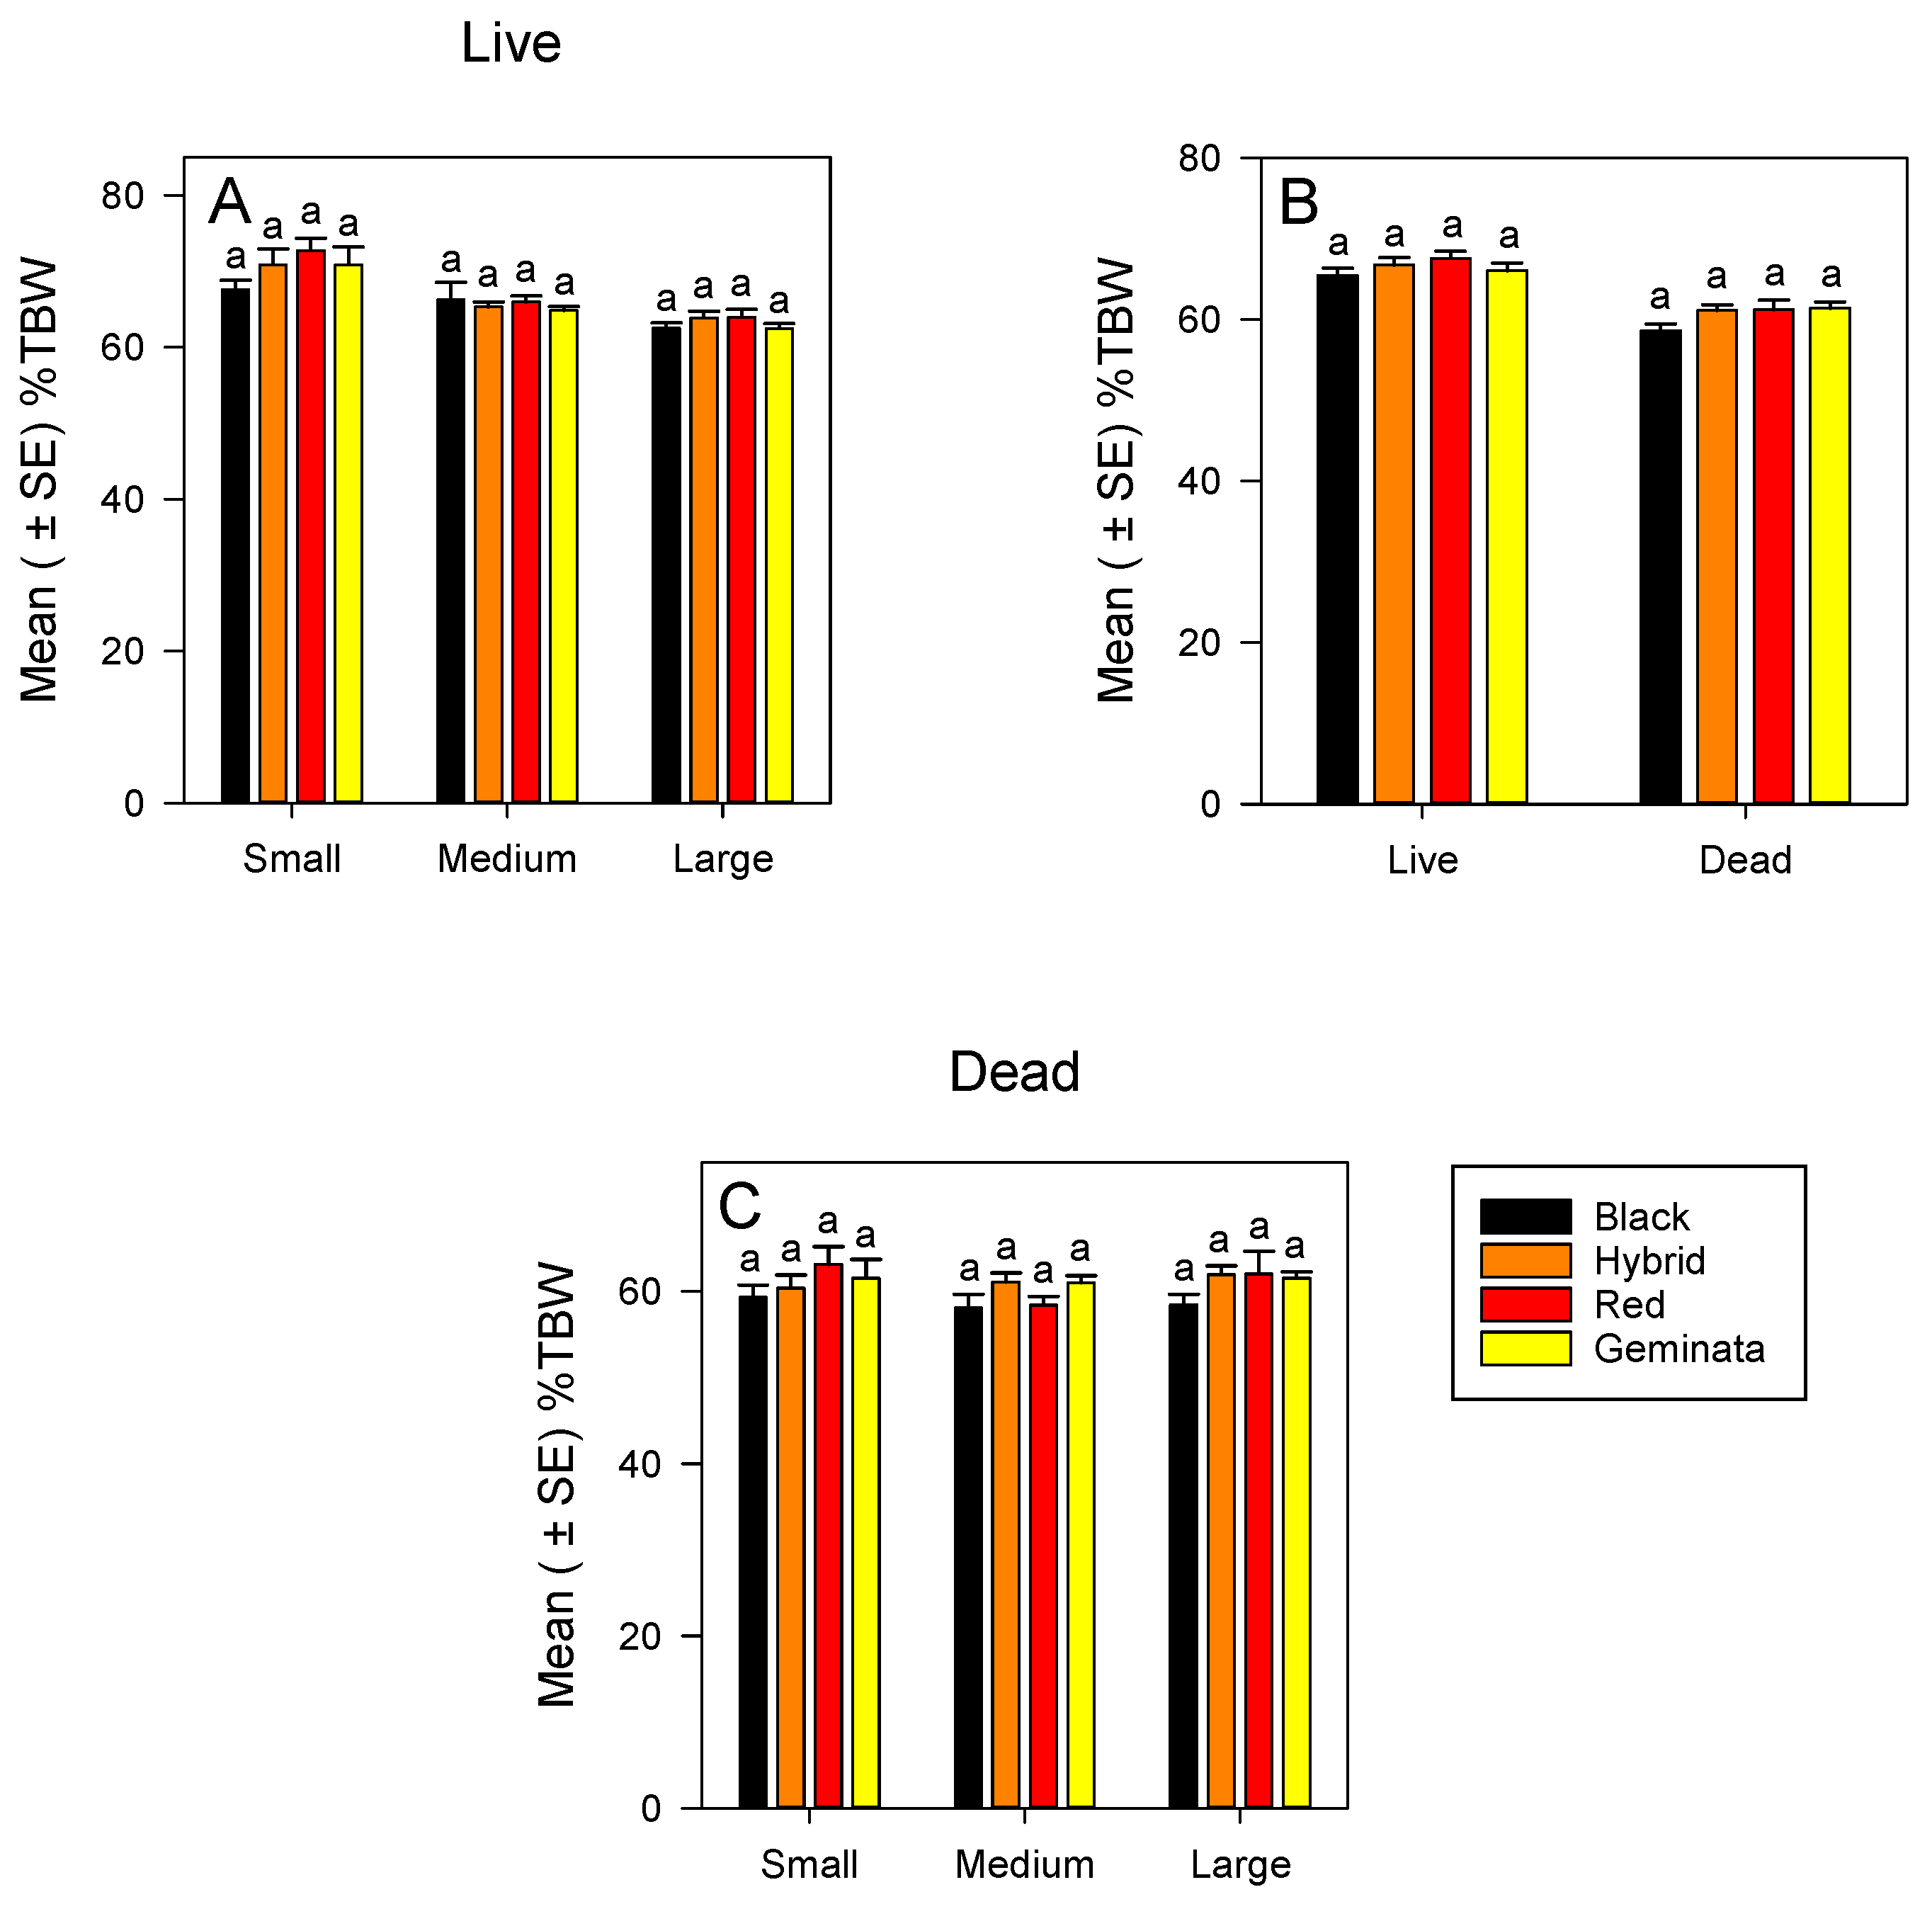
3.1. Body Mass and Water Content

Initial body masses of S. invicta workers ranged from 0.44–0.81 mg for small workers, 0.84–2.55 mg for medium workers, and 2.02–4.36 mg for large workers. Initial body masses of S. richteri workers ranged from 0.63–1.08 mg for small workers, 1.54–2.53 mg for medium workers, and 2.36–3.79 mg for large workers. Initial body masses for S. invicta × S. richteri workers ranged from 0.54–1.02 mg for small workers, 0.72–2.25 mg for medium workers, and 1.34–4.72 mg for large workers. Initial body masses for S. geminata workers ranged from 0.46–1.9 mg for small workers, 1.11–2.91 mg for medium workers, and 3.32–7.52 mg for large workers. Mean initial body masses for each size, and each species of live and dead ants are presented in Table 2.

3.1.1. %TBW of Live Ants

The %TBW of small, medium, and large worker sizes was not significantly different among the four Solenopsis species (Figure 1A). Within each species, small workers had significantly greater %TBW than large workers (Figure S1A). In all the four Solenopsis species, ranking of %TBW of the worker sizes was small > medium > large (Figure S1A). There was no significant difference in %TBW between tropical/subtropical and temperate species (Figure 1C) when worker sizes were combined.

3.1.2. %TBW of Dead Ants

Combining sizes, the %TBW was not significantly different between tropical/subtropical and temperate species (Figure 1B). When separated, the %TBW of small, medium, and large workers were not significantly different among the four Solenopsis species (Figure 1C). In each of the sizes, S. richteri had the lowest in %TBW, whereas small and large S. invicta had the highest in %TBW (Figure 1C). There were no significant differences in %TBW among the sizes in all four Solenopsis species (Figure S1B).

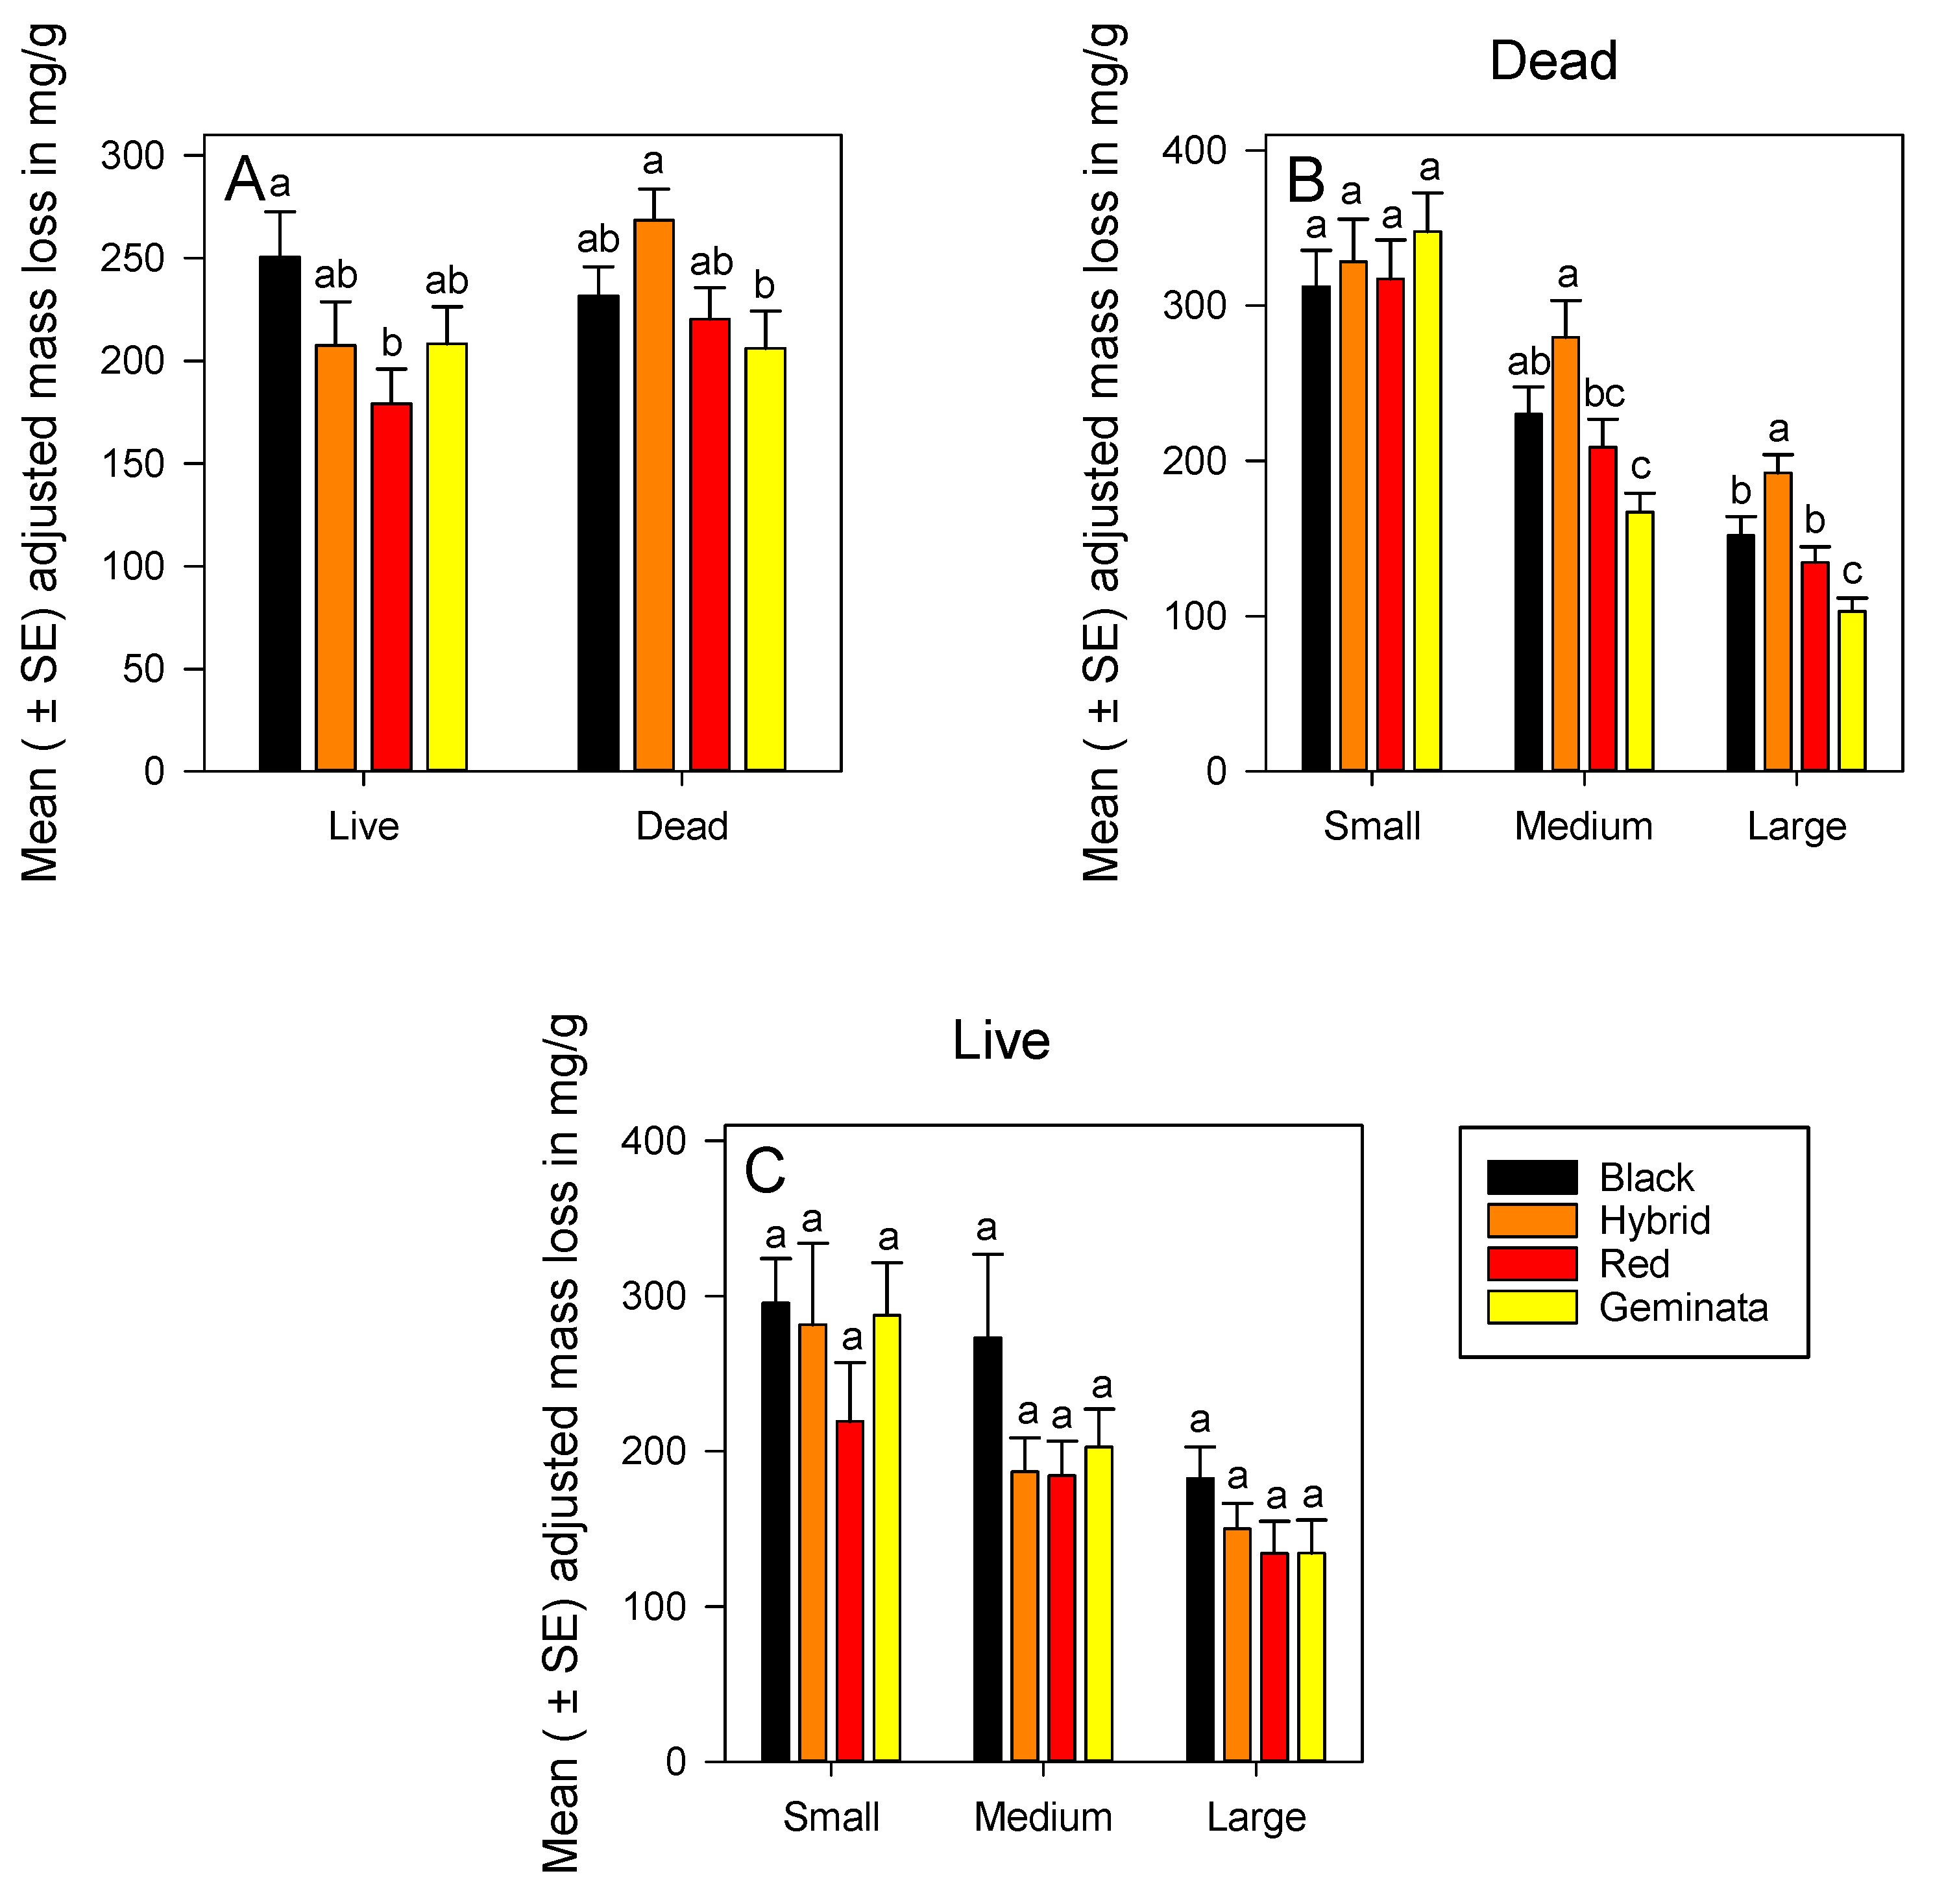
3.1.3. Adjusted Mass Loss of Live Ants

Temperate S. richteri had significantly greater adjusted mass loss than the tropical S. invicta (Figure 2A). There was no significant difference in adjusted mass loss among the four species in each size (Figure 2C). Small workers of S. invicta × S. richteri and S. geminata had significantly greater mass loss than large workers (Figure S2A). Across all species, the ranking of adjusted mass loss was small > medium > large (Figure S2A).

3.1.4. Adjusted Mass Loss of Dead Ants

Combining sizes, temperate S. invicta × S. richteri had significantly greater adjusted mass loss, by ca. 1.3-fold, than subtropical S. geminata (Figure 2A). Adjusted mass loss of dead ants increased over that in live ants by ca. 1.2-fold and ca. 1.3-fold for S. invicta and S. invicta × S. richteri combined sizes, respectively (Figure 2A).
There were significant differences in adjusted mass loss between temperate (S. richteri and S. invicta × S. richteri) and subtropical (S. geminata) ant workers both in medium and large sizes (Figure 2B). Temperate S. invicta × S. richteri had significantly greater adjusted mass loss than tropical species S. invicta and S. geminata for both medium and large workers (Figure 2B). Ranking of species by adjusted mass loss of medium and large sizes was S. invicta × S. richteri > S. richteri > S. invicta > S. geminata (Figure 2B). There were significant differences in adjusted mass loss among the sizes within each species (Figure S2B). Adjusted mass loss of small workers was greater than medium, and that of medium was greater than large workers in all species except S. invicta × S. richteri (Figure S2B). Ranking of sizes by adjusted mass loss was small > medium > large for all the four Solenopsis species (Figure S2B).

3.1.5. Rates of % Initial Mass Loss and %TBW Lost

The % initial mass loss and %TBW lost increased as rectangular hyperbolic function of desiccation time (Figures S3–S6); rising from an intercept of zero and increased at a declining rate eventually reaching an asymptote. The asymptote for the % initial mass loss curves approximate %TBW; those for %TBW lost approximate 100%. The rectangular hyperbolic function was appropriate as all the regressions were highly significant (p < 0.0001) with r2 values > 0.9 (Tables S1–S4).
For live ants, the % initial mass loss (Figure S3 and Table S1) the maximum asymptotic value ranged from 70–107.9 for small S. geminata and large S. invicta, respectively. These asymptotic values (±2 SE) overlap the %TBW (Figure 1). The period required for half the maximum value to be reached ranged from 2.6 h for small S. geminata to 20.3 h for large S. invicta (Table S1). Percentage TBW lost by live ants increased similarly (Figure S4 and Table S2) with the maximum asymptotic value overlapping 100% (representing 100% water loss) and the ”b” coefficient ranged from 2.4–20.2 h for small S. geminata and large S. invicta, respectively (Table S2). The ”b” coefficients for both % initial mass loss and %TBW lost increased with increasing ant size for all species.
For dead ants, % initial mass loss (Figure S5 and Table S3) the ”a” coefficient or maximal asymptotic values were slightly lower than for live ants, ranging from 67.2% for small S. richteri to 97.2% for large S. geminata (Table S3). These values were similar to those for %TBW (Figure S2B). In all the four Solenopsis species, the ”b” coefficient or period required for half the maximum value to be reached ranged from 1.7–16.2 h for small and large S. geminata, respectively (Table S3). Figure S6 illustrates the relationship between %TBW lost by dead ants and desiccation time. The maximum asymptotic value or ”a” coefficient overlaps or exceeds 100% (representing complete dryness). The period required for half the maximum value to be reached or ”b” coefficient ranged from 1.6–16.2 h for small and large S. geminata, respectively (Table S4). The ”b” coefficients for both % initial mass loss and %TBW lost increased with increasing ant size for all species.

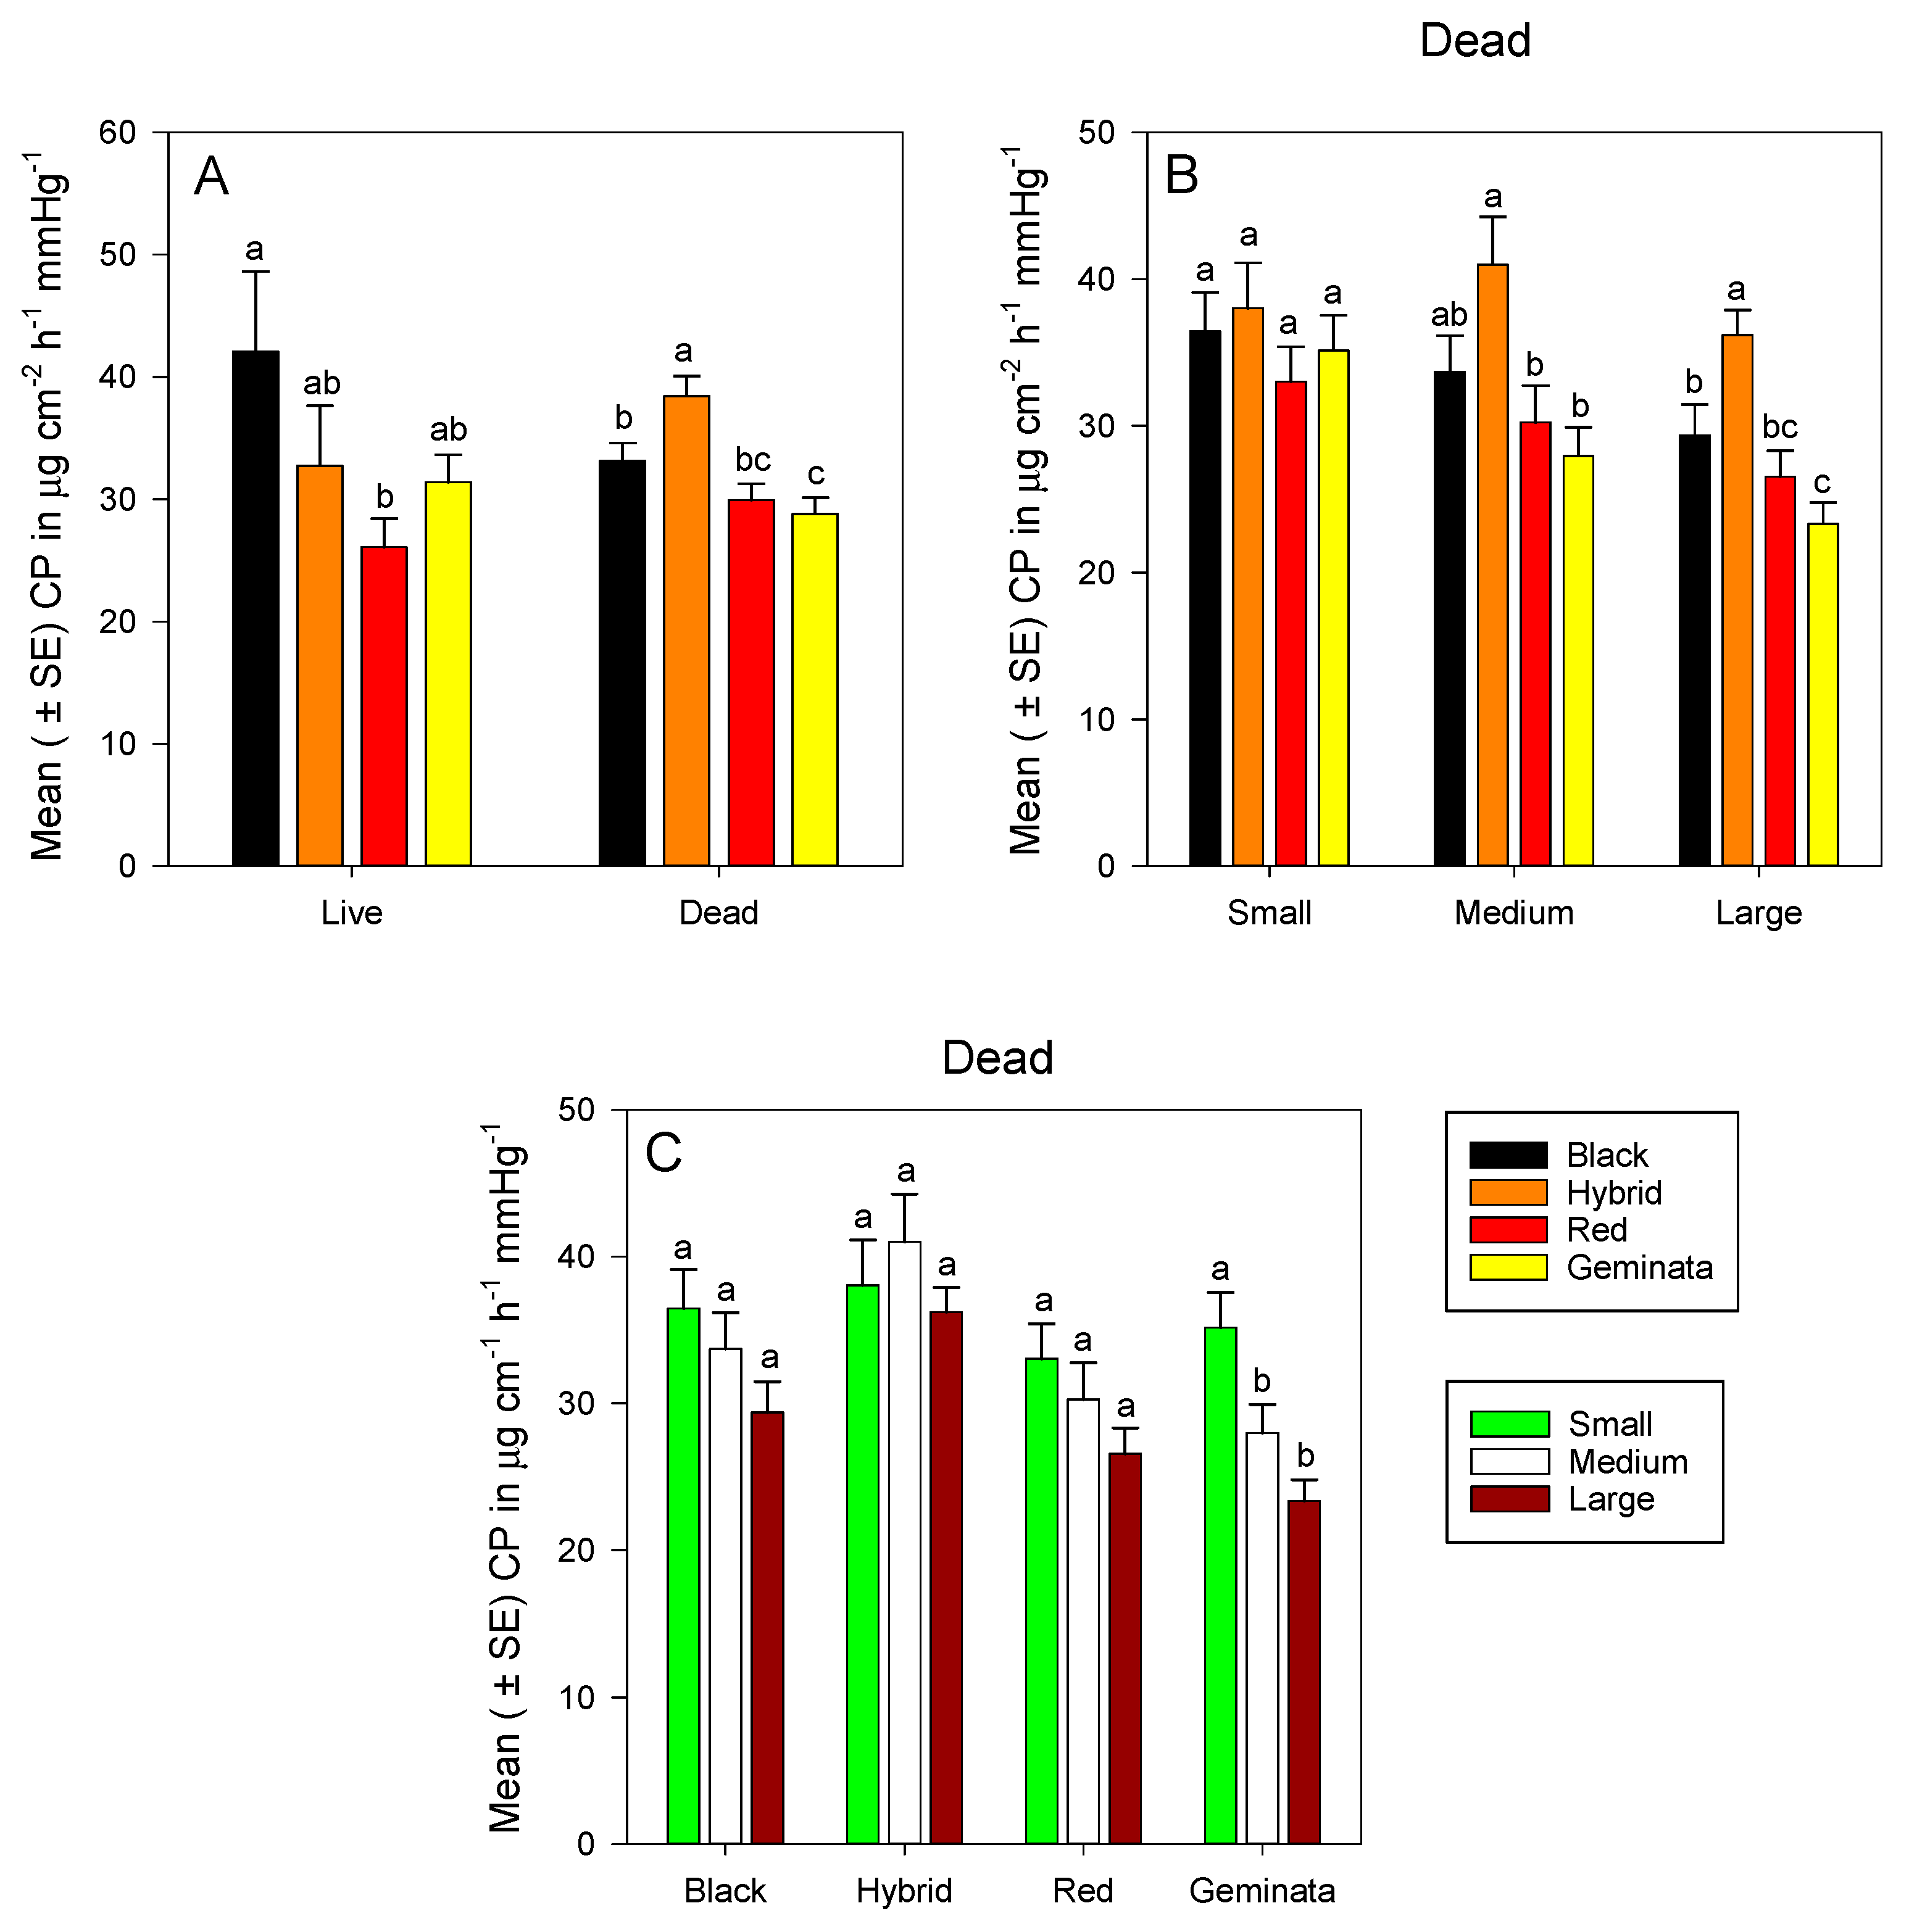
3.2. Cuticular Permeability

Combining sizes, cuticular permeability of dead ants was significantly greater in S. richteri and S. invicta × S. richteri workers than in S. geminata workers (p < 0.05) (Figure 3A). Cuticular permeability was about 1.3-fold greater in temperate S. invicta × S. richteri than in subtropical S. geminata workers; and about 1.2-fold greater in temperate S. richteri than in subtropical S. geminata workers (Figure 3A). Cuticular permeability values of S. richteri and S. geminata were not significantly different from that of S. invicta (Figure S4A). Among temperate ants, cuticular permeability was significantly greater in S. invicta × S. richteri than S. richteri (Figure 3A). Calculated cuticular permeability of live S. richteri ants was significantly greater than that of S. invicta (Figure 3A).
There was no significant difference in cuticular permeability among small workers of the four Solenopsis species (Figure 3B). Medium S. invicta × S. richteri workers had significantly greater cuticular permeability than tropical/subtropical S. invicta and S. geminata workers, whereas tropical/subtropical S. invicta and S. geminata worker ants had similar cuticular permeability values (Figure 3B). Large temperate S. richteri and S. invicta × S. richteri workers had significantly greater cuticular permeability than tropical S. geminata (Figure S4B). Large temperate S. invicta × S. richteri workers had significantly greater cuticular permeability than tropical/subtropical S. invicta and S. geminata workers (Figure 3B). There were no significant differences in cuticular permeability among sizes for S. invicta, S. richteri, and S. invicta × S. richteri (Figure 3C). However, small workers had significantly greater cuticular permeability than both medium and large workers in S. geminata (Figure 3C).

3.3. Desiccation Tolerance

The LT50 values (h) for all live size classes of S. richteri, S. invicta × S. richteri, S. invicta, and S. geminata worker fire ants are shown in Table 3. All probit analyses were significant (p < 0.05) and the LT50 values ranged from 1.5 h for small S. geminata workers to 8.5 h for large S. invicta workers. The LT50 values increased with increasing ant size. Desiccation tolerance estimated as the percentage of total body water (%TBW) lost at the LT50 time is shown in Table 4. Median %TBW lost at death ranged from 35.7% for small S. geminata to 49.8% for large S. invicta. There were no significant differences in %TBW lost at death, based on overlap of the 95% confidence intervals, among the size classes of any of the Solenopsis spp. The mean %TBW lost, at the LT50 time, ranged from 42.5% for S. geminata to 45.8% for S. invicta.

4. Discussion

The data support our hypothesis that tropical/subtropical fire ants (S. invicta and S. geminata) have lower cuticular permeability values than temperate fire ants (S. richteri and S. invicta × S. richteri). However, the data do not support the general hypothesis that tropical/subtropical fire ants can tolerate greater levels of desiccation (i.e., greater % total body water lost). Comparing cuticular permeability values among dead ants (i.e., absolute permeability), tropical S. invicta and S. geminata had significantly lower cuticular permeability values than that of temperate S. invicta × S. richteri. In addition, cuticular permeability values of dead S. geminata were significantly lower than those of S. richteri and S. invicta × S. richteri. Cuticular permeability values obtained for dead S. invicta were similar to those reported by Appel et al. [12]. Our data also suggest that large live S. invicta are significantly less vulnerable to desiccation stress than large live S. richteri. All these results partially explain the predominant location of each of these species, as S. invicta are found in lower latitudes and tropical/subtropical regions, whereas S. richteri are found in higher latitudes and more temperate regions in their native South America. In addition, the climate in their current distribution in the southeast USA is similar to that of their native distribution. This suggests that cuticular permeability and desiccation tolerance play a role in the distribution and adaptation of invasive ants. Considering the ranges of cuticular permeability values that we obtained, neither of the tropical/subtropical S. invicta nor S. geminata workers fell within the range for temperate S. invicta × S. richteri workers. This suggests that differences in habitat preference could exist among these species.
The body water content of 67.56 ± 0.90% for combined sizes of S. invicta in our data is similar to the 68.1% reported by Elzen [67] and the 63% by Appel et al. [12]. The body water contents of S. invicta and S. richteri have been reported to be significantly different [45]. However, our data show no body water content difference for combined sizes of workers of both the tropical/subtropical species (S. invicta and S. geminata) as compared with the temperate species (S. richteri and S. invicta × S. richteri). The higher number of replicates in the study by Chen et al. [45] could have contributed to the detection of significant differences in their study. The body water content values recorded for all four Solenopsis spp. in the current study are similar to those reported for workers of other ant species, including the desert ant Pogonomyrmex rugosus (Emery) (65.9%), P. occidentalis (Cresson) (63.4%), and Messor pergandei (Mayr) (64.7%) (see references in [14] (Table 2.1)). It is possible that temperate and tropical/subtropical fire ants are similar in body water content. However, a comparison based on the present data could be insufficient.
Large workers had significantly lower percent total body water (%TBW) lost values than small workers in all tested species. This is similar to results by Appel et al. [12], where S. invicta small workers contained significantly more body water (p < 0.05) than large workers. Additionally, the values of %TBW in small S. invicta workers, in our study (72.69 ± 1.65), was close to that by Appel et al. [12] (65.02 ± 1.30). The %TBW values in large S. invicta workers, in our study (63.93 ± 1.03), was also similar to that by Appel et al. [12] (61.07 ± 0.49). In the present study, %TBW was approximately 1.14-fold lower in large than in small S. invicta workers; 1.13-fold lower in large than in small S. geminata workers; 1.11-fold lower in large than in small S. invicta × S. richteri workers; and 1.08-fold lower in large than in small S. richteri workers. Combining stages, the %TBW was not significantly different among workers of the four species. Similarly, there was no significant difference in %TBW between S. invicta and S. richteri female alates but it was significantly lower in workers of S. invicta than in S. richteri [45]. The higher average %TBW for small workers could be due to the behavior of this stage in the colony. Small workers are more likely to care for broods than are other castes [58]. Brood care in ants requires the availability of liquid food for trophalaxis, therefore, samples of small workers could contain individuals with full and empty crops. In addition, small workers that forage are more likely to forage for liquid food [12,32].
Cuticular permeability values of dead ants give absolute comparisons to other arthropods. The cuticular permeability values obtained, in the current study, for S. invicta workers were small (33.03 µg cm−2 h−1 mmHg−1), medium (30.26 µg cm−2 h−1 mmHg1), and large (26.54 µg cm−2 h−1 mmHg−1). These values are similar to those reported for other arthropods from more or less tropical habitats, such as Hadrurus hirsutus (Wood); Scorpiones = 25 µg cm−2 h−1 mmHg−1, Locusta migratoria (L.); Orthoptera = 22 µg cm−2 h−1 mmHg−1 and Hemilepistus reaumuri (Milne-Edwards); and Isopods = 23 µg cm−2 h−1 mmHg−1. Cuticular permeability values for S. geminata workers (small = 35.14, medium = 27.97, and large = 23.34 µg cm−2 h−1 mmHg−1) are also similar to those measured in arthropods of more or less tropical habitats, such as Venezillo arizonicus (Mulaik and Mulaik); Isopods = 32 µg cm−2 h−1 mmHg−1. Cuticular permeability values for S. richteri workers (small = 36.46, medium = 33.70, and large = 29.37 µg cm−2 h−1 mmHg−1) are similar to those measured in arthropods of temperate habitats, such as Lycosa amentata (Clerck); Araneae = 28.3 µg cm−2 h−1 mmHg−1. Similarly, cuticular permeability values for S. invicta × S. richteri workers (small = 38.03, medium = 40.99, and large = 36.20 µg cm−2 h−1 mmHg−1) are similar to those measured in insects of temperate habitats, such as Chortoicetes terminifera (Walker); Orthoptera = 41 µg cm−2 h−1 mmHg−1 (see references in [15] (Table 6)). It should be noted that the designation of arthropods mentioned above based on their cuticular permeability values alone are meant to be more of a guide than an absolute designation. Although there is an overlap in the range in cuticular permeability values of small workers between tropical (S. invicta and S. geminata) and temperate (S. richteri and S. invicta × S. richteri) species in our study, there are no overlaps in medium and large workers of these categories of species. Workers of all sizes engage in foraging. Small workers with head widths around 0.7 mm often tend broods, scout, and recruit large workers to forage food [37,68,69]. Furthermore, these data suggest that cuticular permeability of tropical/subtropical fire ants, in our study, exhibit a degree of adaptation to more or less tropical environments, whereas the cuticular permeability of temperate fire ants is more similar to arthropods adapted to temperate environments [40].
Cuticular permeability values of dead workers (averaging across the three size classes) of the four species ranked as follows: S. invicta × S. richteri > S. richteri > S. invicta > S. geminata. Similarly, the cuticular permeability values of dead large workers ranked as follows: S. invicta × S. richteri > S. richteri > S. invicta > S. geminata. This is similar to the ranking of initial mass of large workers. Cuticular permeability and initial mass tended to follow a similar trend in large workers of all species in our results. Thus, given the cuticular permeability of these Solenopsis species, a relatively larger rather than small body size could better tolerate water loss if water loss becomes a limiting factor when foraging. This result is similar to that of foraging harvester ants, Pogonomyrmex rugosus (Emery) [70]. Meeh’s formula was used to estimate surface area in our study to calculate cuticular permeability because body size affects water loss (surface area to volume ratio). Linear regressions of cuticular permeability on body mass were performed to determine if Meeh’s formula had adequately compensated for the relationship between mass and surface area. The majority (>90%) of these regressions were not significant, indicating that Meeh’s formula provided a reasonable estimate for surface area.
In the present study, there was no significant difference between the absolute cuticular permeability values of small and large workers among the four Solenopsis species (except in S. geminata). However, a significant difference was detected between the cuticular permeability values of small and medium workers of S. invicta when more replicates were used by Appel et al. [12]. We speculate that significantly different results could have been detected in our study if more replicates were used, and if this were the case, the lower cuticular permeability of large workers could be related to the foraging behavior of this stage in the colony.
An adjusted mass loss was used as a way to compare water loss from live and dead ants without making assumptions about the source of that water loss which could be through respiration, secretions, and feces, in addition to the cuticle. If adjusted mass loss were greater for live as compared with dead insects, and if cuticular permeability was the opposite, then differences would be due to respiratory, fecal, or secretory water loss. However, if adjusted mass loss was similar for live and dead insects, then it could be argued that these other routes of water loss would be insignificant as compared with cuticular water loss. Combining worker sizes, adjusted mass loss was similar between live and dead ants (Figure 2A). Mean values were slightly greater in dead S. invicta × S. richteri and S. invicta. Thus, we speculate that these species could have more active cuticular water “pumps” [24,25].
Our study also attempted to relate the desiccation tolerance of four species of Solenopsis fire ants with their geographic distributions. The ranking of the LT50 values of large workers in our results was S. invicta > S. geminata > S. invicta × S. richteri > S. richteri (Table 3). Large S. invicta workers had LT50 values approximately 2.3 times greater than those of large S. richteri. Large workers take part in foraging [58], thus our LT50 data suggests similarity in ranking of desiccation tolerance among these four species. This indicates that S. invicta large workers are more desiccation tolerant than S. geminata, S. invicta × S. richteri, and S. richteri large workers. Our data suggest that foraging large S. invicta workers could tolerate exposure to desiccating conditions significantly longer than large S. richteri workers. Thus, S. invicta is expected to be able to forage in areas of high insolation longer than the other three species, perhaps contributing to their relative distributions [71]. Temperate fire ants (S. invicta × S. richteri and S. richteri) have a lower LT50 than tropical and subtropical fire ants (S. invicta and S. geminata); this suggests that the ants could have more difficulty than tropical/subtropical fire ants surviving drier environmental conditions than those of their present range. In general, live large fire ants desiccate at a slower rate than live small fire ants. For instance, the increases in LT50 values for large workers as compared with small workers were 5.23, 3.42, 2.58, and 1.65 times, in S. geminata, S. invicta, S. invicta × S. richteri, and S. richteri, respectively. The desiccation rates between small and large fire ants in our results are similar to those reported by Munroe et al. [50]. These results supported the suggestion by Edney [15] that, in moisture-deficient situations, the amount of water loss in terms of total body water initially present was greater in small animals than large animals. The ranking of the LT50 values of large workers, in our results, was opposite to that of mass loss among the four live species, S. richteri > S. invicta × S. richteri > S. geminata > S. invicta. Our results suggest that the reason large workers are able to carry a greater proportion of foraging responsibilities is that they are desiccation resistant and tolerant [50,72].
The composition of epicuticular lipids enable tropical S. invicta to better cope with desiccation than temperate S. richteri [45,48]. Our data showed that S. invicta can tolerate desiccation more than S. invicta × S. richteri and S. richteri. This agrees with the findings of Xu et al. [48] in that the highest melting points of samples of cuticular hydrocarbons (CHCs) from S. invicta and S. invicta × S. richteri were significantly higher than that from S. richteri. Cuticular hydrocarbon profiles of S. richteri are characterized by significant amounts of short-chain (C23–C27) saturated and unsaturated hydrocarbons. In contrast, profiles of S. invicta consist primarily of long-chain (C27–C29) saturated hydrocarbons; unsaturated alkenes are completely lacking. The hybrid S. invicta × S. richteri shows intermediate profiles of the two parent species [48]. Long-chain saturated waxy hydrocarbons are better at water proofing and have higher melting points than shorter chain unsaturated chains.
Although S. invicta and S. geminata inhabit incredibly humid locales such as the Gulf Coast states in the USA, the task of foraging carried out by workers of these species could expose them to highly desiccating conditions, in contrast to the relatively cooler and more humid conditions in which temperate fire ant species abundantly inhabit. Tropical/subtropical fire ants can also benefit from the relatively cool and humid conditions in the deep parts of ant nests, where cuticular water loss is likely to be minimal [70]. As a result of these adaptations, we infer that the water loss rate and desiccation tolerance could be part of a complex of physiological and behavioral factors behind the distribution of these terrestrial insects [70]. Queen ants of different species vary in their desiccation tolerance [73], and if this were the case among Solenopsis species as well, then we would expect queens of tropical S. invicta to be more desiccation tolerant than the queens of temperate S. richteri. Thus, this difference would play a role in colony establishment and limiting distribution among these species. Nevertheless, water vapor pressure deficits are likely to be low for claustral colony founder queens that are found deep in the nests [70].
Large workers engage in foraging in fire ant colonies [58]. Thus, they are exposed to potentially desiccating conditions. It is possible that there are qualitative and quantitative differences in the cuticular hydrocarbon profiles of small and large workers of these four Solenopsis species, as was found in S. saevissima [74]. Foraging in ants tends to require the capacity to tolerate desiccating conditions [71], thus, samples of large workers can include individuals with low cuticular permeability, enabling them to tolerate desiccating conditions better than non-frequent foragers such as the small workers. If this were the case, then it would be expected that more resources would be invested in making the waxes on large workers that are more frequent foragers than small workers that engage more often in brood care within the nest [58]. We speculate that small workers possess greasier cuticular hydrocarbons while large workers have waxier cuticular hydrocarbons. Future studies should investigate if small workers have enough wax to not dry out immediately, and enough grease to readily sense pheromones among other semiochemicals. Thus, this could indicate if there exists a tradeoff between waterproofing wax and grease that allows better chemoreception.

5. Conclusions

In conclusion, this study illustrates differences in body mass, %TBW, cuticular permeability, and desiccation tolerance of S. invicta, S. richteri, S. invicta × S. richteri, and S. geminata, which are important pests in the southeastern U.S. There are differences in the water relations of species adapted to temperate as compared with tropical latitudes. Temperate S. invicta × S. richteri had significantly greater cuticular permeability than the tropical S. invicta and S. geminata. Live temperate S. richteri lost significantly more %TBW than tropical S. invicta. These results provide insights into differences in the water relations of these four Solenopsis species and help to explain the relative distribution of these species in the southeastern USA. The capability of these four Solenopsis species to survive, limit cuticular water loss, and tolerate desiccation influences their distribution both in their native South America and in their introduced North American range. Extremes of hot and cold temperature and low relative humidity limit the range of S. invicta and S. richteri [7,40,50,75,76,77]. However, during global warming, the ranges of S. invicta and S. richteri are predicted to increase to the north of their present range [40], and S. invicta to the west and east of its present range [7,50]. There is evidence in the literature that fire ants engage in several behaviors in response to stressful abiotic conditions. These include burying food resources for foraging during hotter parts of the day, foraging at night when it is cool, and creating extensive underground tunnels. Further studies including physiological and genetic analyses of desiccation tolerance in Solenopsis spp. are needed to determine what physiological and genetic attributes enable the tropical S. invicta to tolerate desiccation better than the temperate S. richteri.

Supplementary Materials

The following are available online at https://0-www-mdpi-com.brum.beds.ac.uk/2075-4450/11/7/418/s1, Figure S1: Mean (± SE) percentage of total body water (%TBW) for: (A) Live small, medium, and large fire ant worker size-classes compared within each Solenopsis richteri (Black), S. invicta × S. richteri (Hybrid), S. invicta (Red), and S. geminata (Geminata) fire ant species; and (B) Dead small, medium, and large fire ant worker size-classes compared within each Solenopsis species. Means with the same letter within each worker size-class or species are not significantly different (P < 0.05). N = 14 or 15 individuals per worker size-class per species title, Figure S2: Mean (± SE) adjusted mass loss for: (A) Dead small, medium, and large fire ant worker size-classes compared within each Solenopsis richteri (Black), S. invicta × S. richteri (Hybrid), S. invicta (Red), and S. geminata (Geminata) fire ant species; and (B) Live small, medium, and large fire ant worker size-classes compared within each Solenopsis species. Means with the same letter within each worker size-class or species are not significantly different (P < 0.05). N = 14 or 15 individuals per worker size-class per species, Figure S3: Percentage of initial mass loss over time for live small, medium, and large workers of: (A) S. richteri (Black); (B) S. invicta × S. richteri (Hybrid); (C) S. invicta (Red); and (D) S. geminata (Geminata). N = 14 or 15 individuals per worker size-class per species, Figure S4: Percentage of total body water (%TBW) lost over time for live small, medium, and large workers of: (A) S. richteri (Black); (B) S. invicta × S. richteri (Hybrid); (C) S. invicta (Red); and (D) S. geminata (Geminata). N = 14 or 15 individuals per worker size-class per species, Figure S5: Percentage of initial mass loss over time for dead small, medium, and large workers of: (A) S. richteri (Black); (B) S. invicta × S. richteri (Hybrid); (C) S. invicta (Red); and (D) S. geminata (Geminata). N = 14 or 15 individuals per worker size-class per species, Figure S6: Percentage of total body water (%TBW) lost over time for dead small, medium, and large workers of: (A) S. richteri (Black); (B) S. invicta × S. richteri (Hybrid); (C) S. invicta (Red); and (D) S. geminata (Geminata). N = 14 or 15 individuals per worker size-class per species, Table S1: Relationship between desiccation time (h) at 30 °C and 0-2%RH and % initial mass loss by live small, medium, and large workers of S. richteri, S. invicta × S. richteri, S. invicta, S. geminata ants (mean ± SE). The significance level is 0.05 (Tukey HSD tests), Table S2: Relationship between desiccation time (h) at 30 °C and 0-2%RH and %TBW lost by live small, medium, and large workers of S. richteri, S. invicta × S. richteri, S. invicta, S. geminata ants (mean ± SE). The significance level is 0.05 (Tukey HSD tests), Table S3: Relationship between desiccation time (h) at 30 °C and 0-2%RH and % initial mass loss by dead small, medium, and large workers of S. richteri, S. invicta × S. richteri, S. invicta, S. geminata ants (mean ± SE). The significance level is 0.05 (Tukey HSD tests), Table S4: Relationship between desiccation time (h) at 30 °C and 0-2%RH and %TBW loss by dead small, medium, and large workers of S. richteri, S. invicta × S. richteri, S. invicta, S. geminata ants (mean ± SE). The significance level is 0.05 (Tukey HSD tests).

Author Contributions

Conceptualization, O.S.A., A.G.A., L.C., and H.Y.F.; methodology, A.G.A. and O.S.A.; software, A.G.A. and O.S.A.; validation, O.S.A., A.G.A., L.C., and H.Y.F.; formal analysis, A.G.A. and O.S.A.; investigation, O.S.A.; resources, A.G.A. and H.Y.F.; data curation, O.S.A. and A.G.A.; writing—original draft preparation, O.S.A.; writing—review and editing, O.S.A., A.G.A., L.C., and H.Y.F.; visualization, O.S.A. and A.G.A.; supervision, A.G.A., L.C., and H.Y.F.; project administration, O.S.A., A.G.A., and L.C.; funding acquisition, H.Y.F. All authors have read and agreed to the published version of the manuscript.

Funding

This research was funded by the National Institute of Food and Agriculture, United States Department of Agriculture, Hatch Program and Alabama Agricultural Experiment Station to H.Y.F.

Acknowledgments

We thank Marla J. Eva (Department of Entomology and Plant Pathology, Auburn University) for technical support, and Ana Chicas-Mosier for manuscript review.

Conflicts of Interest

The authors declare no conflict of interest.

References

  1. Rogers, D.J.; Robinson, T.P. Tsetse Distribution. In The Trypanosomiases; Maudlin, I., Holmes, P.H., Miles, M.A., Eds.; CABI Publishing: Wallingford, England, 2004; pp. 139–180. [Google Scholar]
  2. Deutsch, C.A.; Tewksbury, J.J.; Huey, R.B.; Sheldon, K.S.; Ghalambor, C.K.; Haak, D.C.; Martin, P.R. Impacts of climate warming on terrestrial ectotherms across latitude. Proc. Natl. Acad. Sci. USA 2008, 105, 6668–6672. [Google Scholar] [CrossRef] [PubMed] [Green Version]
  3. Sunday, J.M.; Bates, A.E.; Kearney, M.R.; Colwell, R.K.; Dulyy, N.K.; Longino, J.T.; Huey, R.B. Thermal-safety margins and the necessity of thermoregulatory behavior across latitude and elevation. Proc. Natl. Acad. Sci. USA 2014, 111, 5610–5615. [Google Scholar] [CrossRef] [PubMed] [Green Version]
  4. Danks, H.V. Dehydration in dormant insects. J. Insect Physiol. 2000, 46, 837–852. [Google Scholar] [CrossRef]
  5. Chown, S.L.; Nicolson, S.W. Insect Physiological Ecology: Mechanisms and Patterns; Oxford University Press: Oxford, UK, 2004. [Google Scholar]
  6. Kleynhans, E.; Terblanche, J.S. Complex interactions between temperature and relative humidity on water balance of adult tsetse (Glossinidae: Diptera): Implications for climate change. Front. Physiol. 2011, 2, 1–10. [Google Scholar] [CrossRef] [Green Version]
  7. Morrison, L.W.; Korzukhin, M.D.; Porter, S.D. Predicted range expansion of the invasive fire ant, Solenopsis invicta, in the eastern United States based on the VEMAP global warming scenario. Divers. Distrib. 2005, 11, 199–204. [Google Scholar] [CrossRef]
  8. Weldon, C.W.; Boardman, L.; Marlin, D.; Terblanche, J.S. Physiological mechanisms of dehydration tolerance contribute to the invasion potential of Ceratitis capitata (Wiedemann) (Diptera: Tephritidae) relative to its less widely distributed congeners. Front. Zool. 2016, 13, 1–15. [Google Scholar] [CrossRef] [PubMed] [Green Version]
  9. Alpert, P. The limits and frontiers of desiccation-tolerant life. Integr. Comp. Biol. 2005, 45, 685–695. [Google Scholar] [CrossRef] [Green Version]
  10. Alpert, P. The discovery, scope, and puzzle of desiccation tolerance in plants. Plant Ecol. 2000, 151, 5–17. [Google Scholar] [CrossRef]
  11. Alpert, P.; Oliver, M.J. Drying without dying. In Desiccation and Survival in Plants: Drying without Dying; Black, M., Prichard, H.W., Eds.; CAB International: Wallingford, UK, 2002; pp. 3–43. [Google Scholar]
  12. Appel, A.G.; Miller, M.K.; Mack, T.P. Cutaneous water loss of several stages of the red imported fire ant, Solenopsis invicta (Buren). Comp. Biochem. Physiol 1991, 98, 281–283. [Google Scholar] [CrossRef]
  13. Beament, J.W.L. The water relations of insect cuticle. Biol. Rev. 1961, 36, 281–320. [Google Scholar] [CrossRef]
  14. Hadley, N.F. Water Relations of Terrestrial Arthropods; Academic: San Diego, CA, USA, 1994. [Google Scholar]
  15. Edney, E.B. Water Balance in Land Arthropods; Springer: New York, NY, USA, 1977. [Google Scholar]
  16. Mazer, C.L.; Appel, A.G. Water loss and desiccation tolerances of longwing butterflies (Lepidoptera: Nymphalidae). Environ. Entomol. 2001, 30, 631–636. [Google Scholar] [CrossRef]
  17. Manabe, S.; Stouffer, R.J.; Spelman, M.J.; Bryan, K. Transient response of a coupled ocean-atmosphere-land surface model to increasing atmospheric carbon dioxide. J. Clim. 1991, 4, 785–818. [Google Scholar] [CrossRef]
  18. Fields, P.A.; Graham, J.B.; Rosenblatt, R.H.; Somero, G.N. Effects of expected global climate change on marine faunas. Trends Ecol. Evol. 1993, 8, 361–366. [Google Scholar] [CrossRef]
  19. Peng, G.; Leslie, L.M.; Shao, Y. Environmental Modeling and Prediction; Springer: Berlin, Germany, 2002. [Google Scholar]
  20. Viboud, C.; Pakdaman, K.; Boëlle, P.Y.; Wilson, M.L.; Myers, M.F.; Valleron, A.J.; Flahault, A. Association of influenza epidemics with global climate variability. Eur. J. Epidemiol. 2004, 19, 1055–1059. [Google Scholar] [CrossRef] [PubMed] [Green Version]
  21. Tang, J.W.; Lai, F.Y.L.; Nymadawa, P.; Deng, Y.; Ratnamohan, M.; Petric, M.; Loh, T.P.; Tee, N.W.S.; Dwyer, D.E.; Barr, I.G.; et al. Comparison of the incidence of influenza in relation to climate factors during 2000-2007 in five countries. J. Med. Virol. 2010, 82, 1958–1965. [Google Scholar] [CrossRef]
  22. Cunze, S.; Heydel, F.; Tackenberg, O. Are plant species able to keep pace with the rapidly changing climate? PLoS ONE 2013, 8, 1–7. [Google Scholar] [CrossRef]
  23. Jagadish, S.V.K.; Septiningsih, E.M.; Kohli, A.; Thomson, M.J.; Ye, C.; Redoña, E.; Kumar, A.; Gregorio, G.B.; Wassmann, R.; Ismail, A.M.; et al. Genetic advances in adapting rice to a rapidly changing climate. J. Agron. Crop Sci. 2012, 198, 360–373. [Google Scholar] [CrossRef]
  24. Winston, P.W. Cuticular water pump in insects. Nature 1967, 214, 383–384. [Google Scholar] [CrossRef]
  25. Winston, P.W.; Beament, J.W.L. An active reduction of water level in insect cuticle. J. Exp. Biol. 1969, 50, 541–546. [Google Scholar] [PubMed]
  26. Berridge, M.J. Osmoregulation in terrestrial arthropods. In Chemical Zoology; Florkin, M., Scheer, B.T., Eds.; Academic Press: London, UK; New York, NY, USA, 1970; Volume 5, pp. 287–319. [Google Scholar]
  27. Human, K.G.; Weiss, S.; Weiss, A.; Sandler, B.; Gordon, D.M. Effects of abiotic factors on the distribution and activity of the invasive Argentine ant (Hymenoptera: Formicidae). Pop. Ecol. 1998, 27, 822–833. [Google Scholar] [CrossRef]
  28. Lofgren, C.S.; Banks, W.A.; Glancey, B.M. Biology and control of imported fire ants. Annu. Rev. Entomol. 1975, 20, 1–30. [Google Scholar] [CrossRef] [PubMed]
  29. Patterson, R.S. Biological Control of Introduced Ant Species, Exotic Ants: Biology, Impact, and Control of Introduced Species; Williams, D.F., Ed.; Westview Press: Boulder, CO, USA, 1994; pp. 293–307. [Google Scholar]
  30. Vinson, S.B. Invasion of the red imported fire ant (Hymenoptera: Formicidae): Spread biology, and impact. Am. Entomol. 1997, 43, 23–39. [Google Scholar] [CrossRef]
  31. Cohen, P.; Privman, E. Speciation and hybridization in invasive fire ants. BMC Evol. Biol. 2019, 19, 111. [Google Scholar] [CrossRef] [PubMed]
  32. Mirenda, J.T.; Vinson, S.B. Division of labour and specification of castes in the red imported fire ant Solenopsis invicta Buren. Anim. Behav. 1981, 29, 410–420. [Google Scholar] [CrossRef]
  33. Diffie, S.; Vander Meer, R.K.; Bass, M.H. Discovery of hybrid fire ant populations in Georgia and Alabama. J. Entomol. Sci. 1988, 23, 187–191. [Google Scholar] [CrossRef]
  34. Vander Meer, R.K.; Lofgren, C.S.; Alvarez, F.M. Biochemical evidence for hybridization in fire ants. Fla. Entomol. 1985, 68, 501–506. [Google Scholar] [CrossRef] [Green Version]
  35. Taber, S.W. Fire Ants; Texas A&M University Press: College Station, TX, USA, 2000; 308p. [Google Scholar]
  36. Buren, W.F.; Allen, G.E.; Whitcomb, W.H.; Lennartz, F.E.; Williams, R.N. Zoogeography of the imported fire ants. J. N. Y. Entomol. Soc. 1974, 82, 113–124. [Google Scholar]
  37. Tschinkel, W.R. The Fire Ants; Harvard University Press: Cambridge, MA, USA, 2006. [Google Scholar]
  38. Buren, W.F. Revisionary studies on the taxonomy of the imported fire ants. J. Ga. Entomol. Soc. 1972, 7, 1–27. [Google Scholar]
  39. Korzukhin, M.D.; Porter, S.D.; Thompson, L.C.; Wiley, S. Modeling temperature-dependent range limits for the fire ant, Solenopsis invicta (Hymenoptera: Formicidae) in the United States. Environ. Entomol. 2001, 30, 645–655. [Google Scholar] [CrossRef] [Green Version]
  40. Morrison, L.W.; Porter, S.D.; Daniels, E.; Korzukhin, M.D. Potential global range expansion of the invasive fire ant, Solenopsis invicta. Biol. Invasions 2004, 6, 183–191. [Google Scholar] [CrossRef]
  41. Callcott, A.M.A.; Collins, H.L. Invasion and range expansion of imported fire ants (Hymenoptera: Formicidae) in North America from 1918-1995. Fla. Entomol. 1996, 79, 240–251. [Google Scholar] [CrossRef]
  42. Davis, L.R.; Vander Meer, R.K.; Porter, S.D. Red imported fire ants expand their range across the West Indies. Fla. Entomol. 2001, 84, 735–736. [Google Scholar] [CrossRef]
  43. Mescher, M.C.; Ross, K.G.; Shoemaker, D.D.; Keller, L.; Krieger, M.J.B. Distribution of the two social forms of the fire ant Solenopsis invicta (Hymenoptera: Formicidae) in the native South American range. Ecol. Popul. Biol. 2003, 96, 810–817. [Google Scholar] [CrossRef] [Green Version]
  44. Ascunce, M.; Yang, C.C.; Oakey, J.; Calcaterra, L.; Wu, W.J.; Shih, C.J.; Goudet, J.; Ross, K.; Shoemaker, D. Global invasion history of the fire ant Solenopsis invicta. Science 2011, 331, 1066–1068. [Google Scholar] [CrossRef] [PubMed]
  45. Chen, J.; Rashid, T.; Feng, G. A comparative study between Solenopsis invicta and Solenopsis richteri on tolerance to heat and desiccation stresses. PLoS ONE 2014, 9, 1–6. [Google Scholar] [CrossRef] [PubMed]
  46. Schilman, P.E.; Lighton, J.B.; Holway, D.A. Water balance in the Argentine ant (Linepithema humile) compared with five common native ant species from Southern California. Physiol. Entomol. 2007, 32, 1–7. [Google Scholar] [CrossRef]
  47. Li, J.; Heinz, K.M. Genetic variation in desiccation resistance and adaptability of the red imported fire ant (Hymenoptera: Formicidae) to arid regions. Ann. Entomol. Soc. Am. 1998, 91, 726–729. [Google Scholar] [CrossRef]
  48. Xu, M.; Lu, Z.; Lu, Y.; Balusu, R.R.; Ajayi, O.S.; Fadamiro, H.Y.; Appel, A.G.; Chen, L. Cuticular hydrocarbon chemistry, an important factor shaping the current distribution pattern of the imported fire ants in the USA. J. Insect Physiol. 2018, 110, 34–43. [Google Scholar] [CrossRef] [PubMed]
  49. Braulick, L.S.; Cokendolpher, J.C.; Morrison, W.P. Effect of acute exposure to relative humidity and temperature on four species of fire ants (Solenopsis: Formicidae: Hymenoptera). Tex. J. Sci. 1988, 40, 331–340. [Google Scholar]
  50. Munroe, P.D.; Thorvilson, H.G.; Phillips, S.A., Jr. Comparison of desiccation rates among three species of fire ants. Southwest. Entomol. 1996, 21, 173–179. [Google Scholar]
  51. Wendt, C.F.; Verble-Pearson, R. Critical thermal maxima and body size positively correlate in red imported fire ants, Solenopsis invicta. Southwest. Nat. 2016, 61, 79–83. [Google Scholar] [CrossRef]
  52. Phillips, S.A., Jr.; Jusino-Atresino, R.; Thorvilson, H.G. Desiccation resistance in populations of the red imported fire ant (Hymenoptera: Formicidae). Environ. Entomol. 1996, 25, 460–464. [Google Scholar] [CrossRef]
  53. Martin, J.B.; Vinson, S.B. The influence of travel distance on sugar loading decisions and water balance in the central place foraging ant Solenopsis invicta. Insectes Soc. 2008, 55, 129–136. [Google Scholar] [CrossRef]
  54. Vogt, J.T.; Streett, R.M.; Pereira, D.A.; Callcott, A.M.A. Mississippi areawide fire ant suppression program: Unique aspects of working with black and hybrid imported fire ants. J. Agric. Urban Entomol. 2003, 20, 105–111. [Google Scholar]
  55. Ross, K.G.; Vander Meer, R.K.; Fletcher, D.J.C.; Vargo, E.L. Biochemical phenotypic and genetic studies of two introduced fire ants and their hybrid (Hymenoptera: Formicidae). Evolution 1987, 41, 280–293. [Google Scholar] [CrossRef]
  56. Chen, L.; Hu, Q.-B.; Fadamiro, H.Y. Reduction of venom alkaloids in Solenopsis richteri × Solenopsis invicta hybrid: An attempt to identify new alkaloidal components. J. Agric. Food. Chem. 2010, 58, 11534–11542. [Google Scholar] [CrossRef] [PubMed]
  57. Hu, L.; Balusu, R.R.; Zhang, W.-Q.; Ajayi, O.S.; Lu, Y.-Y.; Zeng, R.-S.; Fadamiro, H.Y.; Chen, L. Intra- and inter-specific variation in alarm pheromone produced by Solenopsis fire ants. Bull. Entomol. Res. 2018, 108, 667–673. [Google Scholar] [CrossRef]
  58. Wilson, E.O. Division of labor in fire ants based on physical castes. J. Kans. Entomol. Soc. 1978, 51, 615–636. [Google Scholar]
  59. Hölldobler, B.; Wilson, E.O. The Ants; The Belknap Press of Harvard University Press: Cambridge, CA, USA, 1990. [Google Scholar]
  60. Appel, A.G.; Reierson, D.A.; Rust, M.K. Comparative water relations and temperature sensitivity of cockroaches. Comp. Bioch. Physiol. 1983, 74, 357–361. [Google Scholar] [CrossRef]
  61. Mack, T.P.; Appel, A.G. Water relations of immature and adult lesser cornstalk borers, Elasmopalpus lignosellus (Lepidoptera: Pyralidae). Ann. Entomol. Soc. Am. 1986, 79, 579–582. [Google Scholar] [CrossRef]
  62. Edney, E.B.; McFarlane, J.M. The effect of temperature on transpiration in the desert cockroach, Arenivaga investigata and in Periplaneta americana. Physio. Zool. 1974, 47, 1–12. [Google Scholar] [CrossRef]
  63. Haar, L.; Gallagher, J.S.; Kell, G.S. NBS/NRC Steam Tables; Hemisphere Publishing Corp.: New York, NY, USA, 1984. [Google Scholar]
  64. SAS Institute Inc. SAS/STAT 13.2 User’s Guide; SAS Institute Inc.: Cary, NC, USA, 2013. [Google Scholar]
  65. Systat Software Inc. SigmaPlot, Version 13.0; Systat Software Inc.: San Jose, CA, USA, 2014. [Google Scholar]
  66. Robertson, J.L.; Preisler, H.; Russell, R.M. PoloPlus: Probit and Logit Analysis User’s Guide; LeOra Software: Petaluma, CA, USA, 2007. [Google Scholar]
  67. Elzen, G.W. Oxygen consumption and water loss in the imported fire ant Solenopsis invicta Buren. Comp. Biochem. Physiol. 1986, 84, 13–17. [Google Scholar] [CrossRef]
  68. Wills, B.D.; Powell, S.; Rivera, M.D.; Suarez, A.V. Correlates and consequences of worker polymorphism in ants. Annu. Rev. Entomol. 2018, 63, 575–598. [Google Scholar] [CrossRef] [PubMed]
  69. Roeder, K.A.; Prather, R.M.; Paraskevopoulos, A.W.; Roeder, D.V. The economics of optimal foraging by the red imported fire ant. Environ. Entomol. 2020, 49, 304–311. [Google Scholar] [CrossRef] [PubMed]
  70. Lighton, J.R.B.; Feener, D.H., Jr. Water-loss rate and cuticular permeability in foragers of the desert ant Pogonomyrmex rugosus. Physiol. Zool. 1989, 62, 1232–1256. [Google Scholar] [CrossRef]
  71. Hood, W.G.; Tschinkel, W.R. Desiccation resistance in arboreal and terrestrial ants. Physiol. Entomol. 1990, 15, 23–35. [Google Scholar] [CrossRef]
  72. Porter, S.D.; Tschinkel, W.R. Foraging in Solenopsis invicta (Hymenoptera: Formicidae): Effects of Weather and Season. Environ. Entomol. 1987, 16, 802–808. [Google Scholar] [CrossRef]
  73. Mankowski, M.E. Biology of the Carpenter Ants Camponotus Vicinus (Mayr) and Camponotus Modoc (Wheeler) in Western Oregon; Oregon State University: Corvallis, OR, USA, 2001. [Google Scholar]
  74. Fox, E.G.P.; Pianaro, A.; Solis, D.R.; Delabie, J.H.C.; Vairo, B.C.; Machado, E.A.; Bueno, O.C. Intraspecific and Intracolonial Variation in the Profile of Venom Alkaloids and Cuticular Hydrocarbons of the Fire Ant Solenopsis saevissima Smith (Hymenoptera: Formicidae). Psyche 2012, 2012, 1–10. [Google Scholar] [CrossRef] [Green Version]
  75. Hung, A.C.F.; Vinson, S.B. Factors affecting the distribution of fire ants in Texas. Southwest. Nat. 1978, 23, 205–214. [Google Scholar] [CrossRef]
  76. Pimm, S.L.; Bartell, D.P. Statistical model for predicting range expansion of the red imported fire ant, Solenopsis invicta, in Texas. Environ. Entomol. 1980, 9, 653–658. [Google Scholar] [CrossRef]
  77. Moody, J.V.; Francke, O.F.; Merickel, F.W. The distribution of fire ants, Solenopsis (Solenopsis) in western Texas. J. Kans. Entomol. Soc. 1981, 54, 469–480. [Google Scholar]
Figure 1. Mean (± SE) percentage of total body water (%TBW) for: (A) Live S. richteri (Black), S. invicta × S. richteri (Hybrid), S. invicta (Red), and S. geminata (Geminata) fire ants compared within each worker size class; (B) Combined worker size classes of S. richteri, S. invicta × S. richteri, S. invicta, and S. geminata fire ants compared within each live/dead status; and (C) Dead S. richteri, S. invicta × S. richteri, S. invicta, and S. geminata fire ants compared within each worker size class. Means with the same letter within each worker size class or species are not significantly different (p < 0.05). n = 14 or 15 individuals per worker size class per species.
Insects 11 00418 g001
Figure 2. Mean (± SE) adjusted mass loss for: (A) Combined worker size classes of S. richteri (Black), S. invicta × S. richteri (Hybrid), S. invicta (Red), and S. geminata (Geminata) fire ants compared within each live/dead status; (B) Dead S. richteri, S. invicta × S. richteri, S. invicta, and S. geminata fire ants compared within each worker size class; and (C) Live S. richteri, S. invicta × S. richteri, S. invicta, and S. geminata fire ants compared within each worker size class. Means with the same letter within each worker size class or species are not significantly different (p < 0.05). n = 14 or 15 individuals per worker size class per species.
Insects 11 00418 g002
Figure 3. Mean (± SE) calculated cuticular permeability (CP) for: (A) Combined worker size classes of S. richteri (Black), S. invicta × S. richteri (Hybrid), S. invicta (Red), and S. geminata (Geminata) fire ants compared within each live/dead status; (B) Dead S. richteri, S. invicta × S. richteri, S. invicta, and S. geminata fire ants compared within each worker size class; and (C) Dead small, medium, and large ant worker size classes compared within each Solenopsis species.
Insects 11 00418 g003
Table 1. Collection locations of S. invicta, S. richteri, S. invicta × S. richteri, and S. geminata fire ants in the USA.
SpeciesColonyTown/City, StateLatitudeLongitude
Solenopsis geminata1Gainesville, FL 29°34’19.49” N82°27’22.89” W
2Gainesville, FL29°34’24.92” N82°27’30.49” W
3Gainesville, FL29°34’25.23” N82°27’29.59” W
S. invicta1Auburn, AL 32°37’31.47” N85°30’07.78” W
2Auburn, AL 32°34’36.73” N85°29’52.24” W
3Auburn, AL 32°36’59.58” N85°30’27.14” W
S. richteri1Waverly, TN 36°05’01.41” N87°48’31.32” W
2Hohenwald, TN 35°33’24.66” N87°31’46.43” W
3Mount Pleasant, TN 35°36’38.52” N87°15’46.40” W
S. invicta × S. richteri1Huntsville, AL 34°32’18.66” N86°30’00.27” W
2Huntsville, AL 34°34’45.70” N86°33’13.75” W
3Decatur, AL 34°31’47.41” N86°54’02.96” W
Table 2. Initial mass (mg) of small, medium, and large live and dead workers of S. invicta, S. richteri, S. invicta × S. richteri, and S. geminata ants (mean ± SE).
SpeciesSize ClassN for Live AntsInitial Mass (mg) Live AntsN for Dead AntsInitial Mass (mg) Dead Ants
S. richteriSmall150.89 ± 0.03 **A150.72 ± 0.03 cA
Medium152.94 ± 0.03 *A151.47 ± 0.09 bB
Large153.19 ± 0.12 *B153.31 ± 0.15 aB
S. invicta × S. richteriSmall151.18 ± 0.42 **A150.70 ± 0.02 cA
Medium151.71 ± 0.16 **A151.49 ± 0.11 bB
Large143.08 ± 0.27 *B143.21 ± 0.26 aB
S. invictaSmall150.59 ± 0.02 ***A150.52 ± 0.02 cB
Medium141.61 ± 0.13 **A151.41 ± 0.09 bB
Large153.23 ± 0.19 *B153.52 ± 0.14 aB
S. geminataSmall150.63 ± 0.09 ***A150.47 ± 0.02 cB
Medium152.07 ± 0.14 **A152.23 ± 0.19 bA
Large155.26 ± 0.35 *A155.63 ± 0.37 aA
Means of the three size classes within a species followed by the same lowercase letter (for dead ants) or number of asterisks (for live ants) are not significantly different (p < 0.05). Means of the four species, live or dead ants, within a size class followed by the same uppercase letter are not significantly different (p < 0.05). N = numbers of individuals.
Table 3. LT50 values (h) for live small, medium, and large workers of S. richteri, S. invicta × S. richteri, S. invicta, and S. geminata ants.
SpeciesSizeNLT50 (h)(95% CI)Slope ± SEχ2Df
S. richteriSmall152.21(1.59–2.71)6.14 ± 1.750.094
Medium153.03(2.19–3.76)4.07 ± 0.841.444
Large153.65(2.57–4.62)3.20 ± 0.672.204
S. invicta × S. richteriSmall152.08(1.36–2.58)5.65 ± 1.690.124
Medium153.63(2.87–4.34)5.02 ± 0.961.774
Large145.38(4.24–6.67)3.50 ± 0.683.764
S. invictaSmall152.49(1.44–3.29)3.21 ± 0.760.604
Medium144.50(3.61–5.35)4.81 ± 0.910.934
Large158.52(6.14–13.81)3.38 ± 0.674.294
S. geminataSmall151.45(0.27–2.22)3.06 ± 1.031.084
Medium154.15(3.28–4.99)4.44 ± 0.852.574
Large157.59(6.11–9.79)3.35 ± 0.672.664
N, numbers of individuals; CI, confidence interval.
Table 4. Percentage of total body water (%TBW) lost at median time of death; at lower and upper confidence intervals (CI) for live small, medium, and large workers of S. richteri, S. invicta × S. richteri, S. invicta, and S. geminata desiccated at 30 °C and 0–2% RH.
SpeciesSizeN%TBW Lost at LT50%TBW Lost at Lower CI%TBW Lost at Upper CIMean %TBW Lost at LT50 for All Sizes in a Species a
S. richteriSmall1548.0539.4953.5345.42
Medium1548.6939.9354.77
Large1539.5330.5646.33
S. invicta × S. richteriSmall 1542.6427.8848.2743.31
Medium1544.5738.1249.76
Large1442.7335.8249.61
S. invictaSmall 1540.9728.0748.3945.79
Medium1446.5940.2951.50
Large1549.8039.1368.17
S. geminataSmall1535.749.3546.0542.47
Medium1544.9138.4750.24
Large1546.7639.9055.63
N = numbers of individuals; a mean of the three sizes.

